")
Back to Journals » International Journal of Nephrology and Renovascular Disease » Volume 12
Report of health checkup system for chronic kidney disease in general population in Okayama city: effect of health guidance intervention on chronic kidney disease outcome
Authors Kakio Y, Uchida HA , Takeuchi H, Okuyama Y, Umebayashi R, Watatani H, Maeshima Y, Sugiyama H , Wada J
Received 19 December 2018
Accepted for publication 22 May 2019
Published 1 July 2019 Volume 2019:12 Pages 143—152
DOI https://doi.org/10.2147/IJNRD.S198781
Checked for plagiarism Yes
Review by Single anonymous peer review
Peer reviewer comments 3
Editor who approved publication: Professor Pravin Singhal
Yuki Kakio,1 Haruhito A Uchida1,2 Hidemi Takeuchi,1 Yuka Okuyama,1 Ryoko Umebayashi,1 Hiroyuki Watatani,1 Yohei Maeshima,1 Hitoshi Sugiyama,1 Jun Wada1
1Department of Nephrology, Rheumatology, Endocrinology and Metabolism, Okayama University Graduate School of Medicine, Dentistry and Pharmaceutical Sciences, Okayama, Japan; 2Department of Chronic Kidney Disease and Cardiovascular Disease, Okayama University Graduate School of Medicine, Dentistry and Pharmaceutical Sciences, Okayama, Japan
Background: From 2011, Okayama municipal government started the health checkup follow-up project to find those who were unaware of suffering chronic kidney disease and to prevent from aggravation of CKD stage. In this study, we aimed to evaluate the effect of 2 years’ CKD-follow-up project regarding renal function and CKD risks.
Patients and methods: Those who received a health checkup by the national health insurance in Okayama city in 2011 were recruited. The patients with lifestyle-related diseases or metabolic syndrome were excluded. Subjects who had an estimated glomerular filtration rate<50 mL/min/1.73 m2, or urinary protein positive by dipstick test were defined as compromised renal function group. They were recommended to visit a medical institution. Non-compromised renal function participants with two or more risks for CKD (hyperglycemia, higher blood pressure, dyslipidemia, hyperuricemia) were recommended to receive a health guidance (risk group). The change of renal function and CKD risks between 2011 and 2013 in each group was examined.
Results: A total of 28,309 people received a health checkup in 2011. In compromised renal function group, 39.5% (96/243) of the subjects improved their CKD stages in 2013 regardless of the visit of medical institutions or the frequency of receiving health checkup. In risk group, 63.4% (260/410) of the subjects decreased their CKD risks in 2013 independent of the reception of health guidance.
Conclusion: In both compromised renal function group and risk group, more than half of subjects kept their kidney function (217/243) and decreased the number of CKD risks (260/410) in 2 years’ follow-up. Receiving a health checkup itself and notification of one’s own health condition could exert a protective effect on kidney function.
Keywords: renal function, life style, prevention medicine, health consciousness
Introduction
It is estimated that more than 10% of the adult population suffer from chronic kidney disease1 in Japan.2 The frequency of end-stage renal disease (ESRD) has been increasing not only in Japan but also worldwide.3 CKD is a critical risk factor for ESRD.4–8 Furthermore, CKD is more relevant to mortality than ESRD.8 Both impairments of renal function and proteinuria are independent risk factors for cardiovascular disease,9–13 same as for hospitalization.14–16 Thus, an appropriate care for the individuals with CKD has emerged as a major concern. In addition to the sufficient treatment with CKD patients to prevent from aggravation of CKD stage, a societal demand for new strategies to find the subjects who are unaware of suffering CKD has raised. Since symptoms of renal insufficiency usually fail to come up until at severe stage of CKD, it is quite important to find patients with CKD or people with CKD-risks and to initiate proper treatment for CKD as early as possible.
The number of patients who receive maintenance dialysis has grown larger over 320,000 people in Japan, and still increasing.17 In addition, the number of patients who newly require maintenance dialysis has increased; the number of patients who started maintenance dialysis in 2012 was 38,055 and those in 2014 was 38,327.17 In Japan, hemodialysis is most widely selected as renal replacement therapy in comparison with western countries. Consequently, medical expense for these patients increased in proportion to the number of patients and reached about 1.6 trillion yen. In Okayama city in Japan, annual medical costs of maintenance dialysis have been increasing. To rein municipal government expenditure, a regular health checkup is recommended in general population. This checkup is anticipated to find a new patient with any kind of diseases, especially an earlier stage of CKD. An early awareness of renal dysfunction can give rise to a motivation for an early intervention for CKD, possibly reducing the incidence of CKD and ESRD, and lowering medical costs borne by the national health Insurance.
Given these backgrounds, a “CKD-follow-up project” started from 2011 in Okayama city. The main aim of this project was identifying the general people who were still untreated for CKD risk diseases and were unaware of CKD itself or CKD risk. Therefore, we excluded the people who received the oral medical treatment for hypertension, diabetes mellitus, or dyslipidemia, the people who required a specific health guidance or were diagnosed with metabolic syndrome. Accordingly, we were able to identify the subjects who were unaware of their kidney dysfunction, abnormal urine test, or at least one of the risk factors for CKD by a regular health checkup and to notify them of a need of intervention. It is expected that the notification may raise an awareness of CKD itself or a risk for CKD to those who are preferable to change their lifestyle, to receive further medical checkup or, in some cases, to start a treatment for their renal dysfunction. In this study, we aimed to evaluate the effect of 2 years CKD-follow-up project regarding renal function and CKD risks.
Materials and methods
Study subjects and design
A total of 28,309 subjects aged 40 to 74 years old received a health checkup in Okayama city in 2011. Of them, 12,389 with the oral medical treatment for hypertension, diabetes mellitus, or dyslipidemia were excluded. Further, 3,777 subjects who required a specific health guidance or were diagnosed with metabolic syndrome were excluded. Among the reminders, 440 subjects who had estimated glomerular filtration rate (eGFR)<50 mL/min/1.73 m2 or urinary protein positive (including eGFR ≥50) in urinalysis were recruited as the compromised renal function (CRD) group. A notification of the recommendation for medical institution visit was sent to each person of the CRD group. Next, 686 non-CRD subjects who were at high risk of CKD recruited as the risk group. That is, the risk group included the subjects who had eGRF≤50–60 mL/min/1.73m2 and two or more risks for CKD and the subjects who had eGRF≤60–90 mL/min/1.73m2 and three or more risks for CKD. The definition of each risk was as follows: 1) hyperglycemia: fasting plasma glucose levels ≥100 mg/dL or HbA1c ≥5.2%, 2) hypertension: systolic blood pressure ≥130 mmHg or diastolic blood pressure ≥85 mmHg, 3) dyslipidemia: serum triglycerides concentration ≥150 mg/dL or HDL-cholesterol concentration <40 mg/dL, 4) hyperuricemia: serum uric acid concentration ≥7.0 mg/dL, in accordance with the health guidance program such as sending notification of one’s own health condition and motivating to take a spontaneous action for health that the Ministry of Health, Labour and Welfare in Japan advocated in 2007.18 A notification of the recommendation for receiving health guidance was sent to each of the risk group. The reminders of subjects “subjects with single risk factors or healthy subjects” were not provided the recommendation for receiving health guidance. Finally, among both the CRD group and the risk group, subjects who received a health checkup in 2013 were enrolled in this study. We investigated the data of health checkup between 2011 and 2013 and examined the efficacy of this project on renal function and CKD risks in each group. Local governments sent an official letter to residents to receive an annual health checkup under their own volition.
Baseline measurements
Blood samples were collected after an overnight fast and were assayed within 24 hrs with an automated clinical chemistry analyzer. Dipstick urinalysis was performed manually and results were recorded14 as (±), (1+), (2+), and (3+). In Japan, the Japanese Committee for Clinical Laboratory Standards (http://jccls.org/) recommends that all urine dipstick results of (1+) correspond to a urinary protein level of 30 mg/dL. Thus, proteinuria was defined as (1+) or more by dipstick test. eGFR was calculated using the eGFR formula for Japanese (defined by the Japanese Society of Nephrology).19 The Japanese Society of Nephrology set the standards of referral to a nephrologist (eGFR <50 mL/min/1.73m2: people who aged between 40 and 70).19 Therefore, the authors defined the subjects who had eGFR <50 mL/min/1.73m2 in this study as CRD. Renal status of participants was evaluated using CKD heat map.1,20–22 In Japan, measurement of urine albumin concentration is covered by the health insurance only for patients with early stage diabetic nephropathy. Therefore, dipstick urinalysis is common for health checkup. To adapt the result of dipstick urinalysis to CKD heat map, we defined14 as A1, (±) and (1+) as A2, (2+) or more as A3.
Statistics
All data are presented as the mean±standard deviation unless otherwise noted. Differences were analyzed by Student's t-test or Chi-square test where appropriate. Statistical analysis was carried out using SigmaPlot 12.5 (Systat Software, Inc., San Jose, CA). A p-value less than 0.05 was considered to be statistically significant.
Results
CRD group
The number of people who received a health checkup by the national health insurance in Okayama city in 2011 was 28,309. Of them, 440 people were recruited as the CRD group (Figure 1). Among them, 264 people in CRD group received a health checkup after 2 years (Figure 2). Two-hundred and forty-three subjects of 264 were examined for serum creatinine concentration in both 2011 and 2013.
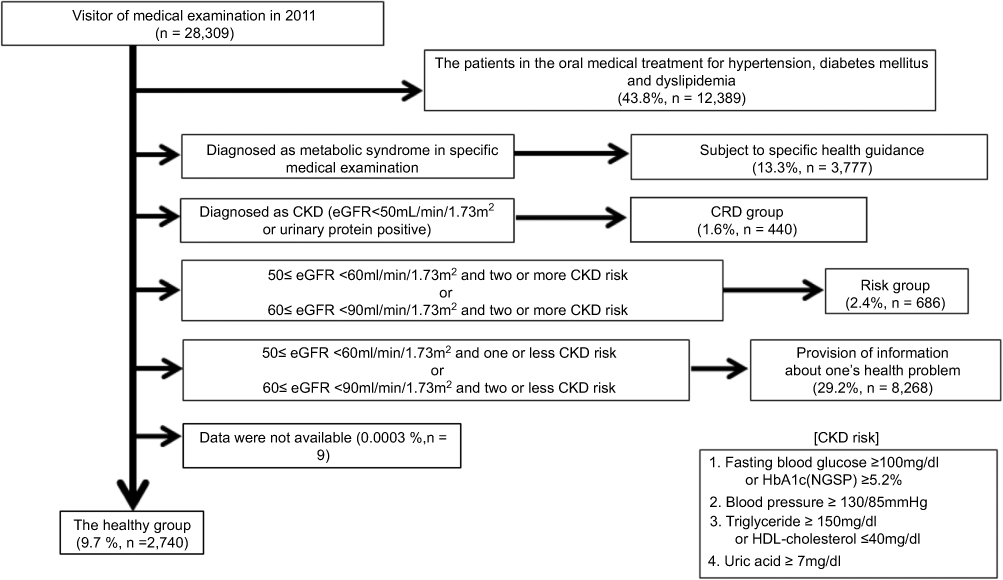 |
Figure 1 Study clusters and subjects. Overview of the study clusters and subjects was described. |
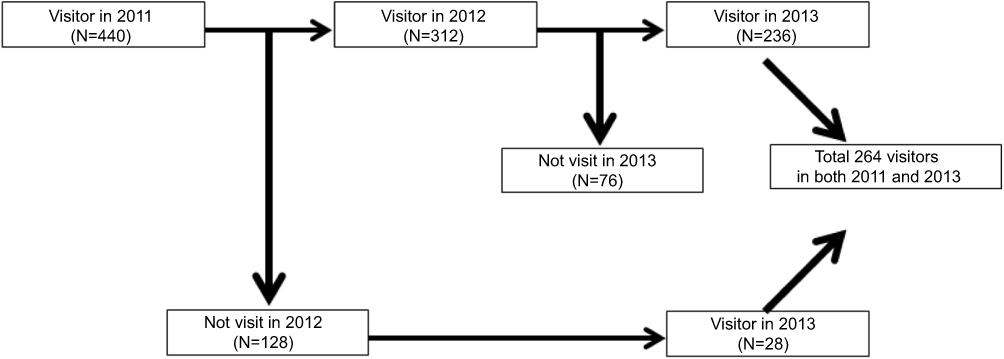 |
Figure 2 Population schema of each year in the CRD group. Overview of the population schema of each year in the CRD group was described. |
Effect of notification of CKD status
Compared to 2011, 39.5% (96/243) of the subjects improved their CKD stages in 2013 (Figure 3). Similarly, distribution of the classification by CKD heart map improved in 2013 (Figure 3). The improvement was achieved greater in proportion to its severity in 2011 (p=0.0050, obtained by Chi-square-test, Figure 3). Further, a stratified analysis demonstrated that visit to a medical institution in accordance with a notification of recommendation did not affect the classification by CKD heat map in 2013 (Figure 4).
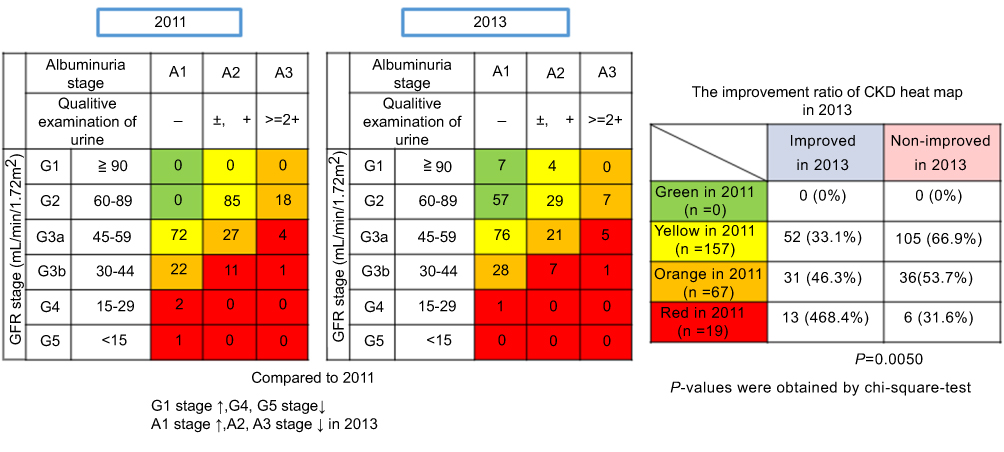 |
Figure 3 CKD stage and changes in 2 years in the CRD group. The distribution of the classification by CKD heart map in 2011 (left) and 2013 (middle) was described. The improvement ratio in the classification of CKD heat map of 2011 was described in the right. The improvement was achieved greater in proportion to its severity in 2011. p-values were obtained by Chi-square test. |
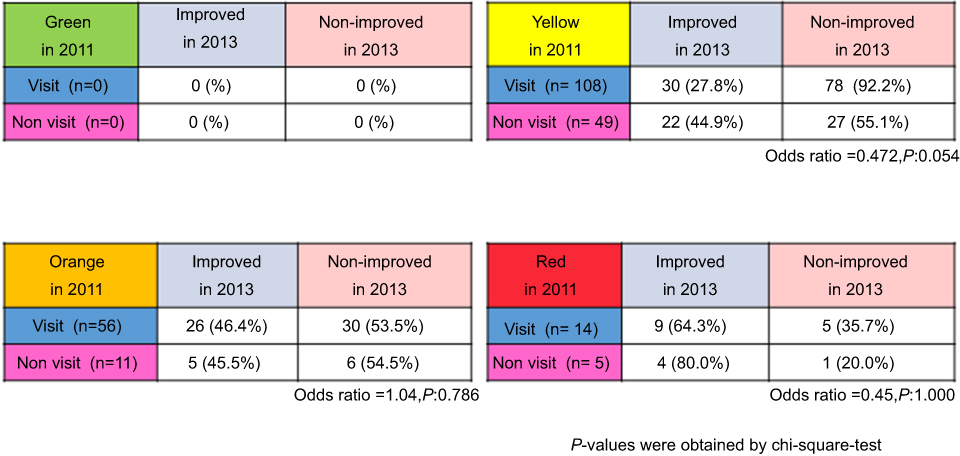 |
Figure 4 The effects of visiting medical institutions on improvement ratio of CKD heat map in 2013. To investigate the effect of visiting medical institutions on renal function, subjects of the CRD group were classified by CKD heat map in 2011. Each panel shows the number of subjects (%) who improved or not in 2013. Visiting medical institution did not affect the classification in each category by CKD heat map in 2013 regardless of severity in 2011. |
Effect of frequency of health checkup on CKD stage
Next, we investigated whether the frequency of receiving health checkup affected stage of CKD in 2013. For analysis, the CRD group (n=264) was divided retrospectively into two groups, ie, frequent group and non-frequent group. The frequent group represented those who received health checkup every year. In contrast, the non-frequent group represented those who did not receive health checkup in 2012. There were no significant differences between the baseline parameters of each group (Table 1). Two-hundred and nineteen subjects of the frequent group were examined for their renal function. Compared to 2011, 40.2% (88/219) subjects in the frequent group improved their CKD stage (Figure 5). Distribution of the classification by CKD heat map in the frequent group also improved in 2013. Similarly, the improvement was achieved greater in proportion to its severity in 2011 (p=0.0056, obtained by Chi-square-test, Figure 5). On the other hand, 24 individuals of the non-frequent group were examined for renal function. Compared to 2011, 33.3% (8/24) of the subjects in the non-frequent group improved their CKD stage (Figure 6). Distribution of the classification by CKD heat map in the non-frequent group also improved in 2013 (Figure 6). The frequency of receiving health checkup did not statistically affect the improvement ratio in the classification of CKD heat map (Figure 7).
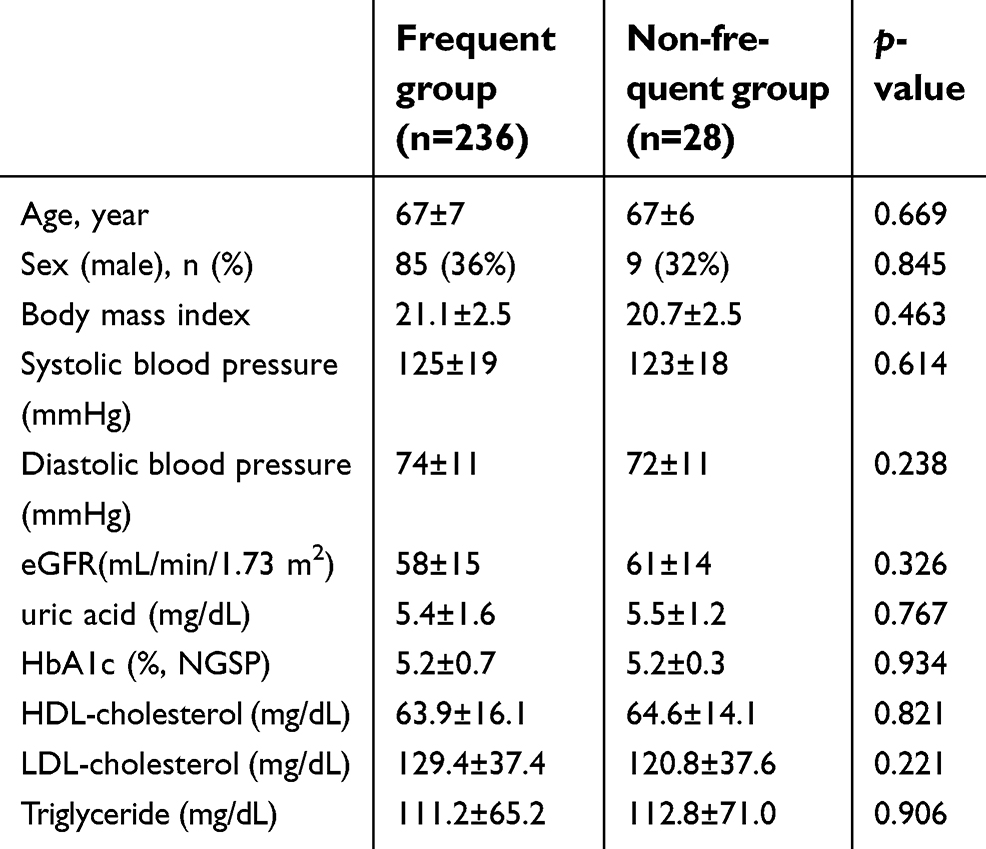 |
Table 1 Baseline characteristics of the CRD group |
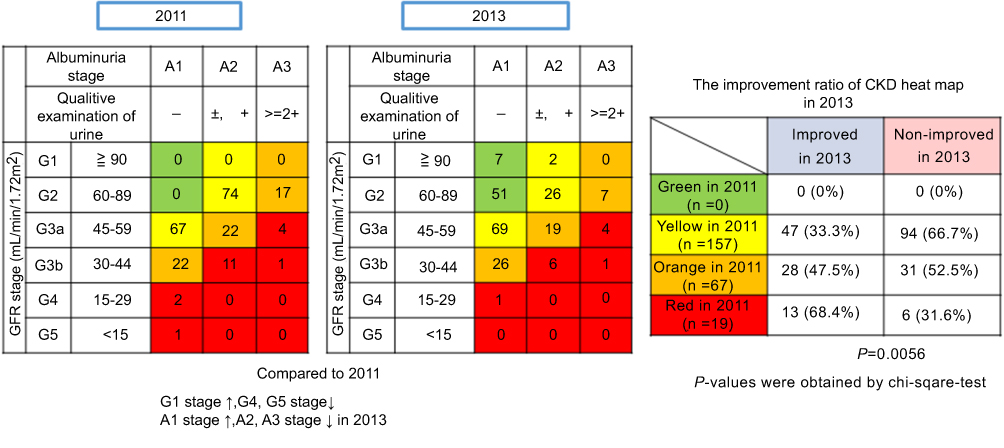 |
Figure 5 CKD stage and changes in 2 years in the frequent group. The distribution of the classification by CKD heart map of the frequent group in 2011 (left) and 2013 (middle) was described. The improvement ratio in the classification of CKD heat map of 2011 was described in the right. The improvement was achieved greater in proportion to its severity in 2011. p-values were obtained by Chi-square test. |
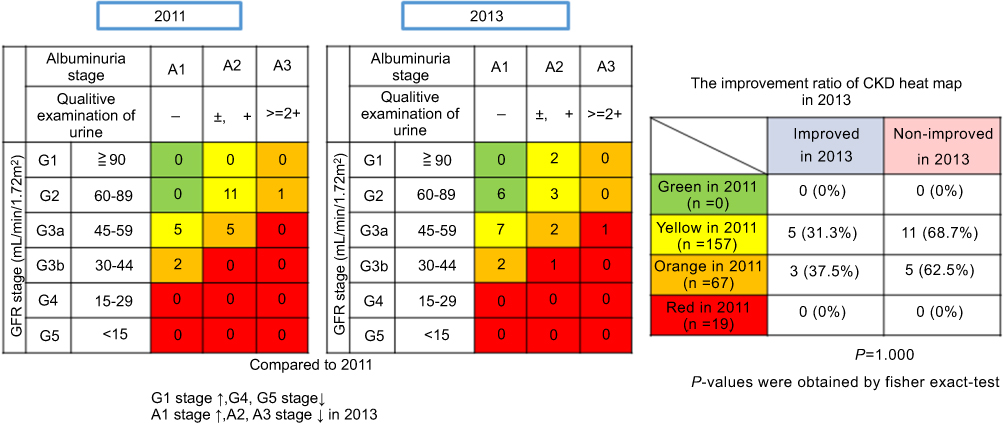 |
Figure 6 CKD stage and changes in 2 years in the non-frequent group. The distribution of the classification by CKD heart map of the non-frequent group in 2011 (left) and 2013 (middle) was described. Compared to 2011, many subjects improved their CKD stages in 2013. The improvement ratio in the classification of CKD heat map of 2011 was described in the right. p-values were obtained by Chi-square test. |
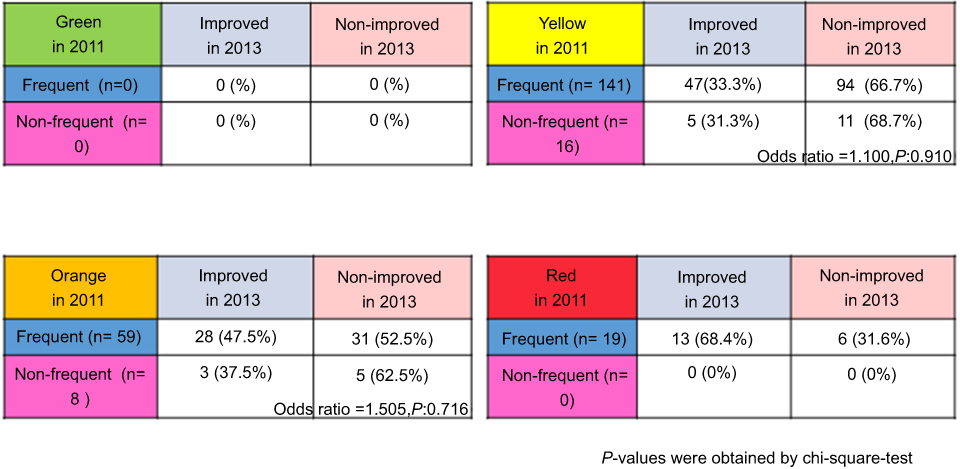 |
Figure 7 The effects of the frequency of receiving health checkup on improvement ratio of CKD heat map in 2013. To investigate the effect of frequency of receiving health checkup on renal function, subjects of the CRD group were classified by CKD heat map in 2011. Each panel shows the number of subjects (%) who improved or not in 2013. A stratified analysis demonstrated that frequency of receiving health checkup did not affect the classification by CKD heat map in 2013 regardless of severity in 2011. p-values were obtained by Chi-square test. |
Risk group
Six-hundred and eighty-six subjects were categorized into the risk group in 2011 (Figure 1). Four-hundred and thirty-six people in the risk group received a health checkup after 2 years (Figure 8). We investigated whether the reception of health guidance affected the status of CKD stage and risk in 2013. For analysis, the risk group (n=436) was divided retrospectively into two groups, ie, receive group (n=89) and non-receive group (n=347). The receive group represented those who received a health guidance in 2011 and/or 2012. The non-receive group represented those who never received a health guidance. Compared to receive group, the mean age of non-receive group was younger and the mean systolic blood pressure of non-receive group was higher in the baseline (Table 2). To investigate the effect of reception of health guidance on the reduction of CKD risks, the subjects who were evaluated for all four CKD risks in 2011 and 2013 were examined. In both groups, compared to 2011, more than half of the subjects decreased their CKD risks in 2013 (Table 3). However, receiving health guidance did not increase nor decrease the number of CKD risks (Table 3). Furthermore, a stratified analysis demonstrated that reception of health guidance did not reduce any CKD risks (Table 4).
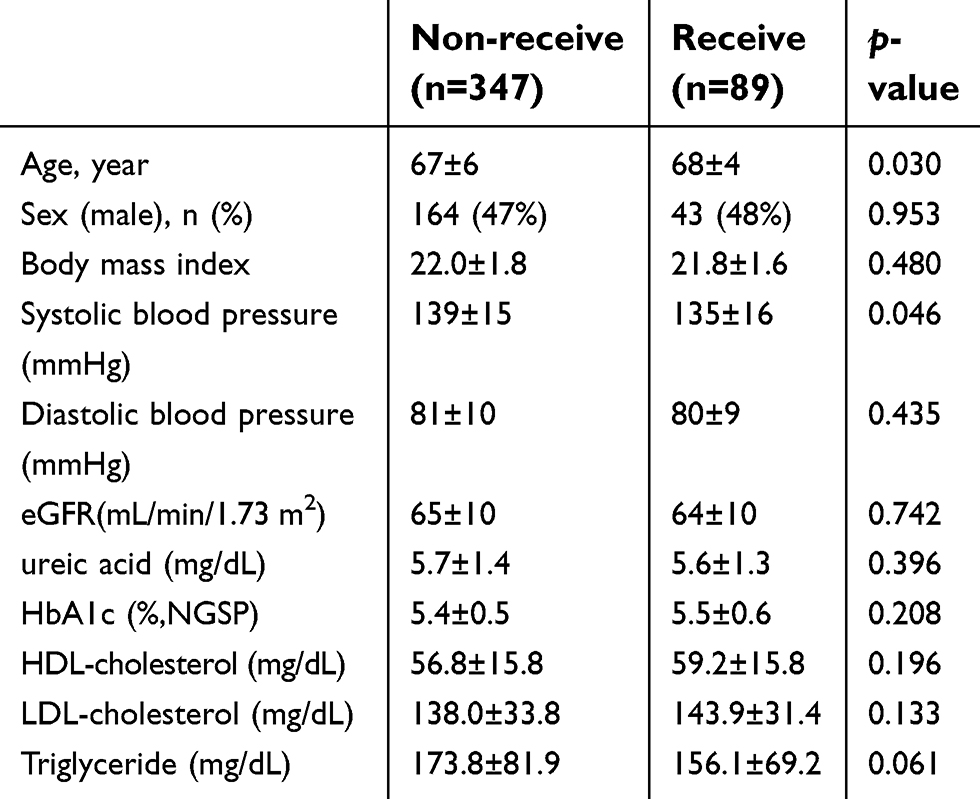 |
Table 2 Baseline characteristics of the risk group |
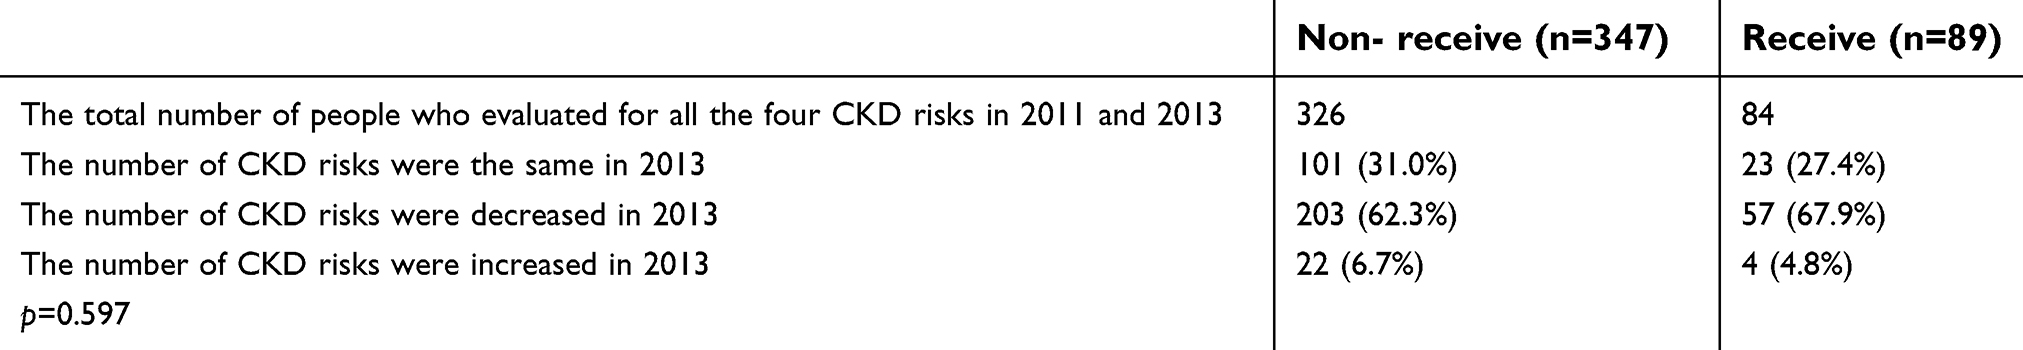 |
Table 3 The effect of reception of the health guidance on reduction in CKD risks |
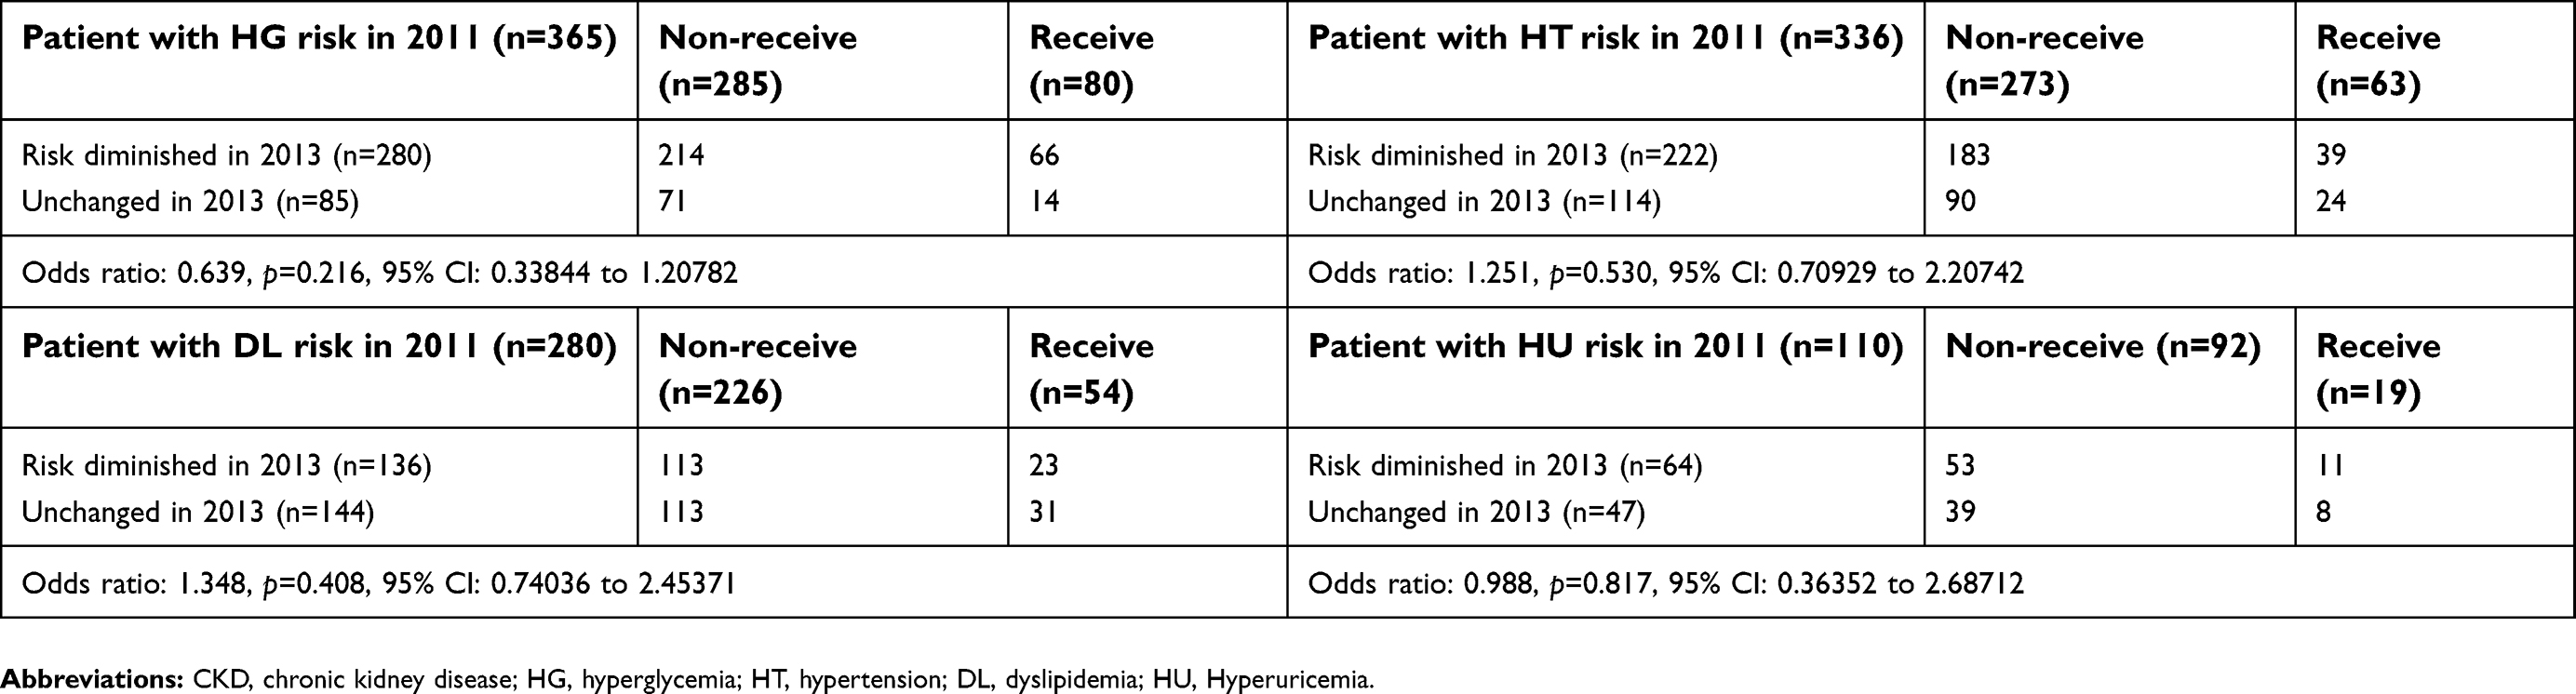 |
Table 4 The effect of reception of the health guidance on reduction in each CKD risk |
 |
Figure 8 Population schema of each year in the risk group. Overview of the population schema of each year in the risk group was described. |
Discussion
In this study, we examined the effect of notification of impaired renal function or existence of at least two CKD risks according to health checkup records for CKD on renal function, proteinuria and other CKD risks in general population in Okayama city. In both the CRD group and the risk group, the notification provided favorable effects after 2 years, regardless of visit of medical institutions or reception of health guidance in follow-up duration in this cohort.
In the CRD group, 39.5% (96/243) of the subjects improved their CKD stages and distributions of the classification by CKD heat map after 2 years. It is likely considered that notification of CKD might motivate these subjects to take a spontaneous action for health, ie, visiting medical institutions and improving their lifestyle. However, contrary to our expectation, the visit of medical institutions did not improve the classification of CKD heat map after 2 years. It appears that CKD status may not improve in this short period. In addition, there are other possible reasons. First, some subjects who visited a medical institution might not be referred to a specialist of nephrology. Second, the subjects who were referred to a specialist might not receive health checkup in 2013. Third, since relatively young subjects were included in this study, they might move out of town in 2 years. Fourth, the younger are likely to take less notice on their own health; therefore, subjects who required detailed examination might fail to visit medical institutions. However, the improvement of renal function in 2013 was independent of the visit of medical institutions or the frequency of receiving health checkup. Given these observation, it is likely concluded that a notification of CKD itself caused behavior change to improve their renal function, in consequence.
In the risk group, since more than half of the subjects decreased their CKD risks in 2013, it appears that notification of CKD risk or the recommendation for reception of health guidance might improve their lifestyle. However, no preferable effect of the reception of health guidance on the reduction of CKD risks was found. In our cohort, the baseline characteristics of receive group and non-receive group were similar except small differences in age and systolic blood pressure. Therefore, there are two possible reasons for no preferable effect of the reception of health guidance. First, subject of both groups might be well motivated by the notification itself to change their behaviors. Second, the content of health guidance might not be rich enough to improve their lifestyle. It should be reviewed to include the intelligible information. Taken together, it is likely considered that a notification of CKD risk itself was effective.
In general, a medical institution is able to serve medical treatments only to those who visit the institution, in some cases, with severe disease. Therefore, it is highly expected that the general public should pay more attention to their own health to find CKD early and to prevent from the progression of CKD. For this, a municipal government should play a significant role to motivate its civilian to take a spontaneous action for health. This project of Okayama city municipal government’s intervention was, at least in part, successfully effective in the prevention from the progression of CKD in 2 years’ follow-up period. As a whole, we emphasized the importance of receiving health checkup and awareness of health condition for the general public.
This study has several limitations. First, the observation period of the study was relatively short to evaluate the prognosis of renal function. In general, the worse renal function progresses the disease faster.23 Since few subjects who had severe renal dysfunction were included, renal function in our cohort did not dramatically change in just 2 years. Therefore, further long-term observation was required to evaluate the effect of intervention on the progress of renal function. Second, this study was based on a single arm, retrospective, observational data and the authors could not set the control group “the people who did not participate in the health check-up”. There was no choice judging from the nature of the study. The authors admit naturedly that the result of this study and the effect of notification of CKD risk or the recommendation for reception of health guidance lacked satisfactory evidence. Thus, the real effect of our intervention might be under (over) estimated. Third, there is a selection bias. The number of subjects who were eligible to receive a health check-up who aged between 40 and 74 in Okayama City were 120,266 in 2013. Basically, Japan has a universal health insurance coverage. This health check-up was performed for the people who hold national health insurance. However, only 28,309 subjects received a health check-up in 2013. There was a possibility that they were originally motivated regarding their health maintenance. Further, in the current study, all subjects received health checkup more than once in 2 years. Therefore, it appears that many of subjects might be originally high-motivated to their health. It is likely that they might change behaviors by themselves to improve their renal function. Fourth, the current findings may have been brought by the regression toward the mean. In this study design, participants with CKD or CKD risk factors were followed up for eGFR or CKD risk factors. In health checkup, the person who had the worse result naturally tend to improve in next time, the person who had the better result tend to remain. The authors might observe a part of natural drift of laboratory tests during the follow-up period. However, it is important to observe own renal function by routine health checkup.
Conclusion
In conclusion, 2 years’ CKD follow-up project provided a significant improvement of renal dysfunction. Irrespective of the visit of medical institutions or the reception of health guidance, a notification of CKD status and the recommendation for medical institution visit or for reception of health guidance kept the subjects’ eyes on their health condition, potentially leading to renal protective effect. A longer term follow-up will be needed to clarify the effect of this project on the prevention from CKD progression or prognosis in general public.
Data availability
Okayama City Health Center has the data supporting the results reported in the manuscript.
However, all the data were anonymized and unlinked. Therefore, the data are not available.
Ethics approval and informed consent
This study followed the Declaration of Helsinki (seventh revision, 2013) on medical protocol and ethics. The ethics committees of Okayama University Institutional Review Board (accredited ISO9001/2000), Okayama, Japan approved the protocol (approval number: K1708-009). All participants provided written informed consent.
Acknowledgments
The authors would like to thank Dr. Hiroaki Matsuoka (the center president of Okayama Prefecture Okayama City Health Center) for the advice on the Statistics Analysis in this study. The authors would like to thank Ms. Shizuko Yamamoto and Ms. Miki Yamabuki (the staff of Okayama prefecture Okayama City Health Center) for their careful works in the collection of data of the subjects. No funding was provided for this research.
Author contributions
All authors contributed to data analysis, drafting or revising the article, gave final approval of the version to be published, and agree to be accountable for all aspects of the work.
Disclosure
The authors report no conflicts of interest in this work.
References
1. Group KDIGOKCW. KDIGO 2012 clinical practice guideline for the evaluation and management of chronic kidney disease. Kidney Int. 2013;3(1):1–163. Retrieved from: http://www.kdigo.org/clinical_practice_guidelines/pdf/CKD/KDIGO_2012_CKD_GL.pdf.
2. Imai E, Horio M, Watanabe T, et al. Prevalence of chronic kidney disease in the Japanese general population. Clin Exp Nephrol. 2009;13(6):621–630. doi:10.1007/s10157-009-0199-x
3. Lysaght MJ. Maintenance dialysis population dynamics: current trends and long-term implications. J Am Soc Nephrol. 2002;13(Suppl 1):S37–S40.
4. Norris KC, Greene T, Kopple J, et al. Baseline predictors of renal disease progression in the African American study of hypertension and kidney disease. J Am Soc Nephrol. 2006;17(10):2928–2936. doi:10.1681/ASN.2005101101
5. Serrano A, Huang J, Ghossein C, et al. Stabilization of glomerular filtration rate in advanced chronic kidney disease: a two-year follow-up of a cohort of chronic kidney disease patients stages 4 and 5. Adv Chronic Kidney Dis. 2007;14(1):105–112. doi:10.1053/j.ackd.2006.07.009
6. Evans M, Fryzek JP, Elinder CG, et al. The natural history of chronic renal failure: results from an unselected, population-based, inception cohort in Sweden. Am J Kidney Dis. 2005;46(5):863–870. doi:10.1053/j.ajkd.2005.07.040
7. Patel UD, Young EW, Ojo AO, Hayward RA. CKD progression and mortality among older patients with diabetes. Am J Kidney Dis. 2005;46(3):406–414. doi:10.1053/j.ajkd.2005.05.027
8. Keith DS, Nichols GA, Gullion CM, Brown JB, Smith DH. Longitudinal follow-up and outcomes among a population with chronic kidney disease in a large managed care organization. Arch Intern Med. 2004;164(6):659–663. doi:10.1001/archinte.164.6.659
9. Kannel WB, Stampfer MJ, Castelli WP, Verter J. The prognostic significance of proteinuria: the Framingham study. Am Heart J. 1984;108(5):1347–1352.
10. Sarnak MJ, Levey AS, Schoolwerth AC, et al. Kidney disease as a risk factor for development of cardiovascular disease: a statement from the American heart association councils on kidney in cardiovascular disease, high blood pressure research, clinical cardiology, and epidemiology and prevention. Circulation. 2003;108(17):2154–2169. doi:10.1161/01.CIR.0000095676.90936.80
11. Levey AS, Coresh J, Bolton K, et al. K/DOQI clinical practice guidelines for chronic kidney disease: evaluation, classification, and stratification. Am J Kidney Dis. 2002;39(2 Suppl 1):S1–S266.
12. Damsgaard EM, Froland A, Jorgensen OD, Mogensen CE. Microalbuminuria as predictor of increased mortality in elderly people. BMJ. 1990;300(6720):297–300. doi:10.1136/bmj.300.6720.297
13. Tanaka K, Watanabe T, Takeuchi A, et al. Cardiovascular events and death in Japanese patients with chronic kidney disease. Kidney Int. 2017;91(1):227–234. doi:10.1016/j.kint.2016.09.015
14. Wachtell K, Ibsen H, Olsen MH, et al. Albuminuria and cardiovascular risk in hypertensive patients with left ventricular hypertrophy: the LIFE study. Ann Intern Med. 2003;139(11):901–906.
15. Go AS, Chertow GM, Fan D, McCulloch CE, Hsu CY. Chronic kidney disease and the risks of death, cardiovascular events, and hospitalization. N Engl J Med. 2004;351(13):1296–1305. doi:10.1056/NEJMoa041031
16. Kottgen A, Russell SD, Loehr LR, et al. Reduced kidney function as a risk factor for incident heart failure: the atherosclerosis risk in communities (ARIC) study. J Am Soc Nephrol. 2007;18(4):1307–1315. doi:10.1681/ASN.2006101159
17. Masakane I, Nakai S, Ogata S, et al. An overview of regular dialysis treatment in japan (as of 31 December 2014). Ther Apher Dial. 2016;49(1):1–34.
18. Ministry of Health, Labour and Welfare in Japan. the health guidance program. 2007:1–252. Retrieved from: http://www.mhlw.go.jp/bunya/kenkou/seikatsu/pdf/02.pdf.Accessed April 21, 2007.
19. Japan nephrology s. [Special issue: clinical practice guidebook for diagnosis and treatment of chronic kidney disease 2012]. Nihon Jinzo Gakkai Shi. 2012;54(8):1034–1191.
20. Levey AS, de Jong PE, Coresh J, et al. The definition, classification, and prognosis of chronic kidney disease: a KDIGO controversies conference report. Kidney Int. 2011;80(1):17–28. doi:10.1038/ki.2010.483
21. Matsushita K, van der Velde M, Astor BC, et al. Association of estimated glomerular filtration rate and albuminuria with all-cause and cardiovascular mortality in general population cohorts: a collaborative meta-analysis. Lancet. 2010;375(9731):2073–2081. doi:10.1016/S0140-6736(10)60674-5
22. Levey AS, Coresh J. Chronic kidney disease. Lancet. 2012;379(9811):165–180. doi:10.1016/S0140-6736(11)60178-5
23. Imai E, Horio M, Yamagata K, et al. Slower decline of glomerular filtration rate in the Japanese general population: a longitudinal 10-year follow-up study. Hypertens Res. 2008;31(3):433–441. doi:10.1291/hypres.31.433
 © 2019 The Author(s). This work is published and licensed by Dove Medical Press Limited. The full terms of this license are available at https://www.dovepress.com/terms.php and incorporate the Creative Commons Attribution - Non Commercial (unported, v3.0) License.
By accessing the work you hereby accept the Terms. Non-commercial uses of the work are permitted without any further permission from Dove Medical Press Limited, provided the work is properly attributed. For permission for commercial use of this work, please see paragraphs 4.2 and 5 of our Terms.
© 2019 The Author(s). This work is published and licensed by Dove Medical Press Limited. The full terms of this license are available at https://www.dovepress.com/terms.php and incorporate the Creative Commons Attribution - Non Commercial (unported, v3.0) License.
By accessing the work you hereby accept the Terms. Non-commercial uses of the work are permitted without any further permission from Dove Medical Press Limited, provided the work is properly attributed. For permission for commercial use of this work, please see paragraphs 4.2 and 5 of our Terms.