")
Back to Journals » Research and Reports in Urology » Volume 14
Repeatability of Ultrasound-Defined Bladder Shape Metrics in Healthy Volunteers
Authors Maddra KM, Li R, Nagle AS, Klausner AP, Speich JE
Received 7 December 2021
Accepted for publication 16 April 2022
Published 6 May 2022 Volume 2022:14 Pages 185—192
DOI https://doi.org/10.2147/RRU.S351347
Checked for plagiarism Yes
Review by Single anonymous peer review
Peer reviewer comments 3
Editor who approved publication: Dr Guglielmo Mantica
Kaitlyn M Maddra,1 Rui Li,2 Anna S Nagle,2 Adam P Klausner,1 John E Speich2
1Department of Surgery/Division of Urology, Virginia Commonwealth University School of Medicine, Richmond, VA, USA; 2Department of Mechanical and Nuclear Engineering, Virginia Commonwealth University College of Engineering, Richmond, VA, USA
Correspondence: John E Speich, Department of Mechanical and Nuclear Engineering, Virginia Commonwealth University College of Engineering, Richmond, VA, USA, Tel +1 804 827 7036, Fax +1 804 827 7030, Email [email protected]
Purpose: Recent studies demonstrate the potential value of using non-invasive abdominal ultrasound to quantify bladder shape and its association with disorders of bladder filling and voiding. The aim of the present study was to assess the repeatability of ultrasound-defined bladder shape metrics within the same individual from multiple bladder fills and study visits.
Patients and Methods: Healthy volunteers completed an oral hydration protocol with two weekly visits, each with two consecutive bladder fill-void cycles, providing four total fills per participant. Throughout filling, 3-dimensional (3-D) ultrasound images were recorded at 5-minute intervals. Perimeters were manually traced in six cross-sectional planes 30° apart using GE 4D-View software. Diameters, perimeters and cross-sectional areas for the transverse, sagittal and coronal planes were interpolated at three standard bladder volumes of 200, 300, and 400mL. To quantify repeatability, intraclass correlation coefficients (ICCs) and normalized mean absolute differences were calculated for each metric at each standard volume. Moderate and good repeatability were defined as ICC ≥ 0.5 and ICC ≥ 0.75, respectively.
Results: Data from 16 healthy volunteers (9 females, 7 males) were analyzed. ICCs for the transverse vertical and horizontal diameters showed good repeatability, and five of nine perimeter ICCs showed moderate or good repeatability. The mean absolute difference/mean ratio was ≤ 4% for all perimeter measurements, indicating repeatability was consistent for multiple fills and visits.
Conclusion: Initial evidence indicates that bladder shape metrics are relatively repeatable and therefore feasible to pursue as a non-invasive tool for potential evaluation of bladder function.
Keywords: non-invasive, overactive bladder, ultrasound imaging, urinary bladder
Introduction
The pressure-flow urodynamics study (UDS) is the standard technique for objectively evaluating bladder filling and voiding function/dysfunction.1 UDS uses invasive catheters for pressure measurements and is uncomfortable and causes anxiety in many patients.2 UDS also carries a risk of urinary tract infection and other adverse events.3,4 As a result, there is a significant need for non-invasive techniques to supplement and/or improve conventional UDS for the assessment and improved phenotyping of disorders of bladder filling and voiding.5
Ultrasound (US) imaging provides a non-invasive and cost-effective technique for bladder evaluation. Transabdominal US is the standard technique for measuring post void residual volumes6 and has been used to quantify increased bladder wall thickness associated with bladder outlet obstruction.7 Recent studies indicate that US-based bladder shape analysis may be useful for the assessment of overactive bladder (OAB).8–10 Glass Clark et al used 3-D US imaging to quantify bladder height-to-width ratios in a group of women with OAB and a control group of age and body-mass-index-matched women without OAB.8 They found that bladder shapes for 5/11 women with OAB were outside the 95% confidence intervals for the control group, potentially identifying an OAB subgroup with irregular bladder shapes.8 In a subsequent study, Li et al developed a sagittal perimeter nomogram that identified irregular bladder shapes in 6/24 women with OAB and found an association between irregular bladder shape and OAB.9 Furthermore, Gray et al used US-derived 2-dimensional transverse bladder images to estimate bladder sphericity during filling and found that increased sphericity was associated with non-voiding bladder contractions,10 which are identified during UDS in some individuals with OAB.11
In these previous studies, US-derived bladder shape metrics were determined by either manually tracing the bladder perimeters in multiple planes8,9 or inscribing and circumscribing the transverse image of the bladder perimeter with ellipses.10 For these bladder shape diagnostics to be clinically relevant, the measurements must be sufficiently repeatable. The objective of the present study was to assess the repeatability of bladder shape metrics from transabdominal US images obtained from both sequential bladder fill-void cycles and multiple clinic visits.
Materials and Methods
Participants
Adults over the age of 21 years without OAB or any other reported lower urinary tract symptoms completed informed consent and were prospectively enrolled in an accelerated oral hydration study, which was approved by the Virginia Commonwealth University Institutional Review Board and in compliance with the Declaration of Helsinki. The absence of OAB was based on question 5a (“Do you have to rush to the toilet to urinate?”) of the International Consultation on Incontinence questionnaire on OAB (ICIq−OAB).12 Only participants scoring 0 (“never”) were included in the study. Participants also had to confirm lack of any other lower urinary tract symptoms or any medical conditions or use of any medications affecting bladder function. Participant demographics and body mass index (BMI) were also recorded.
Hydration Protocol with US
The oral hydration study consisted of two consecutive bladder fill-empty cycles as illustrated in Figure 1 and as previously described.13–16 The study was performed during two visits, approximately one week apart, providing data for a total of four fills per participant. During the first fill of each visit, participants were instructed to drink two liters of G2 Gatorade as quickly as possible (Figure 1, Fill 1). Participants were given a tablet-based sensation meter and were instructed to record their sensation during bladder filling (Figure 1, Fill 1).13–16 When participants reached 100% bladder sensation, they were instructed to void in a private bathroom. Upon returning, the sensation meter was reset to start the second bladder fill cycle of the visit (Figure 1, Fill 2). Participants again recorded their bladder sensation and were able to void once they reached 100% sensation a second time. Approximately one week later, participants returned and repeated the same protocol. During each fill, transabdominal US images of the bladder were obtained every 5 minutes (Figure 1) using a GE VolusonTM E8 system (Madison, WI) with a 3-D convex 4–8.5 MHz transducer.
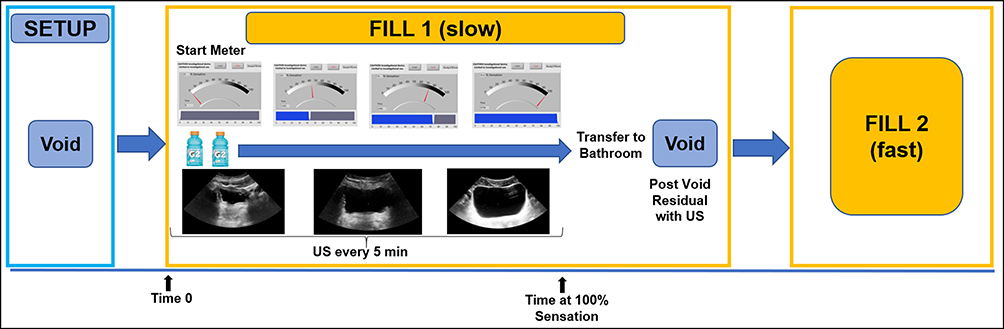 |
Figure 1 Experimental oral hydration protocol, with two fill-void cycles from 0% to 100% sensation as measured by the sensation meter and ultrasound (US) images collected every 5 minutes. |
Bladder US Image Analysis
As described in previous studies,8,9,17,18 bladder US images were analyzed using GE 4DView software (Figure 2).19 Beginning with the transverse plane, bladder perimeters were manually traced in six cross-sectional planes, each 30° apart (Figure 2A and B), and then the perimeter in each plane was manually refined (Figure 2C). Next, 1) bladder diameters, 2) cross-sectional areas and perimeters (transverse, sagittal and coronal planes), and 3) estimated bladder volumes were measured and recorded using the GE 4D-View software (Table 1). These measurements were then linearly interpolated to standard bladder volumes of 200, 300, and 400mL to allow for comparison across multiple fills and visits (Table 1).
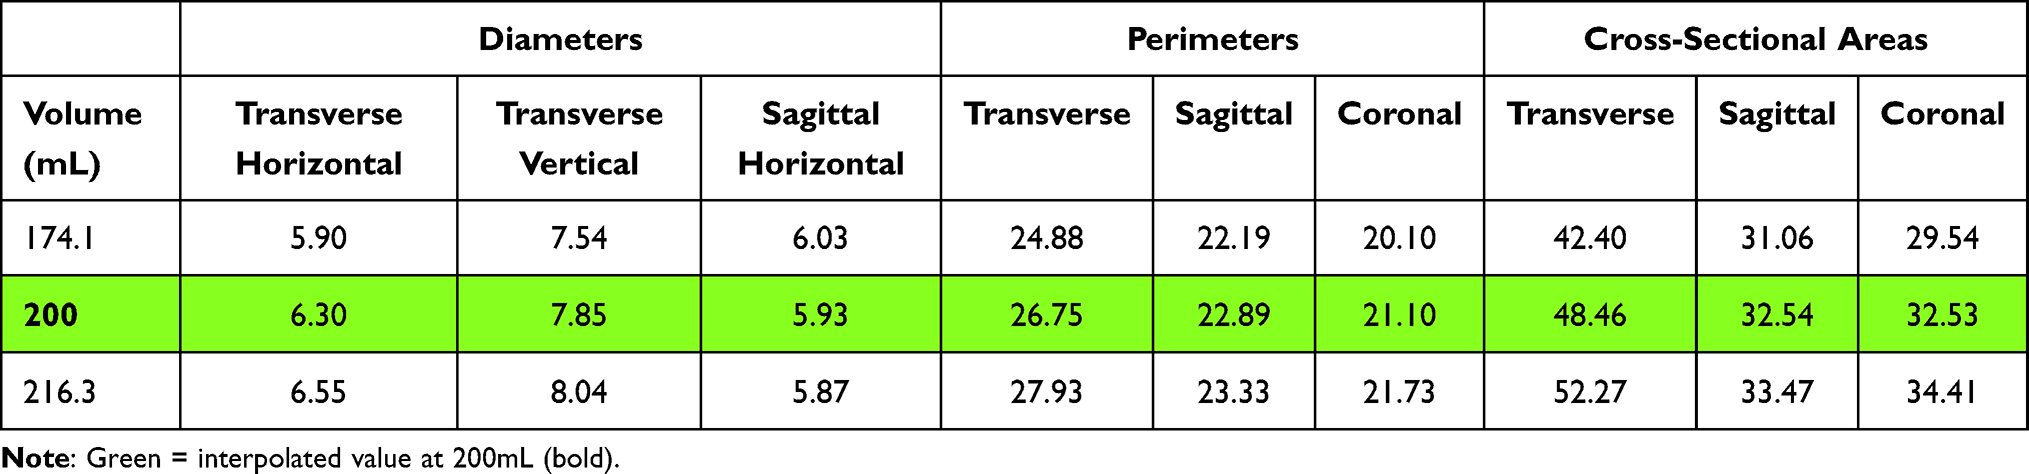 |
Table 1 Example of Interpolation of Shape Metrics to a Standard Volume of 200mL |
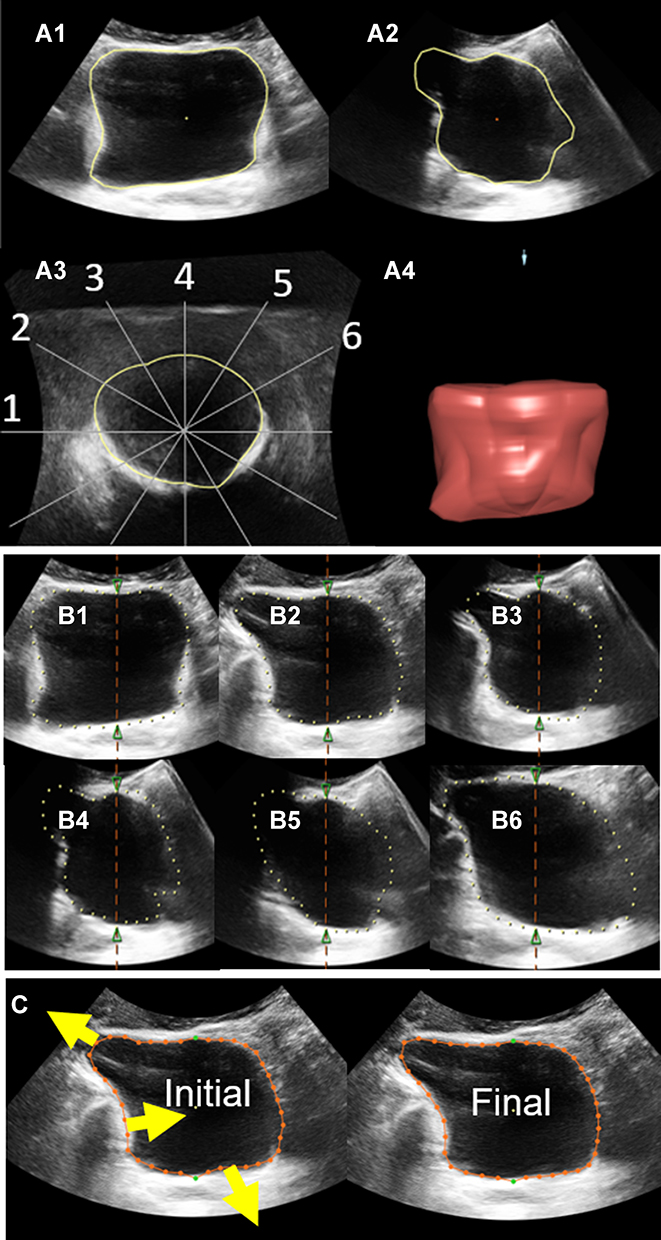 |
Figure 2 Bladder shape tracing example using GE 4DView software. Transverse (A1), sagittal (A2), coronal (A3) and rendered 3-D model (A4). Transverse plane was traced manually (A1) and repeated in six cross-sectional planes 30° apart (B1–B6) corresponding to the lines on the coronal plane (A3). Then the traced perimeter was manually refined (C), where the yellow arrows show locations and directions of refinements for a particular plane. |
Statistical Analysis
Established methods for assessing the reliability of imaging methods,20 including the repeatability of pelvic ultrasound images,21 were implemented. The intraclass correlation coefficient (ICC) with 95% confidence intervals was calculated across four fills for the diameters, perimeters and cross-sectional areas at each standard volume based on a two-way random effect model and absolute agreement (Table 2). Moderate repeatability was defined as ICC ≥ 0.5 and good was defined as ICC ≥ 0.75, as previously described.21 In addition, the normalized mean absolute difference (MAD) was calculated for each shape metric (mean absolute difference of the group/mean of the group, Table 3).20 Pearson correlations were calculated to quantify the relationships between the ICCs and MADs for the diameters, perimeters, and cross-sectional areas. A power analysis determined that a sample size of 10 participants with four observations would achieve 96% power to detect an ICC ≥ 0.5.
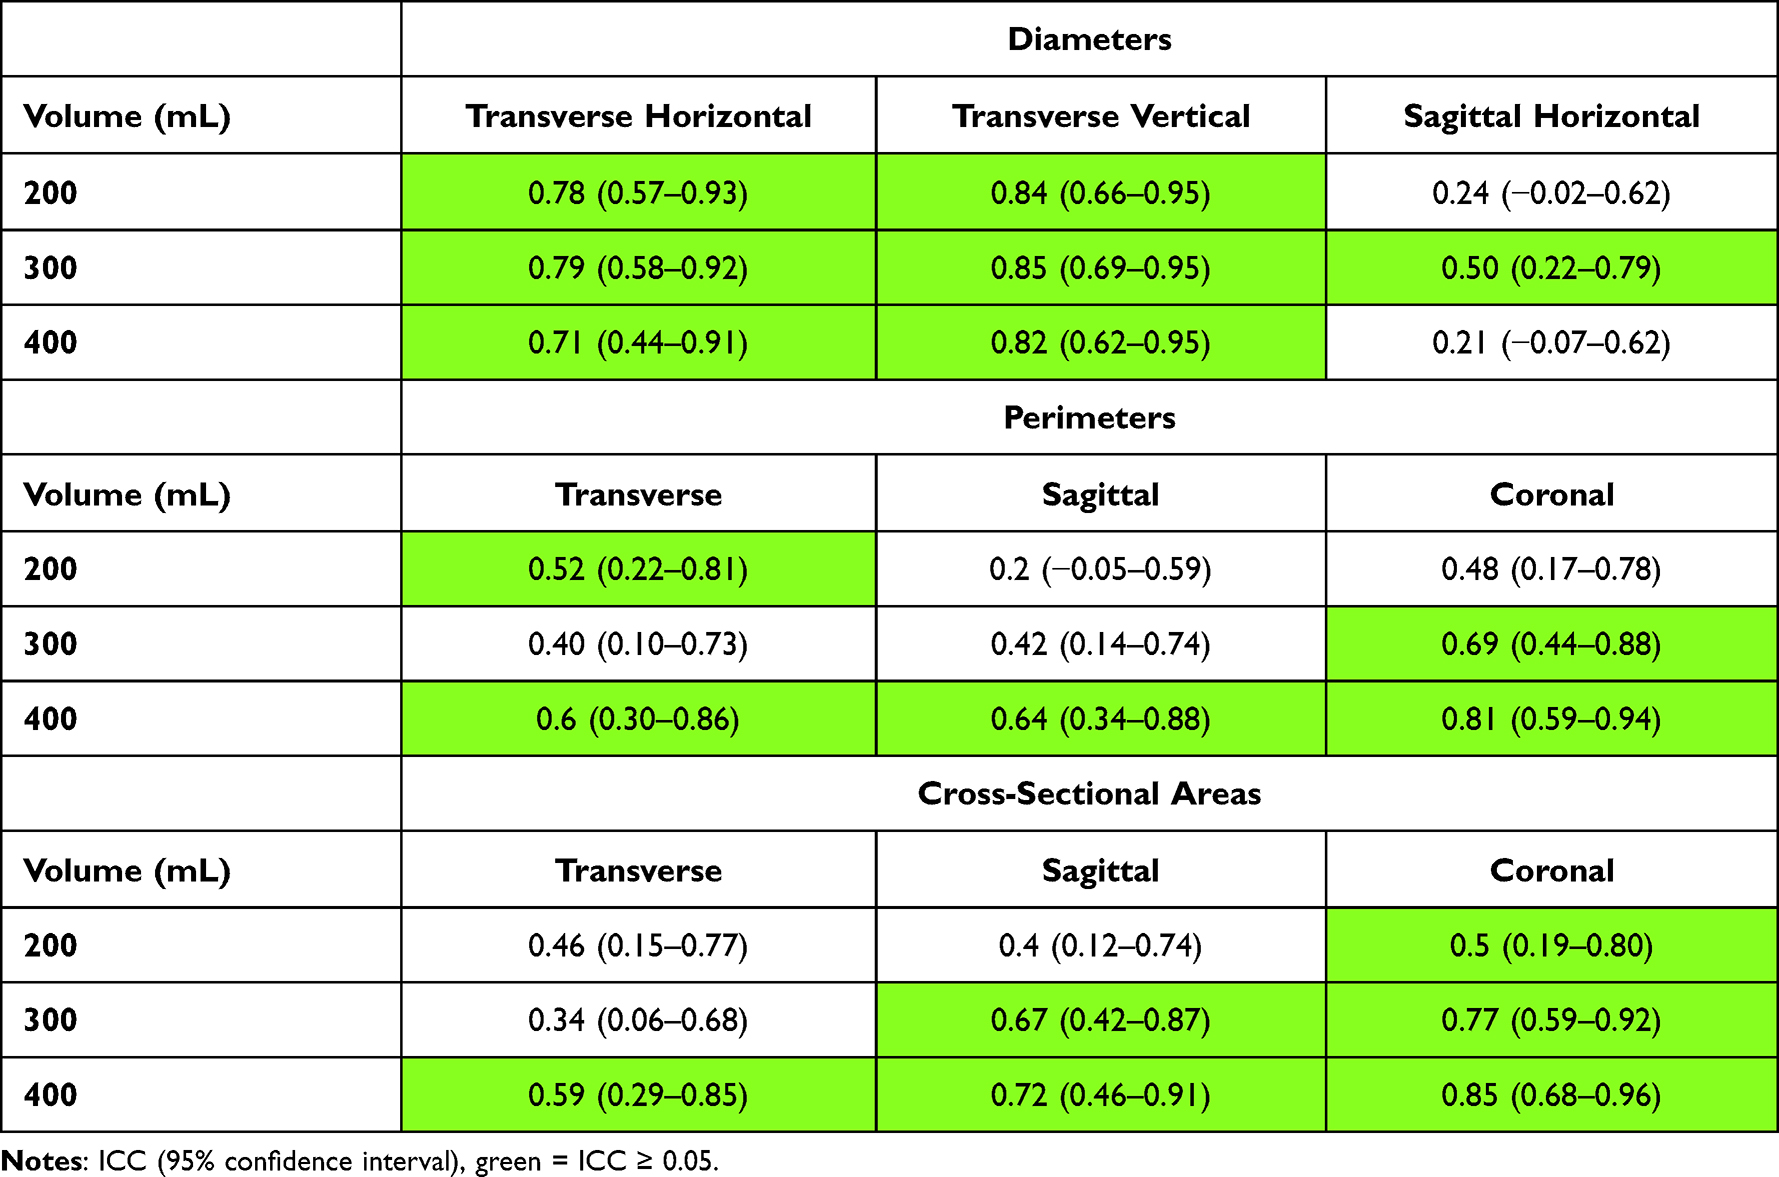 |
Table 2 Interclass Correlation Coefficients (ICCs) for the Shape Metrics at Each Standard Volume (Bold Values) |
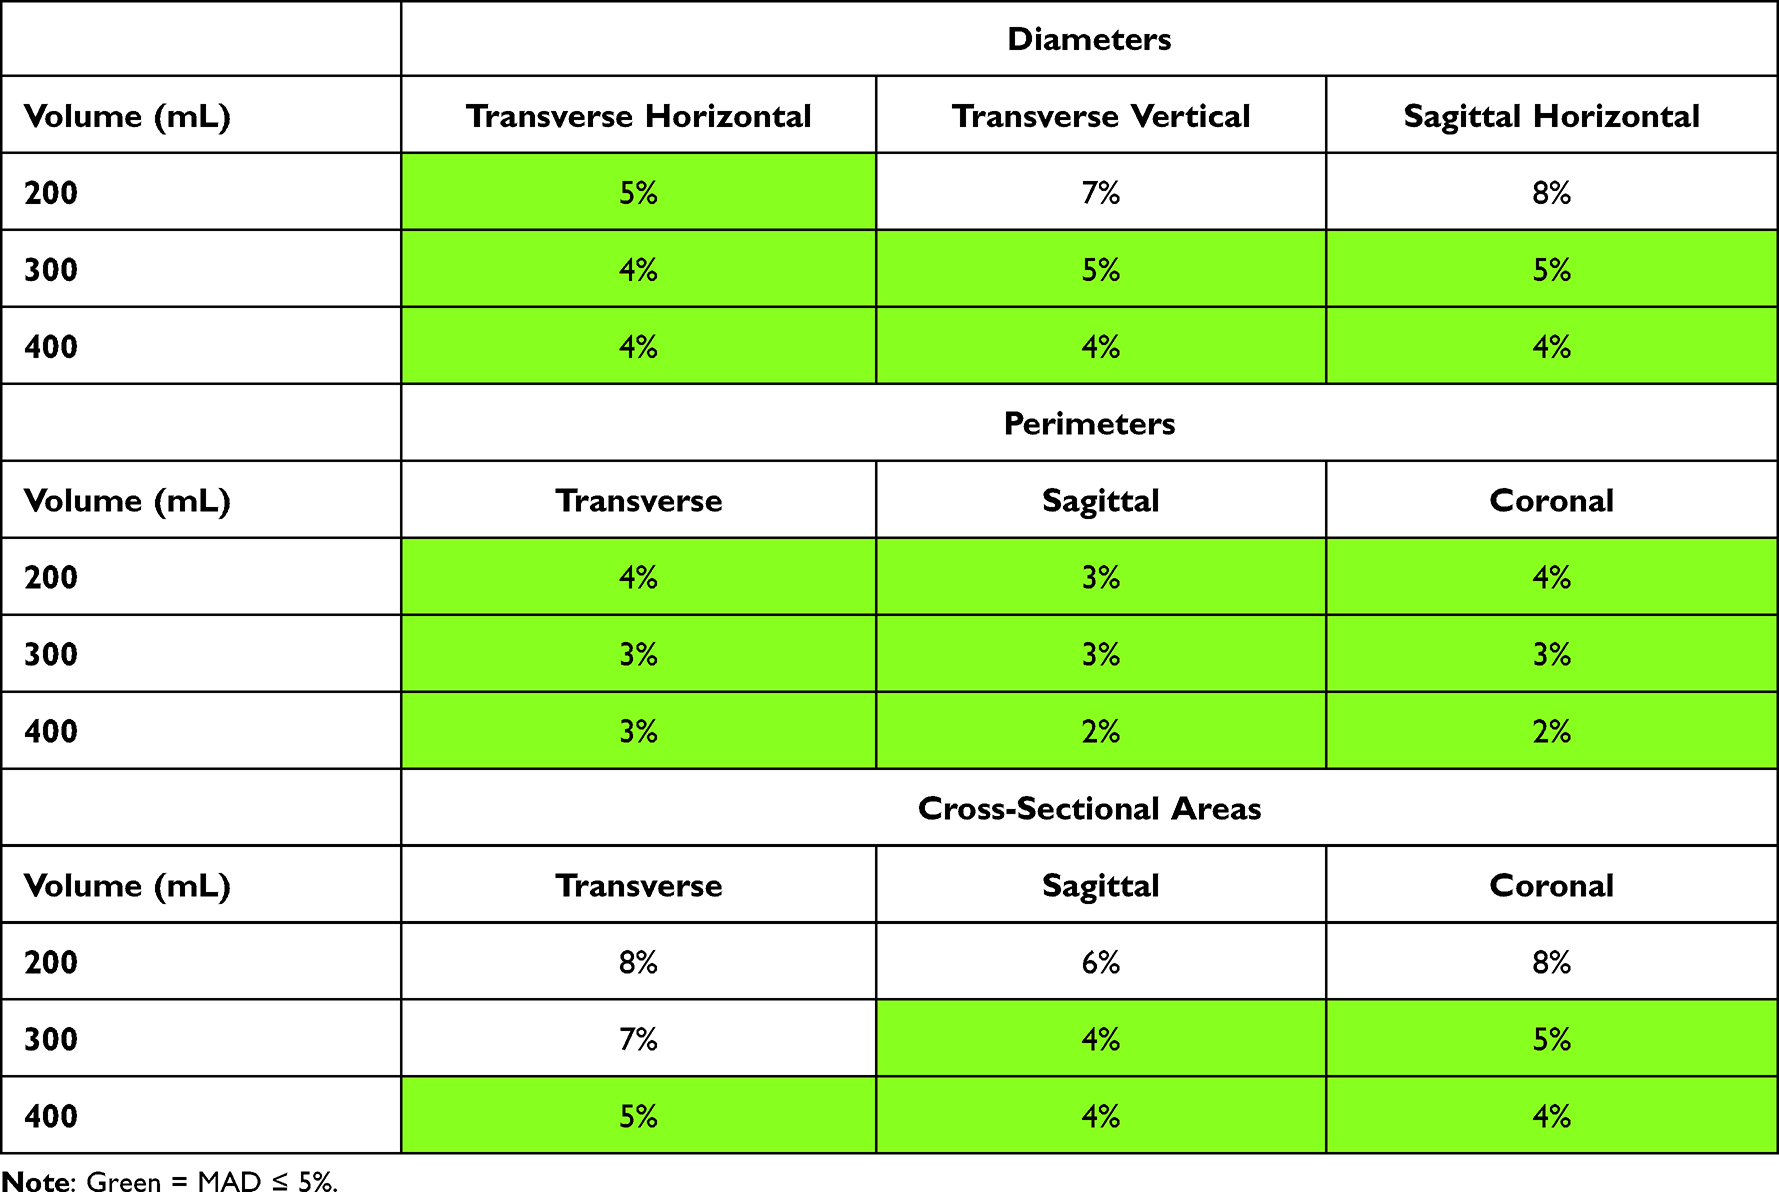 |
Table 3 Normalized Mean Absolute Differences (MADs) for the Shape Metrics at Each Standard Volume (Bold Values) |
Results
Data from 16 healthy participants (9 women and 7 men) were analyzed. ICIq-OAB scores on question 5a were all 0, confirming the absence of urinary urgency symptoms. The average age of the participants was 24.7±1.4 years, and the average BMI was 24.9±1.3 kg/m2. Figure 3 shows an example of 3-D US images and rendered volumes for a bladder at similar volumes from two clinic visits that were one week apart.
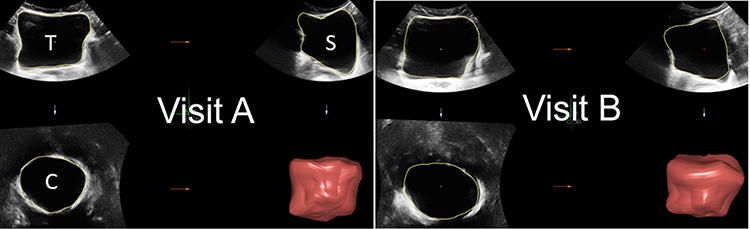 |
Figure 3 Example of 3-D ultrasound images and rendered models of a bladder at similar volumes ((A) 299.2mL, (B) 308.2mL) from two visits one week apart. Abbreviations: T, transverse plane; S, sagittal plane; C, coronal plane. |
Table 2 shows the ICC values at 200, 300, and 400mL (n=11, 12, 10, respectively). ICCs for 18 of 27 of the shape metrics showed moderate or good repeatability (Table 2, green shading, ICC ≥ 0.5). Table 3 shows MADs for the four fills. The MADs were ≤4% for 21/29 (72.4%) shape metrics, including all 9/9 (100%) perimeter measurements (Table 3, green shading), and all MADs were 8% or less. In addition, the ICCs and the MADs were correlated in Figure 4. Despite limited numbers for these correlations (Figure 4, 9 points in each graph), the diameters, perimeters and cross-sectional areas demonstrated negative Pearson correlations (−0.26, −0.44, and −0.78, respectively), as expected, and the correlation for the cross-sectional areas was statistically significant (Figure 4C, *p=0.014). Together, the ICCs and MADs in Tables 2 and 3 and Figure 4 indicate that the repeatability of bladder shape metrics, especially at higher volumes, were consistent through multiple fills and clinic visits.
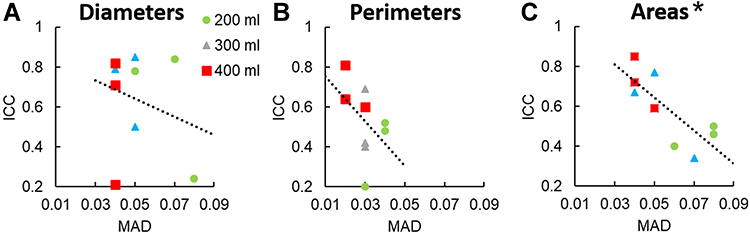 |
Figure 4 Relationships between the Interclass Correlation Coefficients (ICCs) and the Mean Absolute Differences (MADs) for the bladder diameters (A), perimeters (B) and cross-sectional areas (C), with linear trend lines. Pearson correlations between the ICCs and MADs were calculated for each parameter. The *symbol indicates a significant correlation between the ICCs and the MADs for the cross-sectional areas in panel (C), (p=0.014). |
Discussion
The results of this initial study indicate that bladder shape metrics measured from transabdominal 3-D US images are repeatable. The ICCs were typically greater and the MADs were consistently smaller at greater bladder volumes, indicating that bladder shape metrics may have greater repeatability at larger volumes. Furthermore, the perimeters had the smallest MADs across the range of standard volumes, and the cross-sectional areas had the best correlation between the ICCs and the MADs, indicating that these two-dimensional parameters may be more feasible for clinical applications than the one-dimensional diameters.
The present results are consistent with a previous study that showed repeatability of translabial US measures of functional pelvic floor anatomy.21 Another study showed that US-derived bladder wall thickness measurements were not repeatable,22 but bladder wall thickness measurements of only a few millimeters are relatively small compared to bladder perimeter measurements, which are several centimeters for the volumes analyzed in this study.
The current inability to accurately phenotype the pathophysiology involved in some disorders of bladder filling and voiding likely contributes to the dissatisfaction many patients report with available medical therapies, including intolerable side effects and lack of efficacy.23,24 As such, US imaging has the potential to become a quicker, less invasive, and more cost-effective diagnostic tool for evaluating patients with disorders of bladder filling and voiding. Importantly, it provides additional objective data regarding an individual’s bladder geometry which is not obtained using current UDS technology.
Previous studies have shown that some individuals with OAB may have irregular bladder shapes during filling;8,9 however, additional studies are needed to assess the repeatability of bladder shape metrics in individuals with OAB and other forms of bladder filling and voiding dysfunction. Another study showed that bladder shape may change during non-voiding contractions,10 and non-voiding contractions are known to occur in some individuals without OAB.25,26 The present study did not include bladder pressure measurements, so the presence of non-voiding contractions was not assessed. However, bladder shape changes due to non-voiding contractions in some fills but not others would be expected to decrease the repeatability of the measurements.
UDS does not currently allow for the evaluation of bladder geometry or detrusor wall tension. Detrusor wall tension likely has a significant role in the pathophysiology of OAB in some patients.27 Detrusor smooth muscle cells are in series with tension-sensitive afferent nerves in the bladder wall.28 Ideally, the bladder would expand uniformly so that tension would be distributed evenly throughout the bladder wall. Acute or chronic deviations in one’s bladder geometry could create areas of increased wall tension, and potentially contribute to the sensation of heightened urgency.29–31
Limitations of the present study include the small sample size and the use of volunteers without disorders of bladder filling and voiding; however, our power analysis demonstrated adequate numbers. Another potential limitation of the present study was the use of multiple observers to measure the bladder metrics, but there was only one observer per image, so inter-rater repeatability could not be assessed. Future studies enrolling participants with and without OAB and other disorders of bladder filling as well as multiple observers for each US image are needed to comprehensively demonstrate the repeatability of bladder shape metrics.
Conclusion
This study provides initial evidence that ultrasound-based bladder shape diagnostics may be sufficiently repeatable for multiple fills and clinic visits, especially at higher volumes. Future comparative studies will be necessary for potential incorporation of US-based bladder shape diagnostics into non-invasive phenotyping of OAB and other disorders of bladder filling.
Abbreviations
3-D, 3-dimensional; BMI, body mass index; ICC, interclass correlation coefficient; ICIq, International Consultation on Incontinence questionnaire; MAD, mean absolute difference; OAB, overactive bladder; UDS, urodynamics study; US, ultrasound.
Acknowledgments
Funding for this research study was provided by United States National Institutes of Health grant R01DK101719 and by the Virginia Commonwealth University School of Medicine Summer Research Fellowship Program. Virginia Commonwealth University students Suzanne Prince, Sarah Tensen, Naomi Vinod, Hameeda Naimi, Derek Sheen and Hiren Kolli assisted with the hydration studies and/or data analysis for this study. Radiologist Dr. Laura Carucci provided training and technical assistance.
Disclosure
Dr. Adam P Klausner and Dr. John E Speich report ownership interest in Vesi Corporation, which has also licensed their intellectual property, outside the sumbitted work. The authors report no other conflicts of interest in this work.
References
1. Rosier P, Schaefer W, Lose G, et al. International Continence Society good urodynamic practices and terms 2016: urodynamics, uroflowmetry, cystometry, and pressure-flow study. Neurourol Urodyn. 2017;36(5):1243–1260. doi:10.1002/nau.23124
2. Ellerkmann RM, McBride AW, Dunn JS, et al. A comparison of anticipatory and postprocedure pain perception in patients who undergo urodynamic procedures. Am J Obstet Gynecol. 2004;190(4):1034–1038. doi:10.1016/j.ajog.2003.11.006
3. Ku JH, Kim SW, Kim HH, Paick JS, Son H, Oh SJ. Patient experience with a urodynamic study: a prospective study in 208 patients. J Urol. 2004;171(6 Pt 1):2307–2310. doi:10.1097/01.ju.0000125144.82338.0c
4. Okorocha I, Cumming G, Gould I. Female urodynamics and lower urinary tract infection. BJU Int. 2002;89(9):863–867. doi:10.1046/j.1464-410X.2002.02770.x
5. Gammie A, Speich JE, Damaser MS, et al. What developments are needed to achieve less-invasive urodynamics? ICI-RS 2019. Neurourol Urodyn. 2020;39 Suppl 3:S36–S42. doi:10.1002/nau.24300
6. Asimakopoulos AD, De Nunzio C, Kocjancic E, Tubaro A, Rosier PF, Finazzi-Agrò E. Measurement of post-void residual urine. Neurourol Urodyn. 2016;35(1):55–57. doi:10.1002/nau.22671
7. De Nunzio C, Lombardo R, Cicione A, et al. The role of bladder wall thickness in the evaluation of detrusor underactivity: development of a clinical nomogram. Neurourol Urodyn. 2020;39(4):1115–1123.
8. Glass Clark S, Nagle AS, Bernardo R, et al. Use of ultrasound urodynamics to identify differences in bladder shape between individuals with and without overactive bladder. Female Pelvic Med Reconstr Surg. 2020;26(10):635–639. doi:10.1097/SPV.0000000000000638
9. Li R, Nagle AS, Maddra KM, et al. Irregular bladder shapes identified in women with overactive bladder: an ultrasound nomogram. Am J Clin Exp Urol. 2021;9(5):367–377.
10. Gray T, Phillips L, Li W, et al. Evaluation of bladder shape using transabdominal ultrasound: feasibility of a novel approach for the detection of involuntary detrusor contractions. Ultrasound. 2019;27(3):167–175. doi:10.1177/1742271X19834062
11. Chu FM, Dmochowski R. Pathophysiology of overactive bladder. Am J Med. 2006;119(3 Suppl 1):3–8. doi:10.1016/j.amjmed.2005.12.010
12. Abrams P, Avery K, Gardener N, Donovan J, Board IA. The international consultation on incontinence modular questionnaire: www.iciq.net. J Urol. 2006;175(3 Pt 1):
13. Nagle AS, Speich JE, De Wachter SG, et al. Non-invasive characterization of real-time bladder sensation using accelerated hydration and a novel sensation meter: an initial experience. Neurourol Urodyn. 2017;36(5):1417–1426. doi:10.1002/nau.23137
14. Sheen D, Kolli H, Nagle AS, et al. Validation of a real-time bladder sensation meter during oral hydration in healthy adults: repeatability and effects of fill rate and ultrasound probe pressure. Low Urin Tract Symptoms. 2019;11(4):224–231. doi:10.1111/luts.12275
15. Naimi HA, Nagle AS, Vinod NN, et al. An innovative, non-invasive sensation meter allows for a more comprehensive understanding of bladder sensation events: a prospective study in participants with normal bladder function. Neurourol Urodyn. 2019;38(1):208–214. doi:10.1002/nau.23831
16. Sebastian B, Swavely NR, Sethi D, et al. Comparison of sensation event descriptors in participants with overactive and normal bladders during Non-Invasive Hydration Studies. Arch Neph Urol Stud. 2021;1(1):3.
17. Vinod NN, Nagle AS, Naimi HA, et al. Bladder volume correction factors measured with 3D ultrasound and BladderScan. Can J Urol. 2019;26(4):9829–9834.
18. Nagle AS, Bernardo RJ, Varghese J, Carucci LR, Klausner AP, Speich JE. Comparison of 2D and 3D ultrasound methods to measure serial bladder volumes during filling: steps toward development of non-invasive ultrasound urodynamics. Bladder. 2018;5(1):e32.
19. GE Healthcare. 4DView user manual, H48671BL; 2010.
20. Anvari A, Halpern EF, Samir AE. Essentials of statistical methods for assessing reliability and agreement in quantitative imaging. Acad Radiol. 2018;25(3):391–396. doi:10.1016/j.acra.2017.09.010
21. Tan L, Shek KL, Atan IK, Rojas RG, Dietz HP. The repeatability of sonographic measures of functional pelvic floor anatomy. Int Urogynecol J. 2015;26(11):1667–1672. doi:10.1007/s00192-015-2759-9
22. Rachaneni S, McCooty S, Middleton LJ, et al. Bladder ultrasonography for diagnosing detrusor overactivity: test accuracy study and economic evaluation. Health Technol Assess. 2016;20(7):1–150. doi:10.3310/hta20070
23. Reynolds WS, Fowke J, Dmochowski R. The burden of overactive bladder on US public health. Curr Bladder Dysfunct Rep. 2016;11(1):8–13. doi:10.1007/s11884-016-0344-9
24. Dmochowski RR, Newman DK. Impact of overactive bladder on women in the United States: results of a national survey. Curr Med Res Opin. 2007;23(1):65–76. doi:10.1185/030079907X159533
25. Swavely NR, Speich JE, Klausner AP. Artifacts and abnormal findings may limit the use of asymptomatic volunteers as controls for studies of multi-channel urodynamics. Ital J Urol Nephrol. 2020. doi:10.23736/S0393-2249.20.03838-2
26. Bradshaw HD, Radley SC, Rosario DJ, Chapple CR. Towards a better understanding of involuntary detrusor activity. BJU Int. 2005;95(6):799–803. doi:10.1111/j.1464-410X.2005.05404.x
27. Drake MJ, Harvey IJ, Gillespie JI, Van Duyl WA. Localized contractions in the normal human bladder and in urinary urgency. BJU Int. 2005;95(7):1002–1005. doi:10.1111/j.1464-410X.2005.05455.x
28. Fowler CJ, Griffiths D, de Groat WC. The neural control of micturition. Nat Rev Neurosci. 2008;9(6):453–466. doi:10.1038/nrn2401
29. Damaser MS, Lehman SL. The effect of urinary bladder shape on its mechanics during filling. J Biomech. 1995;28(6):725–732. doi:10.1016/0021-9290(94)00169-5
30. Nagle AS, Klausner AP, Varghese J, et al. Quantification of bladder wall biomechanics during urodynamics: a methodologic investigation using ultrasound. J Biomech. 2017;61:232–241. doi:10.1016/j.jbiomech.2017.07.028
31. Habteyes FG, Komari SO, Nagle AS, et al. Modeling the influence of acute changes in bladder elasticity on pressure and wall tension during filling. J Mech Behav Biomed Mater. 2017;71:192–200. doi:10.1016/j.jmbbm.2017.02.020
 © 2022 The Author(s). This work is published and licensed by Dove Medical Press Limited. The full terms of this license are available at https://www.dovepress.com/terms.php and incorporate the Creative Commons Attribution - Non Commercial (unported, v3.0) License.
By accessing the work you hereby accept the Terms. Non-commercial uses of the work are permitted without any further permission from Dove Medical Press Limited, provided the work is properly attributed. For permission for commercial use of this work, please see paragraphs 4.2 and 5 of our Terms.
© 2022 The Author(s). This work is published and licensed by Dove Medical Press Limited. The full terms of this license are available at https://www.dovepress.com/terms.php and incorporate the Creative Commons Attribution - Non Commercial (unported, v3.0) License.
By accessing the work you hereby accept the Terms. Non-commercial uses of the work are permitted without any further permission from Dove Medical Press Limited, provided the work is properly attributed. For permission for commercial use of this work, please see paragraphs 4.2 and 5 of our Terms.