")
Back to Journals » OncoTargets and Therapy » Volume 14
Renal Transcriptomics Reveals the Carcinogenic Mechanism of Ethyl Carbamate in Musalais
Authors Wang W, Han ZJ, Guo D, Xiang Y
Received 12 October 2020
Accepted for publication 18 January 2021
Published 25 February 2021 Volume 2021:14 Pages 1401—1416
DOI https://doi.org/10.2147/OTT.S282125
Checked for plagiarism Yes
Review by Single anonymous peer review
Peer reviewer comments 3
Editor who approved publication: Dr Sanjay Singh
Weihua Wang, ZhanJiang Han, Dongqi Guo, Yanju Xiang
College of Life Science, Tarim University, Xinjiang Uygur Autonomous Region, Alaer City, 843300, People’s Republic of China
Correspondence: ZhanJiang Han
College of Life Science, Tarim University, No. 1188, Military Reclamation Avenue, Xinjiang Uygur Autonomous Region, Alaer City, 843300, People’s Republic of China
Tel +86 18742641847
Email [email protected]
Introduction: Musalais is a traditional fermented wine produced in southern Xinjiang (a province of China) and is protected as a form of national intangible cultural heritage. However, ethyl carbamate (EC), which is naturally produced during the fermentation process, has been shown to induce carcinogenesis and was classified as a group 2A carcinogen by The World Health Organization’s International Agency for Research on Cancer.
Methods: In this work, rats were treated with musalais containing EC at varying contents (0.1, 1, or 10 mg/kg). To evaluate the toxicity of EC in musalais, the liver and kidney of the rats were subjected to transcriptomics sequencing. Differentially expressed genes (DEGs) between treated and untreated rats were identified, and Gene Ontology and Kyoto Encyclopedia of Genes and Genomes enrichment analysis were performed on these genes to investigate the biological functions affected by EC in musalais.
Results: The results demonstrated that high EC content in musalais is possibly involved in the regulation of cytochrome P450 metabolism, chemical carcinogenesis, metabolism of xenobiotics by cytochrome P450, Wnt signaling, and p53 signaling by targeting Mgst1, Gstp1, Gsta5, Gsta1, Adh1, Gsta2, and Ccnd1, thereby inducing cancer.
Conclusion: The present work predicted the potential carcinogenic mechanism of high EC content in musalais, providing a reference for its safety evaluation.
Keywords: musalais, ethyl carbamate, transcriptomics sequencing, toxicity prediction, mechanism research
Introduction
Musalais is a traditional fermented wine produced by the Uygur people in southern Xinjiang of China. As a traditional wine with regional characteristics, musalais is protected under the scope of the national intangible cultural heritage.1 Ethyl carbamate (EC) is naturally produced during the fermentation process of food and alcoholic beverages, especially in wine made from stone fruits.2 It has been demonstrated to induce carcinogenesis and was classified as a group 2A carcinogen by the International Agency for Research on Cancer of the World Health Organization,3–5 resulting in concerns on the safety of EC in fermented wine. Previous studies have demonstrated the carcinogenic potency of EC on lung tumorigenesis.6 In addition. EC-induced consequent mutation and DNA adducts were observed in organs such as mammary glands, liver, ovary, heart, and forestomach.7 EC is produced during the fermentation process of musalais, and its content increases with the duration of fermentation. In recent decades, substantial effort has focused on fermentation characteristics and production engineering,8 but safety control of EC in musalais has attracted minimal attention, and the precise effect of EC in musalais remains to be elucidated.
Transcriptomics, especially gene-array technology, enables the detection of the mRNA levels of multiple genes in parallel. It provides genome-wide information on biological processes and related molecular pathways and is an effective tool for screening compounds in the assessment of toxicological potential. This information can be used to identify biomarkers for compounds and evaluate tissue-specific toxicity, allowing earlier and better prediction of toxicity.9 In this work, rats were treated with musalais containing EC at varying contents (0.1, 1, and 10 mg/kg). To investigate the toxicity of EC in musalais, the liver and kidney of the rats were subjected to transcriptomic sequencing (RNA-seq). Differentially expressed genes (DEGs) were identified and Gene Ontology (GO) and Kyoto Encyclopedia of Genes and Genomes (KEGG) enrichment analyses were performed on these DEGs to examine the important biological functions affected by EC in musalais. Furthermore, the key disease-related biomarkers of EC in musalais were predicted.
Materials and Methods
Ethical Statement
Experiments involving rats were approved by the Institutional Review Board of Wuhan Myhalic Biotechnology Co., Ltd. based on the ethical Guidelines for Animal Care and Use of the Model Animal Research Institute (approve number: HLK-20181209-01).
Animals and Experimental Design
Sixteen healthy Sprague Dawley rats aged 8–10 weeks were purchased from the Hubei Provincial Center for Disease Control and Prevention. The rats were randomly divided into four groups (4 rats per group): control (Con), High, Middle (Mid), and Low. Rats in the Con group were fed normally without any treatment. Rats in the High, Mid, and Low groups were subjected to intragastric administration of musalais containing 10 mg/kg, 1 mg/kg, and 0.1 mg/kg EC, respectively, once a day (2 mL each time) for a week. Musalais was spiked with varying EC concentrations to achieve total content of 0.1, 1, and 10 mg/kg in the Low, Mid, and High groups, respectively. Thereafter, the rats were anesthetized and sacrificed to obtain the liver (L) and kidney (K). The collected tissues were maintained at −80 °C for subsequent sequencing.
Preparation of Musalais Containing EC
EC (Dr. Ehrenstorfer, Germany; purity ≥99.4%) was diluted in musalais and its the concentration was determined by gas chromatography-mass spectrometry using a GCMS-QP2010 Plus apparatus (Shimadzu, Japan). Briefly, 1 μL of sample was injected into a DB-WAX chromatographic column (30 mm × 0.25 mm, 0.25 μm, Agilent, USA). The initial column temperature was 100 °C and increased to 120 °C at a rate of 50 °C/min, then held at 120 °C for 5 min and increased to 200 °C at a rate of 50 °C/min and maintained for 1.5 min. High-purity helium gas (>99.999%) with a flow rate of 1.0 mL/min was used as the carrier gas. Mass spectrometry was performed in selected-ion monitoring mode with a transfer line at 280 °C, electron voltage of 70 eV, and source temperature of 230 °C.
Liver and Kidney Transcriptomic Analysis
Total RNA was extracted from kidney and liver tissues using TRIzol reagent (Invitrogen, Carlsbad, CA, USA) and purified using the Total RNA Purification Kit (TRK1001, LC Science, Houston, TX, USA) following the manufacturer’s procedure. RNA content and purity were quantified using a NanoDrop ND 1000 apparatus (NanoDrop, Wilmington, DE, USA). The RNA integrity number was assessed to be greater than 7.0 using the Agilent 2100 Bioanalyzer (Agilent, CA, USA). mRNA was purified from total RNA using poly-T oligo-attached magnetic beads with two rounds of purification. The purified mRNA was fragmented into small pieces using divalent cations at high temperature. Cleaved RNA fragments were reverse-transcribed into cDNA according to the protocol of the mRNA-Seq sample preparation kit (Illumina, San Diego, USA). The average insert size for the final cDNA library was 250–350 bp. Next-generation sequencing was performed on 150-bp paired-end reads in the library using an Illumina Hiseq 4000 sequencing platform at LC Bio (Hangzhou, China).
Data Analysis
Valid data were collected by removing reads including sequencing adaptors and sequencing primers and nucleotide with quality scores (Q) of lower than 20 from raw data obtained using the Illumina paired-end RNA-seq approach. In addition, the content of Q20 (Q ≥ 20) and Q30 (Q ≥ 30) and the GC content of valid data were calculated. All subsequent analyses were carried out using valid data. Valid data were mapped to the UCSC reference genome of rattus norvegicus (http://genome.ucsc.edu/) using the HISAT package10 and the mapped reads were assembled using StringTie software.11 Perl scripts were used to reconstruct a comprehensive transcriptome, and the fragment per kilobase of exon model per million mapped reads (FPKM) was calculated as the gene expression level for each sample using StringTie. The distribution statistics of the FPKM of genes were visualized as boxplots using R software (version 3.5.2).
Differential Expression Analysis
Differential expression analysis was performed on the FPKM values of the untreated and treated groups using the edgeR package. DEGs were identified using the following criteria: genes between Con and High/Mid/Low groups displaying |log2(fold change)| ≥ 1 and p < 0.05. The identified DEGs were visualized using volcano plots generated by R software (version 3.5.2). For hierarchical clustering, the data were Z-normalized by gene, and the Euclidean distance was chosen as the similarity to cluster expression profiles.12 The results of cluster analysis were visualized using R software (version 3.5.2). The Gene Ontology (GO) (http://geneontology.org/) and Kyoto Encyclopedia of Genes and Genomes (KEGG) (https://www.kegg.jp/kegg/) databases were used to examine the enriched GO terms and pathway associated with the DEGs. GO terms and pathways with p < 0.05 were considered as statistically significant.
Results
Preliminary Analysis of Transcriptomics Sequencing Data
A total of 16 RNA-seq libraries were constructed using RNA samples from kidney and liver tissues extracted from both treated and untreated rats. The raw reads, raw bases, valid reads, valid bases, Q20, Q30, and GC percentage were collected from each library. As shown in Table 1, Q20 > 99%, Q30 > 97%, and GC content ranged from 48% to 50%. These results demonstrated the high quality of the transcriptomic sequencing data and guaranteed the reliability of subsequent analysis. In addition, the FPKM values for each library are shown in Table 2 and visualized by boxplots (Figure 1). The boxplot for each region corresponds to the maximum, upper quartile, median, lower quartile, and minimum FPKM from top to bottom. The FPKM values of liver tissue were similar among all groups, while there were differences between groups in kidney tissues. The FPKM values in both liver and kidney tissues were similar between parallel groups, indicating the excellent reproducibility of the samples.
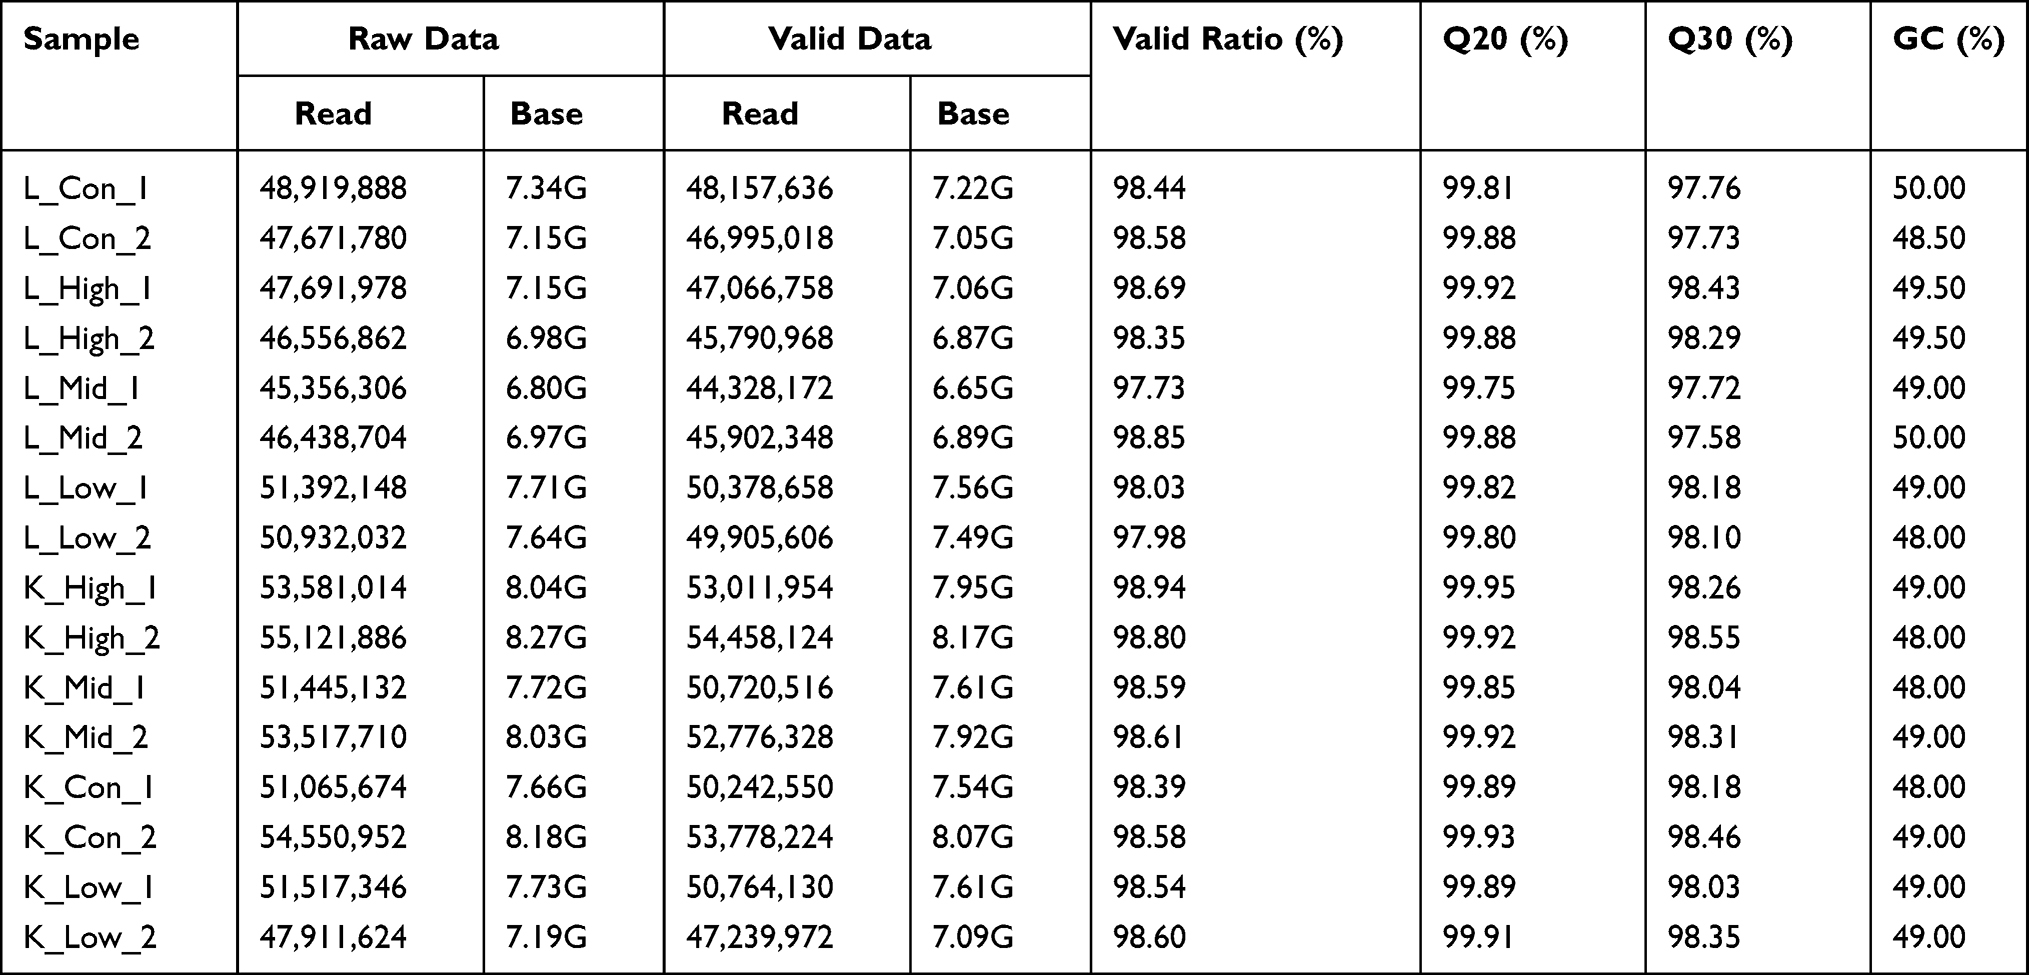 |
Table 1 Sample Details from RNA-Sequencing |
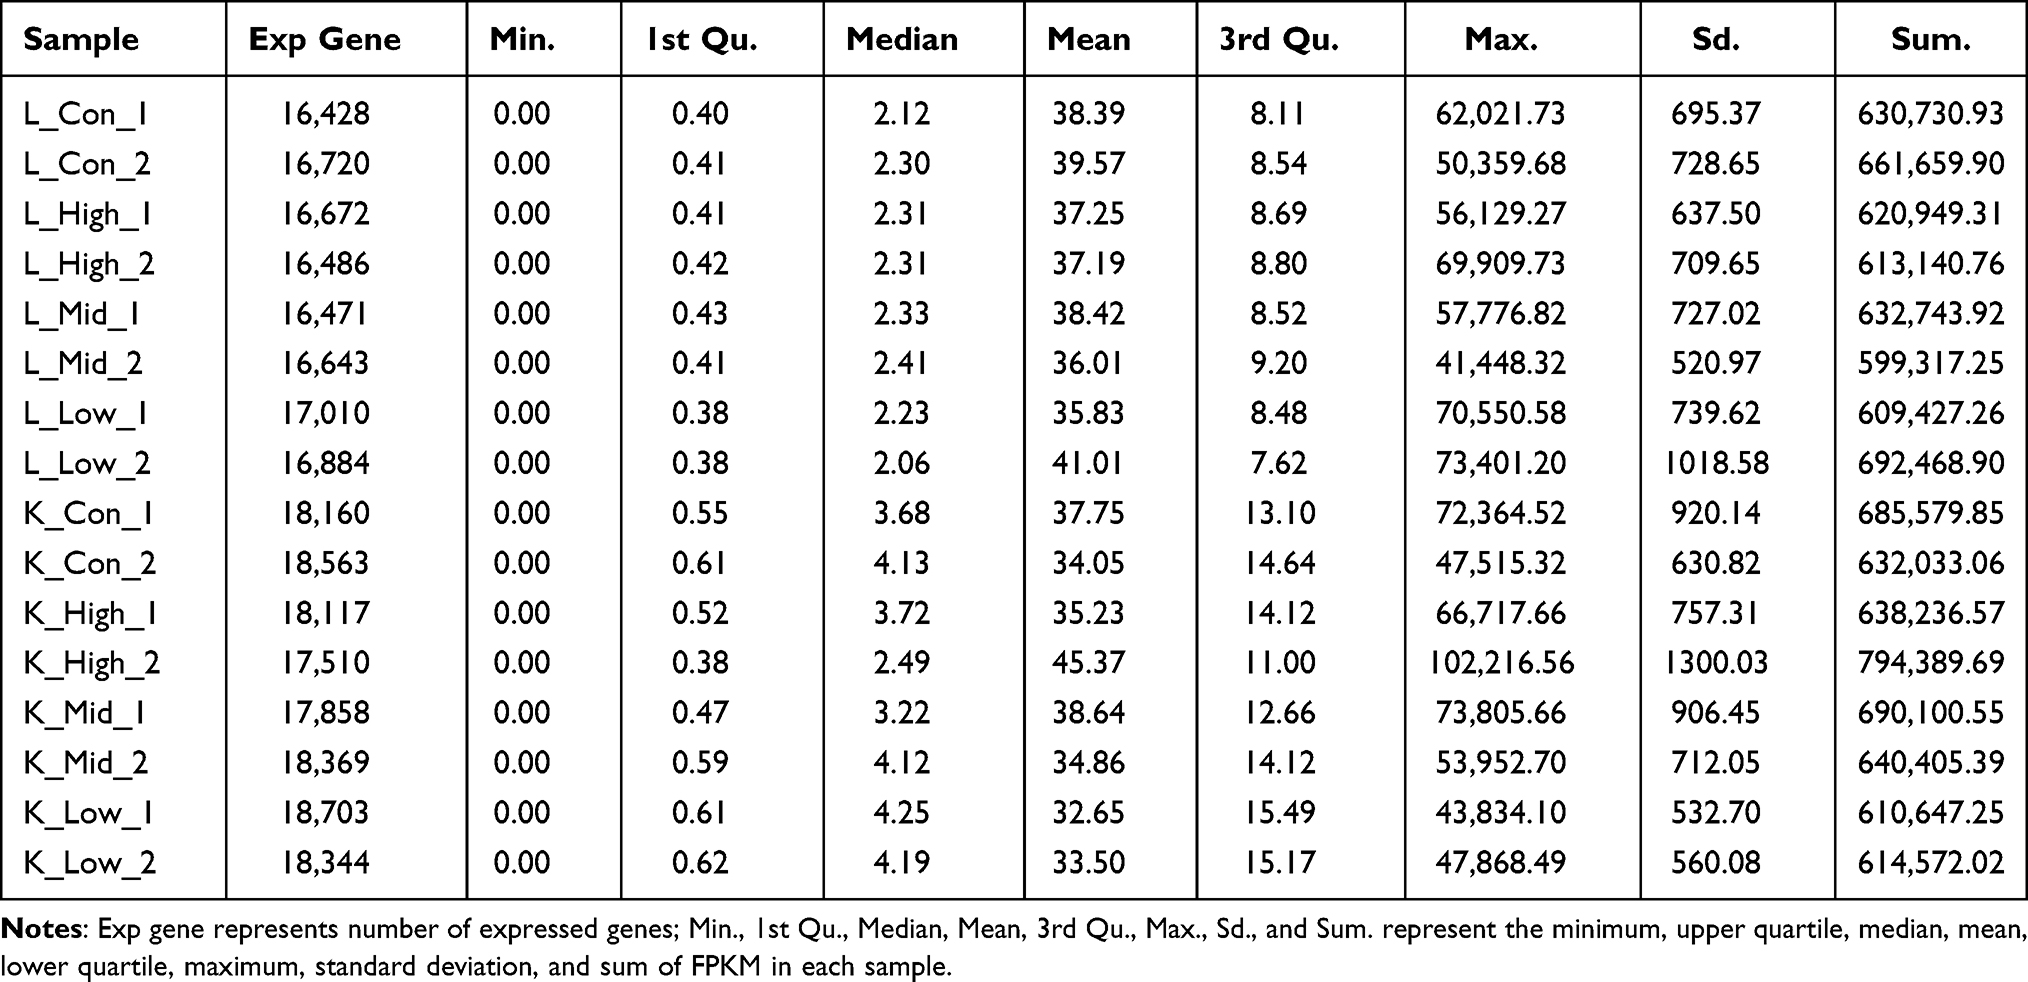 |
Table 2 Distribution Statistics of FPKM Values of Genes |
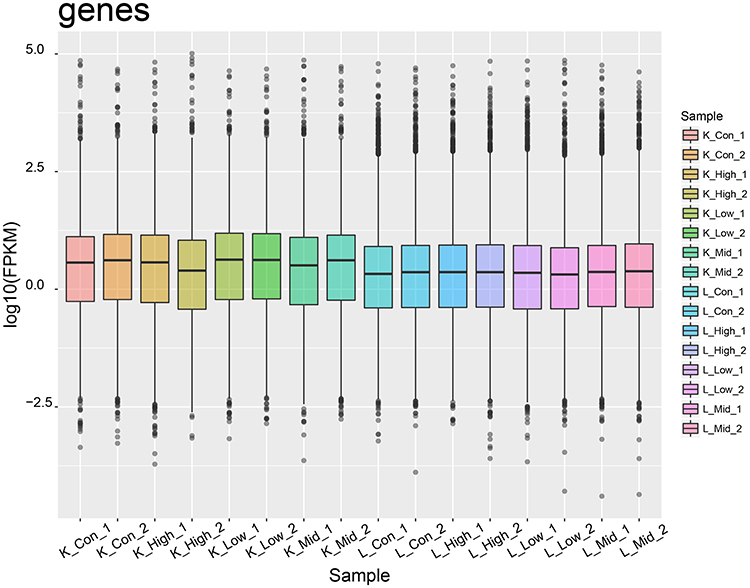 |
Figure 1 FPKM value for each library. The boxplot for each region corresponds to maximum, upper quartile, median, lower quartile, and minimum FPKM from top to bottom. FPKM, fragments per kilobase of exon model per million mapped reads. |
Identification of DEGs
To better understand the effect of EC in musalais, rats were treated with musalais containing EC at varying contents. DEGs were identified in liver and kidney tissues by comparing the FPKM values in the High/Mid/Low groups with those in the Con group, using the criteria |log2(fold change)| ≥ 1, false discovery rate < 0.05, and statistical difference p < 0.05. DEGs with statistical differences (Supplementary 1) were illustrated using volcano plots (Figure 2, up-regulated genes are highlighted in red, down-regulated genes are highlighted in blue, and genes showing no difference are highlighted in grey) and counted (Figure 3). The kidney tissues in the High group showed the highest number of DEGs, with 435 up-regulated (Red) and 1877 down-regulated (Blue) genes. The complete list of DEGs is shown in Supplementary 2. Hierarchical clustering (unsupervised), performed to analyze the DEGs, clearly described the separation within the shortlisted genes in the respective groups and demonstrated the different patterns in liver (Figure 4) and kidney (Figure 5) tissues between treated and untreated rats.
 |
Figure 2 Volcano plots of the DEGs. Up-regulated genes are shown in red and down-regulated genes are shown in blue. Genes that showed no difference are shown in grey. DEGs, differentially expressed genes. |
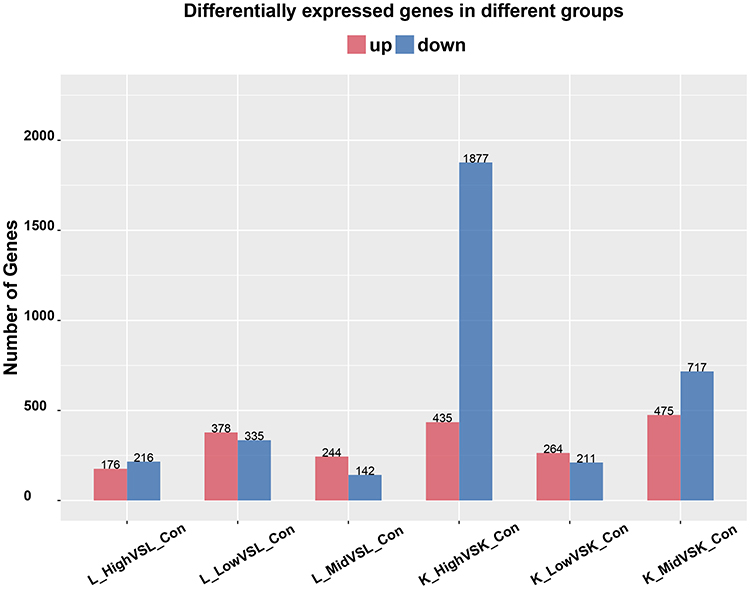 |
Figure 3 Number of DEGs. Red represents the number of up-regulated genes and blue represents the number of down-regulated genes. DEGs, differentially expressed genes. |
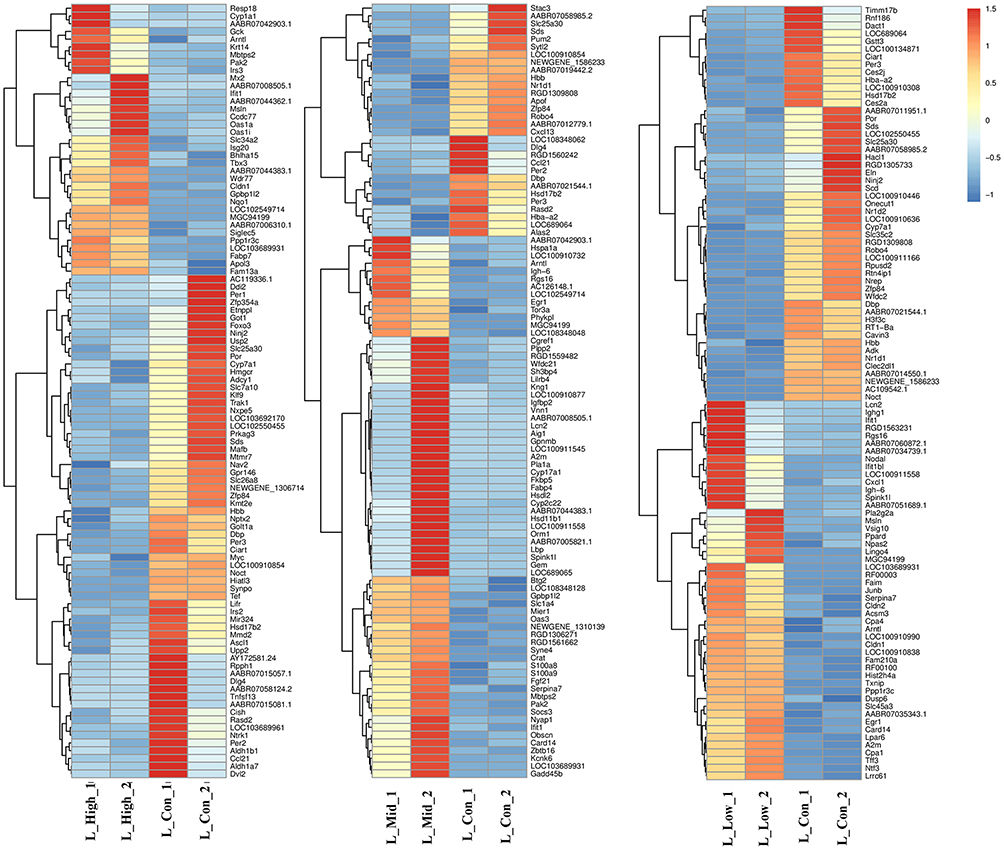 |
Figure 4 Cluster analysis of the DEGs in liver samples. Orange indicates that gene expression is up-regulated. Blue indicates that gene expression is down-regulated. The color intensity indicates the degree of up- or down-regulation. DEGs, differentially expressed genes. |
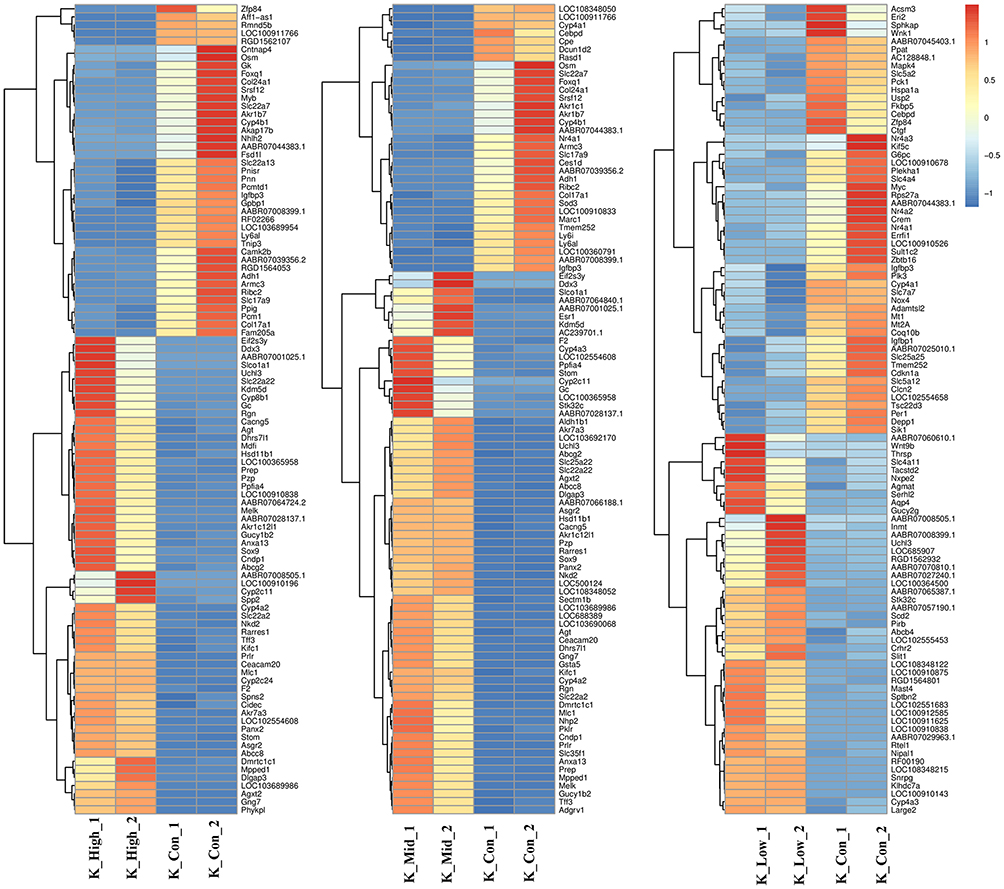 |
Figure 5 Cluster analysis of the DEGs in kidney samples. Orange indicates that gene expression is up-regulated. Blue indicates that gene expression is down-regulated. The color intensity indicates the degree of up- or down-regulation. DEGs, differentially expressed genes. |
GO Enrichment and KEGG Pathway Enrichment Analysis of DEGs
Comparing the biological function of the DEGs in the High and Mid groups with those in the Low group clearly revealed the effect of high EC content in musalais. The biological functions of a gene can be defined using three GO categories: biological process, molecular function, and cellular component. Figures 6 and 7 show the number of DEGs associated with various GO terms in liver and kidney tissues, respectively. The GO annotations indicated that the key subcategories in each group were similar in the liver and kidney, ie, cytoplasm, nucleus, integral component of membrane, and extracellular exosome.
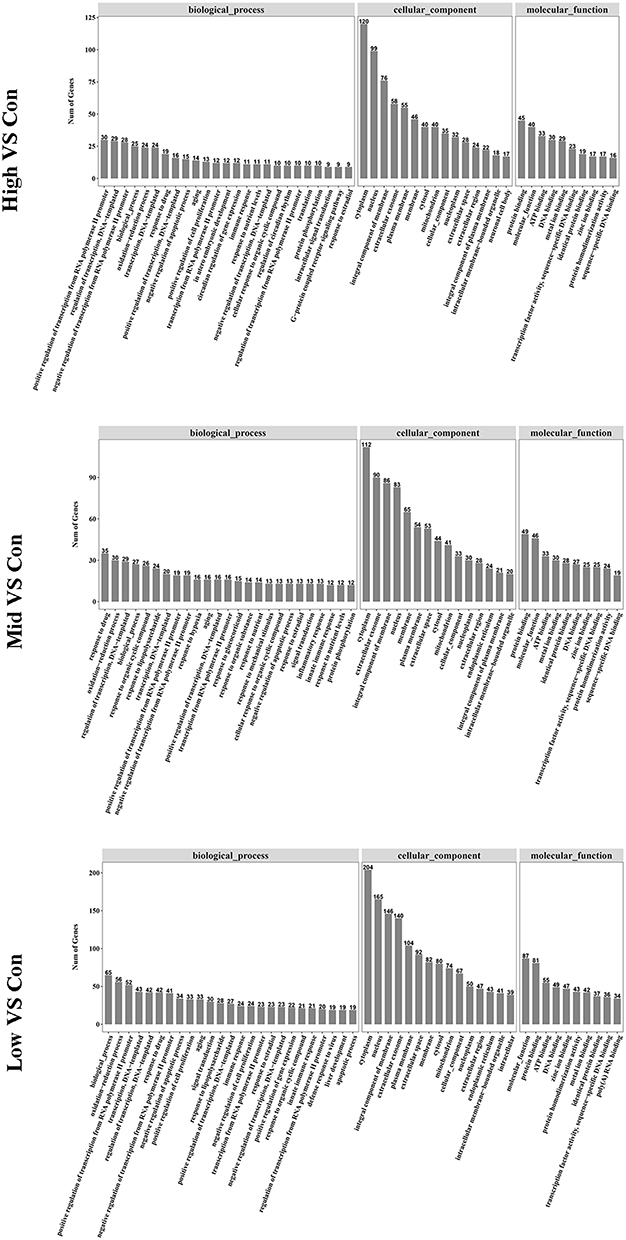 |
Figure 6 GO subcategories of the DEGs in liver samples. GO, Gene Ontology; DEGs, differentially expressed genes. |
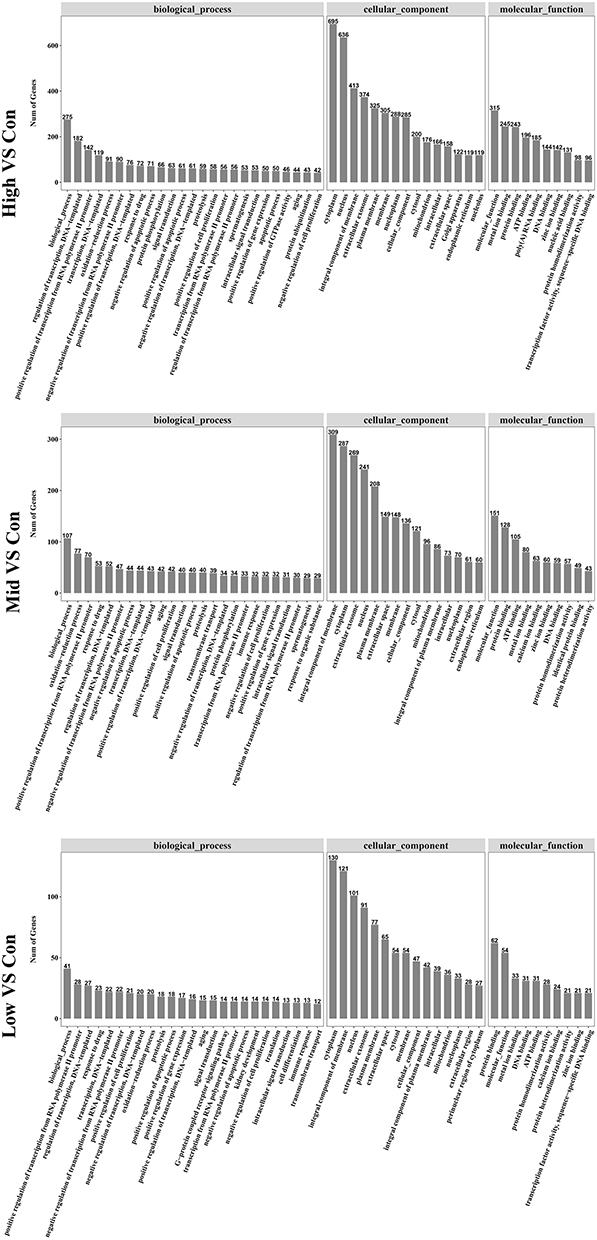 |
Figure 7 GO subcategories of the DEGs in kidney samples. GO, Gene Ontology; DEGs, differentially expressed genes. |
To better understand the biological effect of high EC content in musalais, KEGG pathway enrichment was analyzed based on the DEGs. The details of the predicted pathways are listed in Supplementary 3 and the enrichment plots of the top 20 KEGG pathways are displayed in Figure 8. For liver tissues, compared to the Low group, there was no regular pattern in the predicted KEGG pathways showing statistical differences (p < 0.05) in both High and Mid groups. However, for kidney tissues, all pathways with p < 0.05 were found in the High and Mid groups but not in the Low group. Specifically, these pathways were drug metabolism – cytochrome P450, chemical carcinogenesis, metabolism of xenobiotics by cytochrome P450, Wnt signaling pathway, and p53 signaling pathway, indicating that high EC content in musalais could affect metabolic and biological processes in rats by modulating these pathways. Further Venn diagram analysis demonstrated that in the High group, 11 genes (Atad1, Gsta5, Gsta3, Ugt2a3, Gstp1, Gsta2, Adh1, Gsta1, Gsto2, Mgst1, and RGD1562107) were simultaneously enriched in drug metabolism – cytochrome P450, chemical carcinogenesis, and metabolism of xenobiotics by cytochrome P450 pathways and one gene (Ccnd1) was enriched in both Wnt and p53 signaling pathway (Figure 9A and Table 3). In the Mid group, 10 genes (AABR07014550.1, Mgst1, Aldh1a3, Gstp1, Gsta5, Gsta1, Gstt2, Adh1, and Gsta2) were simultaneously enriched in drug metabolism – cytochrome P450, chemical carcinogenesis, and metabolism of xenobiotics by cytochrome P450 pathways and one gene (Ccnd1) was enriched in both Wnt and p53 signaling pathway (Figure 9B and Table 4). Among these genes, Mgst1, Gstp1, Gsta5, Gsta1, Adh1, Gsta2, and Ccnd1 were simultaneously observed in the High and Mid groups. These results suggested that high EC content in musalais could affect metabolic and biological processes in rats by regulating the expression of Mgst1, Gstp1, Gsta5, Gsta1, Adh1, Gsta2, and Ccnd1.
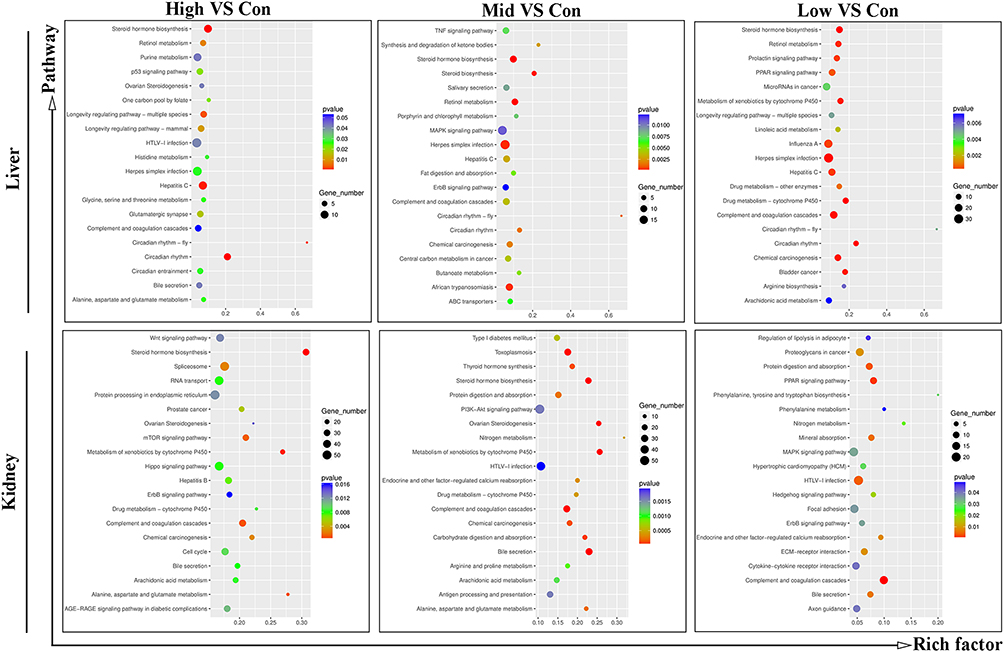 |
Figure 8 KEGG enrichment plots for top 20 pathways in each treatment group. KEGG, Kyoto Encyclopedia of Genes and Genomes. |
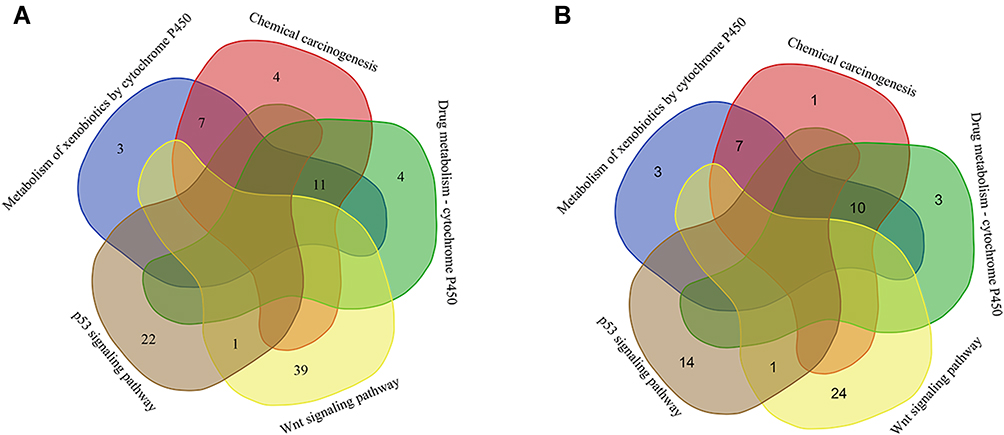 |
Figure 9 Comparison of enriched DEGs in the specific KEGG pathways in High (A) and Mid (B) groups of kidney tissues. The numbers of DEGs enriched in the corresponding pathway are indicated. DEGs, differentially expressed genes. KEGG, Kyoto Encyclopedia of Genes and Genomes. |
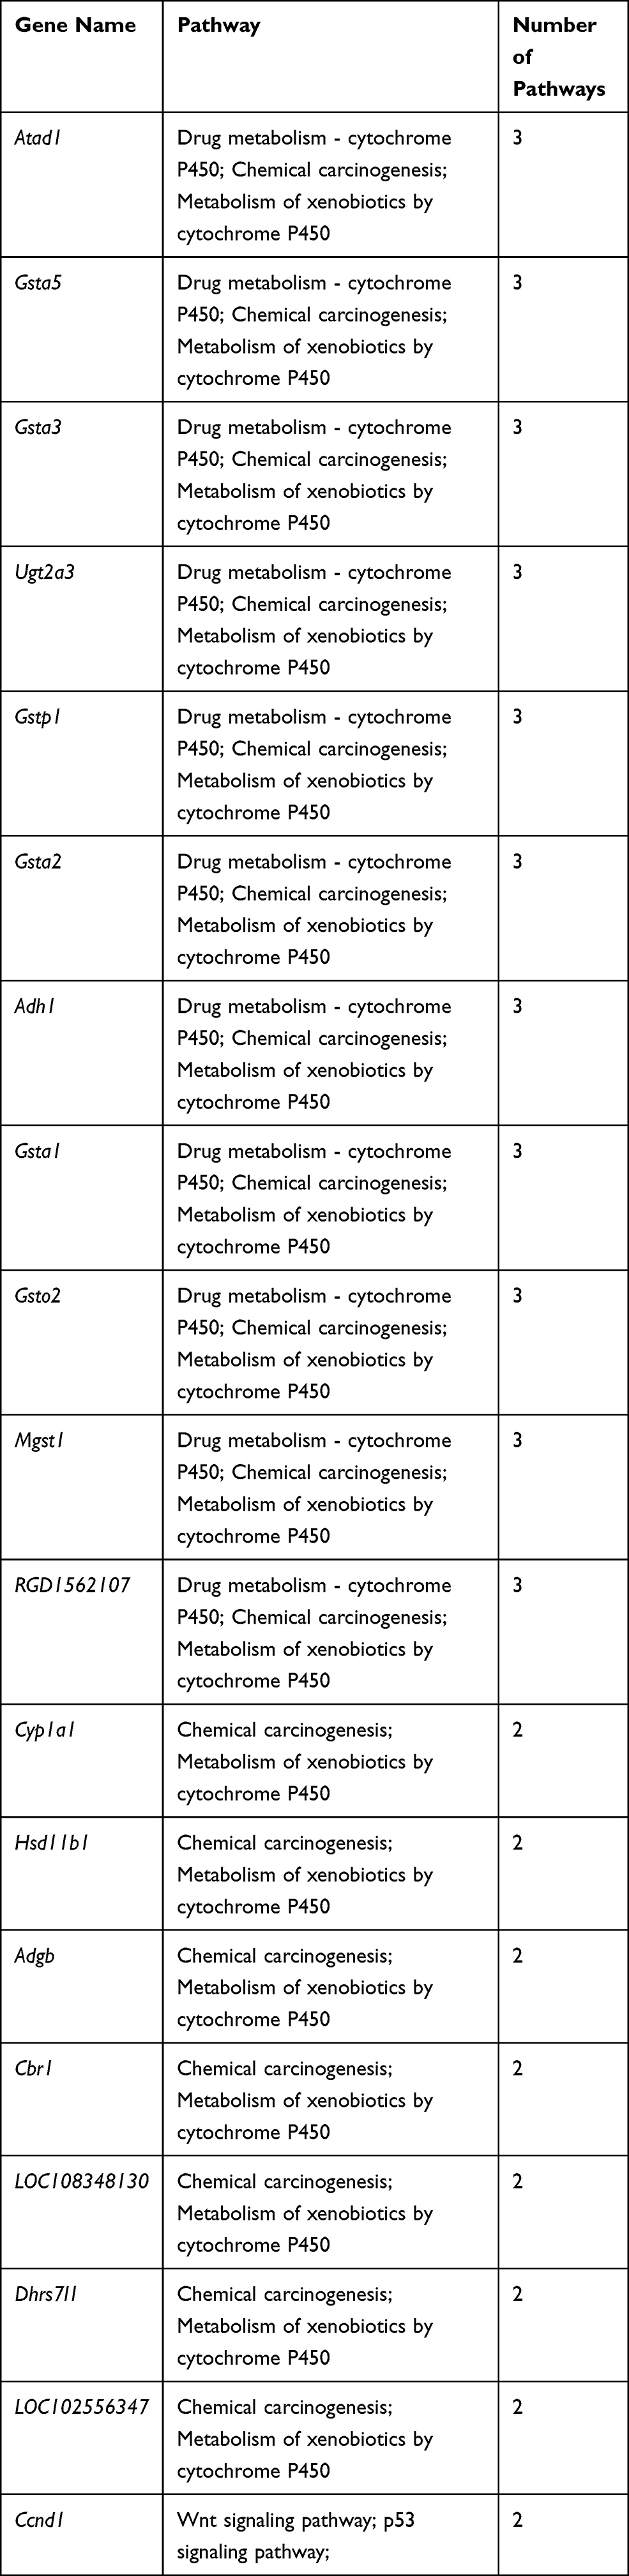 |
Table 3 Identification of Genes Enriched in Similar Pathways in High Kidney Group |
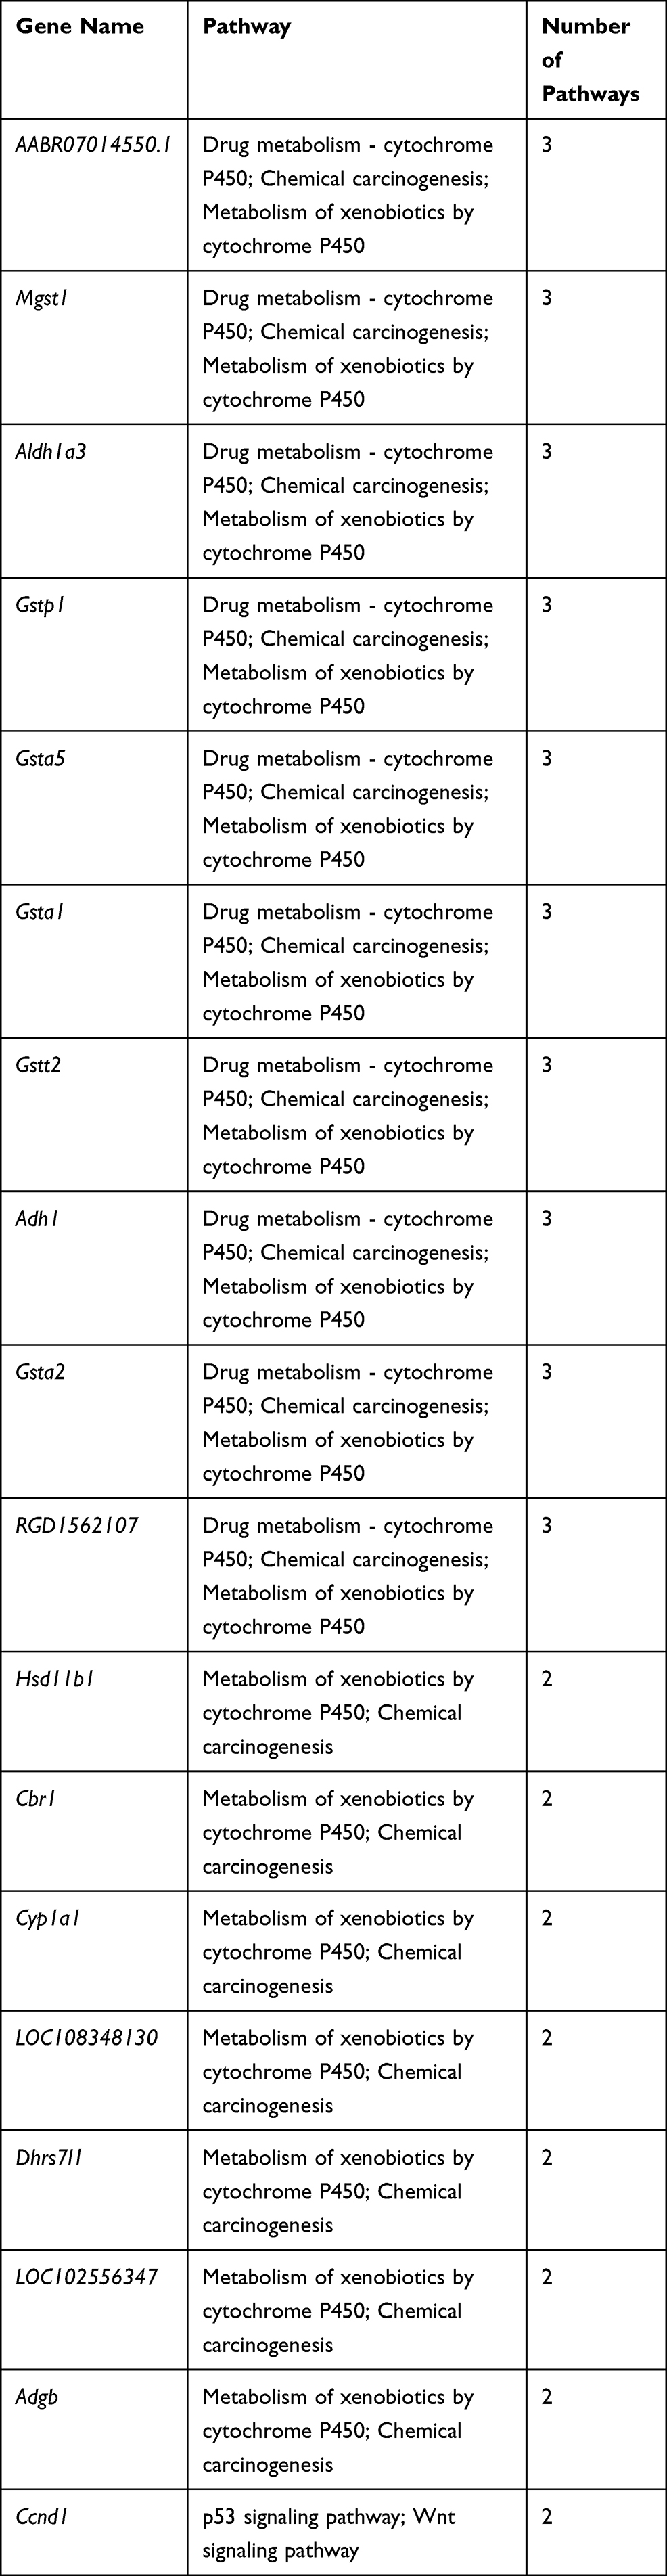 |
Table 4 Identification of Genes Enriched in Similar Pathways in Mid Kidney Group |
Discussion
Musalais is a unique wine brewed by the local people in southern Xinjiang in China. With a history of more than 2000 years, it is an indispensable part of the local culture and has been protected as a form of intangible human cultural heritage since 2007, contributing substantially to the development of local tourism and economy.1,13,14 Musalais is produced through natural fermentation, resulting in the generation of EC,15–17 also known as urethane. EC is an ethyl ester of carbamic acid and is mainly synthesized via the metabolism of urea and citrulline during the fermentation process.18 Accumulating evidence has demonstrated the carcinogenic effect of EC in organs such as the liver, lung, lymph, skin, and breast.19–21 In addition, Lajovic et al demonstrated the carcinogenesis of vinyl carbamate epoxide, the ultimate carcinogen of EC metabolism,22 through both experimentally and quantum chemical simulations.23 Thus, many countries including Canada,24 the USA,25 Brazil,26 and South Korea27 have set a maximum residue level for EC in fermented beverages. Despite that high levels of EC are found in many regularly consumed Chinese alcoholic beverages, no regulation has been implemented on EC,28 and safety assessment has not been conducted on EC in alcoholic beverages.
In this work, transcriptome sequencing was performed to analyze the effects of musalais containing varying amounts of EC on gene expression in rat liver and kidney, the major organs involved in metabolism and detoxification. In addition, the biological functions of the identified DEGs were examined. Although plenty of studies demonstrated that alcohol influences gene expression in the liver and kidney,29,30 the alcohol content in each EC treatment group in the current study was the same, resulting in similar effects on gene expression. Thus, the effect of alcohol can be excluded. GO enrichment analysis based on DEGs demonstrated that the key subcategories in the liver and kidney were similar between groups, ie, cytoplasm, nucleus, integral component of membrane, and extracellular exosome. However, KEGG pathway analysis revealed that drug metabolism – cytochrome P450, chemical carcinogenesis, metabolism of xenobiotics by cytochrome P450, Wnt signaling pathway, and p53 signaling pathway were only found in the High and Mid groups but not in the Low group in kidney tissues. Comparing the biological functions of DEGs in the High and Mid groups to those in the Low group clearly revealed the effect of high EC content in musalais on rats. Cytochrome P450, a heme-mercaptide protein, is involved in the metabolism of endogenous substances such as steroids, acids, prostaglandins, and unsaturated fats and exogenous substances including drugs, natural compounds, and carcinogens.28,31,32 A defense system centered on the heme protein cytochrome P450 protects organisms from toxic compounds.33,34 However, cytochrome P450-mediated biotransformation could lead to the metabolic activation of environmental chemicals into active carcinogens.34 For instance, cytochrome P450 promotes the metabolism of aflatoxin B1, which is known as the most potent natural carcinogen to humans.35 Studies on the carcinogenic mechanism of EC have shown that its metabolism in biological systems is mainly related to cytochrome P450. Specifically, EC can be reversibly converted by P450 to ethyl N-hydroxycarbamate, a proximate on ultimate carcinogenic metabolite of ethyl carbamate.36 In addition, EC is oxidized by cytochrome P450 to vinyl-carbamate, followed by the formation of methyl epoxyethylene formate. This epoxide forms an addition polymer with DNA, RNA, and proteins in vivo, resulting in damage to the double-stranded structure of DNA and thus leading to cellular carcinogenesis.37,38 Previous studies have found that DNA damage resulted in the activation p53. DNA damage regulates p53 partially through signaling pathways involving sensor kinases including checkpoint kinase-1/2 and the Wee1 kinase. This results in the transcriptional regulation of a variety of genes involved in apoptosis and cell cycle control,39 thereby modulating cancer progression. Inversely, p53 signaling is involved in cancer progression by regulating DNA damage and biological processes such as cell cycle progression, apoptosis, metabolism, senescence, and programmed necrosis.40,41 As a tumor suppressor, p53 is prone to inactivation by destabilizing mutations, resulting in tumor development.41,42 Research has revealed that the Wnt signaling pathway participates in both tissue homeostasis and development through modulation of endogenous stem cells.43 Abnormalities in Wnt signaling have been shown to play critical roles in the occurrence and/or development of many tumors.43 Collectively, our findings suggested that high EC content in musalais could play a carcinogenic role or affect metabolic and biological processes in rats by regulating these pathways.
Venn diagram analysis of the KEGG pathways and enriched DEGs indicated that Mgst1, Gstp1, Gsta1, Gsta2, Gsta5, and Adh1 were concurrently enriched in drug metabolism – cytochrome P450, chemical carcinogenesis, and metabolism of xenobiotics by cytochrome P450 pathways in both High and Mid groups. Among these, Ccnd1 was concurrently enriched in Wnt and p53 signaling pathways. Both Mgst144 and Gstp145 have been demonstrated to exert important functions in oxidative stress and tumorigenesis. Gsta1 is a Phase II detoxification enzyme involved in the biological progression of colorectal, lung, prostate, and bladder cancer,46 and the relationship between cancer and Gsta2,47 Gsta5,48 and Adh148 has been reported. Ccnd1 belongs to the highly conserved cyclin family, whose members are characterized by abundant expression during the cell cycle.49 In turn, Ccnd1 has been associated with Wnt50 and p53 signaling51 in affecting the biological progression of tumors. These genes are helpful in understanding the biological response of rats to high EC content in musalais.
Overall, our work predicted that high EC content in musalais possibly induces cancer or affects metabolic and biological processes by regulating cytochrome P450 metabolism, chemical carcinogenesis, metabolism of xenobiotics by cytochrome P450, Wnt signaling pathway, and p53 signaling pathway. This may be achieved by targeting Gstp1, Gsta5, Gsta1, Adh1, Gsta2, and Ccnd1, as revealed by transcriptomic sequencing. The findings provide a useful reference for the safety evaluation of musalais. The limitation of the current study is that only two RNA-seq libraries were constructed in each group, which might increase the random error of statistical analysis. Future research will aim to address this issue by implementing methods to minimize random statistical error. Prospective studies will also be designed to evaluate the effect of high EC content in musalais on the metabolic and biological processes of rats and investigate whether the underlying mechanism is mediated by the pathways and genes identified in this research.
Acknowledgments
This work was supported by the National Natural Science Foundation of China (No. 31360409, 31471667, and 31660489), Program for Yong and Middle-aged Leading Talents of China Xinjiang Production and Construction Corps (2017CB009), and Selection and Cultivation Project of “Talents of Xinjiang production and Construction Corps”.
Author Contributions
All authors made a significant contribution to the work reported, whether that is in the conception, study design, execution, acquisition of data, analysis and interpretation, or in all these areas; took part in drafting, revising or critically reviewing the article; gave final approval of the version to be published; have agreed on the journal to which the article has been submitted; and agree to be accountable for all aspects of the work.
Disclosure
The authors report no conflicts of interest in this work.
References
1. Zhu LX, Hou XJ, Xu Q. Discussion on Development Strategies of Xinjiang Msalais Grape Wine. Liquor-Making Sci Technol. 2008;7:111–113.
2. Lee JG, Park SK, Yoon HJ, et al. Exposure assessment and risk characterisation of ethyl carbamate from Korean traditional fermented rice wine, Takju and Yakju. Food Addit Contam Part a Chem Anal Control Expo Risk Assess. 2016;33(2):207–214. doi:10.1080/19440049.2015.1124460
3. IARC. IARC monographs on the evaluation of carcinogenic risks to humans. Available from: http://monographsiarcfr/ENG/Monographs/vol96/indexphp. 2010.
4. Parashar P, Tripathi CB, Arya M, et al. A facile approach for fabricating CD44-targeted delivery of hyaluronic acid-functionalized PCL nanoparticles in urethane-induced lung cancer: BCL-2, MMP-9, caspase-9, and BAX as potential markers. Drug Deliv Transl Res. 2019;9(1):37–52. doi:10.1007/s13346-018-0575-8
5. Chen T, Lu L, Xu C, et al. Inhibition Role of Atherogenic Diet on Ethyl Carbamate Induced Lung Tumorigenesis in C57BL/6J Mice. Sci Rep. 2017;7(1):4723. doi:10.1038/s41598-017-05053-1
6. Forkert PG. Mechanisms of lung tumorigenesis by ethyl carbamate and vinyl carbamate. Drug Metab Rev. 2010;42(2):355–378. doi:10.3109/03602531003611915
7. Gowd V, Su H, Karlovsky P, et al. Ethyl carbamate: an emerging food and environmental toxicant. Food Chem. 2018;248:312–321. doi:10.1016/j.foodchem.2017.12.072
8. Zhu L, Xue J. Modern technology homogenizes enological traits of indigenous Saccharomyces cerevisiae strains associated with Msalais, a traditional wine in China. World J Microbiol Biotechnol. 2017;33(3):63. doi:10.1007/s11274-017-2227-4
9. Corvi R, Vilardell M, Aubrecht J, et al. Validation of Transcriptomics-Based In Vitro Methods. Adv Exp Med Biol. 2016;856:243–257.
10. Kim D, Langmead B, Salzberg SL. HISAT: a fast spliced aligner with low memory requirements. Nat Methods. 2015;12(4):357–360. doi:10.1038/nmeth.3317
11. Pertea M, Pertea GM, Antonescu CM, et al. StringTie enables improved reconstruction of a transcriptome from RNA-seq reads. Nat Biotechnol. 2015;33(3):290–295. doi:10.1038/nbt.3122
12. Altmae S, Segura MT, Esteban FJ, et al. Maternal Pre-Pregnancy Obesity Is Associated with Altered Placental Transcriptome. PLoS One. 2017;12(1):e0169223. doi:10.1371/journal.pone.0169223
13. Zhu LX, Zhang MM, Liu Z, et al. Levels of Furaneol in Msalais Wines: a Comprehensive Overview of Multiple Stages and Pathways of Its Formation during Msalais Winemaking. Molecules. 2019;24(17):17. doi:10.3390/molecules24173104
14. Zhu LX, Gao MF, Guo DQ. Preliminary Analysis of Yeast Communities Associated with the Spontaneous Fermentation of Musalais, a Traditional Alcoholic Beverage of Southern Xinjiang, China. South African J Enology Viticulture. 2012;33(1):95–104.
15. Zhu LX, Zhang MM, Shi Y, et al. Evolution of the aromatic profile of traditional Msalais wine during industrial production. Int J Food Properties. 2019;22(1):911–924. doi:10.1080/10942912.2019.1612428
16. Guo XW, Li YZ, Guo J, et al. Reduced production of ethyl carbamate for wine fermentation by deleting CAR1 in Saccharomyces cerevisiae. J Ind Microbiol Biotechnol. 2016;43(5):671–679. doi:10.1007/s10295-016-1737-7
17. Liu H, Cui B, Xu Y, et al. Ethyl carbamate induces cell death through its effects on multiple metabolic pathways. Chem Biol Interact. 2017;277:21–32. doi:10.1016/j.cbi.2017.08.008
18. Arena ME, Manca de Nadra MC. Manca de Nadra MC. Influence of ethanol and low pH on arginine and citrulline metabolism in lactic acid bacteria from wine. Res Microbiol. 2005;156(8):858–864. doi:10.1016/j.resmic.2005.03.010
19. Hamzawy MA, Abo-Youssef AM, Salem HF, et al. Antitumor activity of intratracheal inhalation of temozolomide (TMZ) loaded into gold nanoparticles and/or liposomes against urethane-induced lung cancer in BALB/c mice. Drug Deliv. 2017;24(1):599–607. doi:10.1080/10717544.2016.1247924
20. Nomura T. Urethan (ethyl carbamate) as a cosolvent of drugs commonly used parenterally in humans. Cancer Res. 1975;35(10):2895–2899.
21. Miller JA. The need for epidemiological studies of the medical exposures of Japanese patients to the carcinogen ethyl carbamate (urethane) from 1950 to 1975. Jpn J Cancer Res. 1991;82(12):1323–1324. doi:10.1111/j.1349-7006.1991.tb01799.x
22. Guengerich FP, Kim DH. Enzymatic oxidation of ethyl carbamate to vinyl carbamate and its role as an intermediate in the formation of 1, N6-ethenoadenosine. Chem Res Toxicol. 1991;4(4):413–421. doi:10.1021/tx00022a003
23. Lajovic A, Nagy LD, Guengerich FP, et al. Carcinogenesis of urethane: simulation versus experiment. Chem Res Toxicol. 2015;28(4):691–701. doi:10.1021/tx500459t
24. Wang IC, Meliton L, Ren X, et al. Deletion of Forkhead Box M1 transcription factor from respiratory epithelial cells inhibits pulmonary tumorigenesis. PLoS One. 2009;4(8):e6609. doi:10.1371/journal.pone.0006609
25. Kim YG, Lyu J, Kim MK, et al. Effect of citrulline, urea, ethanol, and urease on the formation of ethyl carbamate in soybean paste model system. Food Chem. 2015;189:74–79. doi:10.1016/j.foodchem.2015.02.012
26. Lachenmeier DW, Lima MC, Nobrega IC, et al. Cancer risk assessment of ethyl carbamate in alcoholic beverages from Brazil with special consideration to the spirits cachaca and tiquira. BMC Cancer. 2010;10:266. doi:10.1186/1471-2407-10-266
27. Choi B, Ryu D, Kim CI, et al. Probabilistic dietary exposure to ethyl carbamate from fermented foods and alcoholic beverages in the Korean population. Food Addit Contam Part a Chem Anal Control Expo Risk Assess. 2017;34(11):1885–1892. doi:10.1080/19440049.2017.1364433
28. Dawei chen YR, Zhong Q, Zhong Q, Shao Y, Zhao Y, Wu Y. Yi Shao, Yunfeng Zhao, Yongning Wu. Ethyl carbamate in alcoholic beverages from China: levels, dietary intake, and risk assessment. Food Control. 2017;72:283–288. doi:10.1016/j.foodcont.2015.10.047
29. Davuluri G, Welch N, Sekar J, et al. Activated protein phosphatase 2A disrupts nutrient sensing balance between mTORC1 and AMPK causing sarcopenia in alcoholic liver disease. Hepatology. 2020. doi:10.1002/hep.31524
30. Wang L, Zhu Y, Wang L, et al. Effects of chronic alcohol exposure on ischemia-reperfusion-induced acute kidney injury in mice: the role of beta-arrestin 2 and glycogen synthase kinase 3. Exp Mol Med. 2017;49(6):e347. doi:10.1038/emm.2017.76
31. Manikandan P, Nagini S. Cytochrome P450 Structure, Function and Clinical Significance: a Review. Curr Drug Targets. 2018;19(1):38–54. doi:10.2174/1389450118666170125144557
32. Kovacs T, Deri M, Fulop A, et al. Isoform-dependent changes in cytochrome p450-mediated drug metabolism after portal vein ligation in the rat. Eur Surg Res. 2018;59(5–6):301–319. doi:10.1159/000493923
33. Guengerich FP, Waterman MR, Egli M. Recent Structural Insights into Cytochrome P450 Function. Trends Pharmacol Sci. 2016;37(8):625–640. doi:10.1016/j.tips.2016.05.006
34. Zanger UM, Schwab M. Cytochrome P450 enzymes in drug metabolism: regulation of gene expression, enzyme activities, and impact of genetic variation. Pharmacol Ther. 2013;138(1):103–141.
35. Bren U, Fuchs JE, Oostenbrink C. Cooperative binding of aflatoxin B1 by cytochrome P450 3A4: a computational study. Chem Res Toxicol. 2014;27(12):2136–2147. doi:10.1021/tx5004062
36. Dahl GA, Miller EC, Miller JA. Comparative carcinogenicities and mutagenicities of vinyl carbamate, ethyl carbamate, and ethyl N-hydroxycarbamate. Cancer Res. 1980;40(4):1194–1203.
37. Sakano K, Oikawa S, Hiraku Y, et al. Metabolism of carcinogenic urethane to nitric oxide is involved in oxidative DNA damage. Free Radic Biol Med. 2002;33(5):703–714. doi:10.1016/S0891-5849(02)00969-3
38. Cha SW, Gu HK, Lee KP, et al. Immunotoxicity of ethyl carbamate in female BALB/c mice: role of esterase and cytochrome P450. Toxicol Lett. 2000;115(3):173–181. doi:10.1016/S0378-4274(00)00176-4
39. Lindemann A, Takahashi H, Patel AA, et al. Targeting the DNA Damage Response in OSCC with TP 53 Mutations. J Dent Res. 2018;97(6):635–644. doi:10.1177/0022034518759068
40. Stegh AH. Targeting the p53 signaling pathway in cancer therapy - the promises, challenges and perils. Expert Opin Ther Targets. 2012;16(1):67–83. doi:10.1517/14728222.2011.643299
41. Joerger AC, Fersht AR. The p53 pathway: origins, inactivation in cancer, and emerging therapeutic approaches. Annu Rev Biochem. 2016;85(1):375–404. doi:10.1146/annurev-biochem-060815-014710
42. Lin F, Xie YJ, Zhang XK, et al. GTSE1 is involved in breast cancer progression in p53 mutation-dependent manner. J Exp Clin Cancer Res. 2019;38(1):152. doi:10.1186/s13046-019-1157-4
43. Takahashi-Yanaga F, Kahn M. Targeting Wnt signaling: can we safely eradicate cancer stem cells? Clin Cancer Res. 2010;16(12):3153–3162. doi:10.1158/1078-0432.CCR-09-2943
44. Zeng B, Ge C, Li R, et al. Knockdown of microsomal glutathione S-transferase 1 inhibits lung adenocarcinoma cell proliferation and induces apoptosis. Biomed Pharmacother. 2019;121:109562. doi:10.1016/j.biopha.2019.109562
45. Hadami K, Dakka N, Bensaid M, et al. Evaluation of glutathione S-transferase pi 1 expression and gene promoter methylation in Moroccan patients with urothelial bladder cancer. Mol Genet Genomic Med. 2018;6(5):819–827. doi:10.1002/mgg3.449
46. Liu H, Yang Z, Zang L, et al. Downregulation of Glutathione S-transferase A1 suppressed tumor growth and induced cell apoptosis in A549 cell line. Oncol Lett. 2018;16(1):467–474. doi:10.3892/ol.2018.8608
47. Ning B, Wang C, Morel F, et al. Human glutathione S-transferase A2 polymorphisms: variant expression, distribution in prostate cancer cases/controls and a novel form. Pharmacogenetics. 2004;14(1):35–44. doi:10.1097/00008571-200401000-00004
48. Kelly VP, Ellis EM, Manson MM, et al. Chemoprevention of aflatoxin B1 hepatocarcinogenesis by coumarin, a natural benzopyrone that is a potent inducer of aflatoxin B1-aldehyde reductase, the glutathione S-transferase A5 and P1 subunits, and NAD(P)H: quinone oxidoreductase in rat liver. Cancer Res. 2000;60(4):957–969.
49. Zhang H. CCND1 silencing suppresses liver cancer stem cell differentiation through inhibiting autophagy. Hum Cell. 2019.
50. Kimura Y, Arakawa F, Kiyasu J, et al. The Wnt signaling pathway and mitotic regulators in the initiation and evolution of mantle cell lymphoma: gene expression analysis. Int J Oncol. 2013;43(2):457–468. doi:10.3892/ijo.2013.1982
51. Ambasta RK, Gupta R, Kumar D, et al. Can luteolin be a therapeutic molecule for both colon cancer and diabetes? Brief Funct Genomics. 2018;18(4):230–239. doi:10.1093/bfgp/ely036
 © 2021 The Author(s). This work is published and licensed by Dove Medical Press Limited. The full terms of this license are available at https://www.dovepress.com/terms.php and incorporate the Creative Commons Attribution - Non Commercial (unported, v3.0) License.
By accessing the work you hereby accept the Terms. Non-commercial uses of the work are permitted without any further permission from Dove Medical Press Limited, provided the work is properly attributed. For permission for commercial use of this work, please see paragraphs 4.2 and 5 of our Terms.
© 2021 The Author(s). This work is published and licensed by Dove Medical Press Limited. The full terms of this license are available at https://www.dovepress.com/terms.php and incorporate the Creative Commons Attribution - Non Commercial (unported, v3.0) License.
By accessing the work you hereby accept the Terms. Non-commercial uses of the work are permitted without any further permission from Dove Medical Press Limited, provided the work is properly attributed. For permission for commercial use of this work, please see paragraphs 4.2 and 5 of our Terms.