")
Back to Journals » International Journal of Nanomedicine » Volume 13 » T-NANO 2014 Abstracts
Removal of pesticide toxicity by cysteine-capped Ag nanoparticles and study of their adsorption kinetics
Received 14 October 2016
Accepted for publication 30 October 2016
Published 15 March 2018 Volume 2018:13(T-NANO 2014 Abstracts) Pages 25—29
DOI https://doi.org/10.2147/IJN.S124700
Checked for plagiarism Yes
Review by Single anonymous peer review
Peer reviewer comments 2
Editor who approved publication: Professor Lei Yang
Aditi Singhal,1 Mary Laura Lind2
1School of Engineering and Applied Science, Ahmedabad University, Ahmedabad, Gujarat, India; 2School for Engineering of Matter, Transport and Energy, Arizona State University, Tempe, AZ, USA
Abstract: A new method has been developed for one-step synthesis of cysteine-capped Ag nanoparticles. The particles have been characterized by several techniques, including ultraviolet–visible spectroscopy, infrared spectroscopy, X-ray diffraction, scanning electron microscopy, and transmission electron microscopy. The interaction of these nanoparticles has been seen with two pesticides, namely, chlorpyrifos and malathion, which are major water pollutants.
Keywords: Ag nanoparticles, adsorption, chlorpyrifos, malathion, kinetic models
Introduction
Water toxicity has been a major problem that the world is facing today. One of the main compounds increasing the toxicity of water is pesticide, which is causing great threat to the inhabitants of earth.1 Many methods have been developed for the removal of these pesticides, but metal nanoparticles are being widely used in this area due to their unique properties, such as small particle sizes, large surface-to-volume ratio, and the ease with which they can be attached onto the solid matrices for the treatment of waste water.2 Pesticides such as chlorpyrifos and malathion are the two major water pollutants.3,4 Chlorpyrifos, O, O-diethyl-O-(3,5,6-trichloro-2-pyridyl) phosphorothioate (C9H11Cl3NO3PS), an organophosphate insecticide, is a very common one and highly used active ingredients for pest control worldwide. Malathion, S-1,2-bis(ethoxycarbonyl)ethyl O, O-dimethyl phosphorodithioate, causes child anemia, kidney failure, leukemia, and human birth defects and DNA abnormalities. In this article, we report synthesis and complete characterization of cysteine-capped Ag nanoparticles. The aim of this article is to find the affinity of these Ag nanoparticles toward the two pesticides.
Materials and methods
L-Cysteine, ethanol, AgNO3, tert-butylamine–borane complex (Sigma Chemical, St Louis, MO, USA; Fisher Scientific, Hampton, NH, USA), and the Nanopure water (18 MΩ) were used for the experiments. Ultraviolet–visible (UV–Vis) spectrometry was performed using an Agilent 8453 UV-VIS-NIR Photodiode Array System (Agilent Technologies, Santa Clara, CA, USA). Fourier transform infrared spectroscopy (FT-IR) was performed using a Nicolet Magna 850 FT-IR spectrometer (Thermo Fisher Scientific, Waltham, MA, USA) in mid-IR range. Powder X-ray diffraction (XRD) pattern was obtained on a Philips X’PERT-MPD (PANalytical, Boulder, CO, USA), with CuKα between 10° and 80°. Scanning electron microscopy (SEM) was performed on a FEI XL40 Sirion FEG digital scanning microscope (FEI, Hillsboro, OR, USA). Transmission electron microscopy (TEM) analysis was carried out using a FEI-Technai G2 Sphera microscope with field emission gun at 200 kV, point resolution at 0.27 nm, and a line resolution at 0.14 nm. Cysteine-capped Ag nanoparticles were prepared by a simple one-step synthesis process, which has already been reported.5 One ppm solution of pesticide (chlorpyrifos/malathion) and 7 ppm solution of cysteine-capped Ag nanoparticles (concentration calculated from the calibration plot) were prepared. Using these, two different solutions were prepared, solution I contains 2 mL (7 ppm) of Ag solution +2 mL of water and solution II contains 2 mL (7 ppm) of Ag solution +2 mL (1 ppm) of pesticide solution. Absorbance of both these solutions was recorded. The absorbance of solution II was recorded after every 20 min, and the change in the absorbance value was noted.
Results and discussion
The synthesis method used herein resulted in uniformly shaped Ag nanoparticles with a mean diameter of 9 nm, which can be seen from the SEM (Figure 1A) and TEM (Figure 1B) images. XRD analysis of the particles revealed a face-centered cubic structure (Figure 1C). The IR spectrum of Ag indicated clearly the formation of thiol–silver bond, marked by the disappearance of 2,500 cm−1 peak in free cysteine which is due to the thiol group. This peak is absent in the IR spectrum of Ag nanoparticles. It is due to the formation of S-Ag bond replacing the thiol (S–H) bond in cysteine (Figure 1D).
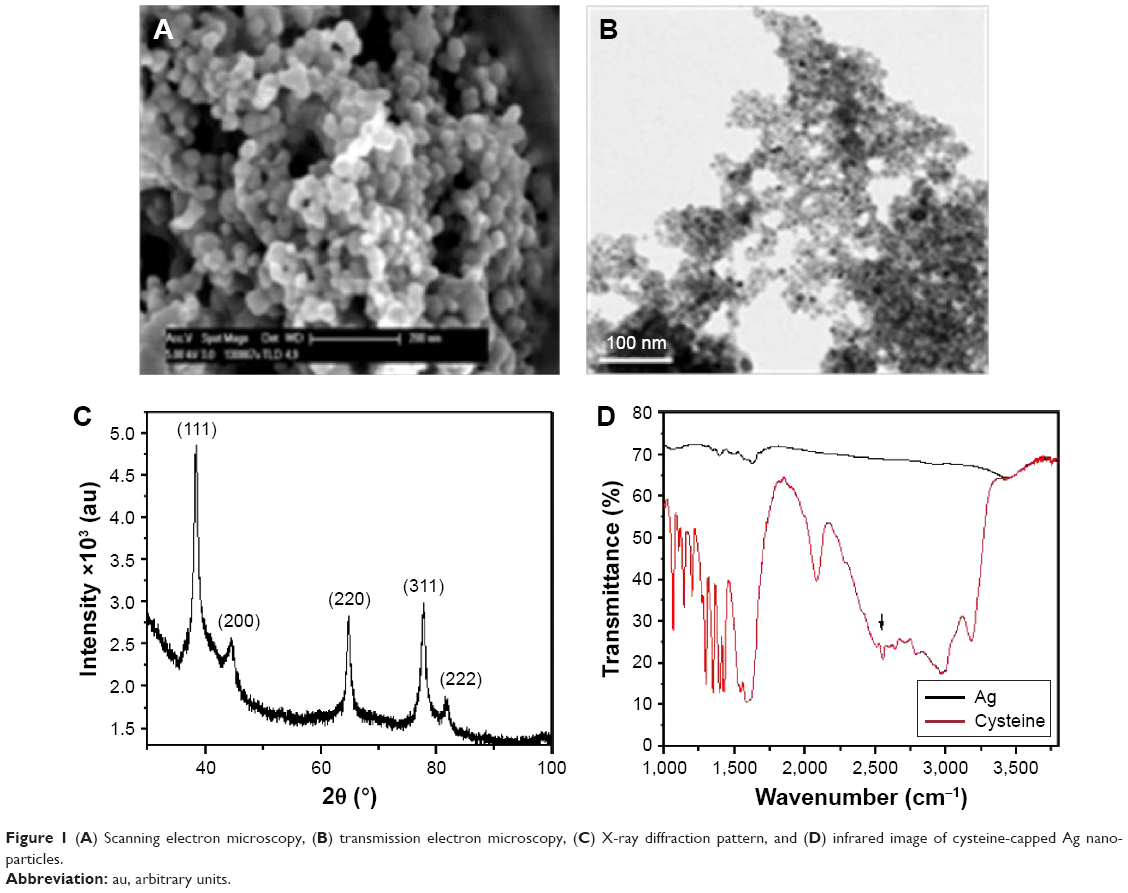 | Figure 1 (A) Scanning electron microscopy, (B) transmission electron microscopy, (C) X-ray diffraction pattern, and (D) infrared image of cysteine-capped Ag nanoparticles. |
Figure 2A shows the changes in the optical absorption spectrum of Ag nanoparticles upon exposure to 1 ppm chlorpyrifos at different intervals of time. Trace at 0 min is absorption spectrum of solution I having an absorption maximum of 430 nm and second trace from top was the absorption spectrum of solution II. The subsequent traces of solution II were taken at 20 min intervals of time. Arrow represents the decrease in absorbance with time. As can be seen from the spectra, the plasmon absorption of Ag nanoparticles at 430 nm decreased in intensity with time. After about 180 min, the optical absorption is reduced to a large extent. The dampening of the intensity of the original plasmon could be due to the adsorption of chlorpyrifos on the nanoparticles surface. At this stage, the solution turned pale blue and the pesticide-adsorbed nanoparticles began to precipitate. Figure 2B shows the change in the concentration of Ag nanoparticles with time with respect to chlorpyrifos.
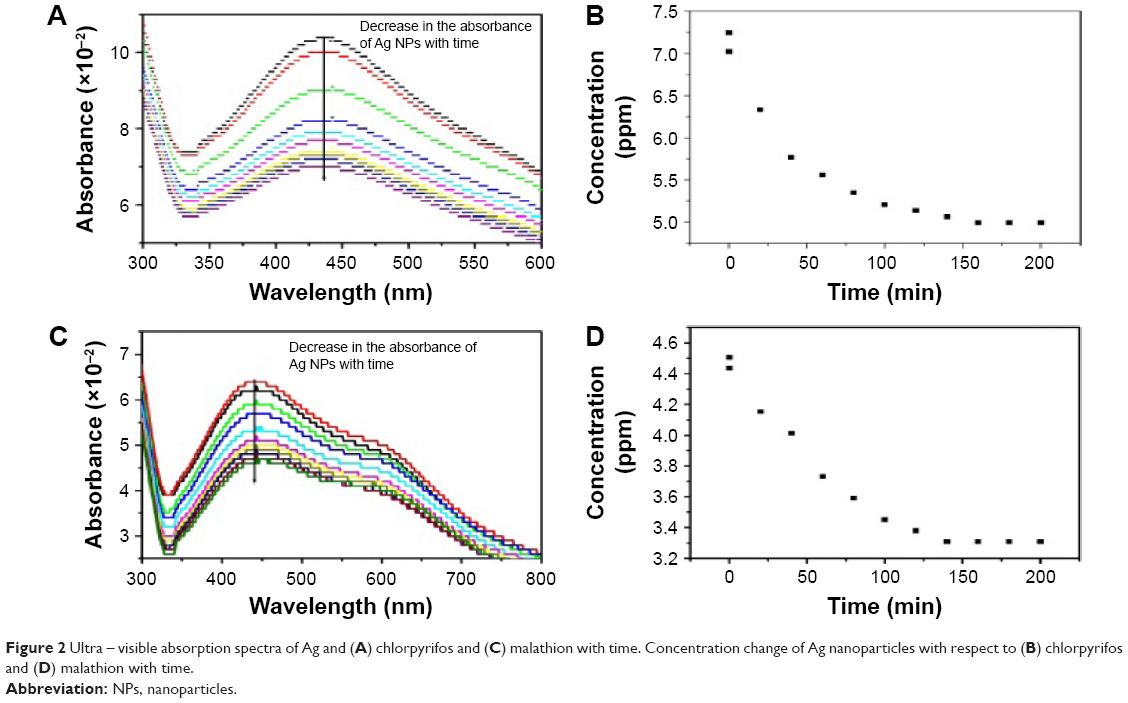 | Figure 2 Ultra – visible absorption spectra of Ag and (A) chlorpyrifos and (C) malathion with time. Concentration change of Ag nanoparticles with respect to (B) chlorpyrifos and (D) malathion with time. |
Figure 2C shows the changes in the optical absorption spectrum of Ag nanoparticles when interacted with 1 ppm malathion at different intervals of time. Similar procedure was repeated as in the case of chlorpyrifos. Figure 2D shows the change in the concentration of Ag nanoparticles with time with respect to malathion.
IR spectra of solution II were taken just after mixing Ag nanoparticles with pesticides and also after 200 min (Figure 3). Clearly, the pesticide peaks at 1,245 and 1,374 cm−1 diminished with time. These peaks are identified as C–N stretch related to aromatic amines present in chlorpyrifos. Hence, the pesticides were absorbed by the nanoparticles via C–N linkage. Malathion pesticide does not have C–N bond. Thus, it is unlikely to get adsorbed over Ag nanoparticles.
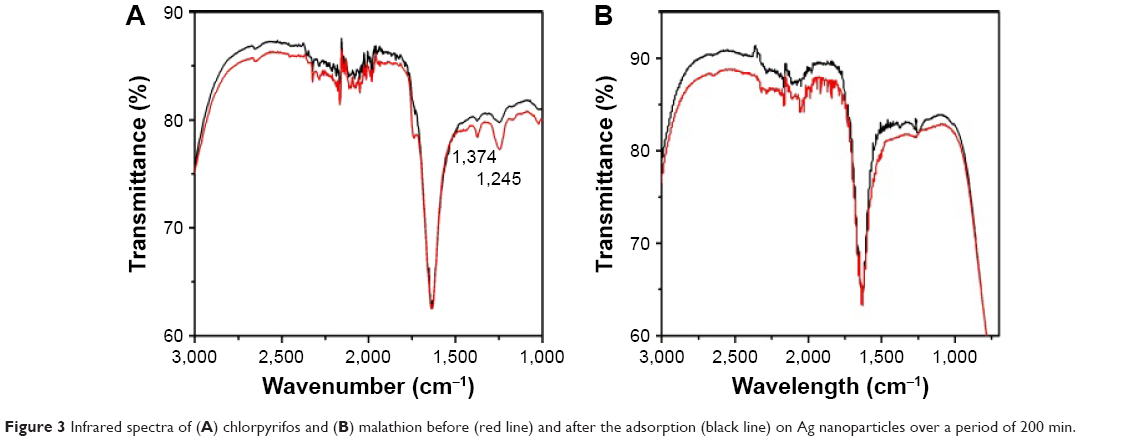 | Figure 3 Infrared spectra of (A) chlorpyrifos and (B) malathion before (red line) and after the adsorption (black line) on Ag nanoparticles over a period of 200 min. |
Adsorption kinetics
To understand which absorption model is followed, kinetic studies were done. For the kinetics of the adsorption of chlorpyrifos and malathion over Ag nanoparticles, we assumed that the decrease in the concentration of Ag nanoparticles was directly proportional to the decrease in the pesticide concentration. Thus, the value of decrease in absorbance of Ag nanoparticles at λmax 430 nm was related to the pesticide concentration. First, the amount of pesticide absorbed into unit weight of Ag nanoparticles (adsorbent), Qe in mg mg−1 (equilibrium uptake), was calculated from the mass balance equation Qe=(C0-Ce) V m−1. Now, in order to evaluate the kinetics, pseudo-first-order, pseudo-second-order, and intraparticle diffusion models were tested by using rate equations: log(Qe-Qt) = log Qe − (k1/2.303)t, t/Q1 = 1/k2 Q2e + t/Qe, and Q1 = kit1/2 + C for pseudo-first-order, pseudo-second-order, and intraparticle diffusion, respectively.
Figure 4 shows the plot of all the three models and parameter k1 for chlorpyrifos. Qe and the correlation coefficient (R2) values were also determined from the fitting (Table 1).
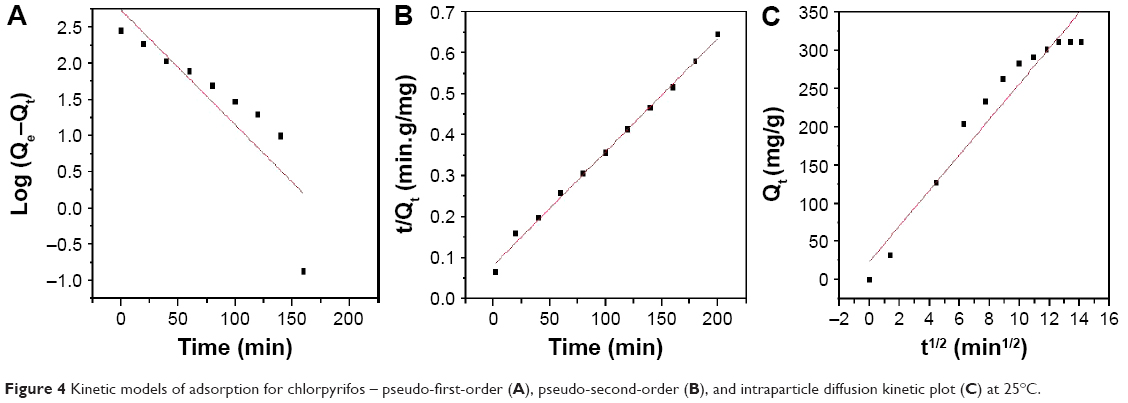 | Figure 4 Kinetic models of adsorption for chlorpyrifos – pseudo-first-order (A), pseudo-second-order (B), and intraparticle diffusion kinetic plot (C) at 25°C. |
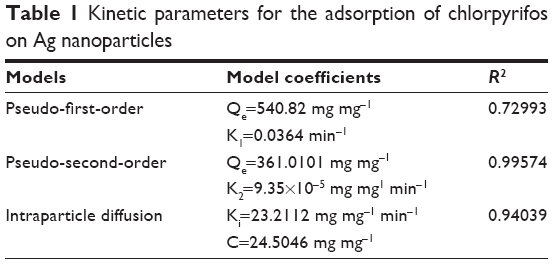 | Table 1 Kinetic parameters for the adsorption of chlorpyrifos on Ag nanoparticles |
From all the above data, best-fit straight line was obtained between t/Qt versus t (R2=0.99574). Hence, the adsorption of chlorpyrifos on Ag nanoparticles followed the pseudo-second-order kinetic model.
Figure 5 shows the plot of all the three models and parameter k1 for malathion. Qe and the correlation coefficient (R2) values were also determined from the fitting (Table 2).
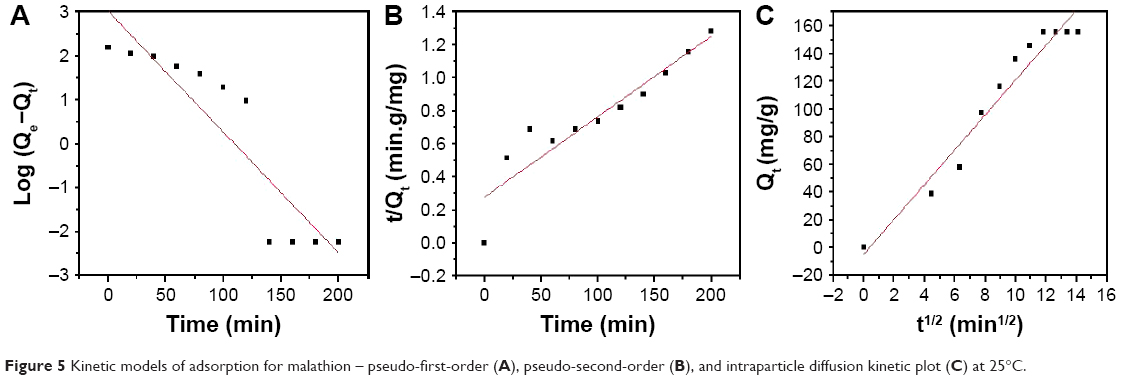 | Figure 5 Kinetic models of adsorption for malathion – pseudo-first-order (A), pseudo-second-order (B), and intraparticle diffusion kinetic plot (C) at 25°C. |
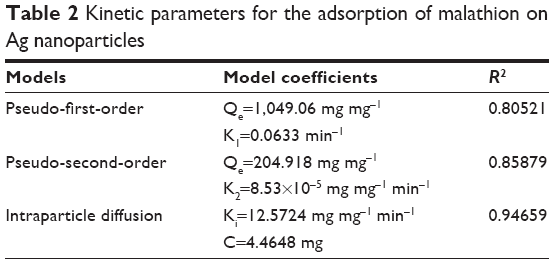 | Table 2 Kinetic parameters for the adsorption of malathion on Ag nanoparticles |
From all the above data, best-fit straight line was obtained between Q1 versus t1/2 (R2=0.94695). Hence, the adsorption of malathion on Ag nanoparticles followed the interparticle diffusion.
Conclusion
Chlorpyrifos has better affinity to Ag nanoparticles compared with malathion due to the aromatic amine group present in chlorpyrifos as evidenced by IR. Different kinetic models are followed by chlorpyrifos and malathion. While chlorpyrifos follows second-order kinetic, malathion follows interparticle diffusion. This study makes Ag nanoparticles a better choice to remove chlorpyrifos from the drinking water. For malathion, Ag nanoparticles are not very active.
Acknowledgments
This work was supported by the National Science Foundation and the Environmental Protection Agency under Cooperative Agreement DBI-0830117. Department of Chemistry and Biochemistry, and Materials Department, University of California, Santa Barbara, are gratefully acknowledged.
Disclosure
The authors report no conflicts of interest in this work.
References
Petrosius SC, Drago RS, Young V, Grunewald GC. Low-temperature decomposition of some halogenated hydrocarbons using metal oxide/porous carbon catalysts. J Am Chem Soc. 1993;115:6131–6137. | ||
Ichinose N. Superfine Particle Technology. Berlin, Germany: Springer; 1992. | ||
Dyer SM, Cattani M, Pisaniello DL, Williams FM, Edwards JW. Peripheral cholinesterase inhibition by occupational chlorpyrifos exposure in Australian termiticide applicators. Toxicology. 2001;169:177–185. | ||
Zeljezic D, Garaj-Vrhovac V. Sister chromadit exchange and proliferative rate index in the longitudinal risk assessment of occupational exposure to pesticides. Chemosphere. 2002;46:295–303. | ||
Priester JH, Singhal A, Wu B, Stucky GD, Patricia A. Integrated approach to evaluating the toxicity of novel cysteine-capped silver nanoparticles to Escherichia coli and Pseudomonas aeruginosa. Analyst. 2014;139:954–963. |
 © 2018 The Author(s). This work is published and licensed by Dove Medical Press Limited. The full terms of this license are available at https://www.dovepress.com/terms.php and incorporate the Creative Commons Attribution - Non Commercial (unported, v3.0) License.
By accessing the work you hereby accept the Terms. Non-commercial uses of the work are permitted without any further permission from Dove Medical Press Limited, provided the work is properly attributed. For permission for commercial use of this work, please see paragraphs 4.2 and 5 of our Terms.
© 2018 The Author(s). This work is published and licensed by Dove Medical Press Limited. The full terms of this license are available at https://www.dovepress.com/terms.php and incorporate the Creative Commons Attribution - Non Commercial (unported, v3.0) License.
By accessing the work you hereby accept the Terms. Non-commercial uses of the work are permitted without any further permission from Dove Medical Press Limited, provided the work is properly attributed. For permission for commercial use of this work, please see paragraphs 4.2 and 5 of our Terms.