")
Back to Journals » Neuropsychiatric Disease and Treatment » Volume 16
Removal of Aβ Oligomers from the Blood: A Potential Therapeutic System for Alzheimer’s Disease
Authors Saito Y, Sakata M, Kobayakawa M, Kawachi H, Kawaguchi K, Hiki Y, Kato M, Mori M, Hasegawa M , Ohashi N, Yuzawa Y, Kitaguchi N
Received 4 December 2019
Accepted for publication 14 February 2020
Published 3 March 2020 Volume 2020:16 Pages 607—627
DOI https://doi.org/10.2147/NDT.S241074
Checked for plagiarism Yes
Review by Single anonymous peer review
Peer reviewer comments 2
Editor who approved publication: Dr Taro Kishi
Yuta Saito, 1–3 Miwa Sakata, 3 Moe Kobayakawa, 3 Hiroshi Kawachi, 4 Kazunori Kawaguchi, 3 Yoshiyuki Hiki, 3 Masao Kato, 1 Mayuko Mori, 1, 3 Midori Hasegawa, 1 Norimi Ohashi, 4 Yukio Yuzawa, 1 Nobuya Kitaguchi 3
1Department of Nephrology, School of Medicine, Fujita Health University, Toyoake, Aichi, Japan; 2Graduate School of Medical Sciences, Fujita Health University, Toyoake, Aichi, Japan; 3Faculty of Clinical Engineering, School of Medical Sciences, Fujita Health University, Toyoake, Aichi, Japan; 4Ogaki Municipal Hospital, Ogaki, Gifu, Japan
Correspondence: Nobuya Kitaguchi 4-8-17, Yuzato, Higashisumiyosi-ku, Osaka 546-0013, Japan
Tel/Fax +81-6-3-4392-7087
Email [email protected]
Purpose: Amyloid-β protein (Aβ) is one of the causative proteins of Alzheimer’s disease. We have been developing extracorporeal blood Aβ-removal systems as a method for enhancing Aβ clearance from the brain. We reported previously that medical adsorbents and hemodialyzers removed Aβ monomers from peripheral blood, which was associated with influx of Aβ monomers from the brain into the bloodstream. Our intent here was to develop a method to promote clearance of Aβ oligomers and to provide an estimate of the molecular size of intact Aβ oligomers in plasma.
Methods: Two hollow-fiber devices with different pore sizes (Membranes A and B) were evaluated as removers of Aβ oligomers with human plasma in vitro. The concomitant removal of Aβ oligomers and monomers was investigated by using Membrane B and hexadecyl alkylated cellulose beads or polysulfone hemodialyzers. Double-filtration plasmapheresis with Membrane A was investigated as an approach for the removal of plasma Aβ oligomers in humans.
Results: Aβ oligomers were effectively removed by both Membranes A and B. The increase of Aβ oligomers in plasma was observed just after the removal of plasma Aβ oligomers in humans. The intact molecular size of major Aβ oligomers in the plasma was estimated to be larger than albumin at approximately 60 kDa or more. Additionally, the concomitant removal of Aβ monomers and oligomers evoked dissociation of larger Aβ oligomers into smaller ones and monomers.
Conclusion: Aβ oligomers were cleared from plasma both in vitro and in human subjects by using hollow-fiber membranes with large pores, indicating that their intact sizes were mostly larger than 60 kDa. Aβ oligomers in peripheral circulation were increased after some clearances in human. Further investigation will determine whether the Aβ oligomers detected in circulation after clearance were via influx from the brain.
Keywords: Aβ, amyloid beta, oligomer, Alzheimer’s disease, blood purification, membrane separation
Introduction
The deposition of amyloid-β proteins (Aβ) in the brain (specifically, 40 amino acid peptide Aβ1–40 and 42 amino acid peptide Aβ1–42) is a major hallmark of Alzheimer’s disease (AD).1 Both Aβs impair neurological function; however, the Aβ1–42 peptide aggregates more readily and is more neurotoxic than Aβ1–40. Furthermore, soluble Aβ oligomers, including those ranging from dimers to high-molecular-weight multimers, are more likely than Aβ monomers to promote neurotoxicity and findings that include synapse loss and diminished long-term potentiation of the hippocampal neurons.2–4 Even the smaller Aβ dimers and trimers are strong neurotoxins,5 and Aβ dimers isolated from brains of subjects diagnosed with AD are factors promoting impaired synaptic plasticity and memory.6
Recent findings suggest that decreased clearance may be a mechanism by which elevated levels of brain Aβ accumulate and promote the pathogenesis of AD; this may be particularly in evidence in sporadic cases. The clearance of Aβ from brain tissue of patients diagnosed with AD was 30% lower than that in unaffected subjects, despite similar rates of production.7 We previously proposed the use of extracorporeal blood Aβ-removal systems (E-BARS) as a means for augmenting clearance of Aβ from the brain. Our focus on E-BARS is based on our hypothesis that the rapid removal of Aβ from peripheral circulation may facilitate Aβ egress from the brain8 (Figure 1A). Several mechanisms to explain this proposal have been considered: first, certain proteins, such as low-density lipoprotein receptor-related protein 1 (LRP-1), apolipoprotein (Apo)J, and ApoE, function as Aβ transporters from the brain to the blood.9,10 Receptor for advanced glycation end products has also been identified as a similar bidirectional Aβ transporter.11 Additionally, perivascular lymphatic drainage is important for eliminating Aβs from the brain.12 The blood–brain barrier13 and the cerebrovascular basement membrane have also been proposed as Aβ drainage pathways.12 Finally, although not directly related to Aβ influx from the brain to the blood, inflammation in the brain, including astrocytes and microglia, may also have an impact on Aβs clearance.14
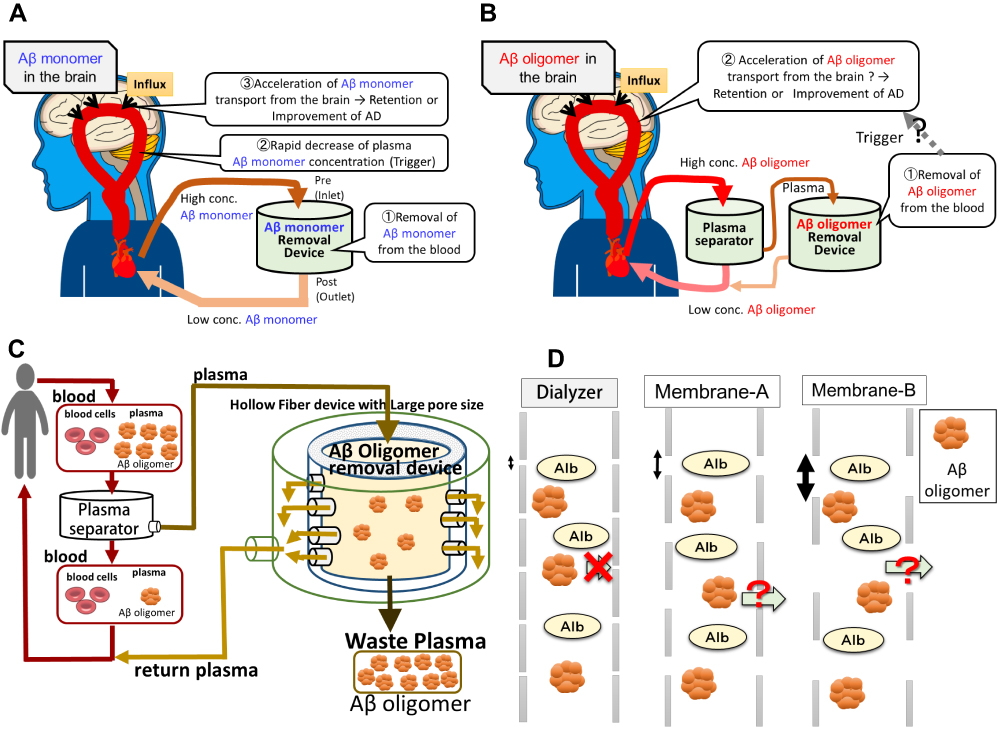 |
Figure 1 Schematic pictures of an E-BARS as the proposed system for the removal of Aβ oligomers. (A) Basic concept of E-BARS for Aβ monomer removal. Removal of blood Aβ monomers rapidly reduces Aβ monomer concentrations in the blood, which may act as a trigger to enhance Aβ excretion from the brain, resulting in cognitive improvement. (B) Hypothesis for the removal of Aβ oligomers: the blood of patients is introduced to a plasma separator (centrifuge or membrane separator), and the separated plasma is introduced to a device for the removal of Aβ oligomers. (C) Schematic mechanism of Aβ oligomers removal by membrane separation. The blood of patients is introduced into a plasma separator, and the separated plasma is introduced to a device composed of hollow-fiber membranes with appropriate larger pore sizes than hemodialyzers. Aβ oligomers of large molecular weights can hardly pass through the pores, are retained in the hollow fibers, and are discarded in waste plasma. Smaller molecules, including albumin, can pass through the pores and return to the patients. (D) A schematic comparison of pore sizes of the hemodialyzers and Membranes A and B with the size of large Aβ oligomers and albumin. |
Our previous studies have supported the feasibility of Aβ removal by E-BARS. Among these findings, we identified devices and materials that are suitable for Aβ removal from the blood, such as an adsorptive hexadecyl alkylated cellulose (HexDC) beads8,15 and polysulfone hemodialyzers.16 Notably, polysulfone hemodialyzers were found to be remarkably efficient at clearing Aβ, with reductions as high as ~50% for both Aβ1–40 and Aβ1–42.17,18 Hemodialyzers remove blood Aβ mainly via adsorption.16,19 Interestingly, a substantial influx of Aβ was from peripheral tissues into the blood was observed during hemodialysis;17,18,20 the total amount of Aβ influx during one 4-hr session of hemodialysis was comparable to the total amount of Aβ present in the brain.21 Furthermore, our histopathological study revealed significantly diminished accumulation of Aβ in the brains of patients undergoing hemodialysis as compared to age-matched control subjects who were not undergoing hemodialysis.22 More recently, we found that accumulation of Aβ in the brains of hemodialysis patients was decreased by −0.19 global standard uptake value ratio (SUVR) after hemodialysis for 6 months, a finding that was confirmed by positron emission tomography imaging with a Pittsburgh compound B probe.23 These findings suggest that the brain may be a critical point of origin of Aβ that enters the bloodstream during hemodialysis. Furthermore, in rat models of Aβ clearance from peripheral circulation using HexDC columns of an approximately 90% clearance efficiency, Aβ concentrations in the cerebrospinal fluid (CSF) were decreased, although plasma Aβ concentrations increased during Aβ clearance from the blood.24 Additionally, cognitive function was maintained or improved slightly in a prospective study of 30 hemodialysis patients.20 We also reported that a lower risk of dementia correlated with a longer duration of hemodialysis in a study that included more than 200,000 hemodialysis patients in Japan.25
Other groups have shown that removing Aβs from peripheral circulation may be useful therapy for AD patients. Peritoneal dialysis also resulted in reduced plasma Aβ levels in human subjects as well as brain Aβ levels in mouse models of AD.26 And Clearance of Aβs by plasma exchange therapy was also effective in improving cognitive function among patients with AD.27 Further, mouse parabiosis studies, in which the circulatory systems of a wild-type and AD-transgenic mice were connected to one another, resulted in a reduction in brain Aβ deposition among the transgenic mice.28 Taken together, these results suggest that peripheral Aβ clearance may be an important means for treatment of AD.29
Of note, the reports described above relate to the clearance of Aβ monomers rather than Aβ oligomers from the blood. Aβ monomer clearance may lead to a reduction in Aβ oligomers due to the equilibrium maintained between these two forms. However, there may be a large kinetic barrier that impedes Aβ oligomer dissociation.30 As such, it will be important to determine whether Aβ in oligomeric form can be targeted for removal from the blood and whether an influx of Aβ oligomers into the blood might be triggered by this event. Toward this end, the molecular weights of Aβ oligomers in the brain have been measured by using denaturing sodium dodecyl sulfate–polyacrylamide gel electrophoresis (SDS-PAGE) followed by Western blotting.31 To the best of our knowledge, however, the molecular size of intact, non-denatured Aβ oligomers found in body fluid has not been reported.
In this study, we explored two variations of E-BARS as a means for promoting clearance of Aβ oligomers from the blood; the first method targets Aβ oligomers alone and the second incorporates the simultaneous removal of Aβ oligomers and monomers. Our basic concept for achieving Aβ oligomer clearance is the separation of Aβ oligomers from other smaller substances in plasma by using hollow-fiber membrane devices with larger pore sizes than those of hemodialyzers, a method known as membrane separation (Figure 1B–D). Moreover, the membrane separation technique may provide information regarding the molecular size of intact Aβ oligomers in the blood without introducing confounding variables such as detergent or protein degradation. Furthermore, we sought to determine whether the influx of Aβ oligomers into the blood of human subjects might be triggered by their clearance from peripheral circulation.
Materials and Methods
Ethical Considerations
This study conformed to the Declaration of Helsinki Good Clinical Practice guidelines. This research was reviewed and approved by the Institutional Review Boards at Fujita Health University (latest approval no. HM16-266) and Ogaki Municipal Hospital (approval no. 20130718–1). Written informed consent was obtained from all involved patients prior to plasma collection.
Acquisition of Human Plasma Containing Aβ Oligomers
Discarded plasma was collected during simple plasma exchange therapy from patients. The collected plasma was frozen at −29°C in a 300 mL bottle with an additional 1 mL of 1000 U/mL heparin/saline. The concentrations of Aβ oligomers in the plasma were measured, with only 68.8% of patients demonstrating detectable Aβ oligomers in their plasma. Plasma samples containing more than 10 pmol/L of Aβ oligomers were subsequently used for in vitro experiments of Aβ oligomer removal. Before frozen plasma was thawed, a solution of 1 mL of heparin and 12.5 mL of plasma preservative solution (made up of 65.75 g of sodium citrate and 8.18 g of citric acid in 250 mL of saline) was added to the plasma to minimize precipitation of fibrinogen. The plasma was thawed by shaking in a water bath at 37°C and centrifuged to remove precipitates.
Devices for Aβ Oligomer Removal
Two types of plasma separators, Membrane A and Membrane B, were used as systems for removing Aβ oligomers (Figure 1D). Membrane A was a plasma component separator with a mid-sized pore and a sieving coefficient of albumin of approximately 0.3 [Cascadeflo EC-20W, 2.0 m2 of the membrane area, made of hollow fibers of ethylene-vinyl alcohol copolymer (EVAL); Asahi Kasei Medical, Tokyo, Japan]. Membrane B was a plasma component separator with a larger pore size and a sieving coefficient of albumin of approximately 0.8 (Cascadeflo EC-50W, 2.0 m2 of the membrane area; Asahi Kasei Medical, Tokyo, Japan). Sieving coefficients of hemodialyzers for albumin were approximately 0.01.
Devices for Aβ Monomer Removal
Two medical devices for Aβ monomer removal were used to remove Aβ oligomers simultaneously. One was a medical adsorber made of HexDC,8,15 originally launched for the removal of β2 microglobulin. HexDC mini-columns were made by filling 66 mL of HexDC obtained using a commercially available HexDC device (Lixelle S-25; Kaneka, Osaka, Japan) into 50 mL syringes. The amount of HexDC filled into a mini-column was defined as suitable for 600 mL of human plasma. The other Aβ monomer remover setup was a polysulfone dialyzer because polysulfone is one of the best materials for Aβ monomer removal.16,19 The available minimum membrane area of the polysulfone dialyzer was 1.1 m2 (APS-11EA; Asahi Kasei Medical, Tokyo, Japan), which was approximately three times larger than that suitable for the treatment of 600 mL of human plasma.
Removal of Aβ Oligomers in vitro
Three types of experiments were conducted as shown in Figure 2. In the first set of experiments, plasma Aβ oligomers were removed by membrane separation with Membrane A or Membrane B (Figure 2A). Second, simultaneous removal of Aβ oligomers and monomers from plasma with Membrane B and HexDC (Figure 2B) or with Membrane B and a polysulfone dialyzer (Figure 2C).
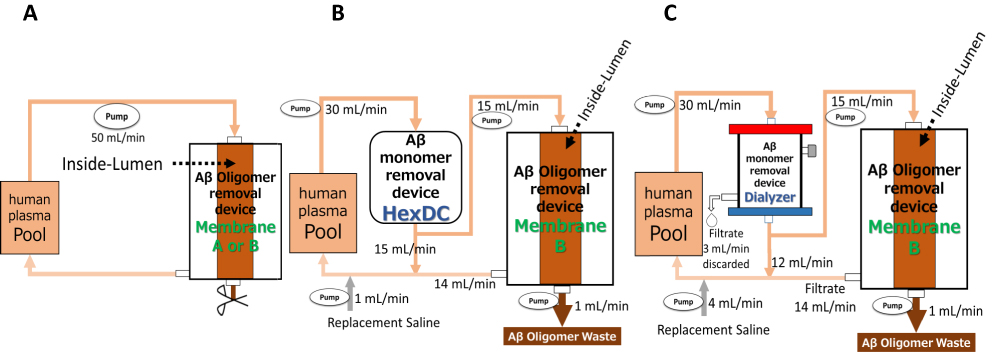 |
Figure 2 Schematic of the experimental circuits for the three Aβ oligomers removal systems. (A) Method for removal of Aβ oligomers using Membrane A or B alone. Human plasma containing Aβ oligomers in the reservoir (Pool) was introduced into Membrane A or B at 50 mL/min; filtrate was returned to Pool. A hollow fiber filled with plasma (Inside-Lumen) was shown as a representative of the many hollow fibers that constitute the membranes. The outlet was closed during circulation and opened after 60 mins of circulation so that plasma inside hollow fibers of the membrane could be retrieved. (B) Method for simultaneous removal of Aβ oligomers and monomers with Membrane B and HexDC. Human plasma was circulated at a flow rate of 30 mL/min through HexDC mini-columns. The plasma at the outlet of the HexDC column was divided in half with 15 mL/min for filtration with Membrane B and 15 mL/min to return to Pool. The plasma inside Membrane B (Inside-Lumen) was continuously discarded at a rate of 1 mL/min and saline (1 mL/min) was added for volume replacement before the plasma was returned to Pool. (C) Method for simultaneous removal of Aβ oligomers and monomers with Membrane B and a dialyzer. Human plasma was circulated at a flow rate of 30 mL/min through a polysulfone dialyzer with a filtration rate of 3 mL/min. The filtrate of the dialyzer was discarded. The plasma of the outlet of the dialyzer was divided into 15 mL/min for filtration with Membrane B and 12 mL/min to return to Pool. The plasma inside Membrane B was continuously discarded at a rate of 1 mL/min. Saline (4 mL/min) was added as a replacement solution before the return to Pool. |
Plasma Aβ Oligomer Removal by Membrane A or Membrane B Alone
The experimental system used to remove Aβ oligomer from plasma is shown in Figure 2A. After the entire system was washed with phosphate-buffered saline (PBS) and then 5 mg/mL of bovine serum albumin (BSA) in PBS solution, completing one-way flowing and discarding of 200 mL of human plasma to replace the BSA/PBS solution, then, 250 mL of human plasma (Pool in Figure 2A) was circulated at a flow rate of 50 mL/min using a peristaltic pump (Masterflex Variable-Speed Drive; Cole-Parmer, Vernon Hills, IL, USA). The volume of human plasma in use was set at approximately 1/10 that of a general adult (2500–3000 mL of plasma) because of the limited availability of the plasma. Only 2.0 m2 of the membrane area was available for plasma component separation; therefore, the ratio of the membrane area and plasma volume was approximately 10 times larger than that seen during typical clinical treatment. All plasma was introduced in Membrane A or Membrane B and the filtrate was returned to Pool. After 60 min of circulation, the remaining plasma in the inner side of the hollow fibers (Inside-Lumen; volume was 150 mL) was retrieved as waste plasma by using a syringe. The obtained samples were immediately stored at −80°C. Freeze–thaw cycles were minimized.
The absolute amount of Aβs was calculated as follows:
where the object fluids are the plasma in Pool and Inside-Lumen (Figure 2A).
The starting Aβ concentrations in Pool were 11.1 to 80.9 pmol/L, 149.9 to 736.5 pg/mL, and 21.4 to 63.3 pg/mL for Aβ oligomers, Aβ1–40, and Aβ1–42, respectively. These experiments were performed at least three times for each membrane.
Removal of Plasma Aβ Oligomers and Monomers Simultaneously with Membrane B and HexDC Mini-Columns
The experimental system used to remove Aβ oligomers and monomers simultaneously is shown in Figure 2B. A total of 600 mL of human plasma containing Aβ oligomers was circulated at a flow rate of 30 mL/min (corresponding to 50 mL/min flow of whole blood with 40% hematocrit) using Masterflex pumps (Cole-Parmer, Vernon Hills, IL, USA) through HexDC mini-columns. The plasma of the outlet of the HexDC column was divided in half as 15 mL/min, which corresponded to 30% of the postulated whole blood flow of 50 mL/min, for treatment with Membrane B and 15 mL/min for return to Pool. The plasma in Inside-Lumen of Membrane B was continuously discarded at a rate of 1 mL/min with a small Perista pump (SJ-1211H; ATTO, Tokyo, Japan). Saline (1 mL/min) was added as a replacement solution before the return to Pool. This experiment was performed at least in triplicate.
Removal of Plasma Aβ Oligomers and Monomers Simultaneously with Membrane B and Polysulfone Dialyzers
A second experimental system used for simultaneous removal of Aβ oligomers and monomers is shown in Figure 2C. The procedures here were similar to the experiments with Membrane B and HexDC mini-columns described above except that polysulfone dialyzers were used instead of HexDC mini-columns. Aβ monomers were removed in an adsorptive filtration mode19 with a filtration rate of 3 mL/min by using a Perista pump (SJ-1211H; ATTO, Tokyo, Japan). Subsequently, compensatory saline was added at a rate of 4 mL/min, including the volume of the discarded plasma from Membrane B.
Calculation of Removal Efficiency
The removal efficiency of HexDC column or polysulfone hemodialyzer was calculated as follows:
Equation 2: removal efficiency (%) =
Plasma Samples of Patients Undergoing Double-Filtration Plasmapheresis
Double-filtration plasmapheresis (DFPP) is usually performed to remove plasma substances larger than albumin. The general schema of DFPP resembles our basic concept for Aβ oligomer removal (Figure 1C). Three patients with renal failure underwent two or three DFPP treatments before living-donor kidney transplantation with blood-type incompatibility (Table 1). The blood of these patients was introduced to a plasma separator (Plasmaflo-OP08W; Asahi Kasei Medical, Tokyo, Japan), and the separated plasma was introduced to the plasma component separator Cascadeflo EC-20W (Membrane A). Large molecules, such as antibodies against red blood cells, cannot pass through the pores of the hollow fibers and so are retained in the hollow fibers of the plasma component separator (Inside-Lumen) and discarded as waste plasma. Smaller molecules in comparison were able to pass through the pores of the plasma component separator and were returned to the patients. Approximately 750 to 900 mL of plasma in Inside-Lumen of Membrane A was discarded as waste plasma during each session (Table 1), and the same volume of replacement fluid containing albumin was administered to the patients. The plasma samples of minimum volume were collected at the start, 60 min point, and end of DFPP (at approximately 110–180 min).
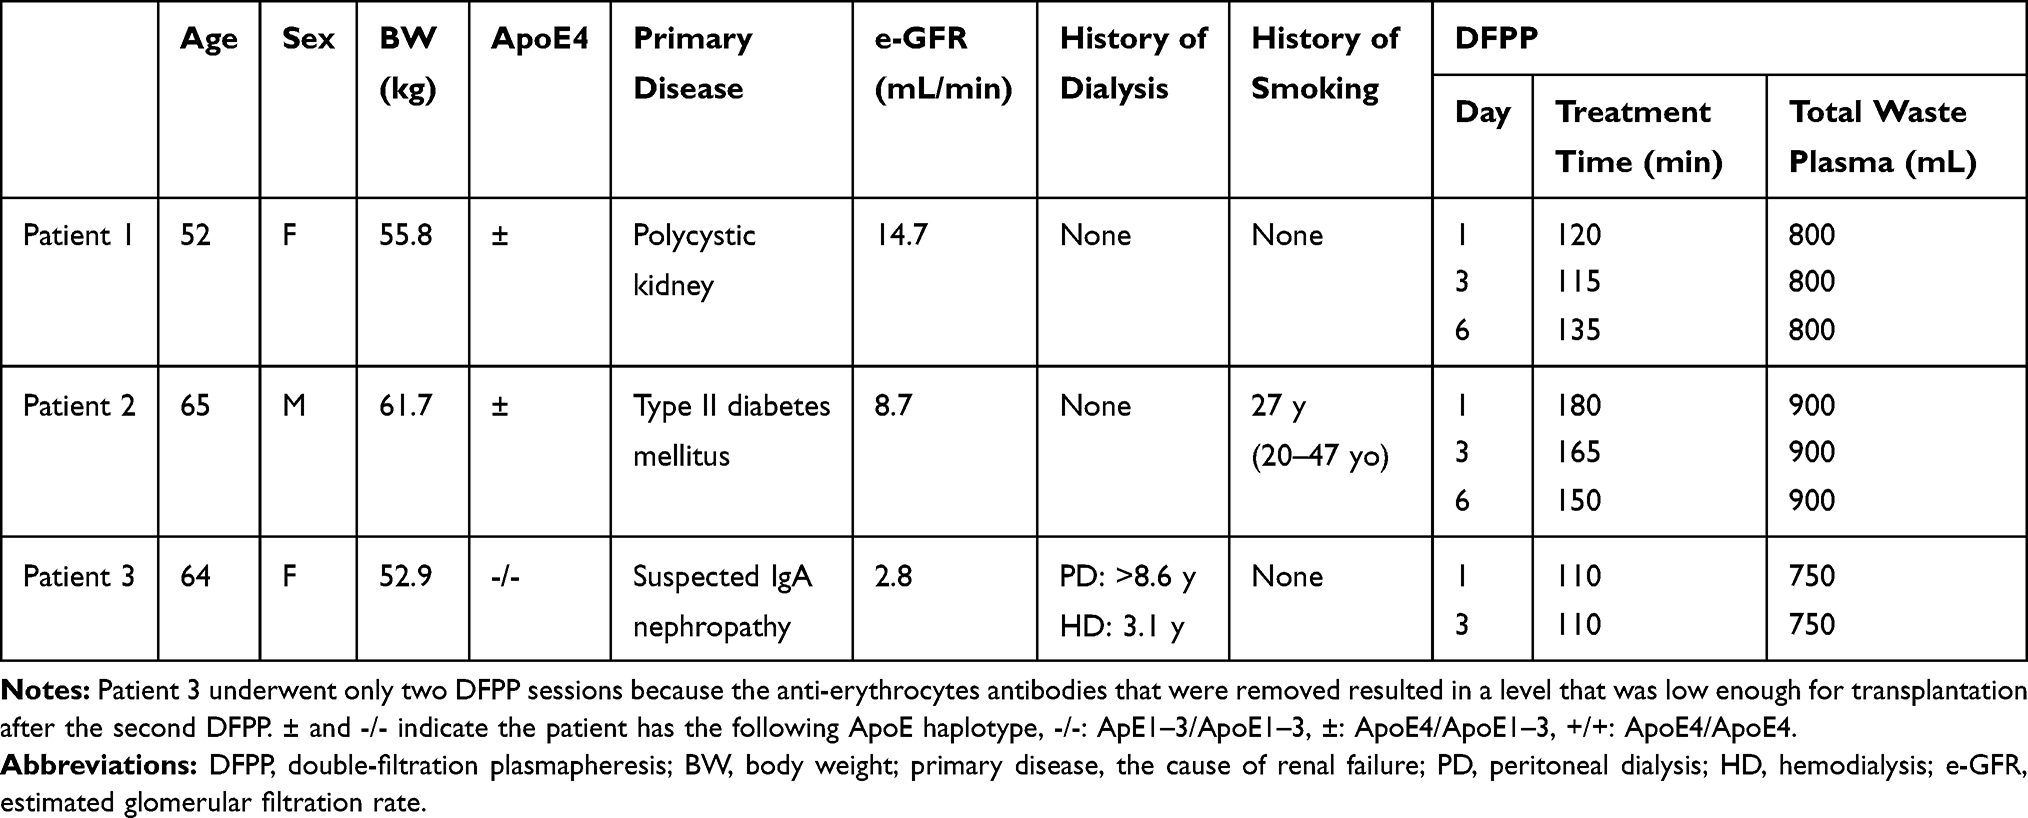 |
Table 1 Demographics of Patients Receiving DFPP Treatment for Living-Donor Kidney Transplantation with Blood-Type Incompatibility |
The absolute amounts of Aβ oligomers in the systemic total plasma and waste plasma were calculated according to Equation 1. The systemic total plasma volume was calculated as follows:
(body weight) ÷ 13 × [1 − (hematocrit) ÷ 100]
Additionally, the increase of Aβ oligomers into the blood was calculated as follows:
Increase = (systemic total plasma volume) × (increased plasma concentrations during the period of interest)
Measurements of Aβs, Albumin, and ApoE4
The concentrations of Aβ oligomers in the plasma were measured with human amyloid β oligomer (82E1-specific) assay kits (IBL; Fujioka, Gunma, Japan). According to the manufacturer, this enzyme-linked immunosorbent assay (ELISA) kit can detect Aβ oligomers including dimers and larger oligomers but does not detect Aβ1–40. This ELISA kit includes a standard solution of Aβ oligomer in units of pmol/L. The standard is a synthetic human Aβ1-16 dimer used for generating calibration curves.
The concentrations of Aβ1–40 and Aβ1–42 monomers were measured with high-sensitivity ELISA human β-amyloid (1–40) and β-amyloid (1–42) Wako II kits (Wako Pure Chemical, Osaka, Japan). These kits include immobilized BAN50 (monoclonal antibody directed against the N-terminal Aβ residues 1–16) and horse radish peroxidase (HRP)-conjugated BA27 (antibody against the C-terminus of Aβ1-40) to detect Aβ1-40 or HRP-conjugated BC05 (anti-C-terminus of Aβ1-42) to detect Aβ1-42. According to the manufacturer, no cross reaction between Aβ1-40 and Aβ1-42 is observed. The standard solutions of Aβ monomers consist of synthetic Aβ1-40 or Aβ1-42 provided in units of pg/mL to be used for calibration.
ApoE4 was measured in the plasma using the ApoE4/Pan-ApoE ELISA kit (MBL, Nagoya, Japan).
Western Blot Analysis
The anti-Aβ17–24 monoclonal antibody 4G8 (SIG-39220, Funakoshi; Tokyo, Japan) and anti-human amyloid β E22P (Aβ10–35, toxic oligomers of Aβ with a turn at positions 22 and 23) monoclonal antibody 11A1 (IBL; Fujioka, Gunma, Japan)32 were used as the first antibodies. An anti-Aβ1–16 monoclonal antibody, 6E10 (SIG-39320, Funakoshi; Tokyo, Japan), was also investigated, but its sensitivity was not enough to prove Aβ oligomers in this study. Immunoprecipitation with anti-Aβ antibody was not performed due to anticipated low yield of Aβ oligomers and monomers. At this point, 9 μL of each plasma sample was mixed and heated with 4× Bolt LDS sample buffer (Invitrogen, Carlsbad, CA, USA) and electrophoresed on NuPAGE Novex 4% to 12% Gel BisTris (Invitrogen, Carlsbad, CA, USA) in NuPAGE MES SDS running buffer in a reducing condition. Gel samples were transferred to a polyvinylidene-di-fluoride membrane and blocked overnight at 4°C in 0.3% nonfat skim milk/Tris-buffered saline with 0.1% Tween 20 (TBST-T) in the context of 4G8 or for 1 h at 37°C in 3% nonfat skim milk/TBST-T in the context of 11A1. The membranes were proved with 5 μg/mL of 4G8 or 3 μg/mL of 11A1, then with 0.25 μg/mL (1/4000) anti-mouse immunoglobulin G (H&L) goat antibody peroxidase-conjugated, and preadsorbed with serum proteins of humans and other species (Rockland, Limerick, PA, USA). Finally, the membranes were treated with ECL Prime (GE Healthcare, Chicago, IL, USA) for chemiluminescence detection. The first antibody specificity of the detected bands was confirmed when compared with the results of the second antibody alone. The brain homogenate of human APP transgenic mice, kindly provided by Dr. Takayoshi Mamiya, was used as a positive control.
Statistical Analysis
All data are expressed as means ± standard deviations (SD) unless otherwise specified. Differences were determined using a Wilcoxon rank-sum test for nonparametric variables and analysis of variance for the correlation analysis of two factors, unless otherwise specified, by using the statistical package JMP12 (SAS Institute Inc., Cary, USA). For these analyses, p-values < 0.05 were considered to be statistically significant.
Results
The ELISA for Aβ oligomers (with antibody 82E1 which detects the N-terminus of Aβ1-16) used in this study can detect Aβ oligomers with two or more Aβ-specific epitopes in a single molecule. This includes oligomers equal to or larger than the Aβ dimer. The Aβ oligomers described in this paper include sizes ranging from dimer to decamer and include higher molecular weight oligomers. For clarity, the concentrations of Aβ oligomers measured by this ELISA are expressed in units of pmol/L.
Removal Aβ Oligomers from Plasma with Membrane A or Membrane B
The basic concept for concentrating and removing Aβ oligomers from peripheral circulation by membrane separation is as follows: blood collected from study-eligible patients was processed in a plasma separator, and the separated plasma was then introduced into a device composed of hollow-fiber membranes with larger pore sizes than those used in hemodialyzers (Figure 1B). Large Aβ oligomers cannot effectively pass through the pores in these membranes and are retained in the hollow fibers and discarded in waste plasma (Figure 1C). As per this basic concept, an experimental circuit was designed to remove Aβ oligomers from isolated plasma samples (Figures 2A and 3A); in this case, previously isolated plasma samples were introduced without the use of the attached plasma separator. This approach led to successful clearance of Aβ oligomers from the plasma samples, with reductions to 23% and 0% of the original concentrations within 15 mins by Membranes A and B, respectively (Figure 3B). In contrast to what we observed for the Aβ oligomers, the Aβ monomer clearance was not as effective, with reductions to 69% ± 11% (Aβ1–40) and 56% ± 8% (Aβ1–42) of their original concentrations by Membrane A (solid lines in Figure 3C) and to 85% ± 8% (Aβ1–40) and 77% ± 19% (Aβ1–42) by Membrane B (dotted lines in Figure 3C). As shown in Figure 3D and E, both Membranes A and B successfully concentrated Aβ oligomers inside the lumen of the hollow fibers. For Membrane A, the Aβ oligomer concentration in the pool underwent a reduction from 15.8 ± 4.1 to 3.3 ± 5.8 pmol/L during the 60 mins circulation process (Figure 3D, left). Nearly the entire amount of Aβ oligomers detected in the pool prior to circulation was concentrated inside the lumen of Membrane A at the end of the process (Figure 3D, right); a similar outcome resulted from the use of Membrane B (Figure 3E).
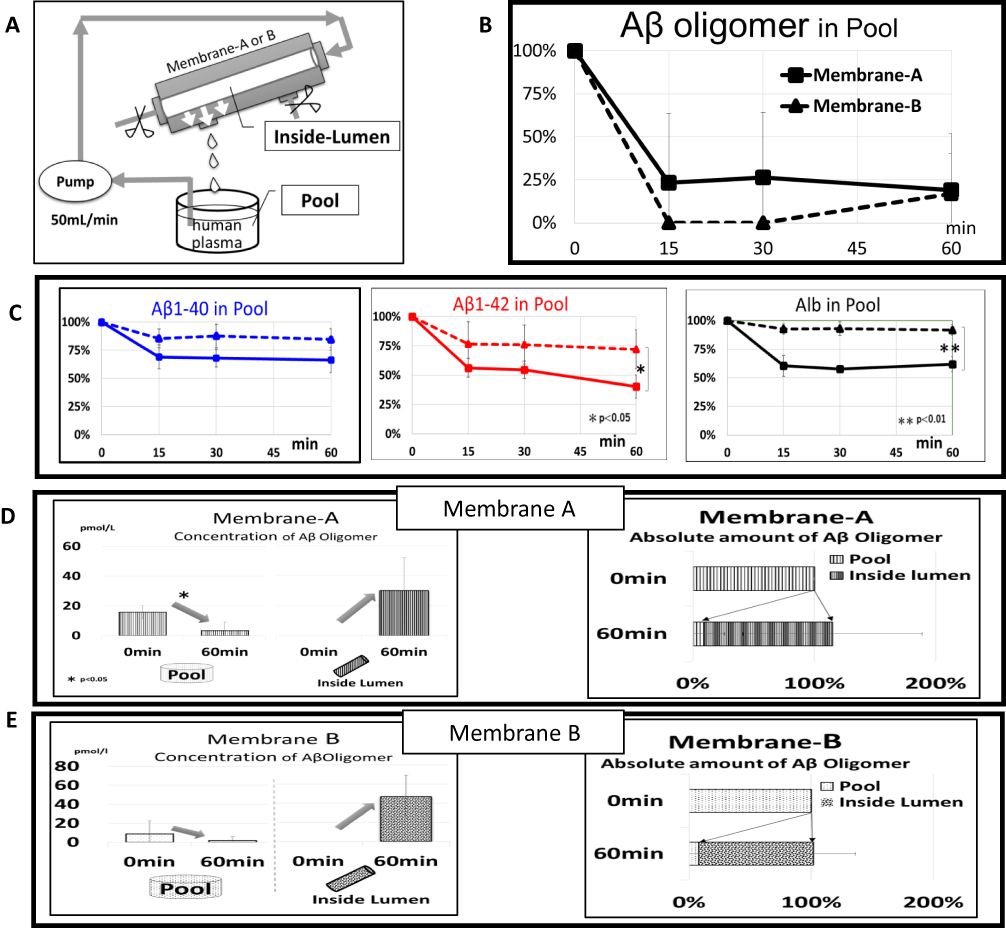 |
Figure 3 Removal of plasma Aβ oligomers by Membrane A or B. (A) In vitro experimental system. Human plasma containing Aβ oligomers in the reservoir (Pool) was introduced into Membrane A or B at 50 mL/min, and the filtrate of membranes was returned to Pool. High-molecular-weight Aβ oligomers were retained and concentrated in hollow fibers of membranes (Inside-Lumen). (B and C) Time course of concentration changes in Pool for Aβ oligomers (B) and Aβ monomers including Aβ1–40 (C, left, blue lines) and Aβ1–42 (C, middle, red lines), and albumin (C, right). The solid line with square marks represents Membrane A, whereas the dotted line with triangle marks represents Membrane B. (D and E) Comparison of Aβ oligomers at the start and end points of circulation of Pool and Inside-Lumen: concentration change of Aβ oligomers with Membrane A (D, left) and Membrane B (E, left) as well as the absolute amount Aβ oligomers with Membrane A (D, right) and Membrane B (E, right). The concentrations of Aβ1-42 and albumin in Pool from Membrane B at 60 mins were significantly higher than those detected in Pool from Membrane A (p < 0.01 for albumin and p < 0.05 for Aβ1-42. Error bars show SD. |
Approximately 30% and 80% of the plasma albumin (56 kDa) content can pass through Membranes A and B, respectively; sieving coefficients are included in the Materials and Methods. Likewise, findings shown in Figure 3B and E (right) indicate that nearly the entire Aβ oligomers in Pool at the start was cleared by Membrane B with a larger pore size. As such, we estimate the molecular size of intact Aβ oligomers in plasma to be larger than 56 kDa.
Removal of Plasma Aβ Oligomers and Monomers Simultaneously with Membrane B and A HexDC Column
As shown, Membranes A and B effectively cleared Aβ oligomers but not Aβ monomers from the plasma; additional systems were explored for the simultaneous removal of both Aβ oligomers and Aβ monomers. Mini-columns composed of HexDC, one of the most effective materials for Aβ monomer clearance, can remove these molecules directly from whole blood.8,16 These columns were used concurrently with Membrane B. Membrane B was selected as it limited albumin loss in comparison to results obtained with Membrane A (Figure 3C, right).
Figures 2B and 4A display the experimental circuit. In a clinical setting, a plasma separator would be included at the outlet of the HexDC column; this device would separate plasma from half of the circulating whole blood. To model this feature in our experimental circuit, the plasma outflow was divided in half, with half circulated through Membrane B and the remainder returned directly to the pool. The waste plasma was discarded at a rate of 1 mL/min. The filtrate of Membrane B was returned to the pool with replacement saline provided also at 1 mL/min.
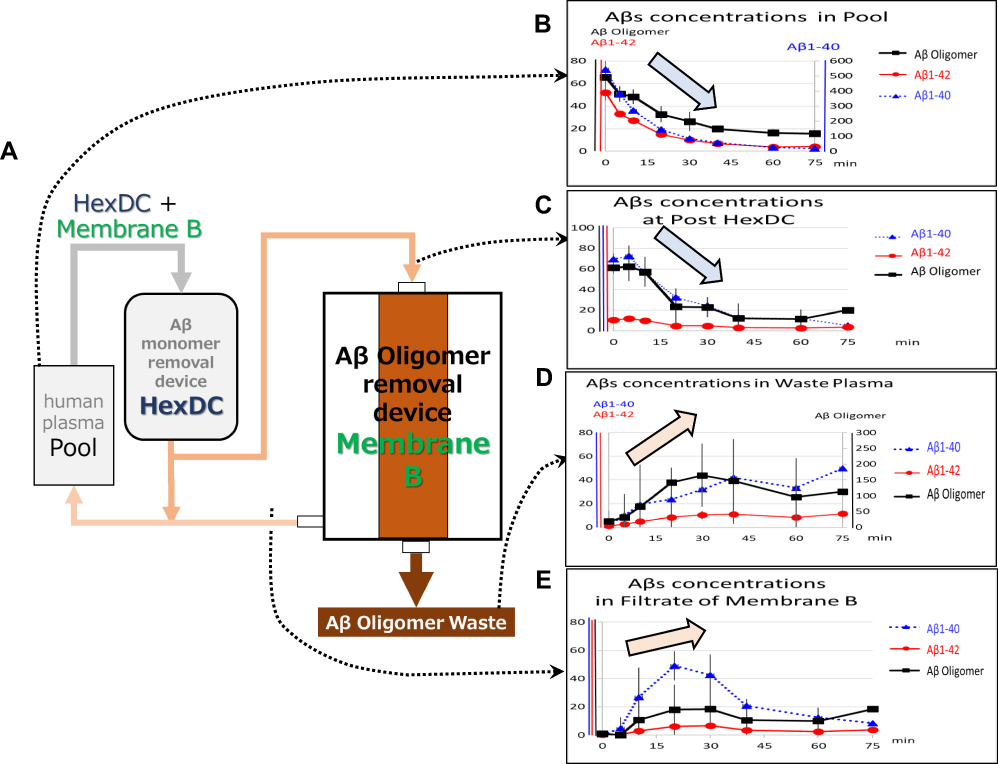 |
Figure 4 Simultaneous removal of Aβ monomers and oligomers (via HexDC columns and Membrane B). (A) The experimental circuit. Human plasma containing Aβ oligomers in the reservoir (Pool) was introduced into the HexDC mini-column at 30 mL/min. The plasma that passed through the HexDC column was divided in half as 15 mL/min for Membrane B and 15 mL/min to return to Pool. The plasma in Inside-Lumen of Membrane B was continuously discarded at 1 mL/min while adding replacement saline (1 mL/min) before returning to Pool. The filtrate of Membrane B was returned to Pool. (B–E) Time course of the concentration changes of Aβ oligomers (black solid thick line with square marks, pmol/L), Aβ1–40 (blue dotted line with triangle marks, pg/mL), and Aβ1–42 (red solid thin line with circle marks, pg/mL); (B) concentrations in Pool (left vertical axis: Aβ oligomers and Aβ1–42; right vertical axis: Aβ1–40); (C) concentrations in the (outlet) post-HexDC column stage (left vertical axis: all Aβs); (D) concentrations in waste plasma (left vertical axis: Aβ1–40 and Aβ1–42; right vertical axis: Aβ oligomers); (E) concentrations in the filtrate of Membrane B (left vertical axis: all Aβs). Arrows indicate the tendency of Aβ oligomer change. Error bars show SD. |
The Pool concentrations of Aβ oligomers and monomers (both Aβ1–40 and Aβ1–42) decreased with increasing circulation time (Figure 4B). Likewise, HexDC columns promoted very efficient clearance of Aβ monomers. Their removal efficiencies were 87.1 ± 1.4% (Aβ1–40) and 77.5 ± 3.9% (Aβ1–42) at the start of circulation, and 78.8 ± 2.3% (Aβ1–40) and 69.3 ± 6.6% (Aβ1–42) after 20 mins. Aβ1–40 concentrations were ~400 to 500 pg/mL in the Pool, just prior to the inlet (Figure 4B, right vertical axis) and were reduced to ~60 to 70 pg/mL after circulation through the HexDC column (Figure 4C, left vertical axis).
In contrast to results obtained with Aβ monomers, the removal efficiency of Aβ oligomer by HexDC was as low as 8.3 ± 9.2% at the start of circulation. The Aβ oligomer concentrations at the outlet of the HexDC column (Post HexDC) were similar to those measured at the inlet, and were equal to those in Pool (Figure 4B and C, black solid lines with closed square marks). The decreasing concentrations of Aβ oligomer detected at the outlet of the HexDC column (Figure 4C) reflected decreasing Aβ oligomer concentrations in Pool (at the inlet of HexDC column; Figure 4B), due to Aβ oligomer clearance by Membrane B, not by the HexDC column. The Aβ oligomer concentrations in the waste plasma increased during 30 to 40 min of circulation and remained high thereafter (Figure 4D), the reverse of the findings presented in Figure 4B (Pool). Interestingly, the concentrations of Aβ monomers in the waste plasma also increased (Figure 4D). The concentrations of all Aβs in the filtrate of Membrane B, particularly Aβ1–40, increased during the first half of the circulation period through Membrane B (0–30 mins) and then decreased (Figure 4E). The concentration of Aβ oligomer detected in Filtrate of Membrane B also showed a tendency to increase, although the results did not achieve statistical significance (Figure 4E).
Removal of Plasma Aβ Oligomers and Monomers Simultaneously with Membrane B and Hemodialyzers
Polysulfone hemodialyzers were used in an adsorptive filtration mode19 with a 3 mL/min filtration rate as an alternative method to eliminate Aβ monomers (Figure 5A). The polysulfone hemodialyzer promoted very efficient clearance of Aβ monomers. Their removal efficiencies were 96.8 ± 0.8% (Aβ1–40) and 90.8 ± 3.0% (Aβ1–42) at the start of circulation and 88.1 ± 0.8% (Aβ1–40) and 75.6 ± 5.9% (Aβ1–42) after 20 mins. The use of polysulfone hemodialyzers resulted in more effective and efficient clearance of Aβ monomers when compared to results achieved using the HexDC columns. This observation may be attributed to the relatively large membrane area provided by the hemodialyzers in comparison to the volume in Pool. Based on the observed removal efficiencies, the Aβ monomer concentrations in Pool, including both Aβ1–40 and Aβ1–42, decreased rapidly with increasing circulation time (Figure 5B). Similar to what we observed with the HexDC columns, Aβ monomer concentrations at the outlet of polysulfone dialyzers were lower than those in Pool (Figure 5B and C). For example, the concentration of Aβ1–40 of ~600 to 800 pg/mL detected in Pool (Figure 5B, right vertical axis) was reduced to ~20 to 40 pg/mL at the outlet/post-dialyzer (Figure 5C, left vertical axis) at the start of circulation. In contrast to their impact on the clearance of Aβ monomers, the polysulfone hemodialyzer together with Membrane B resulted in no decrease in Aβ oligomer concentration in Pool (Figure 5B); these results differ from those obtained using the HexDC and Membrane B (Figure 4B). Figure 5B and C show that Aβ oligomer concentrations at the outlet/post dialyzer were similar to those in Pool; these results indicate that the polysulfone dialyzers cleared little to no Aβ oligomers. The Aβ oligomers were concentrated by Membrane B and discarded in Waste plasma (Figure 5D). However, Aβ oligomer concentrations in Filtrate of Membrane B gradually increased from beneath the minimum detection limit (approximately 3 pmol/L) to 17.2 ± 4.4 pmol/L at 60 min of circulation (Figure 5E). Interestingly, the concentrations of Aβ monomers, both Aβ1–40 and Aβ1–42, which are small enough to pass through the pores of Membrane B, were higher in Waste plasma (Figure 5D) than in the outlet/post dialyzer solution (Figure 5C), notably so after 30 min of circulation (Figure 5C). For example, while the concentration of Aβ1–40 was ~10 pg/mL in Post-Dialyzer (dotted line in Figure 5C, left vertical axis), its concentration was approximately 25 pg/mL in Waste plasma at 40 min of circulation (dotted line in Figure 5D, left vertical axis).
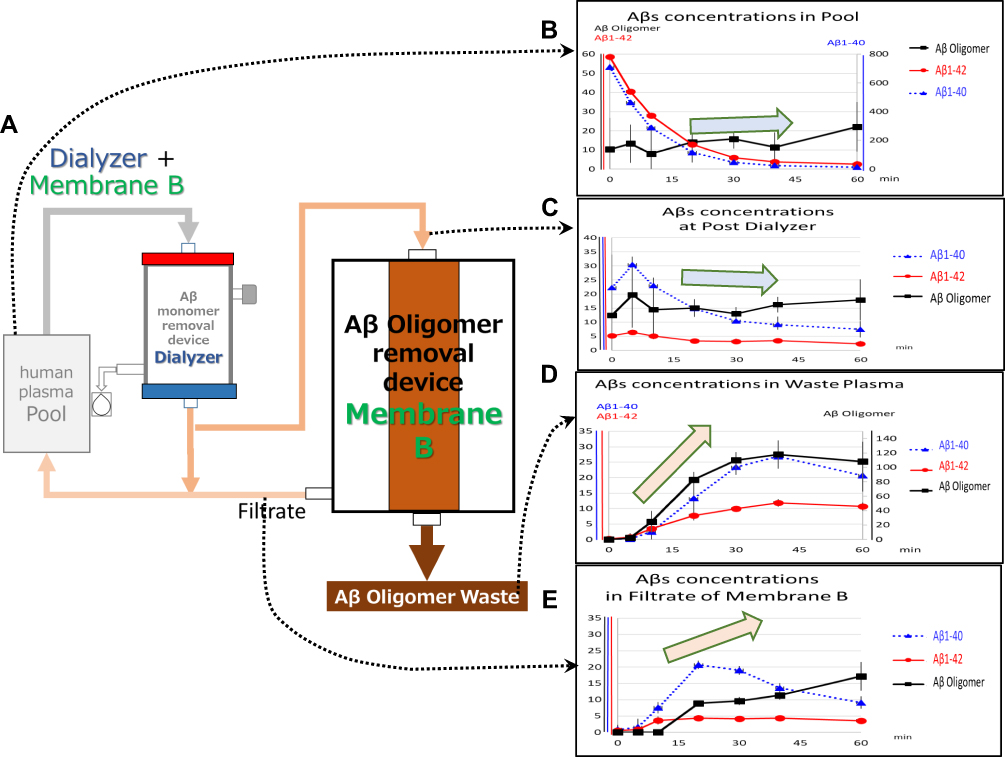 |
Figure 5 Simultaneous removal of Aβ monomers and oligomers (via polysulfone hemodialyzers and Membrane B). (A) The experimental circuit. Human plasma containing Aβ oligomers in the reservoir (Pool) was introduced into the polysulfone dialyzer at 30 mL/min. Aβ monomers were removed in an adsorptive filtration mode with a 3 mL/min filtration rate. In total, 15 mL/min of the plasma that passed through the polysulfone dialyzer was introduced to Membrane B, and the rest of the plasma was returned to Pool at 12 mL/min. The filtrate of Membrane B was returned to Pool, and the plasma in Inside-Lumen of Membrane B was continuously discarded at 1 mL/min. Replacement saline was added at 4 mL/min at before returning to Pool. (B–E) Time course of the concentration changes of Aβ oligomers (black solid thick line with square marks, pmol/L), Aβ1–40 (blue dotted line with triangle marks, pg/mL), and Aβ1–42 (red solid thin line with circle marks, pg/mL); (B) concentrations in Pool (left vertical axis: Aβ oligomers and Aβ1–42; right vertical axis: Aβ1–40); (C) concentrations in the (outlet) post-dialyzer stage (left vertical axis: all Aβs); (D) concentrations in waste plasma (left vertical axis: Aβ1–40 and Aβ1–42; right vertical axis: Aβ oligomers); (E) concentrations in the filtrate of Membrane B (left vertical axis: all Aβs). Arrows indicate the tendency of Aβ oligomer change. Error bars show SD. |
Aβ Oligomers and Monomers Increased in Membrane B During Simultaneous Removal
To determine the mechanisms underlying the observed increases of Aβ oligomer and monomers (Aβ1–40 and Aβ1–42) concentrations during circulation with Membrane B and HexDC or polysulfone dialyzer, Aβ concentrations at the inlet of Membrane B (a point that is equivalent to the outlet/post-HexDC or outlet/post Dialyzer) (Pre-Membrane B), at the outlet to the plasma waste (Waste Plasma), and in the filtrate of Membrane B (Filtrate of Membrane B) are summarized in Table 2. As shown in italics, many Aβ concentrations detected in Waste plasma and Filtrate were higher than those detected at the inlet of Membrane B. This result implies that Aβ oligomers and Aβ monomers were “increased” inside the lumen of Membrane B during circulation.
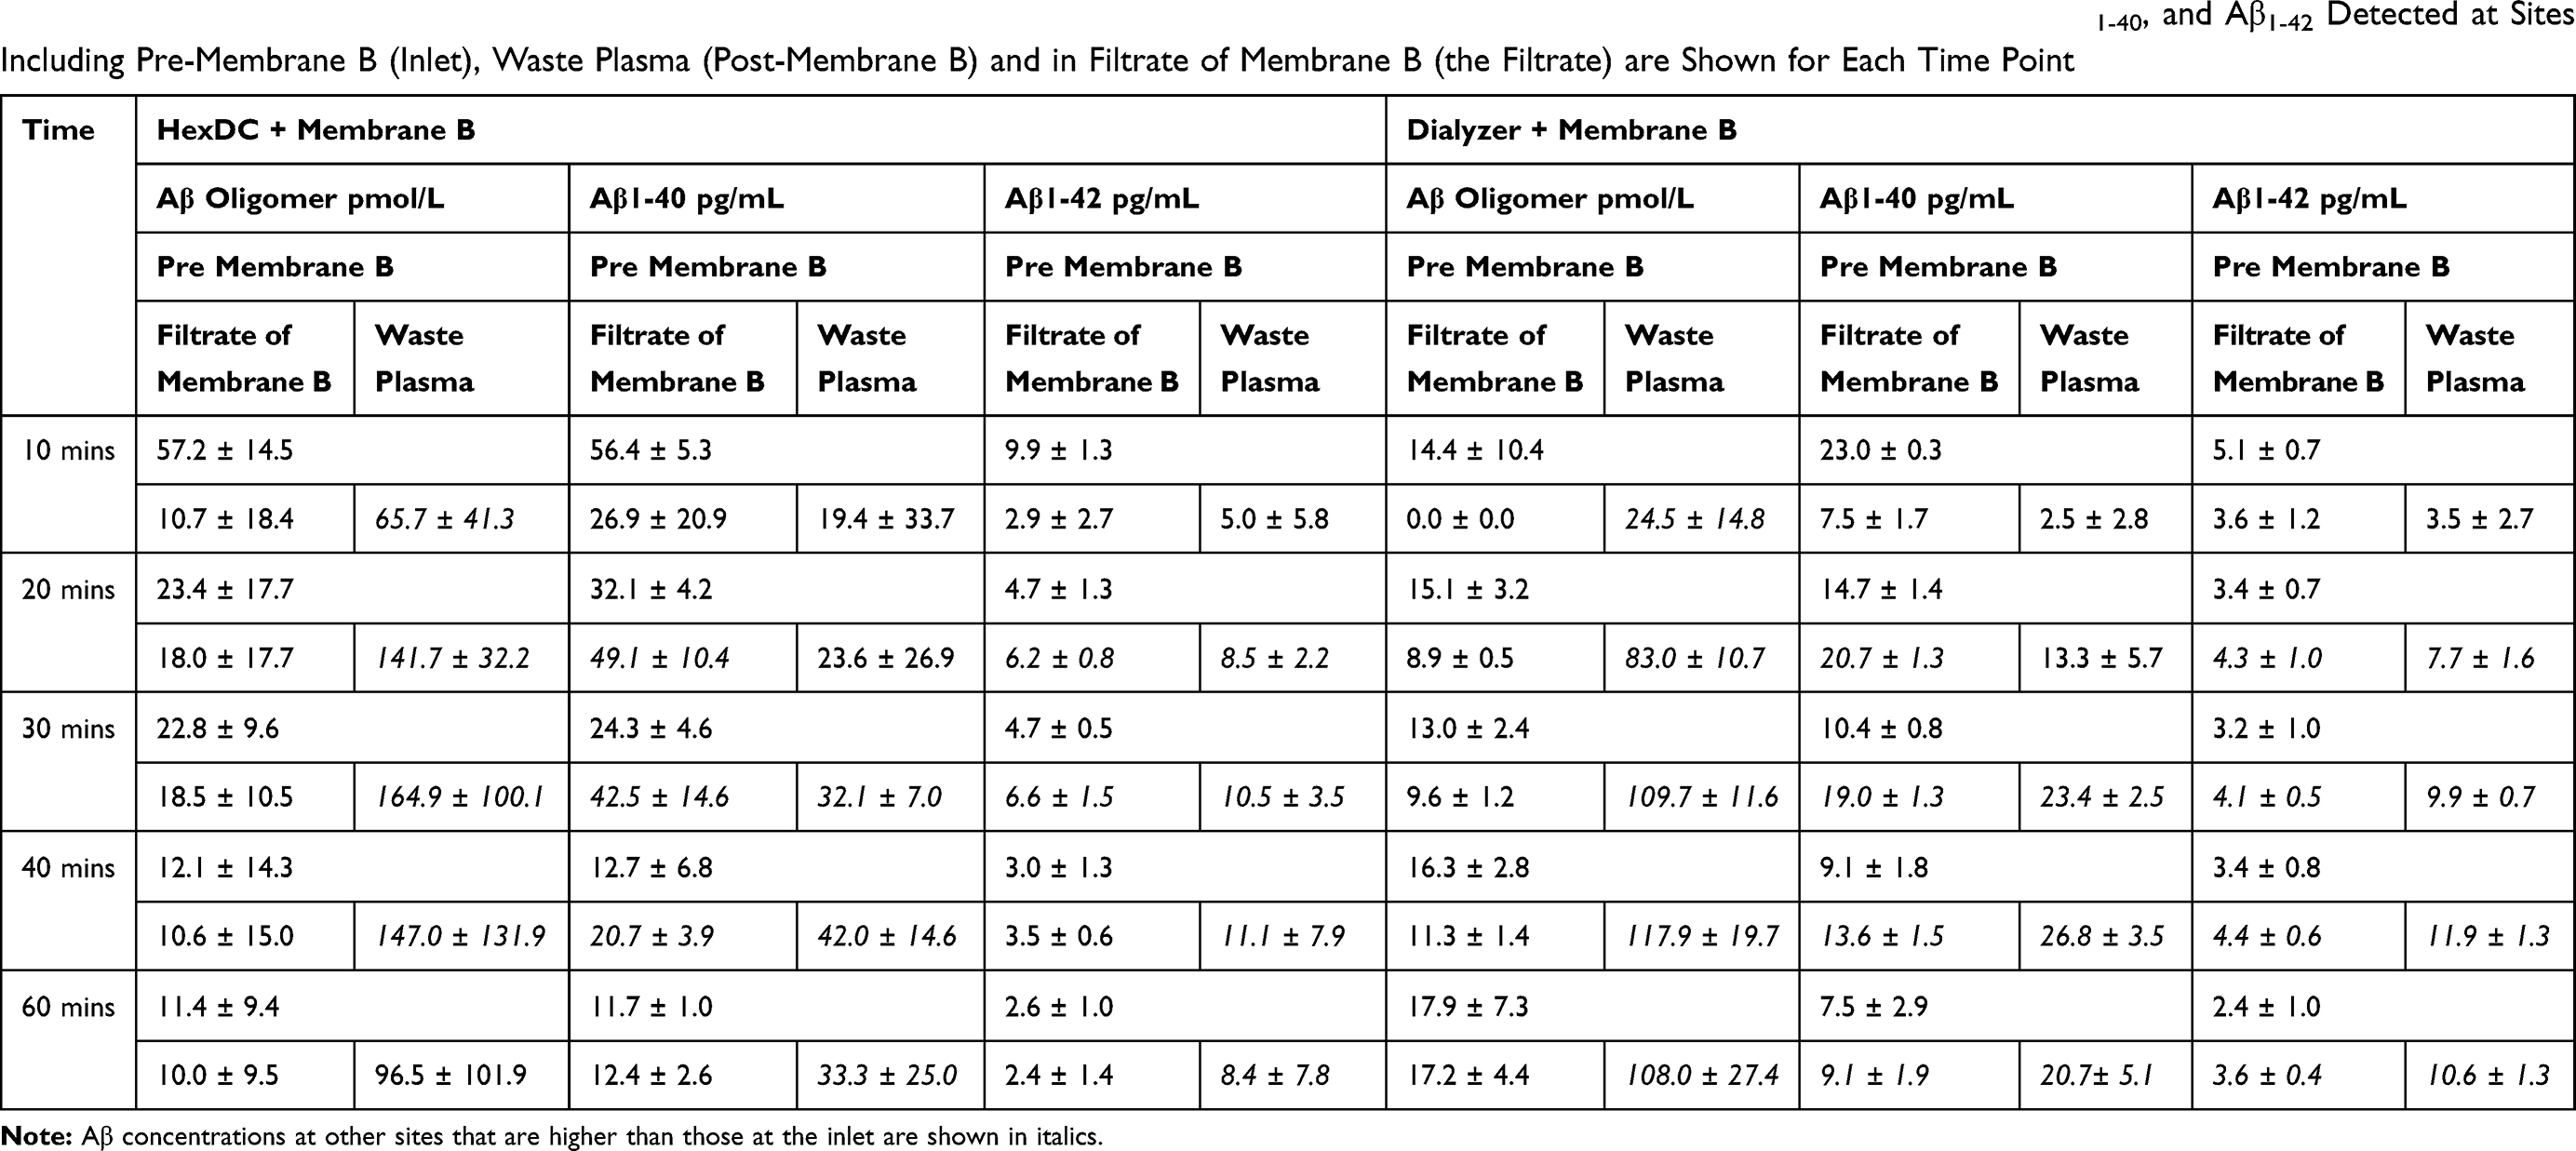 |
Table 2 Aβ Concentrations Determined at Pre-, Post-(Waste) and Within the Filtrate of Membrane B. The Concentrations of Aβ Oligomer, Aβ1-40, and Aβ1-42 Detected at Sites Including Pre-Membrane B (Inlet), Waste Plasma (Post-Membrane B) and in Filtrate of Membrane B (the Filtrate) are Shown for Each Time Point |
The relative concentrations of Aβ monomers and oligomers, comparing those in the waste plasma and filtrate to those at the inlet of Membrane B were calculated. A time course of the relative Aβ concentrations in Waste plasma (dotted lines) and Filtrate (solid lines) is shown in Figure 6. The relative concentration of the Aβ oligomers in Waste plasma exceeded 100% at time points as early as 10 mins and reached their highest levels at 1200% at 40 mins of circulation through HexDC and Membrane B (dotted line in Figure 6A); these values reached 800% at 30 mins of circulation through the polysulfone dialyzer and Membrane B (dotted line in Figure 6B). These results indicate 14-fold and 8-fold increases in the concentrations of Aβ oligomers inside the lumen of Membrane B. As mentioned earlier, the ELISA can detect Aβ oligomers equal to or larger than the Aβ dimer. As such, the observed increase in Aβ oligomer concentration implies dissociation of larger Aβ oligomers into many smaller Aβ oligomers, taking into account the mass balance inside the lumen of Membrane B. In contrast to what we observed in Waste plasma, the relative concentration of Aβ oligomers in Filtrate was as low, measured at or near unit (100%) during 20–60 mins of circulation (with HexDC and Membrane B, solid line in Figure 6A; with polysulfone dialyzer, solid line in Figure 6B). This finding implies that the smaller Aβ oligomers (including those smaller than albumin) were capable of passing through pores of Membrane B. The smaller Aβ oligomers may be returned to the pool and will be reintroduced into circulation through Membrane B.
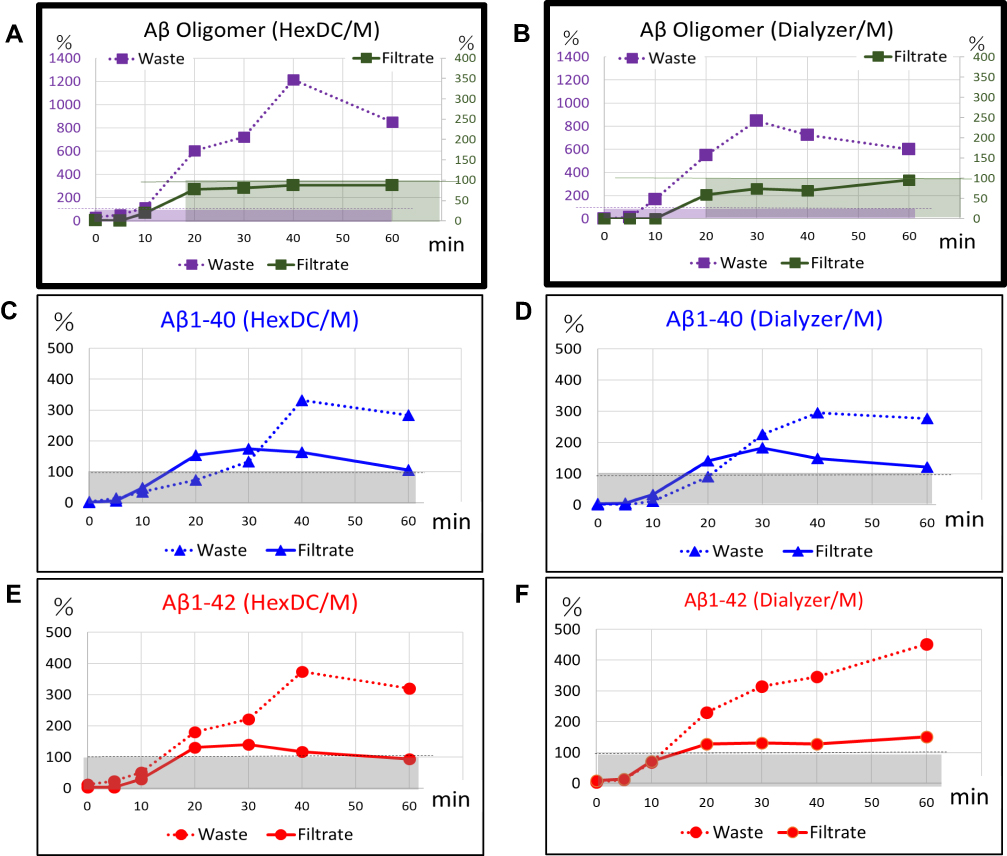 |
Figure 6 Relative concentrations of Aβ monomers and oligomers in waste plasma and filtrate of Membrane B. Relative concentrations of Aβ monomers and oligomers detected in Waste plasma (dotted lines) and Filtrate (solid lines) are shown as percentages compared with those at the inlet of (Pre) Membrane B. (A, B) Relative Aβ oligomer concentrations, (C, D) relative Aβ1-40 concentrations (blue lines), (E, F) relative Aβ1-42 concentrations (red lines). (A, C, E) Results of experiments that include HexDC and Membrane B; (B, D, F) results of the experiments that include a dialyzer and Membrane B. Dashed lines show 100% and boxes show area under 100%. |
As we observed with the Aβ oligomers, relative concentrations of monomer Aβ1–40 detected in Waste plasma exceeded 100% at 20–30 min and reached 300% at approximately 40–60 mins of circulation (with HexDC, dotted line in Figure 6C; with polysulfone dialyzer, dotted line in Figure 6D). These results suggest dissociation of Aβ oligomers into multiple Aβ1–40 monomers. Unlike Aβ oligomers, relative Aβ1–40 concentrations in Filtrate exceeded 100% at around 20–60 mins (solid lines in Figure 6C and D). Relative concentrations of Aβ1–42 monomer in Waste plasma also exceeded 100% at 20 mins of circulation and reached ~400% at 40 mins (with HexDC, dotted line in Figure 6E), or over 400% at 60 mins (with polysulfone dialyzer, dotted line in Figure 6F). As with Aβ1–40, relative Aβ1–42 concentrations in the filtrate increased to 100% after 20 mins (solid lines in Figure 6E and F). Relative Aβ1–42 concentrations in Waste plasma and Filtrate in treatment with a polysulfone dialyzer and Membrane B seemed to increase continually through the end of circulation. Taken together, the findings shown in Figure 6C and D strongly suggest dissociation of Aβ oligomers into Aβ1–40 and Aβ1–42 monomers inside the lumen of Membrane B during the plasma circulation.
Removal of Plasma Aβ Oligomer in Patients Undergoing DFPP
As a preliminary human study, we evaluated the concentration of Aβ oligomers in plasma from patients undergoing DFPP. The purpose of DFPP in this setting was the removal of anti-erythrocyte antibodies from recipients of living-donor kidney transplantation with blood-type incompatibility. The circuit for DFPP was similar to that shown in Figure 1C, where the Aβ oligomer removal device was Membrane A. Three patients were recruited; demographics and clinical conditions are summarized in Table 1. The observations made for Patient 1 are shown in Figure 7A–E. Aβ oligomers in the plasma responded to DFPP and went from ~15, 23, and 6 pmol/L to beneath the detection limit within 120 mins of DFPP on day 1 and within 60 mins on days 3 and 6 (Figure 7A), respectively. However, plasma Aβ oligomer levels increased to 23.4 and 5.8 pmol/L between days 1 and 3 and between days 3 and 6, respectively (➀ and ➁ in Figure 7A), suggesting that DFPP resulted in an increase in the concentration of Aβ oligomers in peripheral circulation, although they were still effectively concentrated in the waste plasma (Figure 7B). Almost all Aβ oligomers existing in the plasma at the start of each DFPP session were concentrated and discarded in the waste plasma, as shown for days 1 and 6 (Figure 7C). However, on day 3, only one-third of Aβ oligomers detected in patient plasma were concentrated in the waste plasma (Figure 7C). The Aβ monomer concentrations in the plasma did not decrease during each DFPP session as this modality does not include features that would promote their removal; however, we did detect a slight but significant increase in Aβ1–40 (Figure 7D and E).
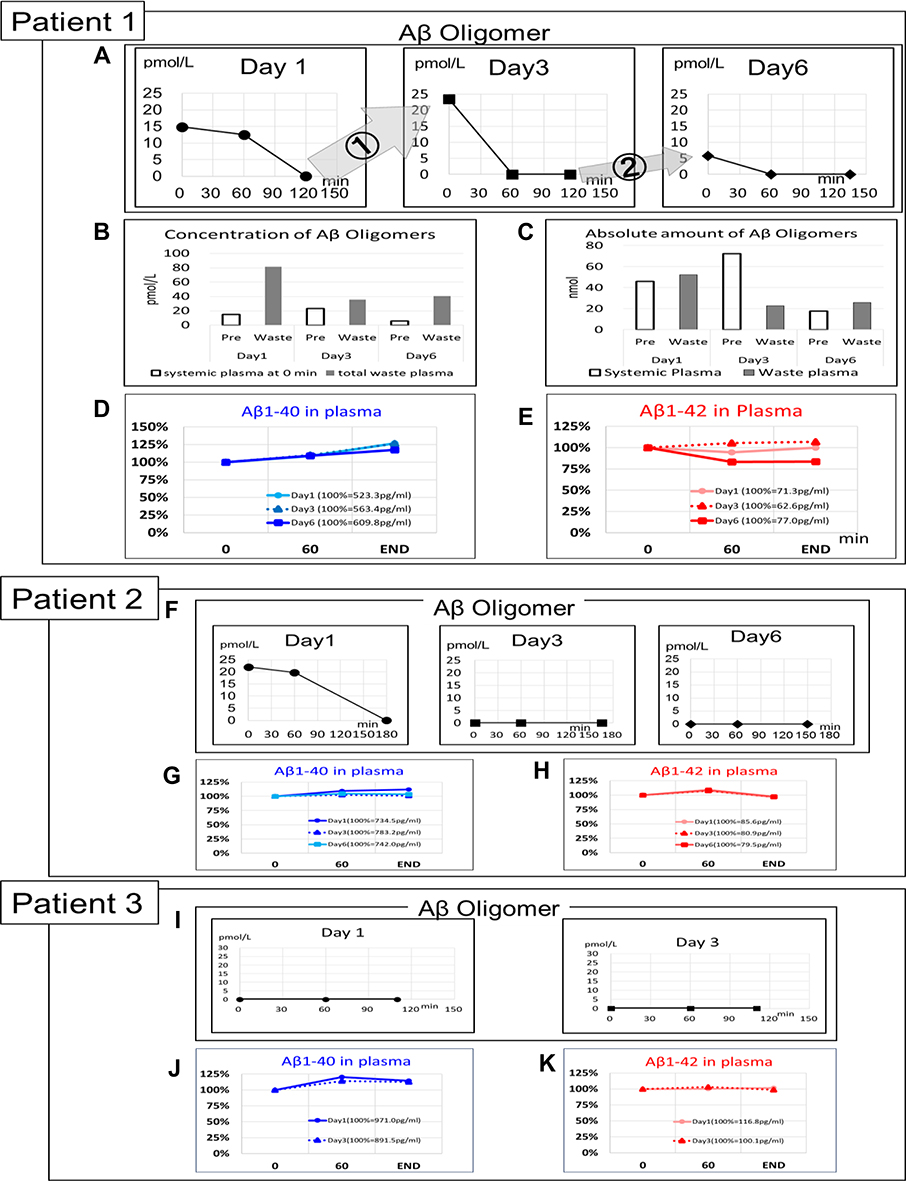 |
Figure 7 Removal of plasma Aβ oligomer by Membrane A of patients treated with DFPP therapy. (A–E) Patient 1; (F–H) Patient 2; (I–K) Patient 3 (Table 1). (A, F, I) Concentration change of Aβ oligomers during each session. (A) Increase (influx into the blood) of Aβ oligomers was observed from Days 1 to 3 (➀), and Days 3 to 6 (②) for Patient 1. (B) The concentrations of Aβ oligomers in the plasma of systemic circulation at the start of DFPP (pre-) and in the waste plasma at the end of each session. The concentration of Aβ oligomers in the waste plasma of each DFPP session was determined after all discarded plasma was mixed well. (C) Absolute amount of Aβ oligomers in the systemic plasma at the start of DFPP (pre-) and waste plasma at the end of each session. (D–E, G–H, J–K) Concentration changes of Aβ1–40 (D, G, J; blue lines) and Aβ1–42 (E, H, K; red lines) during each session. The gray, dotted, and solid black lines represent Days 1, 3, and 6, respectively. Aβ concentration at the start of DFPP was set as 100%. The starting Aβ concentrations for Patient 1 were 523.3 pg/mL at Day 1, 563.4 pg/mL at Day 3, and 609.8 pg/mL at Day 6 for Aβ1–40 (D) and 71.3 pg/mL at Day 1, 62.6 pg/mL at Day 3, and 77.0 pg/mL at Day 6 for Aβ1–42 (E). The starting Aβ concentrations for Patient 2 were 734.5 pg/mL at Day 1, 783.2 pg/mL at Day 3, and 742.0 pg/mL at Day 6 for Aβ1–40 (G) and 85.6 pg/mL at Day 1, 80.9 pg/mL at Day 3, and 79.5 pg/mL at Day 6 for Aβ1–42 (H). The starting Aβ concentrations for Patient 3 were 971.0 pg/mL at Day 1 and 891.5 pg/mL at Day 3 for Aβ1–40 (J) and 116.8 pg/mL at Day 1 and 100.1 pg/mL at Day 3 for Aβ1–42 (K). |
The albumin-sieving coefficient of 0.3 for Membrane A indicates that approximately 30% of albumin presented in the plasma sample can pass through. Findings shown in Figure 7A–C document clearance of Aβ oligomers by Membrane A, suggesting that the molecular size of plasma Aβ oligomers was most likely larger than 56 kDa (the molecular weight of albumin); these results are similar to those shown in Figure 3.
In Patient 2, the concentration of plasma Aβ oligomers at the start of DFPP (22.0 pmol/L) was reduced to under the detection limit on day 1; however, no increase in Aβ oligomers was observed between days 1 and 3 (Figure 7F). Furthermore, no plasma Aβ oligomers were detected in plasma during DFPP sessions at days 3 and 6. At day 1, plasma Aβ oligomers were concentrated in the waste plasma (35.4 pmol/L) at the end of the DFPP session. The Aβ monomer concentrations in the circulating plasma (both Aβ1–40 and Aβ1–42) remained unchanged during the DFPP sessions (Figure 7G and H).
Finally, for Patient 3, the concentrations of plasma Aβ oligomers were under the detection limit at days 1 and 3 (Figure 7I), whereas the concentrations of Aβ monomers remained unchanged (Figure 7J and K).
Western Blot Analysis
We compared our results with those obtained by another method, SDS-PAGE and Western blot analysis were performed using the anti-Aβ17–24 antibody 4G8. High-molecular-weight immunoreactive bands consistent with molecular weights of 70 to 150 kDa and >150 kDa were detected with this antibody, as shown in Figure. 8A–C (†† and †, respectively). These immunoreactive bands were present in human plasma samples prior to the start of treatment (pool at zero minutes, Figure 8A–C). After circulation through Membrane B, these proteins were detected in plasma waste (Figure 8B and C) at each time point and retained inside the lumen at the end of the trial (Figure 8A–C). When probed with anti-human amyloid β E22P monoclonal antibody 11A1, the Aβ oligomer-like bands of >150 kDa († in Figure 8D and E) initially detected in the pool underwent a gradual decrease. Dense 40–50 kDa bands were also detected with antibody 11A1 (closed triangles). The bands of lower molecular weight than 38 kDa are most likely non-specific (considered further in the Discussion).
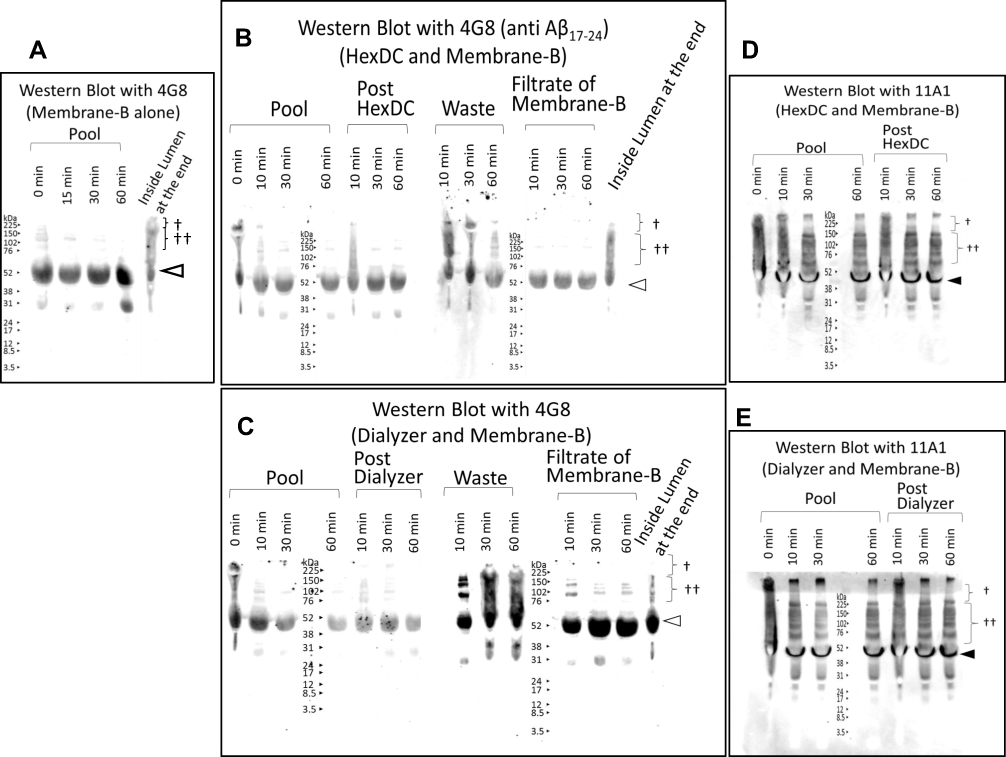 |
Figure 8 Preliminary Western blot analysis of the plasma treated using the Aβ oligomer removal system in vitro. The plasma treated with the Aβ oligomer removal system in vitro was investigated by Western blot analysis following electrophoresis of reduced SDS-PAGE results. (A–C) Proved with anti-Aβ17–24 antibody 4G8. (D, E) Proved with 11A1 (anti-human amyloid β E22P of Aβ10–35, toxic oligomers of Aβ with a turn at positions 22 and 23). (A) Plasma in Pool at zero, 15, 30, and 60 min of circulation and Inside-Lumen at the end of circulation treated with Membrane B alone. (B) Plasma in Pool at zero, 10, 30, and 60 min circulation; in the post-HexDC stage, in waste and in the filtrate of Membrane B at 10, 30, and 60 min and in Inside-Lumen at the end of treatment with Membrane B and HexDC. Sampling positions are shown in Figure 4. (C) Plasma in Pool at zero, 10, 30, and 60 min of circulation; in the post-dialyzer stage, in waste and in the filtrate of Membrane B at 10, 30, and 60 min and in Inside-Lumen at the end of treatment with Membrane B and polysulfone hemodialyzers. Sampling positions are shown in Figure 5. (D) Plasma in Pool at zero, 10, 30, and 60 min circulation, in the post-HexDC stage at 10, 30, and 60 min treated with Membrane B and HexDC. (E) Plasma in Pool at zero, 10, 30, and 60 min and in the post-dialyzer stage at 10, 30, and 60 min treated with Membrane B and hemodialyzers. †, >150 kDa Aβ oligomer-like bands; ††, 70–150 kDa Aβ oligomer-like bands. The bands that migrate at ~57 kDa bands that are detected with antibody 4G8 (open triangles) are non-specific.37 Bands migrating at ~40–50 kDa were detected with antibody 11A1 (closed triangles). |
Discussion
Clearance of Aβ Oligomer from Plasma and Peripheral Circulation
As described above, Aβ oligomers can be efficiently cleared from plasma using membrane separation methods. This technique, which includes hollow-fiber membranes of varying pore size, can distinguish among molecules based on their shape and size (Figures 1D, 3B, 7A, and F). Although this method is only one modality of E-BARS, its rationale differs from methods used previously. Our previous approaches focused on hydrophobicity and differential absorption of Aβs.8,15,16,19 Using these methods, the clearance efficiencies for Aβ monomers using HexDC columns or polysulfone dialyzers were as high as 69% to 97% (Figures 4B and C, 5B, and C). Interestingly, almost no Aβ oligomers were removed by these methods. One possibility that may explain these findings: hydrophobic materials such as HexDC columns and polysulfone hemodialyzers have adsorption pockets on their surfaces that may be smaller than intact Aβ oligomers in plasma. Furthermore, the hollow-fiber material that constitutes both Membranes A and B is ethylene-vinyl alcohol copolymer (EVAL), which is the most highly inefficient materials for adsorbing Aβ monomers.16 Therefore, the actual adsorption of Aβ oligomers by Membranes A or B may not be contributing strongly to their efficient removal. Likewise, Aβ oligomers and monomers cleared from the blood by E-BARS are immediately discarded at the completion of extracorporeal blood purification, whereas administration of anti-Aβ antibodies may result in a prolonged half-time due to complex formation between Aβs and the antibodies.33,34
The membrane separation method we adapted for this study is not specific for Aβ oligomers. Membranes A and B remove all plasma components larger than albumin, including immunoglobulins, low-density lipoproteins (LDL), high-density lipoproteins (HDL), and coagulation factors. As such, clinical use of this membrane separation method as potential therapy for AD should be accompanied by administration of albumin, immunoglobulins and coagulants, particularly to patients undergoing repetitive and/or long-term treatment. Of note, the plasma donors in our study who were undergoing DFPP in association with a blood-type incompatible living-donor kidney transplant were provided with albumin supplementation. Plasma exchange for the treatment of AD is currently under study in a Phase 3 clinical trial. In the phase 3 study, whole plasma of AD patients is discarded, and administration of albumin in addition to healthy human plasma is required.27
The removal of Aβ monomers by HexDC or polysulfone dialyzers is based mainly on hydrophobic interactions between Aβ peptides and the surfaces of these materials.8,15,16,19 As such, E-BARS for Aβ monomers using HexDC or polysulfone dialyzers is not a specific process for elimination of Aβ monomers and can be mechanistically distinguished from AD therapies that feature anti-Aβ antibodies.
Aβ Binding to Erythrocytes or Albumin
In our method for E-BARS which focuses on the removal of Aβ oligomers, plasma separation from the cellular components of whole blood is a necessary first step prior to membrane separation (Figure 1C). No erythrocytes come into contact with Membrane A or B. If whole blood was introduced at this step, the erythrocytes would be discarded with the waste plasma; this would result in severe anemia. As such, the measurement methods for Aβ oligomers and monomers used in this study were designed for erythrocyte-free samples, including as plasma, serum and cerebrospinal fluid. Furthermore, we confirmed that albumin has no impact on the detection and quantitative analysis of Aβ monomers.8,17
In an earlier study, we found that E-BARS carried out on human subjects and that targeted whole blood with HexDC or dialyzers resulted in clearance of Aβ monomers Aβ1-40 and Aβ1-42.8,15,17,18,20 Most interesting, the extent of Aβ monomer clearance during a single four-hour session of hemodialysis matched the total Aβ monomer load in the brain.21
Pore Size of Membranes Used for Removal of Aβ Oligomers
The comparison of Membranes A and B revealed that they were equally effective at removing Aβ oligomers; while Membrane B seemed to have somewhat higher activity, the differences were not significant (Figure 3B). Furthermore, given its larger pore size, more albumin passed through Membrane B and was returned to the pool (or the subject) than was the case with Membrane A (Figure 3C, right). As such, Membrane B may be more suitable for use in a therapeutic system as it would minimize the need for albumin supplementation.
As shown in Figure 7, Membrane A was used for DFPP for recipients of living-donor kidney transplants with blood-type incompatibility. The therapeutic goal of DFPP in these cases was clearance of anti-erythrocyte immunoglobulins. Albumin loss from DFPP is not a substantial issue for these patients, as supplementation is already included as part of the therapeutic regimen. By contrast, albumin loss needs to be minimized in AD patients undergoing treatment and removal of Aβ oligomers with E-BARS with Membranes A or B. Therefore, based on the aforementioned findings, we used Membrane B for removal of Aβ oligomers and monomers.
Molecular Size of Aβ Oligomers in the Plasma
Previously, the molecular sizes and configurations of Aβ oligomers defined by migration in SDS-PAGE included dimers (~9 kDa), trimers (12 kDa), and oligomers of 56 kDa (Aβ*56), among others.3–6,31 It is critical to recognize that intact Aβ oligomers may undergo dissociation as part of the process of gel electrophoresis. As such, membrane separation methods may provide stronger and more accurate information regarding the size of fully intact Aβ oligomers. Figures 3B, 7A, and F show that the removal of Aβ oligomers with Membranes A or B successfully reduced the concentrations of Aβ oligomers. This finding suggests that the molecular size of a significant population of Aβ oligomers in plasma is larger than the pore sizes of both Membranes A and B. Based on the sieving coefficients for albumin at these membranes (0.3 and 0.8, respectively), the intact size of most Aβ oligomers in the plasma can be estimated as larger than that of albumin, ie, >56 kDa.
Despite denaturing conditions which include treatment with detergent (SDS) and reduction, our preliminary analysis of proteins that were cleared from the plasma pool by Membrane B revealed high-molecular-weight Aβ oligomer-like bands (Figure 8). Aβ oligomer-like bands at 70 to 150 kDa (denoted by ††) and > 150 kDa (denoted by †) were detected with both 4G8 and 11A1 antibody probes. The lower-mobility bands were decreased in the pool and were concentrated in waste plasma as well as inside the lumen of Membrane B. Of note, the 70 to 150 kDa bands might also include soluble amyloid precursor protein (sAPP)α (110 kDa).35,36 The bands detected with 4G8 that were migrating at 56–57 kDa (open triangles in Figure 8) may be non-specific (see reference 37), although we consider the possibility that they include immunoreactive Aβ*56.31 Dense 40–50 kDa bands were detected on blots probed with 11A1 (closed triangles). Other low-molecular-weight bands in Figure 8 remained constant throughout the procedure. We were unable to detect smaller Aβ oligomers (those less than 38 kDa) on Western blot. This may be because these oligomers are present in low concentrations; alternatively, these bands may be present but they may generate a relatively weak signal due to the presence of fewer epitopes on smaller Aβ oligomer molecules. Likewise, we did not perform immunoprecipitation studies with anti-Aβ antibodies as we anticipated a low yield from this procedure; the sensitivity of anti-Aβ1–16 monoclonal antibody 6E10 was not sufficient to permit detection of Aβ oligomers using this methodology. Future study will be necessary to explore several variations in Western blot protocol that will permit improved detection of these molecules.
Dissociation of Aβ Oligomers in Association with E-BARS
As noted above, the results of our studies using of Membranes A and B suggest that most plasma Aβ oligomers may be larger than albumin in their native condition (Figures 1D, 3B and C, 7A–C and F); Aβ oligomers larger than albumin were detected under denaturing conditions by Western blot (Figure 8). When interacting with Membrane A or B alone without concomitant Aβ monomer removal, the dissociation of Aβ oligomers was not readily apparent (Figure 3B–E, and 7B). This result is consistent with previous findings that suggest that a large kinetic barrier may impede the dissociation of Aβ oligomers.30 Aβ oligomers inside the membranes may face difficulties in undergoing dissociation in the presence of high concentrations of Aβ monomers (Figure 9A).
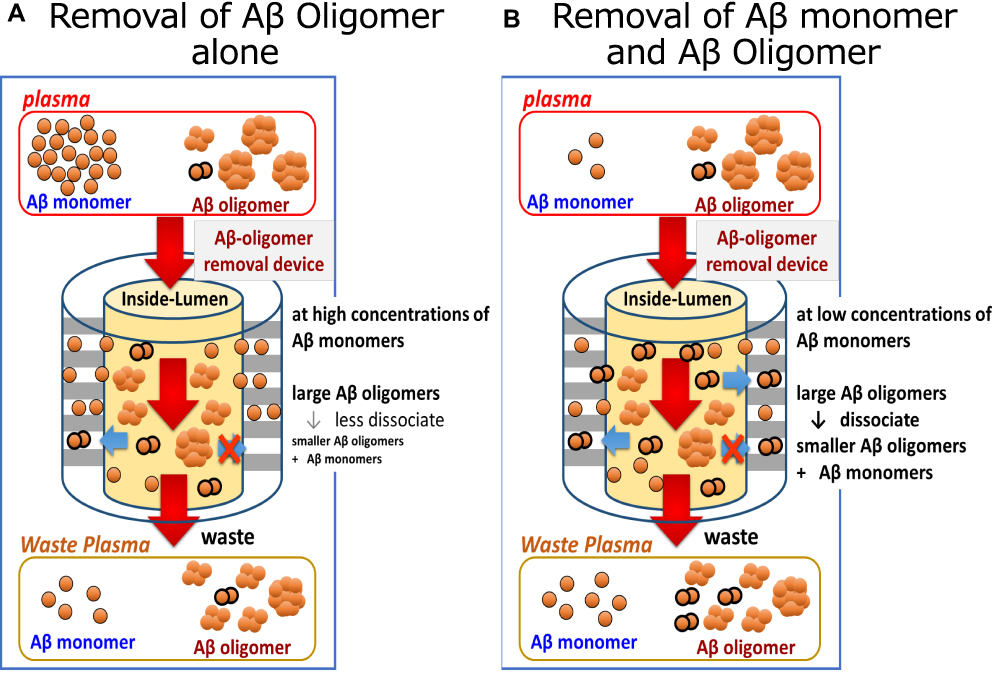 |
Figure 9 Schematic explanation of the dissociation of larger to smaller Aβ oligomers and Aβ monomers in the hollow fibers (Inside-Lumen) of the device for Aβ oligomer removal. (A) In the case of removing Aβ oligomers alone: high concentrations of Aβ monomers in Inside-Lumen may prevent the dissociation of larger Aβ oligomers into Aβ monomers and smaller Aβ oligomers. (B) In the case of concomitant removal of Aβ oligomers and monomers: low concentrations of Aβ monomers in Inside-Lumen may accelerate the dissociation of larger Aβ oligomers into Aβ monomers and smaller Aβ oligomers. Concentrations of Aβ monomers and small Aβ oligomers increased in the filtrate of the membrane and waste plasma as compared with those seen at the inlet of the device for Aβ oligomer removal. |
The ELISA kit we used can detect Aβ oligomers that have two or more of the target epitopes (the N-terminus of Aβ) in a single molecule. As such, we can anticipate the detection of both larger (intact) and smaller (dissociated) Aβ oligomers. Using this detection method, we found that Aβ oligomers did undergo dissociation when Aβ monomers were removed concomitantly (Figure 9B). The dissociation of Aβ oligomers was clearly observed in our findings (Figures 4–6, Table 2).
When HexDC mini-columns were used together with Membrane B, concentrations of both Aβ oligomers and monomers were successfully reduced in Pool (Figure 4B). However, we also detected a gradual increase in Aβ monomer concentration (both Aβ1–40 and Aβ1–42) in Waste plasma, a finding that peaked at approximately 20 min of circulation in Filtrate of Membrane B (Figure 4D and E, Table 2). At the same time, the Aβ monomer concentrations underwent rapid decrease in both Pool and post-HexDC (which were equivalent concentrations to those at the inlet of Membrane B; Figure 4B and C, Table 2). The relative concentrations of Aβ oligomers in Waste plasma exceeded 100% at 10 mins of circulation and were highest (at 1200%) at 40 mins (dotted line in Figure 6A). These findings clearly indicate the dissociation of larger Aβ oligomers into a number of smaller Aβ oligomers in Inside-Lumen of Membrane B. Among the smaller dissociation products, Aβ oligomers smaller than albumin could pass through the pores of Membrane B and could recirculate via Pool (solid line in Figure 6A). Relative Aβ concentrations of the Aβ1–40 and Aβ1–42 monomers in Waste plasma increased to 300% and 400% at 40 mins, respectively (dotted line in Figure 6C and E). These findings also suggest dissociation from Aβ oligomers to Aβ monomers, Aβ1–40 and Aβ1–42, inside the lumen of Membrane B (Figure 9B).
In contrast to our findings with HexDC columns, the Aβ oligomer concentration in Pool was not diminished, and Aβ monomers in the pool were rapidly reduced when polysulfone dialyzers were used together with Membrane B (Figure 5B). Furthermore, Aβ monomer concentrations, both Aβ1–40 and Aβ1–42, increased dramatically in Waste plasma (Figure 5D); these values peaked at approximately 20 to 30 mins of circulation in Filtrate of Membrane B (Figure 5E). These findings are also consistent with our interpretations regarding the dissociation of Aβ oligomers to Aβ monomers. Further, the concentrations of Aβ oligomers increased on an ongoing basis in Filtrate of Membrane B and in Waste plasma (Figure 5D and E). Relative concentrations of Aβ oligomers in Waste plasma increased to 800% at 30 mins (Figure 6B). Relative concentrations of the Aβ monomers Aβ1–40 and Aβ1–42 in Waste plasma increased to 300% at 40 mins (Figure 6D) and to 400% at 60 mins (Figure 6F), respectively. These findings strongly suggest that the larger Aβ oligomers undergo dissociation to several distinct smaller Aβ oligomers that can be detected by the ELISA. This finding may undergo rapid acceleration by actively decreasing the Aβ monomer concentrations (Figure 9B).
In the absence of a means to deplete Aβ monomers, there is only minimal dissociation of the larger Aβ oligomers. As shown in Figure 3D and E, almost all Aβ oligomers existing in Pool before the circulation through Membrane A or B alone were concentrated inside the lumens of the membranes; no obvious increase in the concentration of Aβ oligomers was observed. Additionally, because the pore sizes of dialyzers were very small and polysulfone is one of the strongest adsorbents of Aβ monomers, no Aβ oligomers and monomers were detected in the filtrate of polysulfone dialyzers as previously reported.16,19
Increase of Aβ Oligomers in Circulation Is Triggered by Their Removal
In a previous study, and as noted in the Introduction, we reported a large influx of Aβ monomers into the blood during hemodialysis sessions.17,18,20 In fact, the influx detected during one 4-hr hemodialysis session is comparable to the full complement of Aβ monomers existing in the brain.21 This concept that hemodialysis may trigger influx of Aβ monomers from the brain into peripheral circulation is supported by histopathological evaluation of the brains of hemodialysis patients,22 a prospective study of Aβ-imaging in a hemodialysis patient,23 and a study analyzing the CSF of rats.24
Here, we investigated whether these findings could be extended to include Aβ oligomers. In Patient 1, we detected a significant increase in the plasma concentration of Aβ oligomers during the time intervals between each DFPP session (Figure 7A). This increase did not take place during DFPP; the absolute amount of Aβ oligomers discarded in the waste plasma was comparable with that detected in the systemic circulation at the start of the session (Figure 7C). By contrast, we observed a large influx of Aβ monomers during each hemodialysis session; this Aβ monomers influx decreased approximately 100-fold after hemodialysis was complete.17,18 The increase in Aβ oligomer concentration observed in Patient 1 could be attributed to (1) influx from the brain or other tissues, or (2) the aggregation of Aβ monomers in the plasma. Regarding the latter possibility, it would be difficult to explain a change from Aβ monomers to oligomers during this interval. The maximum increase of Aβ oligomers detected between DFPP sessions (between the end of day 1 and the beginning of day 3) was 24.3 pmol/L, a value that corresponds to the observed increase in Aβ dimers to 219 pg/mL or the increase in Aβ decamers to 1361 pg/mL. Of note, the concentration changes of Aβ monomers in plasma during this period included an “increase” by 40.1 pg/mL (Aβ1–40) and a decrease by 8.7 pg/mL (Aβ1–42). These findings indicate that there was no apparent net decrease of Aβ monomers, certainly not sufficiently extensive to explain the increase in Aβ oligomers observed. As such, we conclude that the more likely scenario is that the observed increase in Aβ oligomer concentration may be the result of influx into peripheral circulation, although the precise tissue source has not yet been identified. While this might relate to influx of Aβ oligomers from brain tissues, this remains speculation at this time. Further investigation will be necessary in order to identify the critical source(s) of the Aβ oligomers.
Conclusion
In this study, Aβ oligomers were efficiently removed from plasma samples and from peripheral circulation of human subjects by hollow-fiber membranes with appropriately large pore sizes. Interestingly, an immediate increase in Aβ oligomer concentration in plasma was observed following plasmapheresis. Based on the pore sizes of the membranes used in these experiments, the molecular size of intact Aβ oligomers in plasma was estimated at ~60 kDa or more. Additionally, the concomitant removal Aβ monomers and oligomers promoted the dissociation of larger Aβ oligomers into smaller oligomers and Aβ monomers. Future investigation will focus on the dynamics of Aβ oligomers in the brain.
Acknowledgments
The authors thank Ms. Megumi Kaneko for her technical assistance, Messrs Hideki Matusi and Hideki Konuma of Asahi Kasei Medical for providing the hollow-fiber devices, and Ms. Ai Yonezawa and Mr. Fumiyasu Hirai of Kaneka for providing the HexDC. The authors also thank Drs. Takayoshi Mamiya and Toshitaka Nabeshima of Meijo University for providing the brains of human APP transgenic mice. This work was partly supported by KAKENHI (20509008, 23500531, 26282126), the Smoking Research Foundation, and Aichi Kidney Foundation.
Disclosure
Nobuya Kitaguchi owns stock in Asahi Kasei Corporation. He also reports grants from Japanese Government (MEXT) and Smoking Research Foundation, received non-financial support from Asahi Kasei Medical Co Ltd and Kaneka Corporation, during the conduct of the study. In addition, Dr Nobuya Kitaguchi has a patent JP2019-193709A pending and patents US10, 112, 000B2 and WO2010-073580 issued. Kazunori Kawaguchi reports grants from Smoking Research Foundation, during the conduct of the study. In addition, Dr Kazunori Kawaguchi has a patent JP2019-193709A pending, and patents US10, 112, 000B2 and WO2010-073580 issued. Yuta Saito has a patent JP2019-193709A pending, and reports grants from Aichi Kidney Foundation, during the conduct of the study. Moe Kobayakawa’s current affiliations is at Yokohama-Daiichi Hospital, Yokohama, Kanagawa, Japan. Yoshiyuki Hiki’s current affiliation is at Narumi Clinic, Nagoya, Aichi, Japan. The authors report no other conflicts of interest in this work.
References
1. Selkoe DJ. Alzheimer’s disease: genes, proteins, and therapy. Physiol Rev. 2001;81(2):741–766. doi:10.1152/physrev.2001.81.2.741
2. Walsh DM, Klyubin I, Fadeeva JV, et al. Naturally secreted oligomers of amyloid β protein potently inhibit hippocampal long-term potentiation in vivo. Nature. 2002;416(6880):535–539. doi:10.1038/416535a
3. Cline EN, Bicca MA, Viola KL, Klein WL. The Amyloid-β oligomer hypothesis: beginning of the third decade. J Alzheimer Dis. 2018;64(s1):S567–S610.
4. Mroczko B, Groblewska M, Litman-Zawadzka A, Kornhuber J, Lewczuk P. Amyloid β oligomers (AβOs) in Alzheimer’s disease. J Neural Transm. 2018;125(2):177–191. doi:10.1007/s00702-017-1820-x
5. Hung LW, Ciccotosto GD, Giannakis E, et al. Amyloid-βpeptide (Aβ) neurotoxicity is modulated by the rate of peptide aggregation: Aβ dimers and trimers correlate with neurotoxicity. J Neurosci. 2008;28(46):11950–11958. doi:10.1523/JNEUROSCI.3916-08.2008
6. Shankar GM, Li S, Mehta TH, et al. Amyloid-β protein dimers isolated directly from Alzheimer’s brains impair synaptic plasticity and memory. Nat Med. 2008;14(8):837–842.
7. Mawuenyega KG, Sigurdson W, Ovod V, et al. Decreased clearance of CNS β-amyloid in Alzheimer’s disease. Science. 2010;330(6012):1774. doi:10.1126/science.1197623
8. Kawaguchi K, Kitaguchi N, Nakai S, et al. Novel therapeutic approach for Alzheimer’s disease by removing amyloid beta protein from the brain with an extracorporeal removal system. J Artif Organs. 2010;13(1):31–37. doi:10.1007/s10047-010-0482-3
9. Bell RD, Sagare AP, Friedman AE, et al. Transport pathways for clearance of human Alzheimer’s amyloid beta-peptide and apolipoproteins E and J in the mouse central nervous system. J Cereb Blood Flow Metab. 2007;27(5):909–918. doi:10.1038/sj.jcbfm.9600419
10. Donahue JE, Flaherty SL, Johanson CE, et al. RAGE, LRP-1, and amyloid-beta protein in Alzheimer’s disease. Acta Neuropathol. 2006;112(4):405–415. doi:10.1007/s00401-006-0115-3
11. Silverberg GD, Miller MC, Messier AA, et al. Amyloid deposition and influx transporter expression at the blood-brain barrier increase in normal aging. J Neuropathol Exp Neurol. 2010;69(1):98–108. doi:10.1097/NEN.0b013e3181c8ad2f
12. Morris AWJ, Carare RO, Schreiber S, Hawkes CA. The cerebrovascular basement membrane: role in the clearance of β-amyloid and cerebral amyloid angiopathy. Front Aging Neurosci. 2014;6:251. doi:10.3389/fnagi.2014.00251
13. Zhao Z, Nelson AR, Betsholtz C, Zlokovic BV. Establishment and dysfunction of the blood-brain barrier. Cell. 2015;163(5):1064–1078. doi:10.1016/j.cell.2015.10.067
14. Abbott A. The brain inflamed. Nature. 2018;556:426–428. doi:10.1038/d41586-018-04930-7
15. Kawaguchi K, Takeuchi M, Yamagawa H, et al. A potential therapeutic system for Alzheimer’s disease using adsorbents with alkyl ligands for removal of blood Amyloid β. J Artif Organs. 2013;16(2):211–217. doi:10.1007/s10047-012-0675-z
16. Kawaguchi K, Saigusa A, Yamada S, et al. Toward the treatment for Alzheimer’s disease: adsorption is primary mechanism of removing amyloid β protein with hollow-fiber dialyzers of the suitable materials, Polysulfone and polymethyl methacrylate. J Artif Organs. 2016;19(2):149–158. doi:10.1007/s10047-015-0878-1
17. Kitaguchi N, Kawaguchi K, Nakai S, et al. Reduction of Alzheimer’s disease Amyloid-β in plasma by hemodialysis and its relation to cognitive functions. Blood Purif. 2011;32(1):57–62. doi:10.1159/000322624
18. Kato M, Kawaguchi K, Nakai S, et al. Potential therapeutic system for Alzheimer’s disease: removal of blood Abs by hemodialyzers and its effect on the cognitive functions of renal-failure patients. J Neural Transm. 2012;119(12):1533–1544. doi:10.1007/s00702-012-0844-5
19. Kitaguchi N, Kawaguchi K, Yamazaki K, et al. Adsorptive filtration systems for effective removal of blood amyloid β: a potential therapy for Alzheimer’s disease. J Artif Organs. 2018;21(2):220–229. doi:10.1007/s10047-017-1012-3
20. Kitaguchi N, Hasegawa M, Ito S, et al. A prospective study on blood Aβ levels and the cognitive function of patients with hemodialysis: a potential therapeutic strategy for Alzheimer’s disease. J Neural Transm. 2015;122(11):1593–1607. doi:10.1007/s00702-015-1431-3
21. Kitaguchi N, Tatebe H, Sakai K, et al. Influx of tau and amyloid-β proteins into the blood during hemodialysis as a therapeutic extracorporeal blood Aβ removal system for Alzheimer’s disease. J Alzheimer Dis. 2019;69(3):687–707. doi:10.3233/JAD-190087
22. Sakai K, Senda T, Hata R, et al. Patients that have undergone hemodialysis exhibit lower amyloid deposition in the brain: evidence supporting a therapeutic strategy for Alzheimer’s disease by removal of blood amyloid. J Alzheimer Dis. 2016;51(4):997–1002. doi:10.3233/JAD-151139
23. Kitaguchi N, Kato T, Matsunaga S, et al. Removal of blood amyloid-β with hemodialysis reduced brain amyloid-β, confirmed by brain imaging: a case report. Neuropsych Dis Treat. 2018;14:2931–2937. doi:10.2147/NDT.S186118
24. Kitaguchi N, Kawaguchi K, Kinomura J, et al. Extracorporeal blood Aβ removal system (EBARS) reduced soluble Aβ in the brain by triggering influx into the blood: rat studies. Alzheimers Dement. 2017;13:620–621. doi:10.1016/j.jalz.2017.06.690
25. Nakai S, Wakai K, Kanda E, Kawaguchi K, Sakai K, Kitaguchi N. Is hemodialysis itself a risk factor for dementia? An analysis of nationwide registry data of patients on maintenance hemodialysis in Japan. Renal Replacement Ther. 2018;4. doi:10.1186/s41100-018-0154-y.
26. Jin WS, Shen LL, Bu XL, et al. Peritoneal dialysis reduces amyloid-beta plasma levels in humans and attenuates Alzheimer-associated phenotypes in an APP/PS1 mouse model. Acta Neuropathol. 2017;134(2):207–220. doi:10.1007/s00401-017-1721-y
27. Boada M, Ortiz P, Anaya F, et al. Amyloid-targeted therapeutics in Alzheimer’s disease: use of human albumin in plasma exchange as a novel approach for αbeta mobilization. Drug News Perspect. 2009;22(6):325–339. doi:10.1358/dnp.2009.22.6.1395256
28. Xiang Y, Bu XL, Liu YH, et al. Physiological amyloid-beta clearance in the periphery and its therapeutic potential for Alzheimer’s disease. Acta Neuropathol. 2015;130(4):487–499. doi:10.1007/s00401-015-1477-1
29. Wood H. Alzheimer disease: peripheral Aβ clearance -a therapeutic strategy for AD? Nat Rev Neurol. 2017;13(7):386. doi:10.1038/nrneurol.2017.80
30. Nag S, Sarkar B, Bandyopadhyay A, et al. Nature of the amyloid-beta monomer and the monomer-oligomer equilibrium. J Biol Chem. 2011;286(16):13827–13833. doi:10.1074/jbc.M110.199885
31. Lesné S, Koh MT, Kotilinek L, et al. A specific amyloid-beta protein assembly in the brain impairs memory. Nature. 2006;440(7082):352–357. doi:10.1038/nature04533
32. Murakami K, Horikoshi-Sakuraba Y, Murata N, et al. Monoclonal antibody against the turn of the 42-residue amyloid β-protein at positions 22 and 23. ACS Chem Neurosci. 2010;1(11):747–756. doi:10.1021/cn100072e
33. Doody RS, Thomas RG, Alzheimer’s disease Cooperative Study steering Committee; Solanezumab Study Group, et al. Phase 3 trials of solanezumab for mild-to-moderate Alzheimer’s disease. N Engl J Med. 2014;370(4):311–321. doi:10.1056/NEJMoa1312889
34. DeMattos RB, Bales KR, Cummins DJ, Dodart JC, Paul SM, Holtzman DM. Peripheral anti-A beta antibody alters CNS and plasma A beta clearance and decreases brain A beta burden in a mouse model of Alzheimer’s disease. Proc Natl Acad Sci U S A. 2001;98(15):8850–8855. doi:10.1073/pnas.151261398
35. Sennvik K, Fastbom J, Blomberg M, Wahlund L-O, Winblad B, Benedik E. Levels of α- and β-secretase cleaved amyloid precursor protein in the cerebrospinal fluid of Alzheimer’s disease patients. Neurosci Lett. 2000;278(3):169–172. doi:10.1016/S0304-3940(99)00929-5
36. Bailey JA, Ray B, Greig NH, Lahiri DK. Rivastigmine lowers Aβ and increases sAPPα levels, which parallel elevated synaptic markers and metabolic activity in degenerating primary rat neurons. PLoS One. 2011;6(7):e21954. doi:10.1371/journal.pone.0021954
37. Teich AF, Patel M, Arancio O. A reliable way to detect endogenous murine β-amyloid. PLoS One. 2013;8(2):e55647. doi:10.1371/journal.pone.0055647
 © 2020 The Author(s). This work is published and licensed by Dove Medical Press Limited. The full terms of this license are available at https://www.dovepress.com/terms.php and incorporate the Creative Commons Attribution - Non Commercial (unported, v3.0) License.
By accessing the work you hereby accept the Terms. Non-commercial uses of the work are permitted without any further permission from Dove Medical Press Limited, provided the work is properly attributed. For permission for commercial use of this work, please see paragraphs 4.2 and 5 of our Terms.
© 2020 The Author(s). This work is published and licensed by Dove Medical Press Limited. The full terms of this license are available at https://www.dovepress.com/terms.php and incorporate the Creative Commons Attribution - Non Commercial (unported, v3.0) License.
By accessing the work you hereby accept the Terms. Non-commercial uses of the work are permitted without any further permission from Dove Medical Press Limited, provided the work is properly attributed. For permission for commercial use of this work, please see paragraphs 4.2 and 5 of our Terms.