")
Back to Journals » Psychology Research and Behavior Management » Volume 14
Reliability Evidence for the Gibson Assessment of Cognitive Skills (GACS): A Brief Tool for Screening Cognitive Skills Across the Lifespan
Authors Moore AL , Miller TM , Ledbetter C
Received 11 November 2020
Accepted for publication 19 December 2020
Published 13 January 2021 Volume 2021:14 Pages 31—40
DOI https://doi.org/10.2147/PRBM.S291574
Checked for plagiarism Yes
Review by Single anonymous peer review
Peer reviewer comments 2
Editor who approved publication: Professor Mei-Chun Cheung
Amy Lawson Moore,1 Terissa M Miller,1 Christina Ledbetter1,2
1Gibson Institute of Cognitive Research, Colorado Springs, CO, USA; 2Department of Neurosurgery, Louisiana State University Health Sciences Center, Shreveport, LA, USA
Correspondence: Amy Lawson Moore
Gibson Institute of Cognitive Research, 5085 List Drive, Suite 200-A, Colorado Springs, CO 80919, USA
Tel +1 719-219-0940
Email [email protected]
Purpose: The aim of the current study was to examine and report three sources of reliability evidence for the Gibson Assessment of Cognitive Skills, a paper-based, brief cognitive screening tool for children and adults measuring working memory, processing speed, visual processing, logic and reasoning, and three auditory processing constructs: sound blending, sound segmenting, sound deletion along with work attack skills.
Sample and Methods: The sample (n = 103) for the current study consisted of children (n = 73) and adults (n = 30) between the ages of 6 and 80 (M = 20.2), 47.6% of which were female and 52.4% of which were male. Analyses of test data included calculation of internal consistency reliability, split-half reliability, and test–retest reliability.
Results: Overall coefficient alphas range from 0.80 to 0.94, producing a strong source of internal consistency reliability evidence. The split-half reliability coefficients ranged from 0.83 to 0.96 overall, producing a strong second source of reliability evidence. Across all ages, the test–retest reliability coefficients ranged from 0.83 to 0.98. For adults ages 18 to 80, test–retest reliability coefficients ranged from 0.73 to 0.99. For children ages 6 through 17, test–retest reliability coefficients ranged from 0.89 to 0.97. All correlations were statistically significant at p < 0.001, indicating strong test–retest reliability and stability across administrations.
Conclusion: The evidence collected for the current study suggests that the GACS is a reliable brief screening tool for assessing cognitive skill performance in both children and adults.
Keywords: cognition, memory test, reasoning test, intelligence test, reading skills
Introduction
Since the close of the 19th century, cognitive testing has evolved and advanced through the pioneering work of Spearman, Thurstone, Cattell, Horn, Carroll, Kaufman, and more.1,2 As intelligence theories have become more diverse in recent years, many professionals agree that traditional aptitude assessments sustain cultural bias and miss important cognitive measures.3–5 Technological advances have further confounded the paradigms of intelligence testing as digital and computerized assessment methods lack human interaction and require computer experience and proficiency.6,7 Recent literature reveals the need for improved cognitive assessment to incorporate human delivery, comprehensive cognitive measures, and lifespan norming.8,9
In keeping with the most widely accepted view of cognition, the Cattel-Horn-Carrol theory,10 it is important to consider a comprehensive analysis of cognitive abilities in intelligence testing, including specific auditory processing skills.11–13 Recent research reveals evidence of need for ongoing development of cognitive assessment to more accurately incorporate more aspects of the CHC model.14,15 We argue that development of such tests should consider a lifespan approach, the ability to screen briefly, and a simplified scoring and reporting system. Indeed, there is a dearth of such ability.
Further, the absence of comprehensive assessment of auditory processing skills in cognition batteries is pervasive. Auditory processing underlies the ability to read, write, participate meaningfully in conversations, acquire a foreign language, and navigate performance bottlenecks such as driving a car.16 Therefore, identifying deficits in auditory processing skills should be a critical aspect of cognition assessment.
Cognitive performance has historically been measured through formal assessments administered by highly trained clinicians and interpreted by doctoral level practitioners. There are several gold-standard assessment tools in widespread use today. Cognitive tests designed for children include the Cognitive Abilities Test (CogAT),17 Differential Ability Scales (DAS-II),18 Naglieri Nonverbal Ability Test (NNAT3),19 Otis Lennon School Abilities Test (OLSAT),20 Stanford Binet 5,21 Wechsler Intelligence Scale for Children (WISC-5),22 and Woodcock Johnson (WJ-IV).23
For adults, there are also many available cognitive assessments such as the Kaufman Adult Intelligence Test (KAIT),24 the Wechsler Adult Intelligence Scale (WAIS-IV),25 and the Woodcock Johnson (WJ-IV).23 However, there is a distinct lack of widely available cognitive testing tools for assessment across the lifespan within one battery. The Kaufman Brief Intelligence Test (KBIT-2)26 is applicable for ages four through 90 yet lacks important cognitive skill measures such as auditory processing. The Reynolds Intellectual Assessment Scales (RIAS-2)27 is normed for ages three to 94 years yet does not contain comprehensive measures within one assessment. For example, the critical skill subtests for memory and processing speed are add-ons. Offshoots of traditional cognitive assessment have emerged that measure the more nuanced executive function skills such as the NEPSY-II28 and the Cognitive Assessment System (CAS2).29 Finally, there are several tests that are specifically designed to screen for cognitive decline in the aging, such as the Montreal Cognitive Assessment MoCA30 and the Mini Mental State Exam (MMSE).31 However, there are not many robust tools available to quickly screen performance in core cognitive skills in healthy populations or administered by non-clinical practitioners such as teachers. Further, the ability to use the same tool for screening across the lifespan is indeed limited. This limitation creates the need for practitioners to invest in multiple test batteries, frequently at a substantial financial cost to themselves or their organizations. It is indeed advantageous to have a screening tool that enables practitioners to assess cognition affordably without having to purchase multiple batteries to cover different ages. A lifespan tool can also enable researchers to use the same assessment in cross-sectional and longitudinal studies across age groups.
The Gibson Assessment of Cognitive Skills (GACS)32 is a paper-based cognitive screening tool based on CHC theory. The assessment—formerly called the Gibson Cognitive Test Battery—includes measures of working memory, processing speed, visual processing, logic and reasoning, and three auditory processing constructs: sound blending, sound segmenting, sound deletion, as well as word attack skills. The assessment includes lifespan norming, with paper-and-pencil human delivery, in one brief 30-minute test, thus filling several of the identified gaps in cognitive assessment including the need for a brief, lifespan cognition assessment tool that adequately measures multiple skills including auditory processing. The GACS is designed to be administered and scored by both clinicians as well as teachers, nurses, allied professionals, and researchers with basic training in administration of assessments, enabling rapid turnaround of results.
Each GACS subtest was developed following an extensive review of the literature and two decades of clinical practice and applied research on cognitive skills that underlie the ability to think and learn. The test itself was developed in alignment with the Cattell–Horn–Carroll theory of cognition with each subtest designed to measure one of the CHC broad constructs: fluid reasoning (Gf), working memory capacity (Gwm), processing speed (Gs), visual processing (Gv), auditory processing (Ga), and reading and writing (Grw). Subject matter experts in psychology, neuroscience, and education were consulted during development to validate the content of each subtest to provide assurance and agreement on including each test item, and to validate the alignment with CHC constructs. The GACS belongs to the same family of tests that includes the computer-based cognitive test called the Gibson Test of Cognitive Skills (GTCS). About 50% of the items overlap between the two tests and the statistical analysis methods conducted for the GTCS were replicated for the current study.33
Along with the content and construct validity, the convergent validity of the individual subtests on the GACS has also been previously examined34,35 indicating strong correlations with the WISC IV (Processing Speed, r = 0.40, Auditory Processing, r = 0.52, Visual Processing, r = 0.60, Working Memory, r = 0.73, Logic and Reasoning, r = 0.72); with the Woodcock Johnson III (Word Attack, r = 0.78, Processing Speed, r = 0.76, Visual Processing, r = 0.73); with the Detroit Tests of Learning Aptitude – 4 (Working Memory, r = 0.61, Logic and Reasoning, r = 0.69); and with the Lindamood Auditory Conceptualization Test (Auditory Processing, r = 0.63). The test was normed on a sample of 3490 children and adults between 2015 and 2019, and complete demographics are available in the technical manual.36 Preliminary unpublished evidence on the internal consistency reliability and split-half reliability of the GACS had been previously collected but a comprehensive examination of multiple sources of reliability had not been conducted. Therefore, the sole aim of the current study was to examine and report newly collected sources of reliability evidence—including test–retest reliability, internal consistency reliability, and split-half reliability—for the GACS.
Materials and Methods
The current study of the Gibson Assessment of Cognitive Skills was guided by the Standards for Educational and Psychological Testing.37 Ethics review and approval to conduct the study was granted by the Institutional Review Board (IRB) of the Gibson Institute of Cognitive Research prior to commencing data collection. All procedures were performed in accordance with the 1964 Helsinki Declaration and its later amendments. We conducted a series of investigations to examine evidence of test reliability including analyses of the internal consistency reliability evaluated through item analysis and the resulting coefficient alpha, the test–retest reliability estimated with Pearson correlation of two test administrations, and split-half reliability determined through the correlation of two halves of each subtest.
Measures
The Gibson Assessment of Cognitive Skills (GACS) is a paper-and-pencil battery of eight subtests that measure six broad cognitive constructs. A description of each subtest follows:
Processing Speed Test
The processing speed (Gs) test broadly measures fluency in task performance. Specifically, the task measures perceptual speed which is the speed in which similarities in visual stimuli can be searched and identified. The examinee is given a page of 38 rows of 6 sets of letter or number combinations of increasing difficulty and must find the matching sets in each row (see Figure 1). There are 38 possible points (one point per match) in this 2-minute timed test.
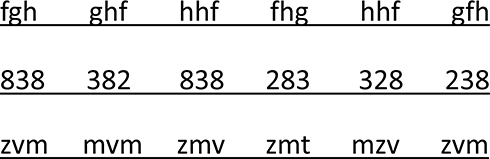 |
Figure 1 Example processing speed test items. Note: Permission to share this image has been granted by the test publisher LearningRx. |
Working Memory Test
The Working Memory subtest measures both auditory and visual working memory capacity, or the ability to encode and keep visual and verbal information in one’s primary memory. An example of a visual stimulus is shown in Figure 2. The examinee hears an oral story and is then shown an unrelated picture. He studies each picture before the picture is removed by the examiner, and then answers questions about the story and the picture or previous stories and pictures. The test is a form of an n back task, where the examinee is asked questions about a picture or a story presented two to six items previously. For example, the examinee is told a brief story about a girl and her pet. Then, the examinee is shown the unrelated picture illustrated in Figure 2. Next, the examinee is asked a question about the story and then a question about the picture. He is told another brief story and shown another unrelated picture. Then, he is asked a question about a previous story and picture before being asked about the current story and picture. The stories and pictures become progressively more detailed. There are 24 total questions about 5 stories and 5 pictures for a total of 24 possible points.
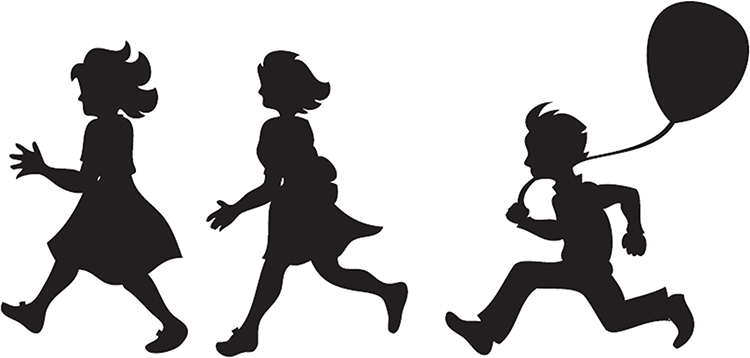 |
Figure 2 Example working memory test item. Note: Permission to share this image has been granted by the test publisher LearningRx. |
Visual Processing Test
The Visual Processing Test measures the ability to perceive visual patterns and to visualize how they look when rotated. For each item, the examinee is shown a completed puzzle and must identify the location of the individual pieces in the puzzle when separated and rotated (See Figure 3). There are 35 items that make up seven puzzles of increasing difficulty, for a total of 35 possible points.
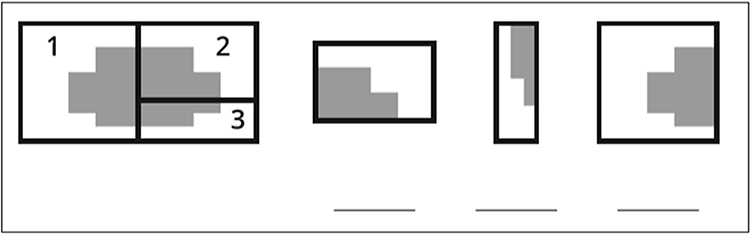 |
Figure 3 Example visual processing test item. Note: Permission to share this image has been granted by the test publisher LearningRx. |
Logic and Reasoning Test
The Logic and Reasoning Test measures inductive reasoning skill, or the ability to infer a rule based on the observation of a phenomenon. For each item, the examinee is shown a matrix of designs with a missing space and he must select from a set of designs the one that fits in the missing space. (See Figure 4). There are 17 matrices of increasing difficulty in this subtest for a total of 17 possible points. This subtest has a ceiling of 4 consecutive incorrect answers.
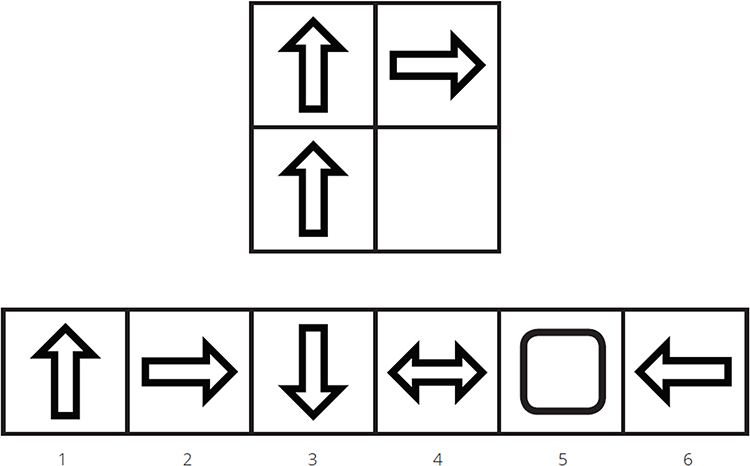 |
Figure 4 Example logic and reasoning test item. Note: Permission to share this image has been granted by the test publisher LearningRx. |
Auditory Processing Test
The Auditory Processing Test measures the ability to analyze and manipulate sounds and sound patterns. This test includes three sections (Blending, Deletion, and Segmenting), each designed to measure the CHC auditory processing (Ga) constructs of phonetic coding (the ability to hear, blend, and segment words or sounds), memory for sound patterns (the ability to retain auditory codes), and speech sound discrimination (the ability to tell the differences in speech sounds without distortion). All three sections are delivered orally with items of increasing difficulty. The Sound Blending task requires the examinee to listen to the individual sounds in a nonsense word and then blend the sounds orally into a completed word. For example, the examiner says, “/a/-/p/” and the examinee must say, “ap.” The Sound Segmenting task requires the examinee to listen to a nonsense word and then say all the sounds in the word individually. For example, the examiner says, “gos’” and the examinee must say, “/g/-/o/-/s/.” The Sound Deletion tasks require the examinee to delete a given sound from a word and say the new word. For example, the examiner says, “Say Cat without the/c/sound” and the examinee must respond with “at.” There are 28 items on the Auditory Processing Test and a total of 90 possible points.
Word Attack Test
The Word Attack Test measures the broad CHC construct of basic reading-writing ability (Grw) and specifically grapheme to phoneme translation through phonetic and reading decoding. The examinee is shown lists of nonsense words (pseudowords) in increasing difficulty such as “baf” and “thrate” and is asked to read them aloud. There are 24 items on this subtest for a total of 24 possible points. The ceiling on this subtest is four consecutive inaccurate answers.
Sample
The sample (n = 103) for the current study consisted of children (n = 73) and adults (n = 30) between the ages of 6 and 80 (M = 20.2, SD = 17.7), 47.6% of which were female and 52.4% of which were male. The ethnicities included Caucasian (84.5%), Black (6.8%), Asian/Pacific Islander (3.9%), Hispanic (1.9%), and Native American (2.9%). Half the sample (n = 50) was recruited from existing clients of four clinical practices in Georgia, California, New Jersey, and Colorado. The other half of the sample (n = 53) was recruited through a medical practice in Colorado. Table 1 shows detailed demographic data for the sample. The minimum sample size required for the current reliability study was determined using the formula and tables introduced by Bonett38 with the following parameters: the number of items is greater than 100, the null hypothesis set to coefficient alpha of 0.50, the alternative hypothesis coefficient alpha set to 0.70. The minimum sample size required to be able to reach 90% power is n = 84. Therefore, our sample size of n = 103 exceeds the minimum required.
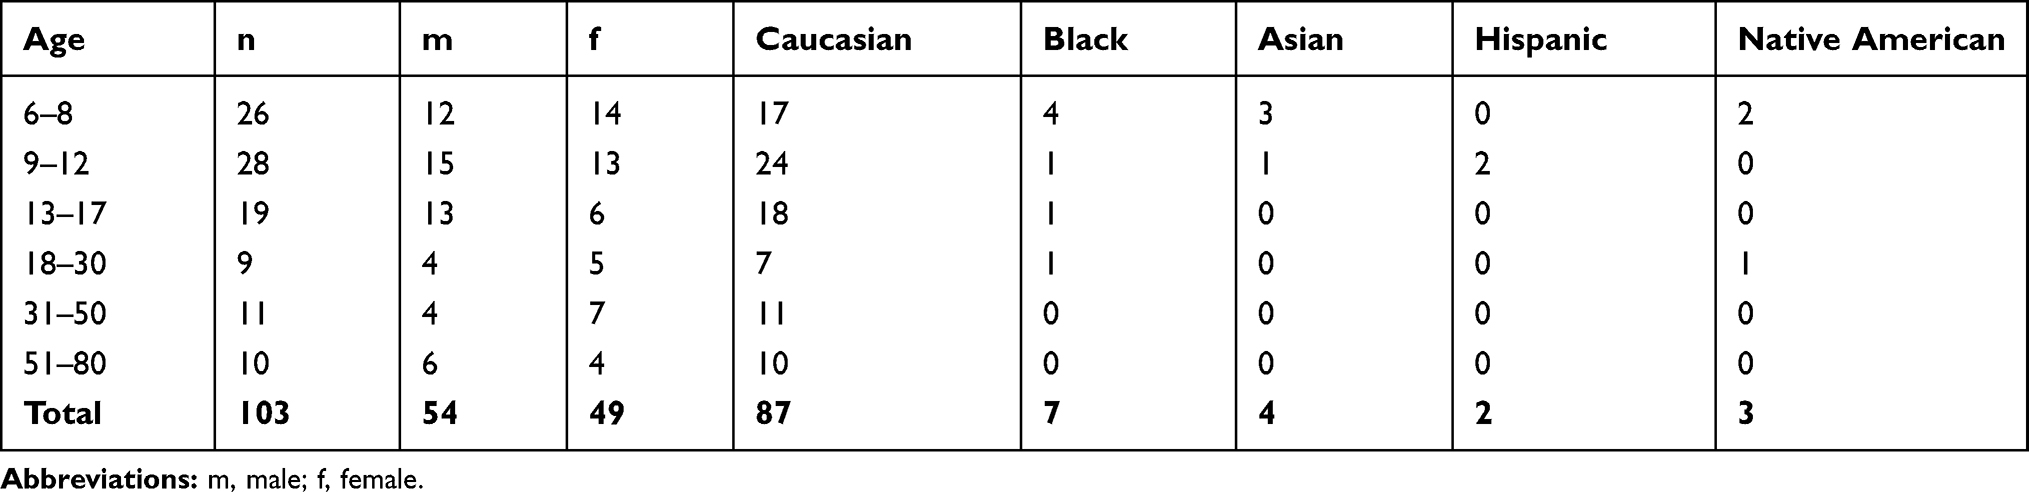 |
Table 1 Demographics of Reliability Sample |
Procedures
After obtaining ethics approval from the Gibson Institute of Cognitive Research Institutional Review Board (Protocol #20,200,207) prior to study commencement, recruitment took place in two phases. First, de-identified test data were collected from the four practices around the country. The test was administered to their clients as part of their intake assessment process. Then, recruitment of the additional participants began in Colorado through email flyers with an invitation to participate. Participants were screened and included based on the following criteria: age between 6 and 80, no gross impairment in hearing and vision, no previous diagnosis of dementia or intellectual disability, and ability to use a pencil without assistance. After obtaining written informed consent and child assent when appropriate, a master’s level clinician supervised by a doctoral level psychologist administered the test two times scheduled one week apart to 53 participants. Following collections of the test forms, the data were transferred to spreadsheets for analysis to calculate internal consistency reliability and split-half reliability on the whole sample (n = 103), and test–retest reliability for each subtest on the second half of the recruited sample (n = 53).
Data Analysis
We conducted our data analyses using SPSS Version 26 and JMetrik Version 4.1.1 software programs. After running descriptive statistics in SPSS to determine mean scores and demographic distributions, we began our analysis of internal consistency reliability in JMetrik. This procedure produced a coefficient alpha for each subtest. Next, we split the test items into odd and even halves and ran Pearson’s correlations in JMetrik for each subtest to calculate split-half reliability. Then, we used SPSS to run Pearson’s correlations between the two test administrations spaced one week apart to determine test–retest reliability.
Results
Internal Consistency Reliability
Coefficient alpha represents the internal consistency reliability of each subtest, or how well the test items correlate with each other. In addition to an overall coefficient alpha for each subtest, coefficient alphas are reported for two age intervals—children and adults. (Table 2). Overall coefficient alphas range from 0.80 to 0.94, producing a strong source of reliability evidence. The standard error of measurement (SEM) is also reported for each coefficient alpha, ranging from 1.5 to 2.4 overall.
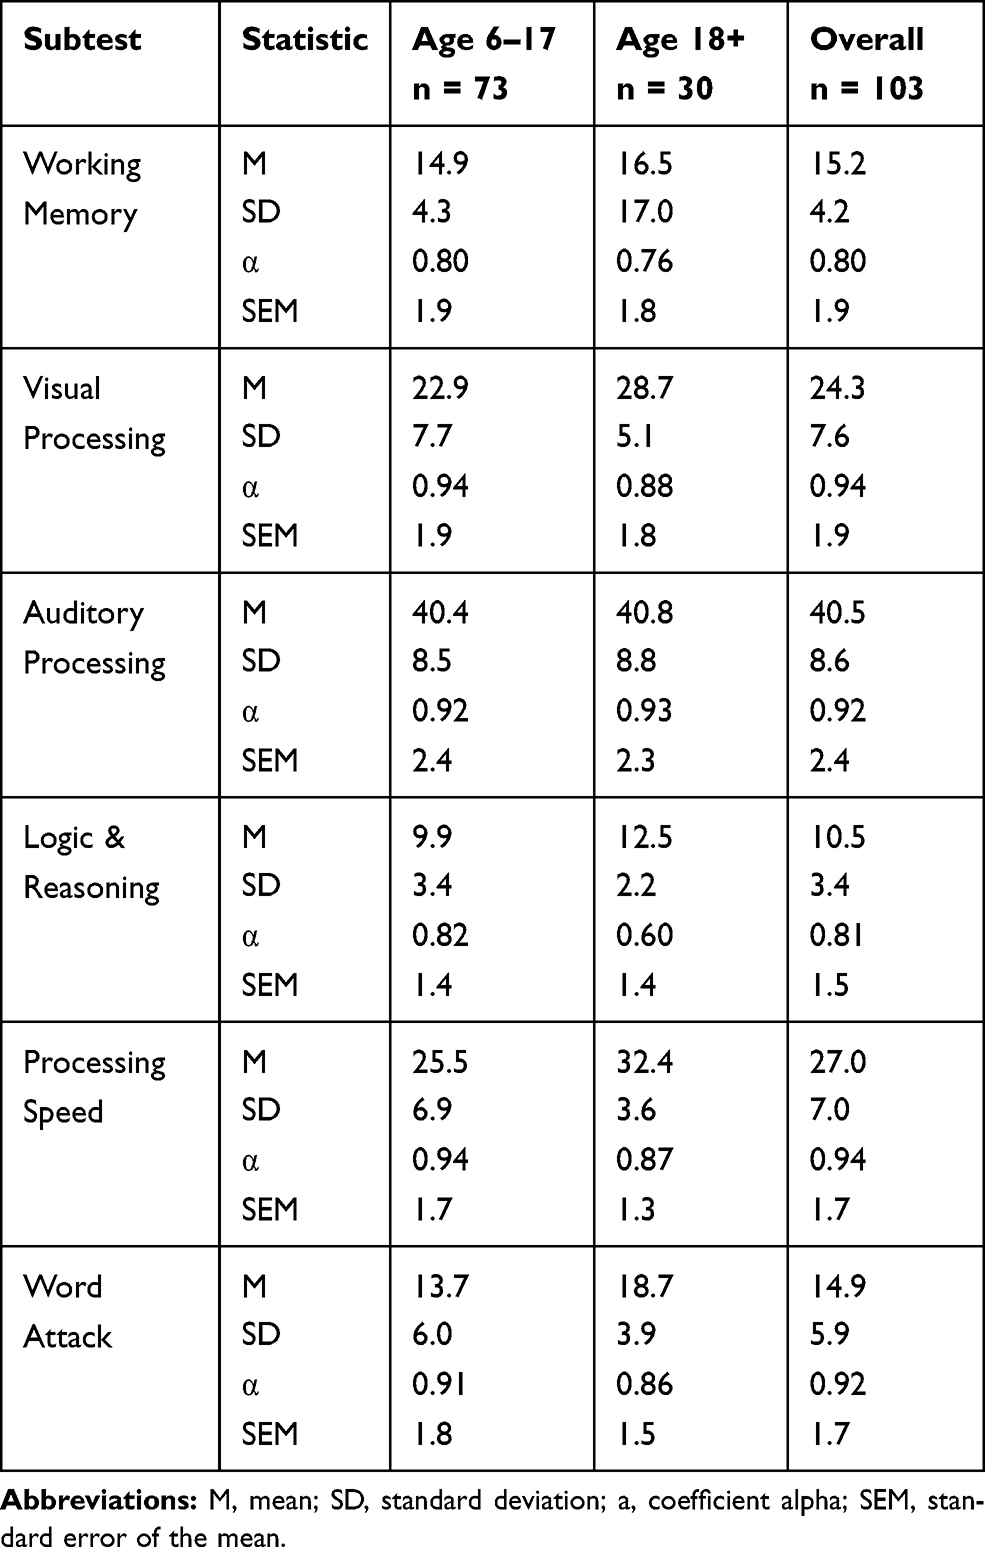 |
Table 2 Internal Consistency Reliability Metrics for the GACS |
Split-Half Reliability
Split-half reliability is the estimation of test reliability determined by correlating the scores on two halves of the test. To calculate the split-half reliability estimate, the sum of the even numbered items was correlated with the sum of the odd numbered items. A Spearman-Brown formula was applied to the Pearson correlation for each subtest to predict the overall reliability of the test. Because the standard split-half reliability calculation is not appropriate for a speeded test, the following alternative calculation was used for Processing Speed: r11 = 1 – (SEM2/SD2). Overall, the split-half reliability coefficients ranged from 0.83 to 0.96, producing a strong source of reliability evidence. Split-half reliability coefficients for both children and adults are also reported. (Table 3)
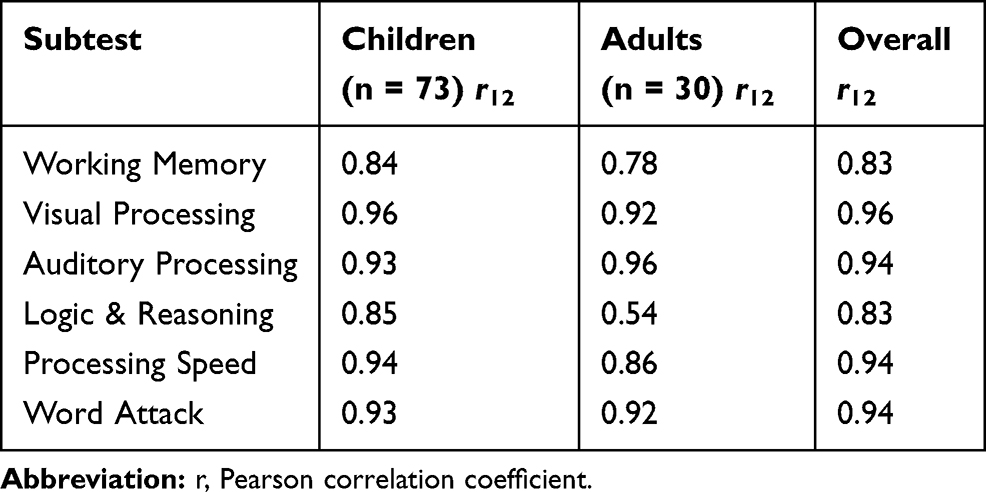 |
Table 3 Split-Half Reliability Coefficients |
Test–Retest Reliability
Test–retest reliability is an indicator of the temporal stability of the test across administrations. Pearson’s correlation of two sets of scores captured one week apart from the same participants are illustrated in Table 4 through 6 along with the mean and standard deviation of the test scores and retest scores, the mean score difference, and the difference in standard deviation units. Overall, the test–retest reliability coefficients ranged from 0.83 to 0.98 (Table 4), indicating strong test–retest reliability and stability across administrations. All correlations were statistically significant at p < 0.001.
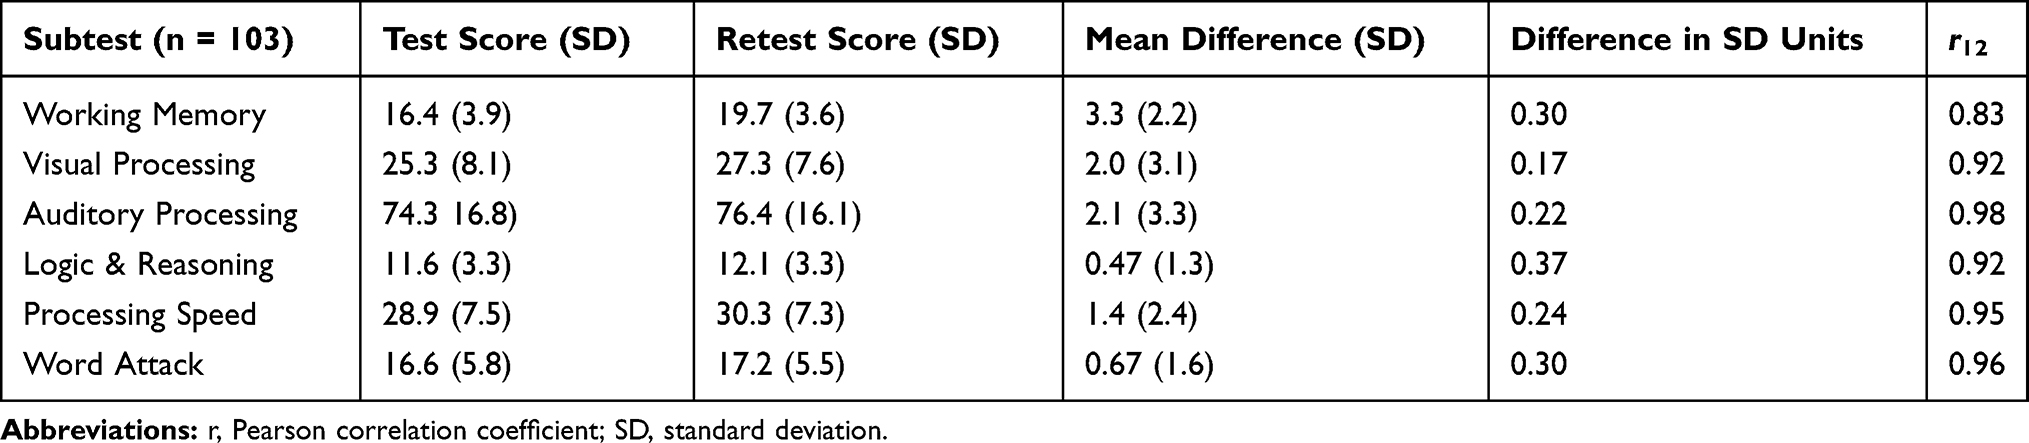 |
Table 4 Overall Test–Retest Correlations |
For adults ages 18 to 80, reliability coefficients ranged from 0.73 to 0.99, indicating strong test–retest reliability and stability across administrations (Table 5). All correlations were statistically significant at p < 0.001.
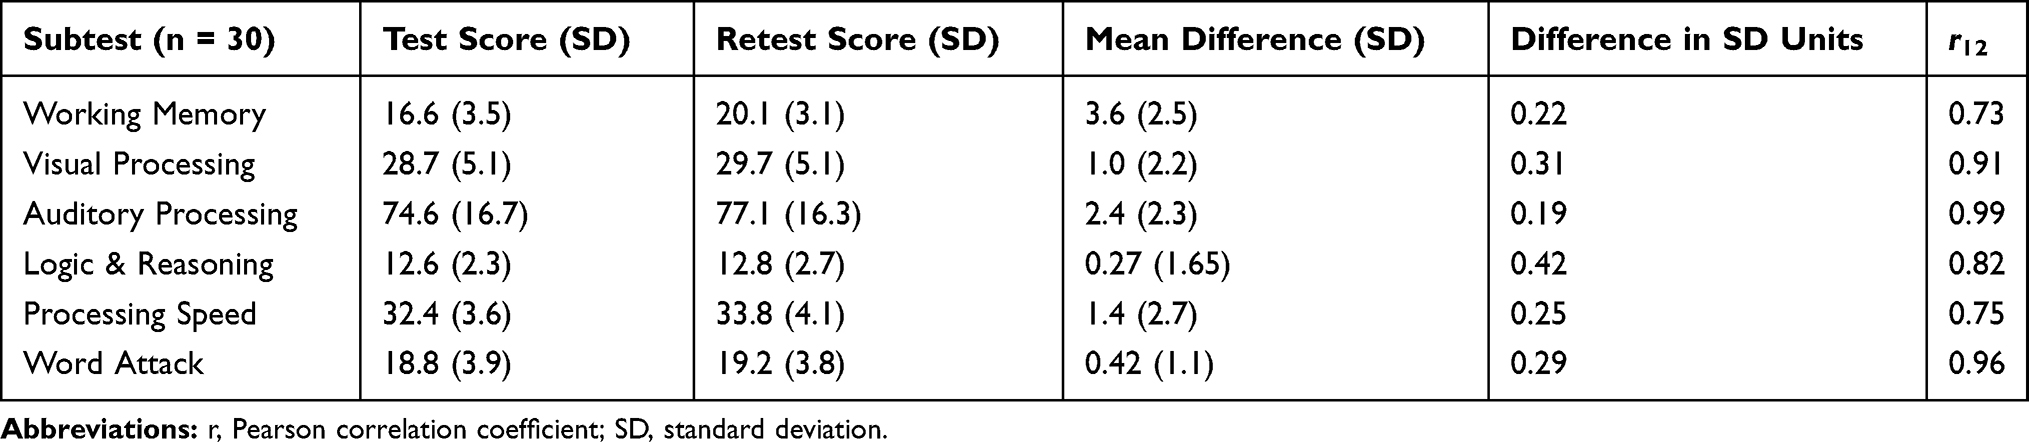 |
Table 5 Test–Retest Correlations for Adults |
For children ages 6 through 17, reliability coefficients ranged from 0.89 to 0.97, indicating strong test–retest reliability and stability across administrations (Table 6). All correlations were statistically significant at p < 0.001.
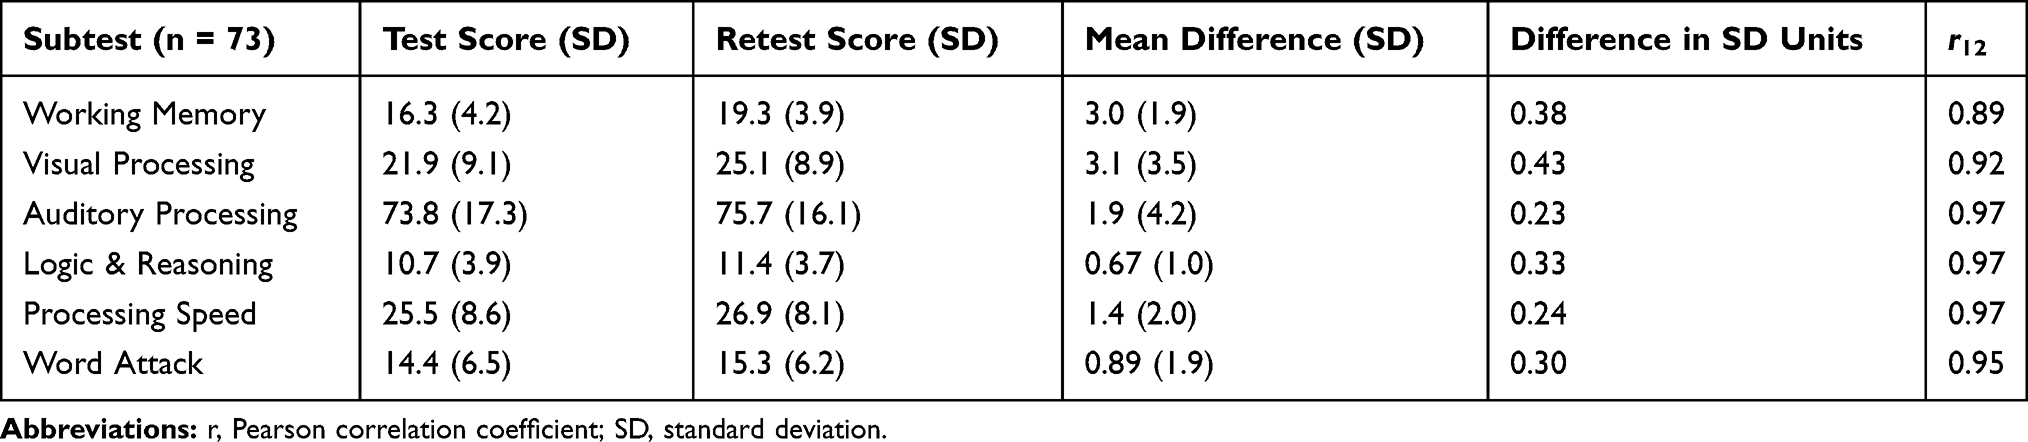 |
Table 6 Test–Retest Correlations for Children |
Discussion
The purpose of the current study was to examine the reliability of the Gibson Assessment of Cognitive Skills (GACS), a brief paper-based screening tool for assessing cognitive performance in ages 5 through adult. Although several sources of validity evidence had previously been collected for the GACS,34,35 evidence of reliability of the test had not been comprehensively examined or published. The evidence collected in the current study indeed supports the reliability of the tool for screening cognitive performance across the lifespan.
First, the internal consistency reliability of the GACS is strong, with coefficient alphas ranging from 0.80 to 0.94 overall. The reliability coefficient should be at least 0.70, with 0.80 serving as the most suitable minimum threshold. In contrast, coefficient alphas higher than 0.95 suggest the presence of redundant items. The internal consistency reliability of the GACS, therefore, comfortably falls within the desirable range. Indeed, these coefficients are also stronger than several other published cognitive assessment measures. For example, several subtests on the WISC-V and DAS-II have coefficient alphas in the 0.70s.18,22
Next, the split-half reliability coefficients of the Gibson Assessment of Cognitive Skills indicate strong internal consistency reliability across items as well, ranging from 0.83 to 0.96 overall. While the split-half reliability of two subtests fell below the desired threshold of 0.80 for the adults, the split-half reliability coefficients ranged from 0.85 to 0.96 for children. The adult sample was considerably smaller than the child sample, suggesting this result may be more of a function of the adult sample rather than a function of the test itself. In future research, it will be interesting to note if this same pattern is apparent.
A key finding in the current study was the stability of the GACS over time. The test–retest reliability correlation coefficients were strong and significant, ranging from 0.83 to 0.98 overall. The strongest correlation was across administrations of the auditory processing subtest (0.98) while the lowest correlation was across administrations of the working memory subtest (0.83). These correlations were significant and strong for both the child and adult samples and again exceed the test–retest reliability coefficients of other published cognitive assessments. For example, the test–retest reliability ranges from 0.75 to 0.94 for the WISC-V39 and from 0.21 to 0.91 for the NEPSY-II.28 Further, the test–retest reliability of the GACS also exceeds several popular cognitive screening tools for adults, including the CANTAB (0.17 to 0.86)40 and CNS Vital Signs (0.31 to 0.86).41
Along with the strong sources of reliability evidence collected in the current study, the GACS is also the only published single cognitive screening assessment that measures three narrow abilities of auditory processing (blending, segmenting, deletion) as well as Word Attack skills. As the critical skills that underlie the ability to read and write, auditory processing as a key component of CHC theory is indeed critical to comprehensively assess. We were pleased with the strong reliability of this portion of the GACS in particular since it is a unique aspect of the test compared to other assessments in widespread use.
There are two limitations to the current study that are important to highlight. First, the adult sample was small and lacked a robust number of older adults. Although we found strong reliability evidence for adults in our analysis, it is possible that a larger sample would produce different results. Therefore, it is important that we conduct additional reliability research specifically with older adults. Another limitation to the current study is the absence of an examination of inter-rater reliability. Because the assessment is designed to be administered by both clinicians and non-clinicians, it is important to evaluate the reliability in scoring between experts and non-experts. This should be the focus of an additional research study on this assessment tool.
To date, evidence of reliability and validity has not been collected on the use of the GACS with clinical populations. Future research should include examination of discriminant and predictive validity with various clinical groups including brain injury and age-related cognitive decline. However, the evidence collected thus far suggests that the GACS is indeed a reliable brief screening tool for assessing cognitive skill performance across the lifespan.
Disclosure
Dr Amy Lawson Moore reports grants from LearningRx, during the conduct of the study. All three authors are affiliated with the nonprofit research institute founded by the author of the test but report no financial interest in the test or in the outcomes of the study. The authors report no other conflicts of interest in this work.
References
1. Geisinger KF. Empirical considerations on intelligence testing and models of intelligence: updates for educational measurement professionals. Appl Meas Educ. 2019;32(3):193–197. doi:10.1080/08957347.2019.1619564
2. Benson NF, Floyd RG, Kranzler JH, Eckert TL, Fefer SA, Morgan GB. Test use and assessment practices of school psychologists in the United States: findings from the 2017 national survey. J Sch Psychol. 2019;72:29–48. doi:10.1016/j.jsp.2018.12.004
3. Woods IL, Floyd RG, Singh LJ, Layton HK, Norfolk PA, Farmer RL. What is in a name? A historical review of intelligence test score labels. J Psychoeduc Assess. 2019;37(6):692–705. doi:10.1177/0734282918786651
4. Rindermann H, Becker D, Coyle TR. Survey of expert opinion on intelligence: intelligence research, experts’ background, controversial issues, and the media. J Intell. 2020;78:101406. doi:10.1016/j.intell.2019.101406
5. Zajda J. Current research of theories and models of intelligence. Curriculum Teach. 2019;34(1):87–108. doi:10.7459/ct/34.1.07
6. Lee Meeuw Kjoe PR, van Rentergem JA, Vermeulen IE, Schagen SB. How to correct for computer experience in online cognitive testing? J Assessment. 2020;107319112091109. doi:10.1177/1073191120911098
7. Kessels RPC. Improving precision in neuropsychological assessment: bridging the gap between classic paper-and-pencil tests and paradigms from cognitive neuroscience. Clin Neuropsychol. 2019;33(2):357–368. doi:10.1080/13854046.2018.1518489
8. Howieson D. Current limitations of neuropsychological tests and assessment procedures. Clin Neuropsychol. 2019;33(2):200–208. doi:10.1080/13854046.2018.1552762
9. Platt JM, Keyes KM, McLaughlin KA, Kaufman AS. The flynn effect for fluid IQ may not generalize to all ages or ability levels: a population-based study of 10,000 US adolescents. J Intell. 2019;77:101385. doi:10.1016/j.intell.2019.101385
10. Schneider WJ, McGrew KS. The cattell-horn-carroll theory of cognitive abilities. In: Flanagan DP, McDonough EM, editors. Contemporary Intellectual Assessment: Theories, Tests, and Issues.
11. Lockwood AB, Farmer RL. The cognitive assessment course: two decades later. Psychol Sch. 2019. doi:10.1002/pits.22298
12. Durant K, Peña E, Peña A, Bedore LM, Muñoz MR. Not all nonverbal tasks are equally nonverbal: comparing two tasks in bilingual kindergartners with and without developmental language disorder. J Speech Lang Hear Res. 2019;0331. doi:10.1044/2019_JSLHR-L-18-0331
13. Caemmerer JM, Keith TZ, Reynolds MR. Beyond individual intelligence tests: application of Cattell-Horn-Carroll theory. J Intell. 2020;79:101433. doi:10.1016/j.intell.2020.101433
14. Kovacs K, Conway AR. A unified cognitive/differential approach to human intelligence: implications for IQ testing. J Appl Res Mem Cogn. 2019;8(3):255–272. doi:10.1016/j.jarmac.2019.05.003
15. Cucina JM, Howardson GN, Woodcock-Johnson III, Kaufman Adolescent and Adult Intelligence Test (KAIT). Kaufman Assessment Battery for Children (KABC), and Differential Ability Scales (DAS) support carroll but not Cattell-horn. Psychol Assess. 2017;29(8):1001–1015. doi:10.1037/pas0000389
16. Conzelmann K, Sub HM. Auditory intelligence: theoretical considerations and empirical findings. Learn Ind Diff. 2015;40:27–40. doi:10.1016/j.lindif.2015.03.029
17. Lohman DF. Cognitive Abilities Test, Form 7 (Cogat7). Rolling Meadows, IL: Riverside; 2017.
18. Elliott CD. Differential Abilities Scales - Second Edition: Introductory and Technical Handbook. San Antonio, TX: Harcourt Assessment; 2007.
19. Naglieri JA. Naglieri Nonverbal Ability Test (NNAT3). Bloomington, MN: Pearson; 2018.
20. Otis AS, Lennon RT. Otis-Lennon School Ability Test.
21. Roid GH. Stanford Binet Intelligence Scales. Itasca, IL: Riverside Publishing; 2003.
22. Wechsler D, Kaplan E. Wechsler Intelligence Scale for Children.
23. Schrank FA, McGrew KS, Mather N. Woodcock-Johnson IV. Rolling Meadows, IL: Riverside; 2014.
24. Kaufman AS, Kaufman NL. Kaufman Adolescent and Adult Intelligence Test. Circle Pines, MN: American Guidance Service; 1993.
25. Wechsler D. Wechsler Adult Intelligence Scale.
26. Kaufman AS, Kaufman NL. Kaufman Brief Intelligence Test.
27. Reynolds CR, Kamphaus RW. Reynolds Intellectual Assessment Scales.
28. Korkman M, Kirk U, Kemp S. NEPSY-II.
29. Naglieri JA, Das JP, Goldstein S. Cognitive Assessment System.
30. Nasreddine ZS, Phillips NA, Bédirian V, et al. The Montreal Cognitive Assessment, MoCA: a brief screening tool for mild cognitive impairment. J Am Geriatr Soc. 2005;53(4):695–699. doi:10.1111/j.1532-5415.2005.53221.x
31. Folstein MF, Folstein SE, McHugh PR, Fanjiang G. Mini-Mental State Examination: User’s Guide. Lutz, FL: Psychological Assessment Resources; 2001.
32. Gibson K. Gibson Assessment of Cognitive Skills. Colorado Springs, CO: LearningRx; 2014.
33. Moore AL, Miller TM. Reliability and validity of the revised gibson test of cognitive skills, a computer-based test battery for assessing cognition across the lifespan. Psychol Res Behav Manag. 2018;11:25–35. doi:10.2147/PRBM.S152781
34. Moxley-Paquette E. Testing a Structural Equation Model of Language-Based Cognitive Fitness [Doctoral dissertation]. Walden University ScholarWorks. 2013. Available from: https://scholarworks.waldenu.edu/cgi/viewcontent.cgi?article=2544&context=dissertations.
35. Moore AL. Technical Report: Gibson Cognitive Test Battery. Colorado Springs, CO: Gibson Institute of Cognitive Research; 2014.
36. Moore AL, Miller TM, Ledbetter C. Gibson Assessment of Cognitive Skills: Technical Manual (Rev.). Colorado Springs, CO: Gibson Institute of Cognitive Research; 2020.
37. American Education Association, American Psychological Association, National Council on Measurement in Education. Standards for Educational and Psychological Testing. Washington, DC: American Educational Research Association; 2014.
38. Bonett DG. Sample size requirements for testing and estimating coefficient alpha. J Educ Behav Stat. 2002;27(4):335–340. doi:10.3102/10769986027004335
39. Wahlstrom D, Raiford S, Breaux K, Zhu J, Weiss L. The wechsler preschool and primary scale of intelligence-fourth edition, wechsler intelligences scale for children-fifth edition, and wechsler individual achievement test-third edition. In: Flanagan DP, McDonough EM, editors. Contemporary Intellectual Assessment: Theories, Tests, and Issues.
40. Strauss E, Sherman E, Spreen O. A Compendium of Neuropsychological Tests: Administration, Norms, and Commentary.
41. Gualtieri CT, Johnson LG. Reliability and validity of a computerized neurocognitive test battery, CNS vital signs. Arch Clin Neuropsychol. 2006;21(7):623–643. doi:10.1016/j.acn.2006.05.007
 © 2021 The Author(s). This work is published and licensed by Dove Medical Press Limited. The full terms of this license are available at https://www.dovepress.com/terms.php and incorporate the Creative Commons Attribution - Non Commercial (unported, v3.0) License.
By accessing the work you hereby accept the Terms. Non-commercial uses of the work are permitted without any further permission from Dove Medical Press Limited, provided the work is properly attributed. For permission for commercial use of this work, please see paragraphs 4.2 and 5 of our Terms.
© 2021 The Author(s). This work is published and licensed by Dove Medical Press Limited. The full terms of this license are available at https://www.dovepress.com/terms.php and incorporate the Creative Commons Attribution - Non Commercial (unported, v3.0) License.
By accessing the work you hereby accept the Terms. Non-commercial uses of the work are permitted without any further permission from Dove Medical Press Limited, provided the work is properly attributed. For permission for commercial use of this work, please see paragraphs 4.2 and 5 of our Terms.