")
Back to Journals » Patient Preference and Adherence » Volume 12
Reliability and validity of an indicator system used to evaluate outpatient and inpatient satisfaction in Chinese hospitals
Authors Zhang J, Zhou F, Ge X, Ran X, Li Y , Chen S, Dai X , Chen D , Jiang B
Received 6 September 2018
Accepted for publication 30 October 2018
Published 29 November 2018 Volume 2018:12 Pages 2527—2536
DOI https://doi.org/10.2147/PPA.S186722
Checked for plagiarism Yes
Review by Single anonymous peer review
Peer reviewer comments 2
Editor who approved publication: Dr Naifeng Liu
Jun Zhang,1,* Feng Zhou,2,* Xiaoxiang Ge,3 Xu Ran,4 Yeping Li,4 Si Chen,5 Xiaotong Dai,5 Dafang Chen,5 Baoguo Jiang6
1Department of Neurology, Peking University People’s Hospital, Beijing, China; 2Department of Data Science, Tsinghua University, Beijing, China; 3Office of Academic Affairs, Army Military Medical University, Chongqing, China; 4Department of Research and Development, Chongqing Hospital Management Limited Company (Doctor-Patient Experience Research Base, National Health and Family Planning Commission of the People’s Republic of China), Chongqing, China; 5Department of Epidemiology and Biostatistics, School of Public Health, Peking University, Beijing, China; 6Department of Orthopedics, Peking University People’s Hospital, Beijing, China
*These authors contributed equally to this work
Background and aims: Patient satisfaction is one of the important ways to measure the results of treatment and the quality of medical services. The purpose of the present study was to verify the reliability and validity of the indicator system for evaluating satisfaction of outpatients and inpatients in Chinese hospitals.
Methods: The study was based on the satisfaction questionnaire program of the national doctor–patient experience research center with data from 99,802 outpatients and 229,215 inpatients, collected in China between 2016 and 2017. We adopted exploratory factor analysis for validity analysis and the method of split-half reliability and Cronbach’s α coefficient for reliability analysis.
Results: In the validity analysis of the indicator system for outpatients, the factor loading was between 0.438 and 0.919, and the reliability was excellent. In the validity analysis of the indicator system for nonsurgical inpatients, the factor loading of the secondary indicators was between 0.417 and 0.75, and the reliability was excellent. In the validity analysis of the indicator system for surgical inpatients satisfaction, the factor loading of the secondary indicators range was 0.391–0.751, and the reliability was excellent.
Conclusion: The indicator systems for evaluating satisfaction of outpatients, surgical inpatients and nonsurgical inpatients all have excellent reliability and good validity. They can be widely used for an outpatient and inpatient satisfaction questionnaire in Chinese hospitals.
Keywords: patient satisfaction questionnaire, reliability, validity, evaluation
Introduction
The patient satisfaction is the patients’ subjective evaluation of the accepted medical service under the influence of various factors after comparing expectations with feelings.1 It is an important evaluation tool for the quality of hospital services. Research on customer satisfaction evaluation systems is of great significance both in theory and practice to improve further the management theory of medical service quality, to guide medical institutions to improve service quality and eventually to win the trust of the patients.2
In other countries outside China, research on the theory and methods of patient satisfaction evaluation started early.3,4 Among them, one of the most classic evaluation scales was the patient satisfaction questionnaire (PSQ) developed by Ware et al, which was the most widely used questionnaire in the 1990s.5 In addition to the evaluation of medical service quality, it can also provide a reference for the overall layout of hospitals, capital utilization and personnel deployment. The Hospital Consumer Assessment of Healthcare Providers and Systems questionnaire developed by the Centers for Medicare and Medicaid Services and Agency for Healthcare Research and Quality is the second most influential.6 Compared with other questionnaires, it includes employee factors and can be used for comparison and analysis of patient satisfaction in different hospitals. It was officially used in the US in 2008.
As patient satisfaction was widely introduced into hospitals in developed countries and achieved significant results, Chinese hospitals have begun to recognize the essence of “patient orientated health care” in recent years. Xia et al (2010)11 followed the basic steps of the measuring tools proposed by Streiner et al7 and designed six questionnaires, such as “the questionnaire on the satisfaction of discharged patients” and “the questionnaire on the satisfaction of outpatients”.11 Chen (2011)8 divided the patient satisfaction evaluation system into three levels, including 6 primary indicators, 13 secondary indicators and 32 three-level indicators, and built a simple outpatient satisfaction indicator system using Analytical Hierarchy Process. Based on the past inpatient satisfaction model, Tan L10 constructed an inpatient satisfaction indicator system of a grade III level A hospital with 1 primary index, 5 secondary indicators and 29 three-level indicators in Jiangkou city.10 Kong and Chen (2007)9 selected 30 experts in different institutions in Beijing, Ji’nan and Shenzhen. Through the investigation of community health services, a reliability test of expert consultations was conducted.
However, due to the late start of patient satisfaction research in China, both theory and practice necessarily are at the exploratory stage, and many problems need to be solved urgently. On the one hand, most of the domestic questionnaires are distributed “on the spot” and are carried out by hospitals themselves. Most hospitals do not entrust third party evaluation agencies to investigate them. It is difficult to construct a reliable mathematical model based on the deviation of measurement data caused by the above reasons.12 On the other hand, there is no scientific and effective PSQ that can be widely used in China to date, and the available PSQs lack scientific credibility and reliability. Furthermore, existing questionnaire research does not address applicability or take practical considerations into account.13 Most of the existing PSQ are not universal and representative, which makes the evaluation results difficult to compare objectively. In addition, the majority of the domestic PSQs used involved medical quality, attitude of medical staff and the medical environment, without mentioning important content such as the patient’s expectations, value perception and loyalty to the medical institution. The evaluation results are therefore difficult to use to provide an effective scientific basis for choosing a medical institution. Therefore, a standardized and reliable indicator system for a PSQ remains to be developed.
Therefore, in the present study, we developed a patient satisfaction indicator system that can be widely used in outpatient and inpatient satisfaction questionnaires (IPSQs) in Chinese hospitals following strict scientific criteria. The study aims to confirm the reliability and validity of the indicator system for evaluating the satisfaction of outpatients and inpatients.
Methods
Compilation of the indicator system
This study is a research project of the national doctor–patient experience research center. In the early stages, the study passed analysis of the medical practice process and many rounds of domestic and foreign expert demonstrations. The indicator systems for evaluating satisfaction of outpatients, surgical inpatients (including all types of surgery) and nonsurgical inpatients were initially constructed. The indicator system of outpatient satisfaction is a two-level indicator system, with 5 primary indicators and 31 secondary indicators (Table S1). The indicator system of inpatient satisfaction is a two-level indicator system, with 6 primary indicators and 43 secondary indicators (Table S2). Among them, the satisfaction indicator system of nonsurgical inpatients had 5 items under the primary index, including hospitalization service, treatment, auxiliary examination, service attitude, environment and logistics service, and 38 items under the secondary index. The satisfaction indicator system of surgical inpatients had 6 items under the primary index, including hospitalization service, treatment, auxiliary examination, service attitude, environment and logistic services, surgical anesthesia, and 45 items under the secondary index. We used a balanced Likert 5-point scale to record responses and assigned a score of 1, 2, 3, 4 and 5 for strongly disagree, disagree, neutral, agree and strongly agree, respectively. The higher the score, the higher the satisfaction of the item. Each item score adds up to the total score of the indicator system. With the original indicator system, the full score of the satisfaction questionnaire of outpatients is 155 points, for nonsurgical inpatients, 190 points and for surgical inpatients, 225 points.
Subjects
All the hospitals investigated in our study voluntarily participated in the PSQ of the national doctor and patient experience research center. The 8%–30% of outpatients in a single day were randomly selected from the list of patients who received 3 consecutive days of medical treatment provided by the hospital participating in the project. Between 30% and 60% of hospitalized patients, who fulfilled inclusion criteria in a single day, were selected from the total number of inpatients in the participating hospitals, and the inpatient components of each department and ward. Hospitalized patients who had been admitted in the hospital for >24 hours and therefore had a certain experience of hospitalization were included in this study.
The interviewees were patients or their family members. All patients who were aged ≥18 years old and conscious completed the questions by themselves or with the help of investigators on the mobile computer provided. Only when patients were <18 years old and unable to complete the questions by themselves or with the help of an investigator (medical conditions included severe mental disorder, coma, dementia, etc.), family members answered the questions on behalf of the patient.
On-site investigation process
The indicator system used in our study aimed to understand patient satisfaction on various aspects of the hospital service, thus permitting the evaluation of the overall service quality of the hospital. A third-party company was hired and the investigators conducted paperless questionnaires on subjects using a unified mobile terminal system. During the investigation, the investigators explained the purpose of the study through detailed written and verbal understandable instructions and asked the patients to truly reflect their own thoughts and opinions based on their own experience and feelings. The researchers guaranteed that the information provided by each patient was strictly confidential and that they would never provide any information obtained to others without the consent of the patient. Also, the hospital and department was kept strictly confidential. They did not provide any person with any information on a specific hospital or department, which unintentionally may affect a patient’s medical treatment and perception of the hospital. The investigators used a unified guide to describe the way the mobile terminal questionnaire was filled in, the research content and the purpose of the study, and also informed the patient that there was no right or wrong answer, just follow faithfully their innermost thoughts. Each patient completed the questionnaire independently; patients who had difficulty doing this task, due to physical illness, were interviewed by a researcher or relatives, who completed the questionnaire for them. The investigator waited patiently and requested the patient to answer the questions in an objective, neutral manner. The completed questionnaire was uploaded from the computer as soon as it was completed. The average time required to complete the questionnaire was circa 10–15 minutes.
In total, 99,802 outpatient and 229,215 up-to-standard inpatient data were collected. Among the inpatient questionnaire data, 58,220 came from surgical patients and 170,995 from the nonsurgical patients.
Statistical analyses
This study confirmed the final structure of the indicator system and tested the structural validity of the indicator system by exploratory factor analysis. The appropriateness of factor analysis was tested using the Kaiser–Meyer–Olkin adequacy (KMO) index and Bartlett’s test of sphericity. If the KMO of the indicator system was greater than 0.5 and the Bartlett’s test of sphericity significant (P<0.05), then the indicator system was deemed suitable for factor analysis. After determining the number of factors in each indicator system according to its structure, the cumulative variance contribution rate was obtained by factor analysis. Principal component analysis was used to extract the factor, and then a rotation transformation was carried out to find the best analysis effect. If the factor of the indicator system could explain >50% variation and each item had enough loading on the corresponding factors (≥0.4), the indicator system was considered to have good structural validity. After omitting loadings <0.3 and forming a new indicator system based on expert opinions and the actual situation,14 we used the Spearman–Brown reliability and Cronbach’s α coefficient to test the split-half reliability and internal consistency reliability of the indicator system, respectively.
In general, a split-half reliability coefficient of >0.75 was excellent and <0.4 poor. α>0.8 indicated excellent internal consistency, 0.6<α<0.8 an acceptable level and α<0.6 was indicative of poor internal consistency.15 All statistical analyses were carried out using SAS 9.4 software.
Results
Characteristics of the study subject
This study collected data from 98,192 outpatients in 197 hospitals from 22 provinces and 229,215 hospitalized patients distributed in 413 hospitals in 28 provinces in China (Table S3).
In this study, 19,953 (20.3%) outpatient data were collected in 2016 and 78,243 (79.7%) outpatient data in 2017. Of the outpatients, 40,072 (40.8%) were male, with an age range mainly between 18 and 59 years old (81,960: 83.5%). In addition, outpatients who completed the questionnaire were mainly from grade III hospitals (82.3%), and many of them had local medical insurance (53.8%) (Table 1).
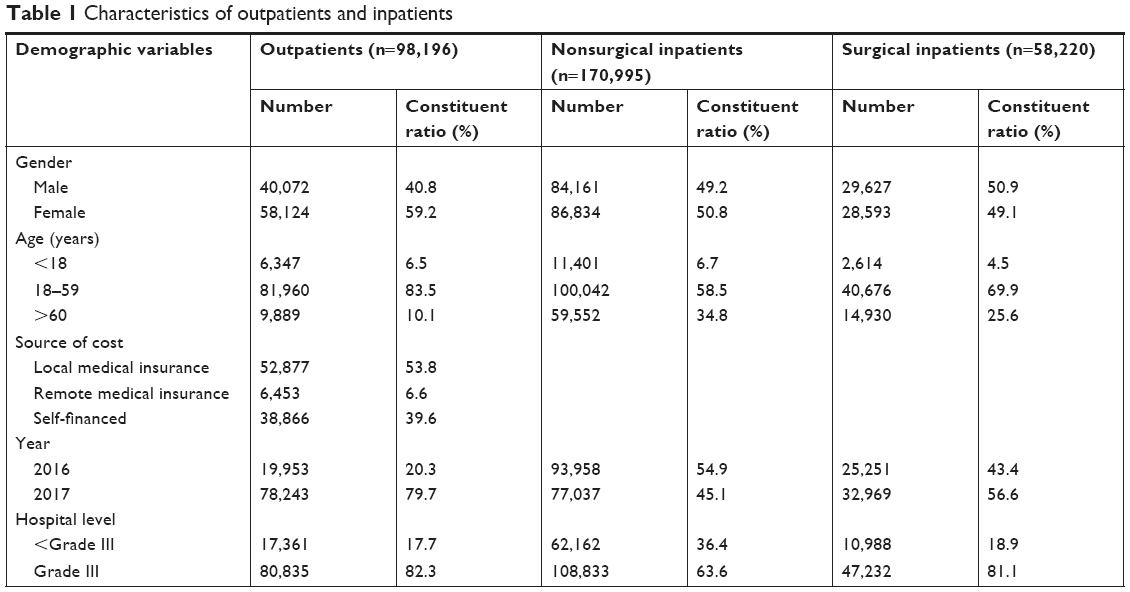 | Table 1 Characteristics of outpatients and inpatients |
Among the outpatient questionnaires collected, 170,995 came from nonsurgical patients and 58,220 from surgical patients. There were 84,161 males (49.2%) in the nonsurgical inpatient group investigated. Patients between 18 and 59 years of age accounted for 58.5% of the total inpatients under investigation, and only 6.7% of the inpatients were under the age of 18. In addition, the nonsurgical inpatients were mainly from grade III hospitals (63.6%). There are 29,627 men (50.9%) in the surgical inpatients. Patients aged between 18 and 59 years of age accounted for 69.9% of the total surgical patients. The surgical inpatients were mainly from grade III hospitals (81.1%) (Table 1).
Results of structural validity
Validity analysis of the indicator system for evaluating outpatient satisfaction
Exploratory factor analysis was used to investigate the structural validity of the indicator system of the outpatient satisfaction questionnaire. The KMO of the indicator system was 0.938 and the Bartlett’s test value of sphericity 2,553,071.12 (P<0.001), which indicated that conducting factor analysis on the data was appropriate.
The secondary index of the indicator system of outpatient satisfaction questionnaire was also analyzed. The total variance contribution rate of the five primary indicators of pre-diagnosis, treatment, auxiliary examination, drug withdrawal, the environment and logistic services was 68.0% (Table 2). The Scree plot showed that the first five factors accounted for most of the variability. From the fifth factor, the characteristic value was small and exhibited a flat downward trend, with each factor accounting for only a small component of the variability (Figure 1).
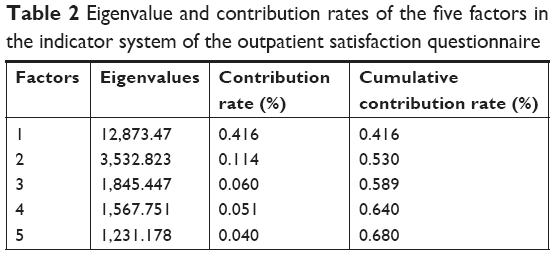 | Table 2 Eigenvalue and contribution rates of the five factors in the indicator system of the outpatient satisfaction questionnaire |
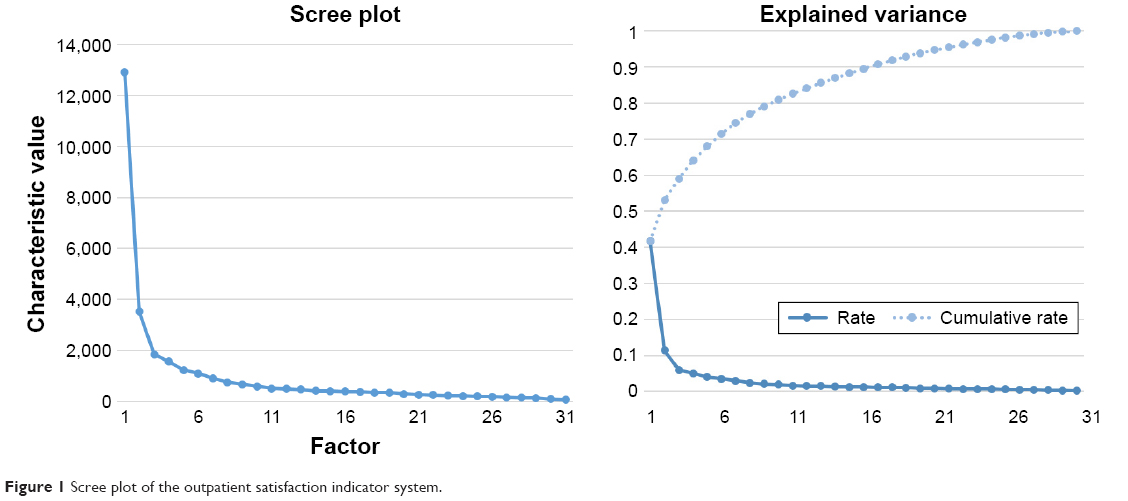 | Figure 1 Scree plot of the outpatient satisfaction indicator system. |
In order to facilitate analysis, each index was encoded in the order of b1–b31. In the rotated factor matrix by varimax rotation, the index of the maximum absolute value of factor loading in each factor was grouped (Table 3). The indicators under the “pre-diagnosis” dimension were b1–b6. They were dominated by the fourth factor, and the factor loading was between 0.531 and 0.707. The indicators under the “treatment” dimension were b7–b12. They were dominated by the second factor, and the factor loading was between 0.488 and 0.803. The indicators under the “auxiliary examination” dimension were b13–b20. They were dominated by the first factor, and the factor loading was between 0.636 and 0.919. The indicators under the “drug withdrawal” dimension were b21–b23. They were dominated by the fifth factor, and the factor loading was between 0.684 and 0.788. The indicators under the “environment and logistics service” dimension were b24–b31. They were dominated by the third factor, and the factor loading was between 0.438 and 0.749.
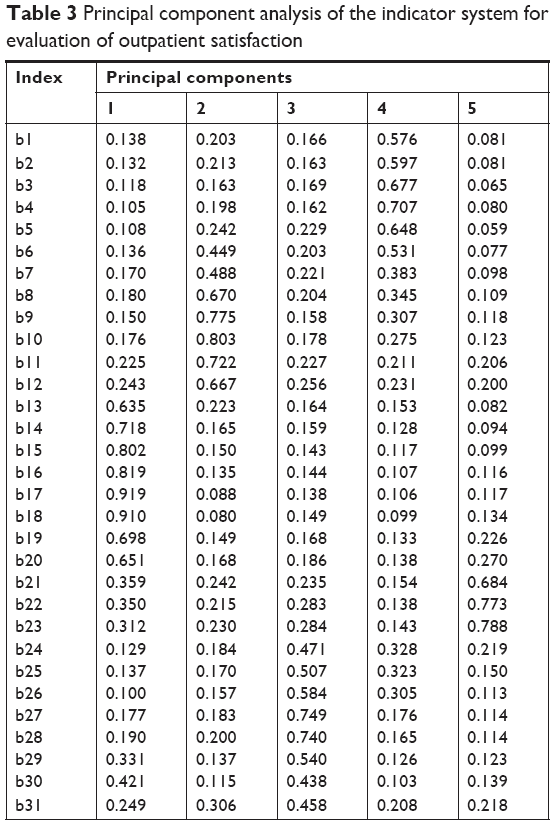 | Table 3 Principal component analysis of the indicator system for evaluation of outpatient satisfaction |
The factor of the indicator system can explain >50% of the variation, and each item had enough loading on the corresponding factors (≥0.4), so the indicator system had good structural validity.
Validity analysis of the indicator system for evaluating nonsurgical inpatient satisfaction
Exploratory factor analysis was used to investigate the structural validity of the secondary indicators of the nonsurgical inpatients indicator system. The KMO of the indicator system was 0.984 and the Bartlett’s test value of sphericity 5,441,976.14 (P<0.001), which indicates that conducting factor analysis on the data was appropriate. The total variance contribution rate of the five indicators of hospitalization service, treatment, auxiliary examination, service attitude, environment and logistics service was 68.5% (Table 4). The Scree plot showed the first five factors accounted for most of the variability. From the fifth factor, the characteristic value was small and exhibited a flat downward trend, and each factor accounted for only a small component of the variability (Figure 2).
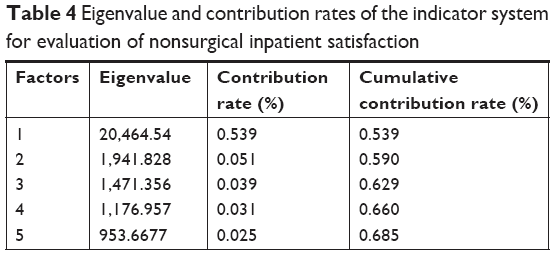 | Table 4 Eigenvalue and contribution rates of the indicator system for evaluation of nonsurgical inpatient satisfaction |
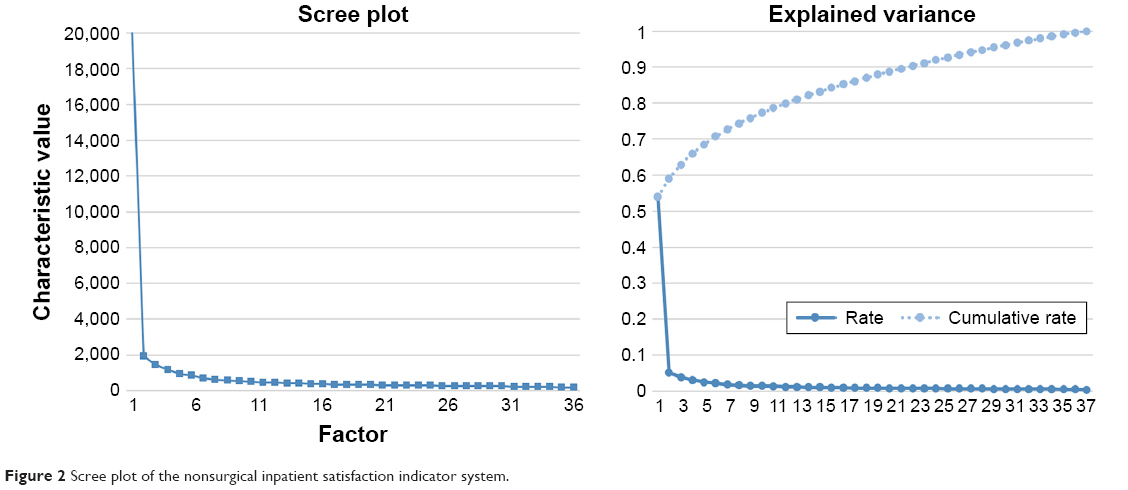 | Figure 2 Scree plot of the nonsurgical inpatient satisfaction indicator system. |
In order to facilitate analysis, each index was encoded in the order of b1–b38. In the rotated factor matrix by varimax rotation, the index of the maximum absolute value of factor loading in each factor was grouped (Table 5). The index of the maximum absolute value of factor loading in each factor was also grouped. The indicators under the “hospitalization service” dimension were b1–b7. They were dominated by the second factor, and the factor loading was between 0.420 and 0.730. The indicators under the “treatment” dimension were b8–b20. They were dominated by the first factor, and the factor loading was between 0.503 and 0.597. The indicators under the “auxiliary examination” dimension were b21–b26. They were dominated by the third factor, and the factor loading was between 0.649 and 0.775. The indicators under the “service attitude” dimension were b27–b29. They were dominated by the fifth factor, and the factor loading was between 0.417 and 0.579. The indicators under the “environment and logistic services” dimension were b30–b38. They were dominated by the fourth factor, and the factor loading was between 0.485 and 0.713.
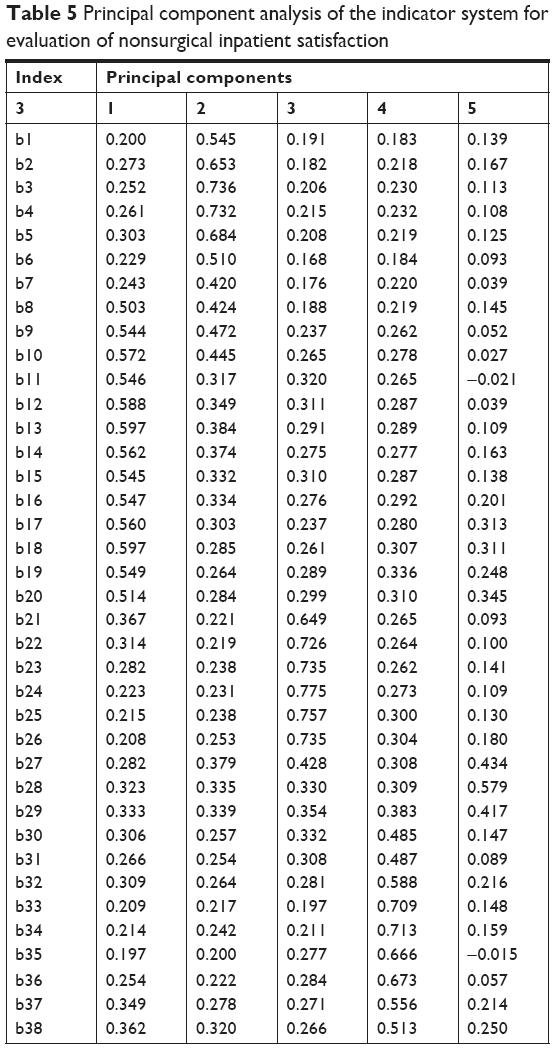 | Table 5 Principal component analysis of the indicator system for evaluation of nonsurgical inpatient satisfaction |
The five factors of the indicator system can explain >50% of the variation, and each item had enough loading on the corresponding factors (≥0.4), which indicated that the indicator system had good structural validity.
Validity analysis of the indicator system for evaluating surgical inpatient satisfaction
Exploratory factor analysis was used to analyze the structural validity of the original indicator system of surgical inpatients. The KMO of the indicator system was 0.987 and the Bartlett’s test value of sphericity 2,235,436.36 (P<0.001), indicating sample adequacy.
Exploratory factor analysis was further used to examine the structural validity of the secondary indicators of the surgical inpatients indicator system. The total variance contribution rate of the six primary indicators of hospitalization service, treatment, auxiliary examination, service attitude, environment and logistics service, surgical anesthesia was 71.0% (Table 6). The Scree plot revealed that the first six factors accounted for most of the variability. From the sixth factor, the characteristic value was small and exhibited a flat downward trend, and each factor accounted for only a small part of the variability (Figure 3).
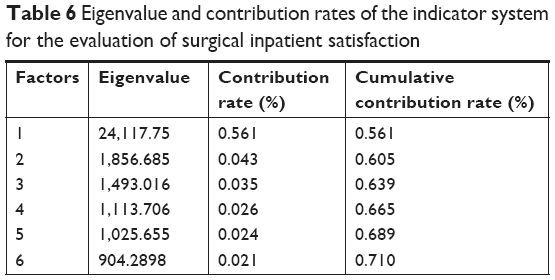 | Table 6 Eigenvalue and contribution rates of the indicator system for the evaluation of surgical inpatient satisfaction |
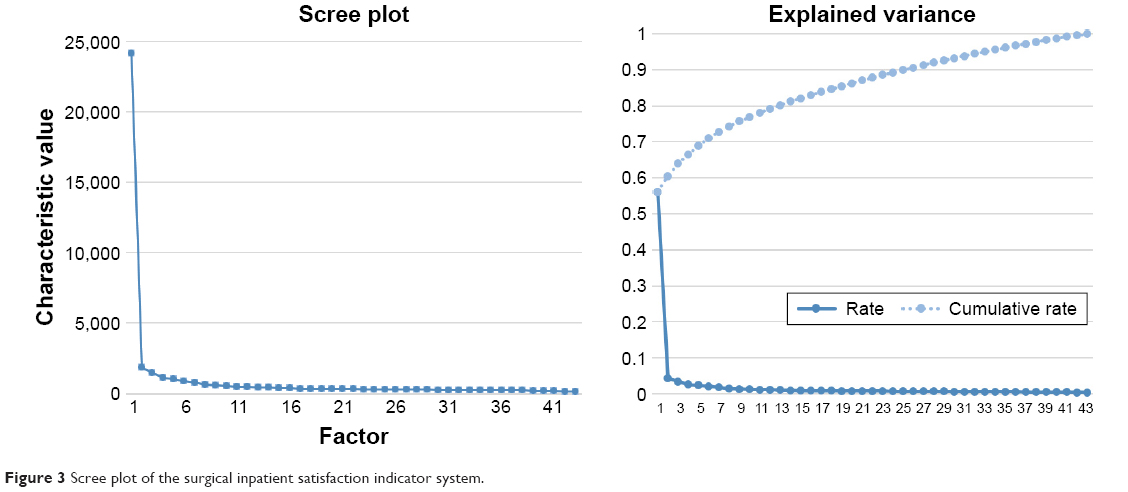 | Figure 3 Scree plot of the surgical inpatient satisfaction indicator system. |
In order to facilitate analysis, each index was encoded in the order of b1–b43, and six principal components were taken for principal component analysis. In the rotated factor matrix by varimax rotation, the index of the maximum absolute value of factor loading in each factor was grouped (Table 7). The indicators under the “hospitalization service” dimension were b1–b7. They were dominated by the first factor, and the factor loading was between 0.412 and 0.720. The indicators under the “treatment” dimension were b8–b20. They were dominated by the third factor, and the factor loading was between 0.467–0.578. The indicators under the “auxiliary examination” dimension were b21–b26. They were dominated by the second factor, and the factor loading was between 0.653 and 0.745. The indicators under the “service attitude” dimension were b27–b29. They were dominated by the sixth factor, and the factor loading was between 0.391 and 0.559. The indicators under the “environment and logistics service” dimension were b30–b38. b30–b37 were dominated by the fifth factor, and the factor loading was between 0.422 and 0.688. Factor b38 was dominated by the fourth factor, and the factor loading was 0.465. Its factor loading under the fifth factor was 0.392. The indicators under the “surgical anesthesia” dimension were b39–b43, and the factor loading was between 0.520 and 0.752.
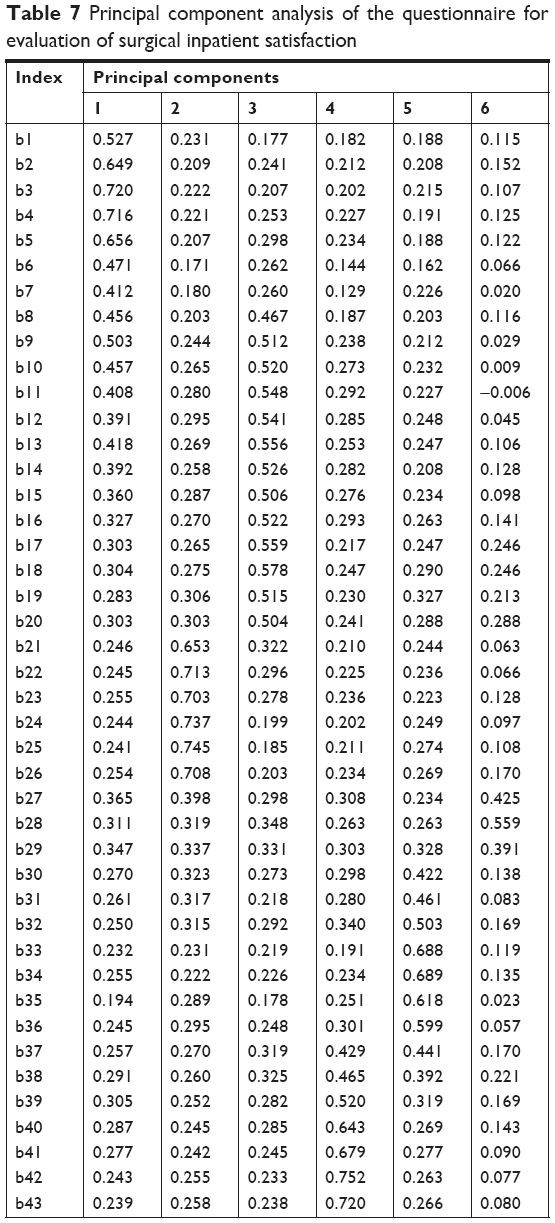 | Table 7 Principal component analysis of the questionnaire for evaluation of surgical inpatient satisfaction |
The factors of the indicator system can explain more than 50% of the variation, and each item had enough loading on the corresponding factors (≥0.4), which indicated that the indicator system had good structural validity.
Results of reliability analysis
We adopted the statistical methods of Spearman–Brown split-half reliability and Cronbach’s α coefficient for reliability analysis. The outpatient and inpatient satisfaction indicator system was confirmed by structural validity analysis, and their respective primary indicators were analyzed by the statistical method of split-half reliability and consistency of internal reliability. The results showed that the overall Cronbach’s α coefficient of the outpatient satisfaction indicator system was 0.956, and Cronbach’s α coefficient of each primary index was between 0.860 and 0.946, and the internal consistency reliability was excellent. The overall split-half reliability was 0.956, and split-half reliability of each primary index between 0.906 and 0.976. The split-half reliability was excellent, which was consistent with the evaluation results of Cronbach’s α coefficient (Table 8).
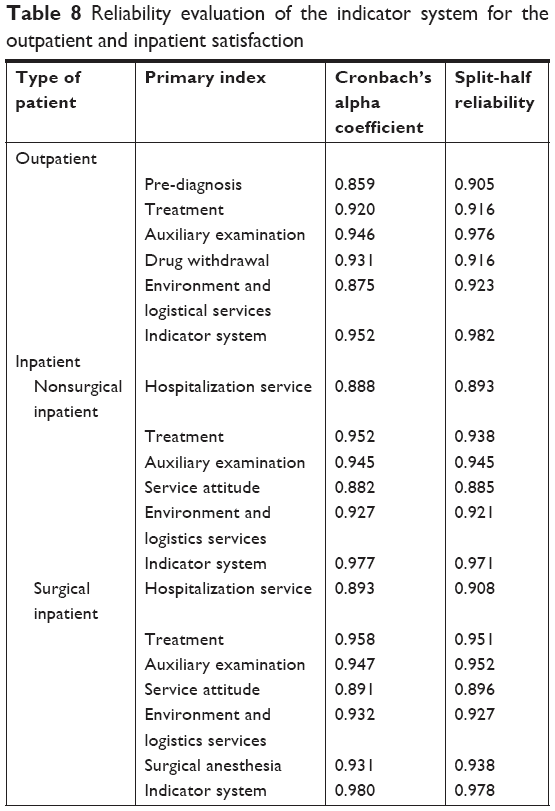 | Table 8 Reliability evaluation of the indicator system for the outpatient and inpatient satisfaction |
The overall Cronbach’s α coefficient of the satisfaction indicator system of inpatients who did not undergo surgery was 0.975, Cronbach’s α coefficient for each primary index was between 0.887 and 0.947 and the internal consistency reliability was excellent. The overall split-half reliability was 0.967, and split-half reliability of each primary index ranged between 0.882 and 0.944. The split-half reliability was excellent, which was consistent with the evaluation results of Cronbach’s α coefficient.
The overall Cronbach’s α coefficient of the satisfaction indicator system for surgical inpatients was 0.976, and Cronbach’s α coefficient for each primary index was between 0.882 and 0.951, and the internal consistency reliability was excellent. The overall split-half reliability was 0.976, and split-half reliability of each primary index ranged between 0.885 and 0.946. The split-half reliability was excellent, which was consistent with the evaluation results of Cronbach’s α coefficient.
Discussion
Our research is based on the satisfaction questionnaire project of the national doctor–patient experience research center with questionnaire data obtained from outpatients and inpatients between 2016 and 2017. After determining the indicator system by exploratory factor analysis, the outpatient and inpatient satisfaction indicator systems were analyzed by the statistical method of split-half reliability and consistency of internal reliability. The results showed that all of the satisfaction indicator systems of outpatients, nonsurgical inpatients and surgical inpatients have good structural validity and excellent reliability.
In previous studies, Chen and Zheming had initially developed an IPSQ after reviewing the literature and consulting hospital management experts.16 The first eight factors were admission process, cost, doctor’s service, food supply, assistant department service, nursing, treatment results, medical environment and facilities. However, as the internal consistency was low (α coefficient of admission process and cost was 0.22 and 0.36, respectively), the researchers considered revising the structure of the questionnaire. Wang et al17 extracted five factors through exploratory factor analysis, namely, nursing service, discharge guidance, related services, doctor diagnosis and treatment and logistic support. The overall Cronbach’s α of the questionnaire was 0.868, and the Cronbach’s α of the internal consistency of each primary index was between 0.354 and 0.834.17 There are some deficiencies in the reliability of the indicator systems described above. In recent years, Yang-zi has constructed a Chinese patient satisfaction questionnaire containing seven dimensions (doctor–patient relationship, doctor–patient communication, medical service, auxiliary service, environmental sanitation, medical ethics, procedure signs).18 The Cronbach’s α of internal consistency of the questionnaire was 0.975, the Cronbach’s α of seven dimensions was between 0.815 and 0.938, the overall split-half reliability 0.93, and the split-half reliability of each dimension lay between 0.816 and 0.913. Although the structure of the indicator system constructed in the above study was similar to that constructed in the present research, the reliability of the indicator system was better than that of the above study (vide supra).
The exploratory factor analysis of the surgical patients’ indicator system established in our study showed that the factor loading of the secondary index “overall service flow” was 0.395 (<0.4). There was a misclassification in the principal component analysis of the secondary index “medical ethics”. It is not classified under the primary index “environment and logistic services” which it subordinates to. Instead, it is classified under the primary index “surgical anesthesia”. First, our study did not adjust or modify the indicator system directly according to the results of exploratory factor analysis. The main reason is that the indicator system built in our study was based on the Delphi method. Second, the reliability of the indicator system constructed was excellent, indicating that the current indicator system is more than satisfactory. Third, the factor loading of the secondary index “overall service flow” in the surgical patient satisfaction indicator system was <0.4 (>0.3), but it was >0.4 in the nonsurgical patient satisfaction indicator system. Furthermore, it will facilitate the further comparative analysis of the index score of each factor in the surgical and nonsurgical IPSQ. As a result, our study retained the index in the indicator system for evaluating satisfaction of surgical inpatients. On the other hand, the second-level index “medical ethics” has been misclassified in the analysis of disaster factors, but the factor loading in its primary index “environment and logistic services” was 0.392–0.3. This will facilitate the further comparative analysis of surgical and nonsurgical inpatient satisfaction and consider that medical ethics is an important factor influencing patient satisfaction in China.19–21 Finally, based on comprehensive expert opinions and a comprehensive survey of the relevant literature, this study retained the secondary index “medical ethics” in the surgical inpatients satisfaction indicator system and subordinated it in the primary index “environment and logistic services”.
However, there are some limitations in this study. First, we only developed an indicator system for evaluating satisfaction of outpatients, surgical inpatients and nonsurgical inpatients in general. Further evaluation for specific diseases still remains to be constructed. We would like to develop an indicator system including different dimensions of departments or diseases in the future research. Besides, in order to improve the health care services of the hospitals, further investigation about impact factors of patients’ satisfaction among different institutions, regions, and characteristic of people need to be further explored.
Conclusion
The indicator systems constructed through exploratory factor analysis for evaluating satisfaction of outpatients, surgical inpatients and nonsurgical inpatients all had excellent reliability. They can be widely used in an outpatient and IPSQ in Chinese hospitals.
Ethics approval and consent to participate
This study was conducted in accordance with the Declaration of Helsinki. Written informed consent has been provided by the patients, or a parent or legal guardian if under the age of 18 years. Data in our study were obtained from electronic hospitalization summary reports (HSRs) of the National Healthcare Data Center of China. The data were masked by the National Healthcare Data Center (data source) and there is no patient name, identification number, contact information and other privacy information in our database. Therefore, any patient privacy was well protected. In addition, the data we used in our study are freely available. Thus, an ethic approval is not necessarily for our study.
Data sharing statement
The datasets analyzed during the current study will be available from the corresponding author on reasonable request.
Disclosure
The authors report no conflicts of interest in this work.
References
Urden LD. Patient satisfaction measurement: current issues and implications. Lippincotts Case Manag. 2002;7(5):194–200. | ||
Liu S. Construction and Empirical Analysis of Patient Satisfaction Index Model in Large Comprehensive Hospital [doctoral thesis]. Jilin: Jilin University; 2013. | ||
Baker R, Streatfield J. What type of general do patients refer? Exploration of practice characteristics influencing patient satisfaction. Br J Gen Pract. 1995;45(401):654–659. | ||
Carey RG, Posavac EJ. Using patient information to identify areas for service improvement. Health Care Manage Rev. 1982;7(2):43–48. | ||
Ware JE Jr, Snyder MK, Wright WR, Davies AR. Defining and measuring patient satisfaction with medical care. Eval Program Plann. 1983;6(3–4):247–263. | ||
Wilkins D, Hallam L, Dogget MA. Measures of Need and Outcome for Primary Health Care, Vol 36. Oxford: Oxford University Press; 1992. | ||
Streiner DL, Norman GR. Health measurement scales: a practical guide to their development and use. Oxford: Oxford University Press, 1995:5–7. | ||
Chen X. The Application of Analytic Hierarchy Process in the Analysis of Out-patient Satisfaction. Shanxi: Shanxi Finance and Economics University; 2011. | ||
Kong Y, Chen J. The reliability analysis of the expert consultation method in the community health service satisfaction index system. J Prev Med Chin People’s Liberation Army. 2007;25(4):259–261. Chinese. | ||
Tan L. Construction and Application of the Index System for Evaluating Patient Satisfaction in Grade III Level A Hospitals. Guangdong: Wuyi University; 2016. | ||
Xia P, Huang H, Lv Y, et al. The establishment and improvement of customer satisfaction measurement and management system of Guangdong Provincial Hospital of Chinese Medicine. Chin Hosp. 2010;14(10):43–47. Chinese. | ||
Yuan X, Zhang X, Dechuan J. The status and thinking of hospital patient satisfaction survey. Med Soc. 2010;23(8):50–51. Chinese. | ||
Yang H, Liu F, Zhang T, Shane T. Problems with patient satisfaction surveys and suggestions. Chin J Hosp Admin. 2005;21(7):437–441. Chinese. | ||
Kim JO, Charles MW. Introduction to Factor Analysis. Shanghai: Truth and Wisdom Press; 2016. | ||
DeVellis RF. Scale Development: Theory and Applications. Chongqing: Chong Qing University Press; 2010. | ||
Chen P, Zheming H. Investigation and assessment of satisfaction level of health service clients. Chin Hosp Manag. 1999;7:19–22. Chinese. | ||
Wang Y, Yu Z, Jin X, Shao MS. The development and reliability test of the satisfaction questionnaire for hospitalized patients. J Nurs Train. 2013;28(6):533–536. Chinese. | ||
Yang-zi C-H. The Development and Validation of Chinese Patient Satisfaction Questionnaire. Anhui: Wan Nan Medical College; 2016. | ||
Chen X. Theoretical and empirical study on patient conative loyalty model. J Third Mil Med Univ. 2009. Chinese. | ||
Sun Y, Chen L, Chen N. The effect of grading-up and recombinating flow-sheet on out-patient’s waiting time. Modern Clin Nur. 2006;5(4):63–64. Chinese. | ||
Zhou W, Zhang Y, Fan S, et al. Analysis of the effect of patient satisfaction on loyalty in outpatient department in Beijing municipal hospital. Hosp Manag Forum. 2015;32(11):18–20. |
 © 2018 The Author(s). This work is published and licensed by Dove Medical Press Limited. The full terms of this license are available at https://www.dovepress.com/terms.php and incorporate the Creative Commons Attribution - Non Commercial (unported, v3.0) License.
By accessing the work you hereby accept the Terms. Non-commercial uses of the work are permitted without any further permission from Dove Medical Press Limited, provided the work is properly attributed. For permission for commercial use of this work, please see paragraphs 4.2 and 5 of our Terms.
© 2018 The Author(s). This work is published and licensed by Dove Medical Press Limited. The full terms of this license are available at https://www.dovepress.com/terms.php and incorporate the Creative Commons Attribution - Non Commercial (unported, v3.0) License.
By accessing the work you hereby accept the Terms. Non-commercial uses of the work are permitted without any further permission from Dove Medical Press Limited, provided the work is properly attributed. For permission for commercial use of this work, please see paragraphs 4.2 and 5 of our Terms.