")
Back to Journals » Therapeutics and Clinical Risk Management » Volume 13
Relevance of the Weber effect in contemporary pharmacovigilance of oncology drugs
Authors Arora A, Jalali RK, Vohora D
Received 15 March 2017
Accepted for publication 23 June 2017
Published 11 September 2017 Volume 2017:13 Pages 1195—1203
DOI https://doi.org/10.2147/TCRM.S137144
Checked for plagiarism Yes
Review by Single anonymous peer review
Peer reviewer comments 2
Editor who approved publication: Professor Garry Walsh
Ankur Arora,1,2 Rajinder K Jalali,1,2 Divya Vohora1
1School of Pharmaceutical Education and Research, Jamia Hamdard, New Delhi, India; 2Medical Affairs and Clinical Research, Sun Pharmaceutical Industries Limited, Gurgaon, Haryana, India
Background: Numerous reporting biases have been known to affect spontaneous reporting databases. The Weber effect, which constitutes a peak in adverse event (AE) reporting of a drug at the end of second year after regulatory approval followed by a continuous decline thereafter, has been considered an important bias for a long time. The existence of this bias in AE reporting of oncology drugs remains an underevaluated area, prompting a targeted examination.
Methods: The US Food and Drug Administration (USFDA) Adverse Event Reporting System (FAERS) was studied for AE reporting patterns of 5 years of 15 new molecular entities (NMEs) and biologics used in oncology. This 5-year period started from the USFDA date of approval for the NMEs and biologics. The number of AEs reported for each of the drugs was plotted against time (years). The AE reporting patterns were specifically examined for the existence of the Weber effect. In addition, AE reporting rate patterns of 5 years of seven NMEs and biologics used in oncology were examined.
Results: A total of 50,630 AE reports were logged in to the FAERS for all 15 drugs examined for AE reporting patterns. We observed five distinct AE reporting patterns for 15 drugs; however, none of the AE patterns were identical to the Weber effect. We did not observe a consistent AE reporting rate pattern for the seven drugs examined for AE reporting rates. With the exception of one drug (cetuximab), none of the drugs exhibited a second-year peak in AE reporting rates. This peak was not followed by continuous decline in AE reporting rate thereafter.
Conclusion: This study does not support the existence of the Weber effect in AE reporting of oncology drugs. The contemporary AE reporting of oncology drugs does not exhibit a consistent pattern.
Keywords: Weber effect, adverse event reporting patterns, oncology drugs, USFDA, FAERS
Introduction
Spontaneous reporting databases are critical to pharmacovigilance as they allow an expedited analysis of adverse event (AE) reports to detect safety signals.1 However, this analysis is limited by various AE reporting biases.2 Some of the known biases are channeling bias, underreporting, detection bias, and the Weber effect.2
The prescribing patterns of drugs largely depend on patient characteristics, his/her medical history, and product profiles and lead to channeling bias. Serious AEs are typically reported more frequently, whereas nonserious AEs that are similar to common illnesses are reported less frequently. This type of AE reporting leads to underreporting. The detection bias arises as the number of reported AEs rise because of the tests that are performed to confirm or rule out a suspected AE.2
In 1984, Weber postulated that AE reporting of a drug peaks in the second year after its approval and subsequently declines. This observation was based upon Weber’s analysis of AE reporting patterns of seven nonsteroidal anti-inflammatory drugs (NSAIDs) in the UK. This pattern of AE reporting is known as the Weber effect. The Weber effect has been considered as an AE reporting bias since 1984.2,3 The plausible explanation for this effect is reduction in the reporting of clinically mild or trivial reactions over time.3
Subsequent studies have examined the Weber effect in other drug classes and spontaneous reporting databases. A study conducted in 2004 on NSAIDs in the US Food and Drug Administration (FDA) Adverse Event Reporting System (FAERS, formerly known as AERS) was able to confirm the presence of the Weber effect.4 Studies on AE reporting patterns of other drug classes such as selective serotonin-reuptake inhibitors (SSRIs) and angiotensin II receptor blockers (ARBs) were able to reproduce the Weber effect with only limited success.5,6 The study on SSRIs concluded that some agents can exhibit the Weber effect within a class of medications; however, the study on ARBs did not support the existence of the Weber effect.
The USFDA FAERS is a database that contains information on AE and medication error reports submitted to the FDA. This database supports the FDA’s postmarketing safety surveillance program for drug and therapeutic biologic products. Majority of reports in the database are from manufacturers as they are mandated by regulations to submit reports to this database. In addition, health care professionals (HCPs) and consumers also submit reports through the “MedWatch” program. Of the total nonmanufacturer reports submitted in 2012, 53% of reports were submitted by HCPs and 47% were submitted by the consumers.7 The original AERS was started in 1969. AE reporting has markedly increased since the last major revision of the system in 1997.8,9 The number of AE reports has more than doubled from 2006 to 2010.9 Therefore, the applicability of certain biases, which were earlier applicable to the database in general or for certain drug classes, needs to be revisited.
Two recent studies examined more current AE reporting data for the Weber effect. The first study examined AE patterns of drugs approved in 2006, and the other study examined drugs approved from 2006 to 2010 irrespective of the drug class or therapeutic area. Both these studies did not support the existence of the Weber effect.10,11 The first study was focused on drugs approved in a single year, and the second study took into account only AE reports where the drugs were primary suspect and studied a duration of 4 years.10,11 Both these studies presented AE case counts only and did not take into account AE reporting rates calculated as a function of estimated sales or use. The absence of the AE reporting rate data was noted as a limitation of both of these studies.10,11
Many regulatory agencies and companies use disproportionality analysis as a tool to make sense of the AE reporting data while detecting safety signals in spontaneous reporting databases. Drug event pairing, which is a prerequisite to most of these methods, also leverages secondary suspects in the AE cases.12–14
Chemotherapy regimens given to oncology patients are immensely complex and may involve the administration of numerous drugs at once.15 Accordingly, AEs can happen due to any of the drugs in these regimens. Once an AE is logged in to FAERS, the suspect drugs are assigned primary or secondary suspect tags. Some AE data analyses are performed by using only primary suspects. However, an analysis is likely to be more useful if equal consideration is given to both primary and secondary suspects as the reporter of an AE does not categorize the suspect drugs as primary or secondary. This categorization occurs at the database level while processing an AE case.
A large number of AEs reported for oncology drugs distinguish AE reporting of oncology drugs from AE reporting of drugs of other therapeutic areas.15 The early detection of safety signals by AE data analysis has become increasingly important in oncology considering the increased number of accelerated approvals in this domain. A review published in 2014 concluded that a limited number of articles focus upon the importance of postmarketing surveillance of cancer drug therapies. This review also noted that structured collection and analysis of AEs are important in oncology due to the high incidence of drug-related complications.16
Although studies on the Weber effect have been limited in terms of both number of AEs reported and therapeutic areas or drug classes, the Weber effect is considered as an established reporting bias. It has been consistently quoted in textbooks and research articles and continues to be considered in the evaluation of AE data.2,8,17–19 Many authors have explained the result of their analysis invoking this effect, adding considerable importance to it.19–25
The inconsistent conclusions of published literature on the applicability of the Weber effect, limited data on this bias for oncology drugs, increased reliance on safety signals in the determination of safety profile of oncology drugs, more relevance of FAERS secondary suspects in oncology, and continued citing of the Weber effect prompted us to do a further examination on this bias in oncology.
Accordingly, we sought to examine AE reporting patterns of oncology drugs approved over 4 years (2004–2007). The study took into account both primary and secondary suspect drugs and examined AE reporting patterns for a period of 5 years with an intent to determine the applicability of the Weber effect to AE reporting of oncology drugs.
In addition, we examined patterns of AE reporting rates for a subset of these drugs to determine whether AE reporting rates of oncology drugs follow a particular pattern. This was done to understand whether AE reporting calculated as a function of estimated sales exhibits the Weber effect or a particular consistent pattern.
Methods
The study included fifteen drugs approved by USFDA from January 1, 2004, to December 31, 2007. These drugs comprised of all the drugs approved by USFDA in 2004–2007, which were approved either as a new molecular entity (NME) or as a biologic and were listed by CenterWatch as FDA-approved drugs under oncology category.26,27
The FAERS data made public by USFDA were utilized for this analysis. The American Standard Code for Information Interchange files of FAERS provided by USFDA were leveraged for this analysis. As the FAERS does not have a standard way of representing drug names, the drug names were standardized by using drugs@FDA, IMS LifeCycle R&D Focus, and manual curation.28
The primary reason for selecting NMEs was to eliminate the influence of the prior knowledge of AE reporting patterns of drugs of the same class on the AE reporting patterns of study drugs.10
All the initial AE reports logged in to FAERS for these drugs over a period of 5 years were included in this analysis. The follow-up reports were not included in the analysis to avoid duplication. The period of 5 years was calculated from the USFDA date of approval of a drug. The AE reports where these drugs were either primary or secondary suspect were considered toward the final report counts.
The date of receipt of an AE report by the USFDA had to be after the approval date of the drug by the USFDA for inclusion in the analysis. The USFDA report receipt date was also utilized during quarterly/yearly counting of AE reports. Reports from all reporters were included in the examination. Noncumulative yearly counts of AE reports were generated and plotted against time to ascertain overall AE reporting patterns. The AE reporting patterns were then examined for the existence of the Weber effect, and the drugs were categorized based on the pattern exhibited by them.
For seven of these fifteen drugs, selected based on the availability of data, AE reporting rates were also examined and estimated by calculating AE report counts as a function of estimated sales. Accordingly, the AE reporting rate of each of these seven drugs was calculated as AE report counts per thousand units sold.
The annual number of units sold for each of these drugs was approximated by dividing the annual sales data with unit price of the drug. Company annual reports, official media releases, and/or Form 10-K were leveraged to obtain US specific sales data. The historical prices of these drugs were obtained from information made public by the Patented Medicine Prices Review Board.29 In case multiple strengths of a drug were available, the price for strength analyzed by Patented Medicine Prices Review Board was leveraged for the calculation of AE reporting rates across the 5 years of the study period. In scenarios where the board analyzed prices of multiple strengths, the price of the lowest strength was used in the calculations.
Annual AE reporting rates since the approval of these drugs were plotted against time for a 5-year period to ascertain overall AE reporting rate patterns. The patterns of AE reporting rates were then examined for the existence of the Weber effect or any particular consistent pattern exhibited by them.
All analyses were conducted using Statistical Analysis Software (version 9.3; SAS Institute Inc., Cary, NC, USA) and Microsoft Office Excel software (Excel 2013; Microsoft, Redmond, WA, USA).
Results
Our study examined patterns of both AE reporting counts and AE reporting rates of oncology drugs. For examining patterns of AE reporting counts, fifteen drugs were evaluated. Six drugs were approved by USFDA in 2004, two were approved in 2005, three were approved in 2006, and four were approved in 2007 (Table 1). All of these drugs are used in the treatment of cancers, except cinacalcet, which has a supplemental role in the management of parathyroid carcinoma. The evaluation period for the examined drugs spanned from 2004 to 2012. As per the statistics made available by FDA, this period showed a consistent increase in the number of AE reports logged in to the FAERS (Figure 1).9,30
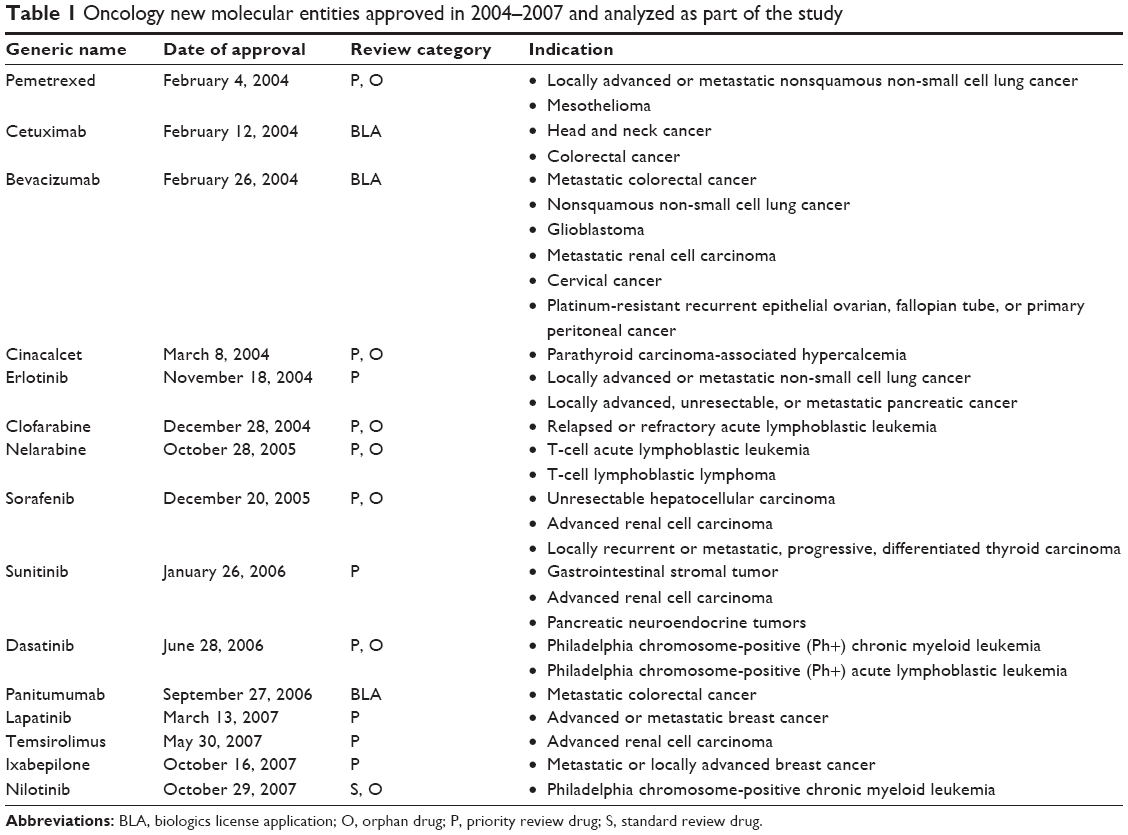 | Table 1 Oncology new molecular entities approved in 2004–2007 and analyzed as part of the study |
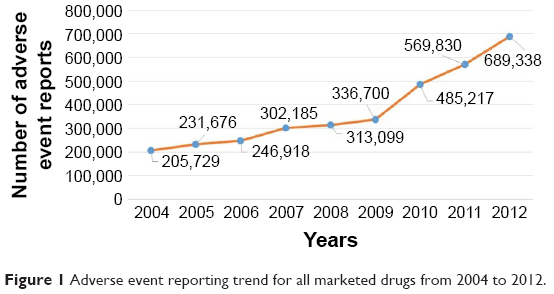 | Figure 1 Adverse event reporting trend for all marketed drugs from 2004 to 2012. |
For all 15 drugs examined, 50,630 AE reports were logged in to the FAERS over the 5-year cumulative period starting from the date of the respective approvals. Most AE reports were logged for bevacizumab (N=9,566) and the least AE reports were logged for nelarabine (N=73).
The total number of AE reports logged in to FAERS for each of these drugs over the respective 5-year periods have been presented in the Table 2. There was an overall increase in AE reports logged in to FAERS through the years 2004 to 2012. However, the examined drugs did not show an increase in the number of AE reports when correlated with increasing approval year.
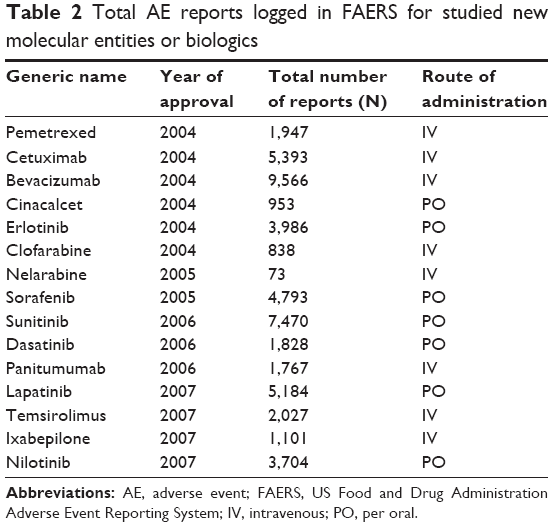 | Table 2 Total AE reports logged in FAERS for studied new molecular entities or biologics |
Five distinct AE reporting patterns were observed for these drugs, some of them closely resembling the Weber effect (Categories A and B). These patterns were the following: Category A: a second-year peak in AE reports followed by a 2-year decline; Category B: a second-year increase in AE reports followed by a 1-year decline; Category C: a third-year peak followed by a 1-year decline; Category D: a second-year nadir in AE reporting; and Category E: continuous increase in AE reporting. However, none of the AE patterns were identical to the classic Weber effect.
The AE reports for ixabepilone (Category A; N=1) increased for the first 2 years postapproval and reached a peak in the second year. The AE reporting consistently decreased for the next 2 years before increasing mildly in the fifth year. Of all the AE patterns observed in this study, this pattern (Category A) was the closest to the Weber pattern.
The AE reports for pemetrexed, erlotinib, panitumumab, nelarabine, and temsirolimus (Category B; N=5) increased for the first 2 years and subsequently decreased in the third year. However, there was an increase in AE reporting in the fourth year again. AE reporting peaked for pemetrexed in the second year, and similar peaks were observed for nelarabine and temsirolimus in the fourth year and for erlotinib and panitumumab in the fifth year.
There was a continuous increase in AE reporting for cinacalcet, cetuximab, and dasatinib (Category C; N=3) for the first 3 years after approval followed by a decline in the fourth year. The peak of AE reporting was also observed in the third year after approval. Diametrically opposite to the Weber effect, AE reporting for lapatinib and sorafenib (Category D; N=2) touched a nadir in the second year after approval. AE reports for bevacizumab, clofarabine, nilotinib, and sunitinib (Category E; N=4) continuously increased for 5 years after approval. Figures 2–6 illustrate the reporting patterns for the drugs based on the category of AE reporting pattern.
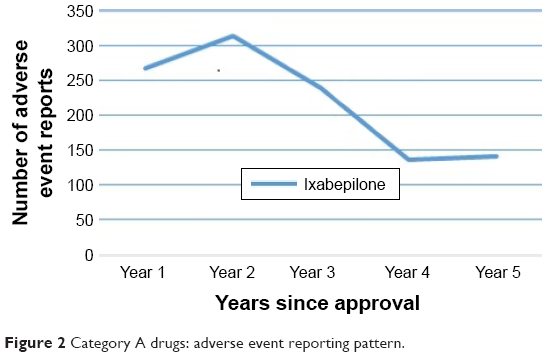 | Figure 2 Category A drugs: adverse event reporting pattern. |
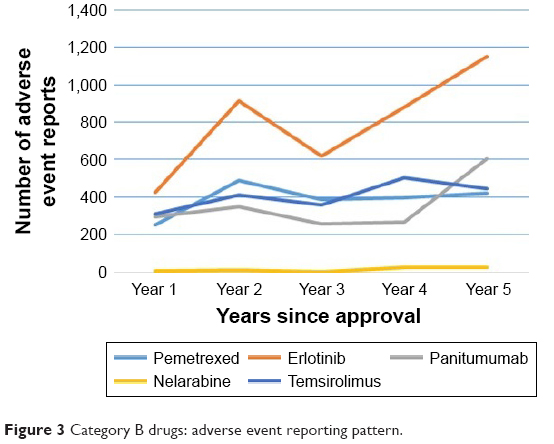 | Figure 3 Category B drugs: adverse event reporting pattern. |
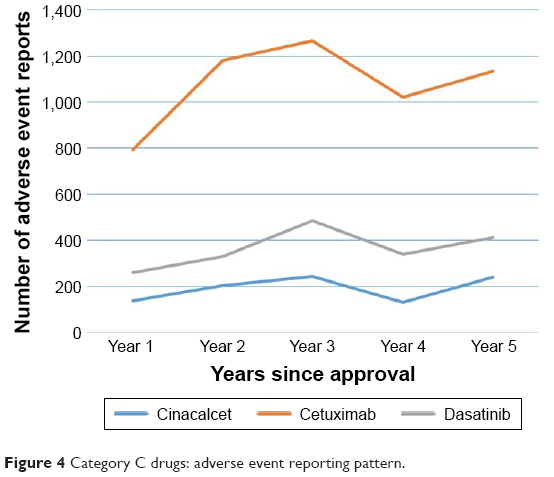 | Figure 4 Category C drugs: adverse event reporting pattern. |
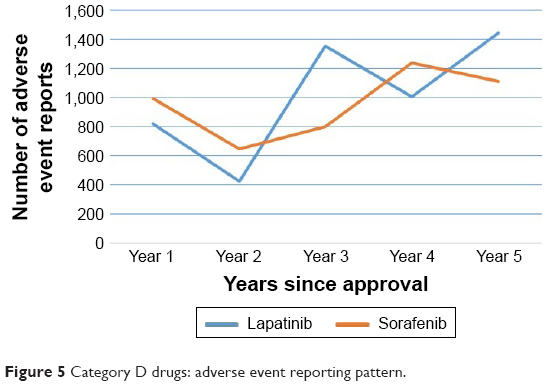 | Figure 5 Category D drugs: adverse event reporting pattern. |
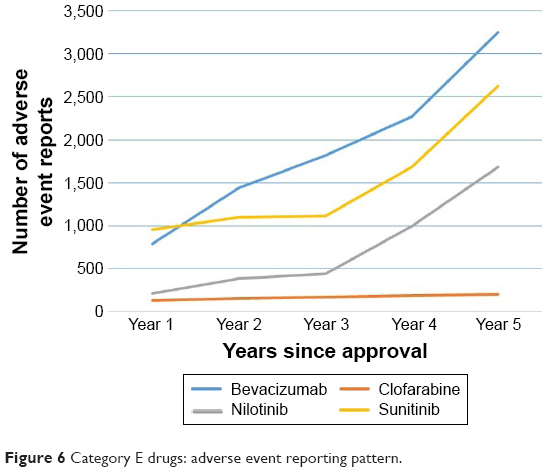 | Figure 6 Category E drugs: adverse event reporting pattern. |
Of the 15 drugs, three drugs, namely bevacizumab, cetuximab, and panitumumab, are biologics. However, there is no consistency in their AE reporting patterns. In fact, all these three drugs showed distinct reporting patterns. AE reporting pattern of bevacizumab belonged to Category E, and those of cetuximab and panitumumab belonged to Categories C and B, respectively.
Eight of the 15 drugs (53.33%) had an intravenous route of administration (namely pemetrexed, cetuximab, bevacizumab, clofarabine, nelarabine, panitumumab, temsirolimus, and ixabepilone), and the rest had an oral route of administration. The AE reporting patterns were not consistent for a particular route of administration. In addition, drugs approved in a common year did not exhibit a common AE reporting pattern.
For examining patterns of AE reporting rates, seven drugs were evaluated. Patterns of AE reporting rates (the number of AEs reported per thousand units sold) for these seven study drugs were analyzed for a 5-year period postapproval. These seven drugs were pemetrexed, cetuximab, bevacizumab, cinacalcet, erlotinib, dasatinib, and panitumumab. AE reporting rates of none of these drugs exhibited a Weber effect-like pattern. There was a decrease in the AE reporting rate in the second year of approval for most of the drugs. Exceptions to this were AE reporting rates of bevacizumab and cetuximab, which increased in the second year postapproval. AE reporting rate of pemetrexed showed a continuous decline for all 5-years of the study period, whereas AE reporting rate of cinacalcet declined during the first 4 years and then increased. AE reporting rate of erlotinib declined during the first 3 years followed by an increase in the subsequent 2 years. AE reporting rate of dasatinib declined in the second year postapproval; however, there was an increase in the subsequent year followed by a 2-year decline. AE reporting rate of panitumumab declined in the second year postapproval; however, there was an increase in the subsequent 3 years. Figure 7 shows the AE reporting rate patterns of all of these seven drugs.
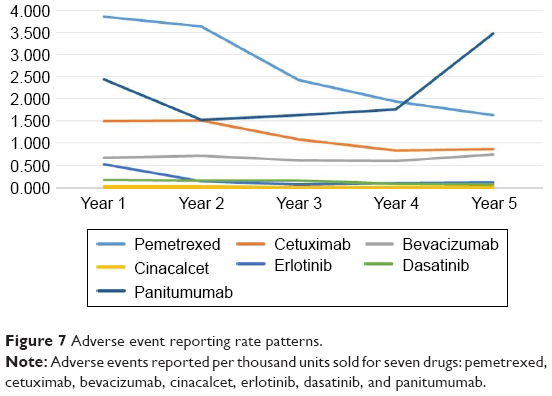 | Figure 7 Adverse event reporting rate patterns. |
Discussion
Spontaneous reporting databases are the foundation of spontaneous reporting systems. Using these systems is an established, effective, and relatively inexpensive method of detecting safety signals that remained undetected during clinical development of a drug.31 However, the pattern of AE reporting is known to be influenced by external factors, which may affect the reliability of the detected signal. Among the most established confounders, the product age (ie, the time on the market of the compound) and stimulated reporting have been acknowledged. In fact, the Weber effect has been called an epidemiological phenomenon.32 Since its postulation in the 1980s for AE reporting of NSAIDs, the Weber effect has been considered while performing AE analysis of diverse drug classes or therapeutic areas until today.
Pharmacovigilance databases are, by nature, dynamic. The AE reports being submitted to the FDA have increased rapidly with an improvement in submission methods, data standards, and awareness.33 Thus, it is imperative that we keep on evaluating the applicability of the known epidemiological phenomenon in the contemporary setting.
The results of our study do not support the existence of the Weber effect in contemporary AE reporting of oncology drugs. AE reporting pattern of all the 15 drugs examined in the study did not show the Weber effect. Although, the AE reporting increased in the second year after regulatory approval for 13 of 15 drugs (86.66%), it was not followed by a continuous decrease. In fact, a second-year peak in AE reporting was seen only in two drugs (namely ixabepilone and pemetrexed). The second-year increase in AE reporting of most of the drugs can be explained by the increased reach and usage of the drugs in the second year and low AE report base in the first year of drug approval. The AE reporting pattern of these fifteen drugs did not show any single consistent pattern. However, we were able to categorize the AE reporting trends into five distinct patterns.
Our results for oncology drugs are in line with two recent studies that examined AE reporting patterns of drugs approved by USFDA in 2006 and 2006–2010 irrespective of drug class.10,11 Our primary methodology was similar to that in a study conducted by Chhabra et al; however, it was different from that of Hoffman et al.10,11 Chhabra et al studied approvals in a single year; however, they did not specify whether the AE report counts were based on primary or secondary suspects or both. The analysis conducted by Hoffman et al considered AE reports where study drugs were primary suspects, whereas we considered AE reports where study drugs were either primary or secondary suspect. As both primary and secondary suspects are often used for AE reporting data analysis, we included both types of suspects. In addition, both these studies did not evaluate the pattern of AE reporting rates.10,11 Therefore, the pattern of AE report counts when adjusted for sales data was not available. The authors of these studies noted this limitation. Our study examined patterns of AE reporting rates and shows that even patterns of AE reporting rates (AE report counts per 1,000 units sold) of oncology drugs do not exhibit the Weber effect.
A trend of continuous increase in AE reporting was expected with a year-on-year increase in the number of AE reports logged in to the FAERS.9,34 However, this was not corroborated by the results of our study as AE reports of only about one-fourth of the drugs included in the study demonstrated a continuous year-on-year increase in the number of AEs.
The AE reporting patterns of the two drugs sorafenib and lapatinib are especially of note as both these drugs had a second-year decrease in the number of reports. Sorafenib was approved in 2005 and is used for the treatment of unresectable hepatocellular carcinoma, advanced renal cell carcinoma, and locally recurrent or metastatic, progressive, differentiated thyroid carcinoma. Lapatinib was approved in 2006 and is used in the treatment of advanced or metastatic breast cancer. There could be multiple plausible reasons for this decrease in AE reporting in the second year such as substantial response from physicians in the first year after approval and AE profile.
Some earlier studies such as the ones conducted by Wallenstein and Fife35 and McAdams et al6 examined the reporting rates.35 However, both these studies were not for oncology drugs. Wallenstein et al studied AE reporting rates of NSAIDs, and McAdams et al studied AE reporting rates of ARBs. Both these studies used the number of prescriptions as denominators. Wallenstein et al did not find a Weber pattern, whereas McAdams et al did find a pattern that approximated Weber pattern in AE reporting rates in their respective studies.10 Our study did not find a consistent pattern in AE reporting rates for oncology drugs. The AE reporting rate patterns did not exhibit a second-year peak except for cetuximab. However, even for cetuximab, the decline in AE reporting rate was not continuous. The most common pattern was that of a decrease in AE reporting rate in the second year after the drug approval. This is explainable and expected. The sales of the drugs subsequent to approval increase tremendously owing to the addition of new geographies, increased reach of the sales network, and awareness.
All spontaneous reporting databases are affected by underreporting. This phenomenon of underreporting would have affected all study drugs, thereby having no bearing on the results of our study.
The Weber effect was postulated to occur as physician interest and reporting of newly observed AEs were more in the initial years of approval of a drug. In the subsequent years, familiarization with AEs led to reduced reporting of clinically mild or trivial reactions.3 The oncology patients are better monitored for AEs (more severe) and have more frequent interactions with doctor. This could be a reason behind sustained reporting of AEs with oncology drugs, which could have contributed to nonobservance of the Weber effect in these drugs. The other factors that could have led to nonobservance of the Weber effect are institution of risk evaluation and mitigation strategies, more stringent regulatory authorities, increased volume of AE reports, and better doctor and patient awareness due to Internet access and social media, which were not present at the time of initial postulation of the Weber effect.9,36–39
The AE reporting patterns of the study drugs did not have any consistency when examined by drug class (NMEs versus Biologics) or by the route of administration. Thus, these patterns seemingly are governed by multiple factors rather than a single determinant.
Overall, the current AE reporting or reporting rates of oncology drugs do not follow any particular pattern. Market dynamics, qualitative AE profiles, the number of alternative medicines in the treatment group, risk management obligations, the incidence of indication of use are some of the factors that might be responsible for this variability in the AE reporting patterns.
Conclusion
This study does not support the existence of the Weber effect in AE reporting of oncology drugs. It seems that AE reporting or reporting rates for oncology drugs to USFDA do not follow any consistent pattern. In light of earlier studies and on the basis of data from our study, it seems that the Weber effect is not of relevance in contemporary pharmacovigilance of oncology drugs and may not be a relevant factor in the analysis of postmarket AE data. It is difficult to pinpoint the exact cause of nonreplication of this effect; however, regulatory changes, increased thrust on pharmacovigilance, and significant change in volume of AE reports since 1984 may have contributed toward this shift. Inherent nature of oncology setup and AE profile could also have a role to play. Further, it seems that AE reporting is dependent on multiple factors. Standalone factors such as time since approval, route of administration, and nature of drug (biologic versus nonbiologic) do not dictate consistent AE reporting patterns.
Acknowledgments
This research was conducted at the Research and Development Centre, Sun Pharmaceutical Industries Limited, Haryana, India, and Jamia Hamdard University, New Delhi, India. This research work has not been published or presented before.
Disclosure
RKJ and AA are employed by Sun Pharmaceutical Industries Limited. The authors report no conflicts of interest in this work.
References
Palleria C, Leporini C, Chimirri S, et al. Limitations and obstacles of the spontaneous adverse drugs reactions reporting: two “challenging” case reports. J Pharmacol Pharmacother. 2013;4(Suppl 1):S66–S72. | ||
Nauck MA, Friedrich N. Do GLP-1–based therapies increase cancer risk? Diabetes Care. 2013;36(Suppl 2):S245–S252. | ||
Weber JCP. Epidemiology of adverse reactions to nonsteroidal anti-inflammatory drugs. In: Rainsford KD, Velo GD, editors. Side-effects of Anti-inflammatory Drugs, Advances in Inflammation Research. New York: Raven Press; 1984:1–7. | ||
Hartnell NR, Wilson JP. Replication of the Weber effect using postmarketing adverse event reports voluntarily submitted to the United States Food and Drug Administration. Pharmacotherapy. 2004;24(6):743–749. | ||
Hartnell NR, Wilson JP, Patel NC, Crismon ML. Adverse event reporting with selective serotonin-reuptake inhibitors. Ann Pharmacother. 2003;37(10):1387–1391. | ||
McAdams MA, Governale LA, Swartz L, Hammad TA, Dal Pan GJ. Identifying patterns of adverse event reporting for four members of the angiotensin II receptor blockers class of drugs: revisiting the Weber effect. Pharmacoepidemiol Drug Saf. 2008;17(9):882–889. | ||
United States Food and Drug Administration (USFDA). FAERS Reporting by Healthcare Providers and Consumers by Year. Available from: http://www.fda.gov/Drugs/GuidanceComplianceRegulatoryInformation/Surveillance/AdverseDrugEffects/ucm070456.htm. Accessed March 2017. | ||
Sakaeda T, Tamon A, Kadoyama K, Okuno Y. Data mining of the public version of the FDA Adverse Event Reporting System. Int J Med Sci. 2013;10(7):796–803. | ||
United States Food and Drug Administration (USFDA). FDA Adverse Event Reporting System (FAERS) Statistics. Available from: https://www.fda.gov/Drugs/GuidanceComplianceRegulatoryInformation/Surveillance/AdverseDrugEffects/ucm070434.htm. Accessed June 12, 2016. | ||
Chhabra P, Chen X, Weiss SR. Adverse event reporting patterns of newly approved drugs in the USA in 2006: an analysis of FDA Adverse Event Reporting System data. Drug Saf. 2013;36:1117–1123. | ||
Hoffman KB, Dimbil M, Erdman CB, Tatonetti NP, Overstreet BM. The Weber effect and the United States Food and Drug Administration’s Adverse Event Reporting System (FAERS): analysis of sixty-two drugs approved from 2006 to 2010. Drug Saf. 2014;37:283–294. | ||
United States Food and Drug Administration (USFDA). What is Data Mining? USFDA. Available from: http://www.fda.gov/ohrms/dockets/ac/06/briefing/2006-4266b1-02-06-FDA-appendic-f.pdf. Accessed March 15, 2017. | ||
European Medicines Agency. EMA Guidance Document. Guideline on the Use of Statistical Signal Detection Methods in the Eudravigilance Data Analysis System. London: European Medicines Agency; 2008. Ref. EMEA/106464/2006 rev.1. Available from: http://www.ema.europa.eu/docs/en_GB/document_library/Regulatory_and_procedural_guideline/2009/11/WC500011434.pdf. Accessed March 15, 2017. | ||
Harpaz R, DuMouchel W, Shah NH, Madigan D, Ryan P, Friedman C. Novel data mining methodologies for adverse drug event discovery and analysis. Clin Pharmacol Ther. 2012;91(6):1010–1021. | ||
Chopra D, Rehan HS, Sharma V, Mishra R. Chemotherapy-induced adverse drug reactions in oncology patients: a prospective observational survey. Indian J Med Paediatr Oncol. 2016;37(1):42–46. | ||
Baldo P, De Paoli P. Pharmacovigilance in oncology: evaluation of current practice and future perspectives. J Eval Clin Pract. 2014;20(5):559–569. | ||
Oshima Y, Tsukamoto H, Tojo A. Association of hepatitis B with antirheumatic drugs: a case-control study. Mod Rheumatol. 2013;23(4):694–704. | ||
Willemen MJ, Mantel-Teeuwisse AK, Straus SM, Meyboom RH, Egberts TC, Leufkens HG. Use of dipeptidyl peptidase-4 inhibitors and the reporting of infections: a disproportionality analysis in the World Health Organization VigiBase. Diabetes Care. 2011;34(2):369–374. | ||
Davenport MS, Dillman JR, Cohan RH, et al. Effect of abrupt substitution of gadobenate dimeglumine for gadopentetate dimeglumine on rate of allergic-like reactions. Radiology. 2013;266(3):773–782. | ||
de Graaf L, Fabius MA, Diemont WL, van Puijenbroek EP. The Weber-curve pitfall: effects of a forced introduction on reporting rates and reported adverse reaction profiles. Pharm World Sci. 2003;25(6):260–263. | ||
Mannucci PM. Anticoagulanti orali diretti: una sfida per la farmacovigilanza [Direct oral anticoagulants: a new challenge for pharmacovigilance]. Focus Farmacovigilanza. 2014;81(3):1. Italian. | ||
FDA Advisory Committee; Sanofi-aventis US. Presentation on Ketek® (telithromycin); 2006. Available from: https://www.fda.gov/ohrms/dockets/ac/06/slides/2006-4266s1-02-06-Ketek-Rullo.pdf. Accessed March 15, 2017. | ||
Southworth MR, Reichman ME, Unger EF. Dabigatran and postmarketing reports of bleeding. N Engl J Med. 2013;368(14):1272–1274. | ||
Motola D, Biagi C, Leone R, et al. Ticlopidine safety profile: a case/non-case study on the basis of the spontaneous ADRs reporting in Italy. Curr Drug Saf. 2012;7(2):99–105. | ||
Matsuda S, Aoki K, Kawamata T, et al. Bias in spontaneous reporting of adverse drug reactions in Japan. PLoS One. 2015;10(5):e0126413. | ||
United States Food and Drug Administration (USFDA). New Molecular Entity (NME) Drug and New Biologic Approvals. USFDA. Available from: https://www.fda.gov/Drugs/DevelopmentApprovalProcess/HowDrugsareDevelopedandApproved/DrugandBiologicApprovalReports/NDAandBLAApprovalReports/ucm373420.htm. Accessed March 15, 2017. | ||
CenterWatch. 2004 FDA Approved Drugs. CenterWatch. Available from: https://www.centerwatch.com/drug-information/fda-approved-drugs/year/2004. Accessed March 15, 2017. | ||
United States Food and Drug Administration (USFDA). Drugs@FDA: FDA Approved Drug Products. USFDA. Available from: http://www.accessdata.fda.gov/scripts/cder/daf/. Accessed March 15, 2017. | ||
Patented Medicine Prices Review Board (PMPRB). Patented Medicine Prices Review Board. PMPRB. Available from: http://www.pmprb-cepmb.gc.ca/home. Accessed June 10, 2017. | ||
United States Food and Drug Administration (USFDA). Open FDA. USFDA. Available from: https://open.fda.gov/drug/event/. Accessed February 22, 2017. | ||
Kasliwal R. Spontaneous reporting in pharmacovigilance: strengths, weaknesses and recent methods of analysis. The Journal of Clinical and Preventive Cardiology. 2012;1:20–23. Berkshire, UK: JCPC; 2015. Available from: http://www.jcpcarchives.org/full/spontaneous-reporting-in-pharmacovigilance--strengths-49.php. Accessed March 15, 2017. | ||
Poluzzi E, Raschi E, Piccinni C, De Ponti F. Data Mining Techniques in Pharmacovigilance: Analysis of the Publicly Accessible FDA Adverse Event Reporting System (AERS). Chapter 12. Available from: http://dx.doi.org/10.5772/50095. Accessed March 15, 2017. | ||
Fang H, Su Z, Wang Y, et al. Exploring the FDA adverse event reporting system to generate hypotheses for monitoring of disease characteristics. Clin Pharmacol Ther. 2014;95(5):496–498. | ||
Weiss-Smith S, Deshpande G, Chung S, Gogolak V. The FDA drug safety surveillance program: adverse event reporting trends. Arch Intern Med. 2011;171(6):591–593. | ||
Wallenstein EJ, Fife D. Temporal patterns of NSAID spontaneous adverse event reports: the Weber effect revisited. Drug Saf. 2001;24(3):233–237. | ||
United States Food and Drug Administration (USFDA). Approved Risk Evaluation and Mitigation Strategies (REMS). Available from: http://www.accessdata.fda.gov/scripts/cder/rems/index.cfm. Accessed March 15, 2017. | ||
United States Food and Drug Administration (USFDA). Milestones in Food and Drug Law History. Available from: http://www.fda.gov/aboutfda/whatwedo/history/milestones/ucm081229.htm. Accessed March 15, 2017. | ||
Hart A, Henwood F, Wyatt S. The role of the Internet in patient-practitioner relationships: findings from a qualitative research study. J Med Internet Res. 2004;6(3):e36. | ||
Ilic D. The role of the internet on patient knowledge management, education, and decision-making. Telemed J E Health. 2010;16(6):664–669. |
 © 2017 The Author(s). This work is published and licensed by Dove Medical Press Limited. The full terms of this license are available at https://www.dovepress.com/terms.php and incorporate the Creative Commons Attribution - Non Commercial (unported, v3.0) License.
By accessing the work you hereby accept the Terms. Non-commercial uses of the work are permitted without any further permission from Dove Medical Press Limited, provided the work is properly attributed. For permission for commercial use of this work, please see paragraphs 4.2 and 5 of our Terms.
© 2017 The Author(s). This work is published and licensed by Dove Medical Press Limited. The full terms of this license are available at https://www.dovepress.com/terms.php and incorporate the Creative Commons Attribution - Non Commercial (unported, v3.0) License.
By accessing the work you hereby accept the Terms. Non-commercial uses of the work are permitted without any further permission from Dove Medical Press Limited, provided the work is properly attributed. For permission for commercial use of this work, please see paragraphs 4.2 and 5 of our Terms.