")
Back to Journals » International Journal of Nephrology and Renovascular Disease » Volume 11
Relationship of inferior vena cava collapsibility to ultrafiltration volume achieved in critically ill hemodialysis patients
Authors Kaptein MJ, Kaptein JS , Oo Z , Kaptein EM
Received 16 February 2018
Accepted for publication 9 May 2018
Published 23 July 2018 Volume 2018:11 Pages 195—209
DOI https://doi.org/10.2147/IJNRD.S165744
Checked for plagiarism Yes
Review by Single anonymous peer review
Peer reviewer comments 2
Editor who approved publication: Professor Pravin Singhal
Matthew J Kaptein,1,2 John S Kaptein,2 Zayar Oo,2 Elaine M Kaptein2
1Division of Nephrology, Loma Linda University Medical Center, Loma Linda, CA, USA; 2Division of Nephrology, University of Southern California, Los Angeles, CA, USA
Background: Ultrasound (US) assessment of intravascular volume may improve volume management of dialysis patients. We investigated the relationship of intravascular volume evaluated by inferior vena cava (IVC) US to net volume changes with intermittent hemodialysis (HD) in critically ill patients.
Methods: A retrospective cohort of 113 intensive care unit patients in 244 encounters had clinical assessment of intravascular volume followed by US of respiratory/ventilatory variation of IVC diameter, and had HD within 24 h. IVC collapsibility index (IVC CI)=(IVCmax–IVCmin)/IVCmax*100%. Volume management was guided by clinical data plus IVC US findings. Intradialytic hypotension (IDH) was categorized by severity from none to inability to tolerate HD.
Results: Linear regression correlating n-weighted proportions of encounters achieving net volume removal of ≥0.5 L, ≥1.0 L, ≥1.5 L, and ≥2.0 L strongly correlated across the range of IVC CI (R2=0.87–0.64). Sensitivity and specificity analysis showed IVC CI was a better predictor than IVCmax of achieving net ultrafiltration (UF) volumes. Mean central venous pressure, pulmonary artery occlusion pressure, and cardiac output were poor predictors by logistic regression and receiver operating curve analyses. IVC CI <20% was the approximate optimal cutoff for achieving ≥0.5 L to ≥2.0 L net UF volumes. Net volume change achieved tended to be less than recommended and may have been limited by the development of IDH. Severity of IDH did not correlate with UF rate in mL/kg/h. χ2 analysis showed pre-US clinical intravascular volume assessments had poor concordance with IVC CI categories.
Conclusion: IVC US may be a useful tool for predicting whether critically ill patients will achieve volume removal with HD.
Keywords: inferior vena cava ultrasound, intravascular volume, intradialytic hypotension, intermittent hemodialysis/ultrafiltration, critical illness, end-stage renal disease, chronic kidney disease, acute kidney injury
Introduction
Accurate assessment of relative intravascular volume is essential for appropriate management of hospitalized patients requiring hemodialysis (HD) for end-stage renal disease (ESRD) or acute kidney injury (AKI), who frequently have mismatch between blood pressure (BP) and intravascular volume, or between extravascular and intravascular volume.1 Findings from history and physical examination or from chest x-ray in relatively stable patients have low sensitivity and high specificity or vice versa for assessment of intravascular volume overload or depletion.2,3 “Static” parameters, including mean values for central venous pressure (CVP), right atrial pressure (RAP), and pulmonary artery occlusion pressure (PAOP) require invasive procedures, are frequently not available, and may have low sensitivity or specificity for predicting an increase in cardiac output in response to volume administration.1,4,5 “Dynamic” parameters, which take into account variation over the respiratory/ventilatory cycle, including arterial pressure wave form or inferior vena cava (IVC) diameter represented as collapsibility index (IVC CI), may more reliably predict an increase in cardiac output in response to volume administration than “static” parameters.1,5
Limited echocardiography, including measurement of IVC collapsibility with respiration/ventilation is a well-documented technique to facilitate the diagnosis of undifferentiated hypotension and guide volume administration.6 IVC collapsibility has been shown to reliably diagnose volume overload with congestive heart failure,7–11 to reflect response to volume removal in congestive heart failure12,13 or in stable ESRD patients during chronic HD therapy.14,15 The utility of IVC ultrasound (US) to assess relative intravascular volume and guide ultrafiltration (UF) in critically ill patients requiring HD has not been established.
We investigated whether respiratory/ventilatory variation in IVC diameter determined by US correlated with volume removal achieved during UF with intermittent HD in intensive care unit (ICU) patients with AKI, AKI with chronic kidney disease (CKD), or ESRD.
Materials and methods
Study design
This is an observational cohort study with retrospective data analysis. From a convenience sample of 267 ICU patients with AKI, AKI with CKD, or ESRD in 658 encounters who had IVC US performed between August 1, 2012, and May 16, 2014, we analyzed a subset of 113 patients in 244 encounters who had intermittent HD within 24 h after IVC US (Table 1).
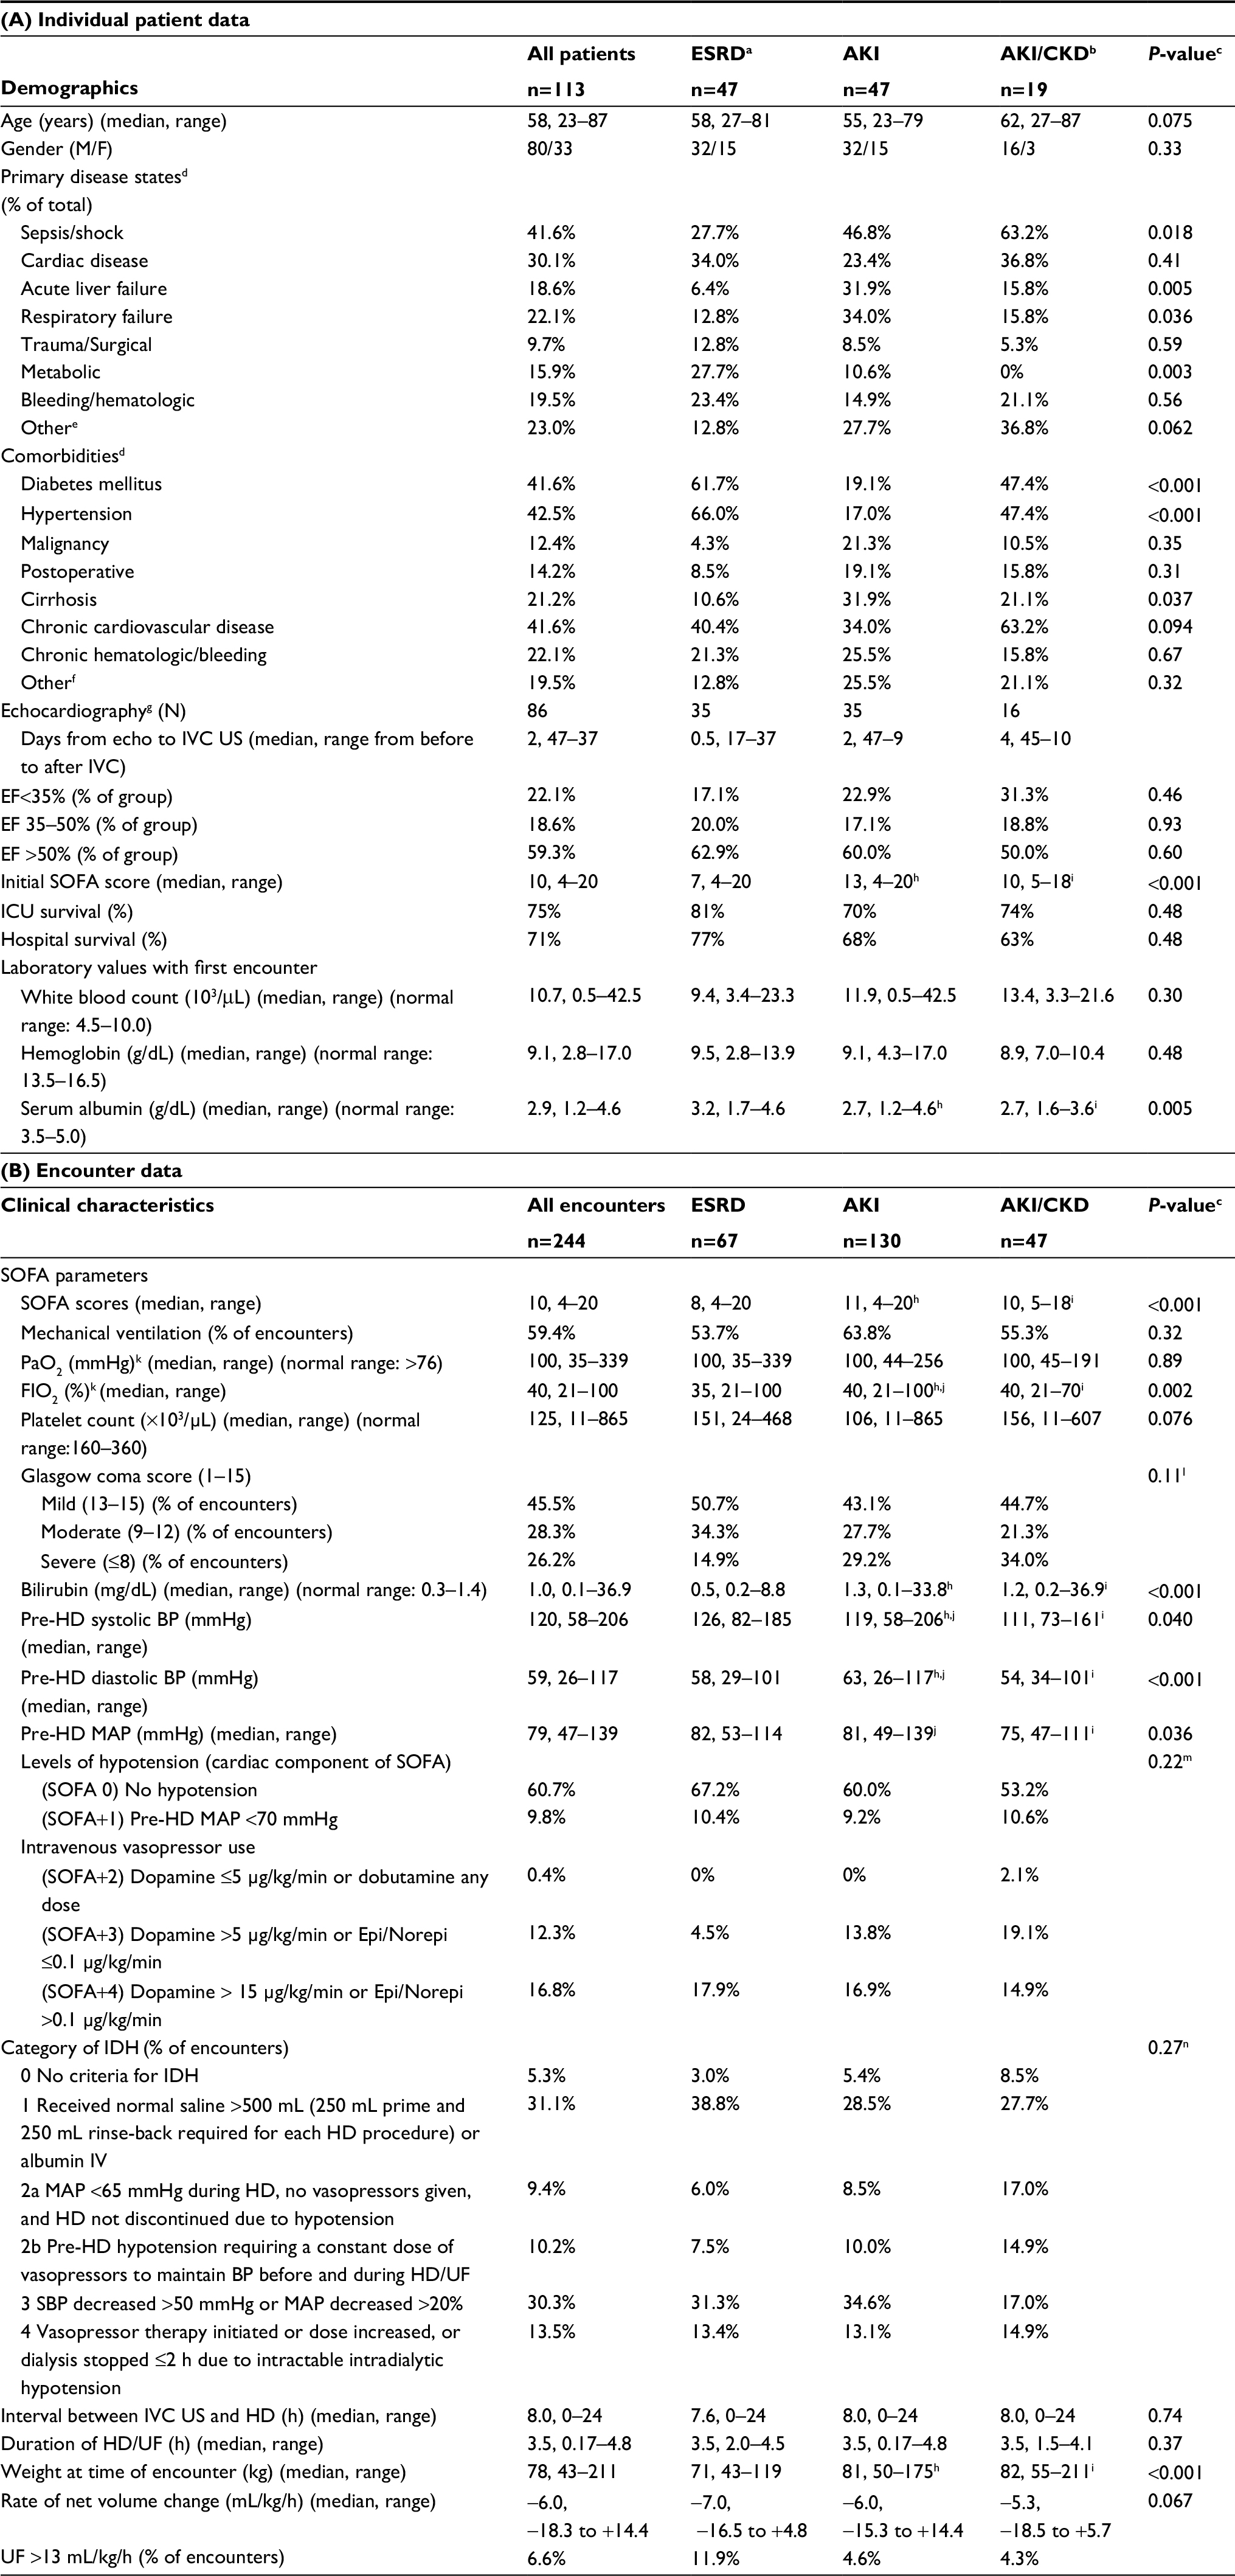 | Table 1 Individual hemodialysis patient and encounter characteristics Notes: aESRD group included patients previously receiving HD or initiated on HD with prior CKD5. bBaseline renal function frequently unknown. cP-value indicates comparison among ESRD, AKI, and AKI/CKD groups. dPrimary disease states and comorbidities at the time of the nephrology consult; many patients had more than one major illness. eOther primary disorders included: Volume overload (8.0%), burns (4.4%), autoimmune disorders (3.5%), acute pancreatitis (2.7%), pulmonary embolism (2.7%), and pulmonary hypertension (1.8%). fOther comorbidities included: Infection (6.2%), respiratory failure (5.3%), autoimmune disorders (4.4%), substance/polysubstance abuse (2.7%), and pulmonary hypertension (0.9%). gEchocardiography data from studies performed within 2 months of the patient encounter. hESRD is different from AKI. iESRD is different from AKI/CKD, jAKI is different from AKI/CKD. kIn patients who did not have an arterial blood gas available, PaO2 was estimated from digital pulse oxygen saturation (SPO2),26 and in those not mechanically ventilated, FIO2 was estimated from oxygen delivery by nasal cannula.27 lP-value examines distribution of Glasgow coma score mild, moderate, severe among ESRD, AKI, AKI/CKD groups (columns). Percentages indicate % encounters with a given SOFA component score within each group (column). mP-value examines distribution of cardiac SOFA scores among ESRD, AKI, AKI/CKD groups (columns). Percentages indicate % encounters with a given SOFA component score within each group (column).nP-value examines distribution of IDH categories among ESRD, AKI, AKI/CKD groups (columns). Percentages indicate % encounters with a given SOFA component score within each group (column). Abbreviations: AKI, acute kidney injury; CKD, chronic kidney disease; CVP, central venous pressure; EF, ejection fraction; ESRD, end-stage renal disease, HD, hemodialysis; ICU, intensive care unit; IDH, intradialytic hypotension; IVC, inferior vena cava; PAOP, mean pulmonary artery occlusion pressure; SOFA, Sequential Organ Failure Assessment; UF, ultrafiltration. |
Approval for this study was obtained from the University of Southern California Institutional Review Board. Procedures were followed in accordance with the ethical standards of the University of Southern California Institutional Review Board and with the Declaration of Helsinki of 1975, as revised in 2000. Written informed consent was not required for retrospective data collection and analysis since all US studies and treatment plans were performed for clinical purposes.
The pre-US intravascular volume assessment was performed by the senior author (EMK) with all available data, including that provided by the nephrology fellow, the house staff, and primary team, and this assessment was recorded prior to performing the IVC US. Clinical assessment of intravascular volume consisted of a detailed evaluation of the patient’s medical condition, including history and physical findings, laboratory and radiological data, as well as mean CVP and Swan–Ganz catheter data when available. Then, bedside IVC US was performed in real-time, during daily clinical rounds, without Valsalva or sniff maneuvers, since most patients were not able to perform these maneuvers.
Longitudinal images of the IVC were obtained from an anterior substernal approach performed or directly supervised by the senior investigator (EMK) with a 3.5-MHZ curvilinear probe on a portable US machine (LOGIQ e B12, GE Healthcare, Wauwatosa, WI, USA).1 All patients were imaged in the semi-recumbent position. Patients had substernal IVC diameters measured 1–2 cm from the junction with the right atrium or distal to the hepatic vein. A frame-by-frame image analysis was performed to identify maximum (IVCmax) and minimum (IVCmin) diameters with respiration/ventilation. IVC CI=(IVCmax–IVCmin)/IVCmax*100% was calculated for all encounters.1 When multiple measurements were taken for the same encounter, means were calculated.
IVC CI cutoff value for “hypovolemia” was assessed from a review of the literature. Data from 4 studies with 298 extractable points of RAP and IVC CI measurements,16–19 showed that an IVC CI of ≥47.3% was able to distinguish an RAP <5 mmHg (n=75) from an RAP ≥ 5 mmHg (n=223) with a sensitivity of 80% and specificity of 79% (Figure S1). Review articles indicated that an IVCmax ≥2.1 cm with an IVC CI <20% without a sniff suggests elevated RAP, which is consistent with hypervolemia,20 while an IVCmax <2.1 cm and IVC CI >50% correlates with a RAP of 0–5 mmHg21 indicating that hypervolemia is unlikely. Thus, a cutoff value of >50% without a sniff or Valsalva was utilized to indicate probable “hypovolemia” and a cutoff value <20% was used to indicate probable “hypervolemia.”
Volume management decisions were made in a clinical context, not according to a research protocol, based on all available data, including IVC US findings. We generally aimed to optimize intravascular volume in the absence of overriding considerations or clinical goals.1 Recommendations for volume removal with UF or volume administration were documented at the time the patient was evaluated during daily team rounds. For patients who had IVC CI >50% or were considered to be volume responsive,5 a bolus of normal saline followed by clinical assessment was recommended to be given at the beginning of HD.
The severity of intradialytic hypotension (IDH), which may have limited the volume of net UF removed, was assessed. Symptoms like cramping were not taken into consideration since the majority of our patients were sedated, intubated, or had altered mental status.22 All patients received 250 mL of normal saline at the start of HD to prime the lines and dialyzer, and 250 mL of normal saline was given to return the blood and rinse the lines and dialyzer at the completion of HD. The highest category of IDH was recorded for each encounter.
Modifications of prior definitions of IDH in AKI22,23 used to grade the increasing severity of IDH in our ICU patients were as follows: 0, no criteria for IDH; 1, received normal saline >500 mL (250 mL prime and 250 mL rinse-back required for each HD procedure) or albumin IV to treat hypotension; 2a, mean arterial pressure (MAP) <65 mmHg during HD, no vasopressors given, and HD not discontinued due to hypotension; 2b, pre-HD hypotension requiring a constant dose of vasopressors to maintain BP before and during HD/UF; 3, systolic blood pressure (SBP) decreased >50 mmHg or MAP decreased >20%; 4, vasopressor therapy initiated or dose increased, or dialysis stopped ≤2 h due to intractable hypotension.
The net UF volume recommended was compared with the net UF volume achieved for the ESRD, AKI, and AKI with CKD groups and was stratified by the degree of IDH. The rate of net UF achieved for the entire group was compared with the severity of IDH.
Sequential Organ Failure Assessment (SOFA) scores were calculated for all HD encounters25 (Table 1). In patients who did not have an arterial blood gas available, PaO2 was estimated from digital pulse oxygen saturation,26 and in those not mechanically ventilated, FIO2 was estimated from oxygen delivery by nasal cannula.27 BP values were determined immediately before HD and every 15 minutes during HD using an arterial line, when available, or a BP cuff. White blood cell count, hemoglobin, and albumin data were retrieved from the time of the initial encounter. Transthoracic echocardiography data from within 2 months of the encounter were evaluated when available.
Data analysis
Differences among ESRD, AKI, and AKI with CKD groups were assessed using log likelihood ratio tests for comparing numbers of occurrences among groups, and non-parametric Kruskal–Wallis analysis of variance (ANOVA) followed by Newman-Keuls multiple pairwise tests were used to compare continuous variables (Table 1). Statistical calculations were performed using Epistat version 5.3 (Epistat Services, Richardson, TX, USA).
Outcomes were arbitrarily defined as whether or not net UF volumes of ≥0.5 L, ≥1.0 L, ≥1.5 L, ≥2.0 L, ≥2.5 L, ≥3.0 L, or ≥3.5 L were achieved during intermittent HD. Potential predictors of outcomes included IVC CI, IVCmax, IVCmin, mean CVP, mean PAOP, and cardiac output.
To evaluate whether the proportions of patient encounters in which a given amount of UF achieved correlate with IVC CIs across their entire range, we subdivided encounters into ranges of IVC CI with roughly equal numbers in each category, defined those with IVCmax ≤0.70 cm as having 100% collapsibility, and used linear regression to correlate the n-weighted proportions against the midpoints of the IVC CI intervals (Figure 1A).
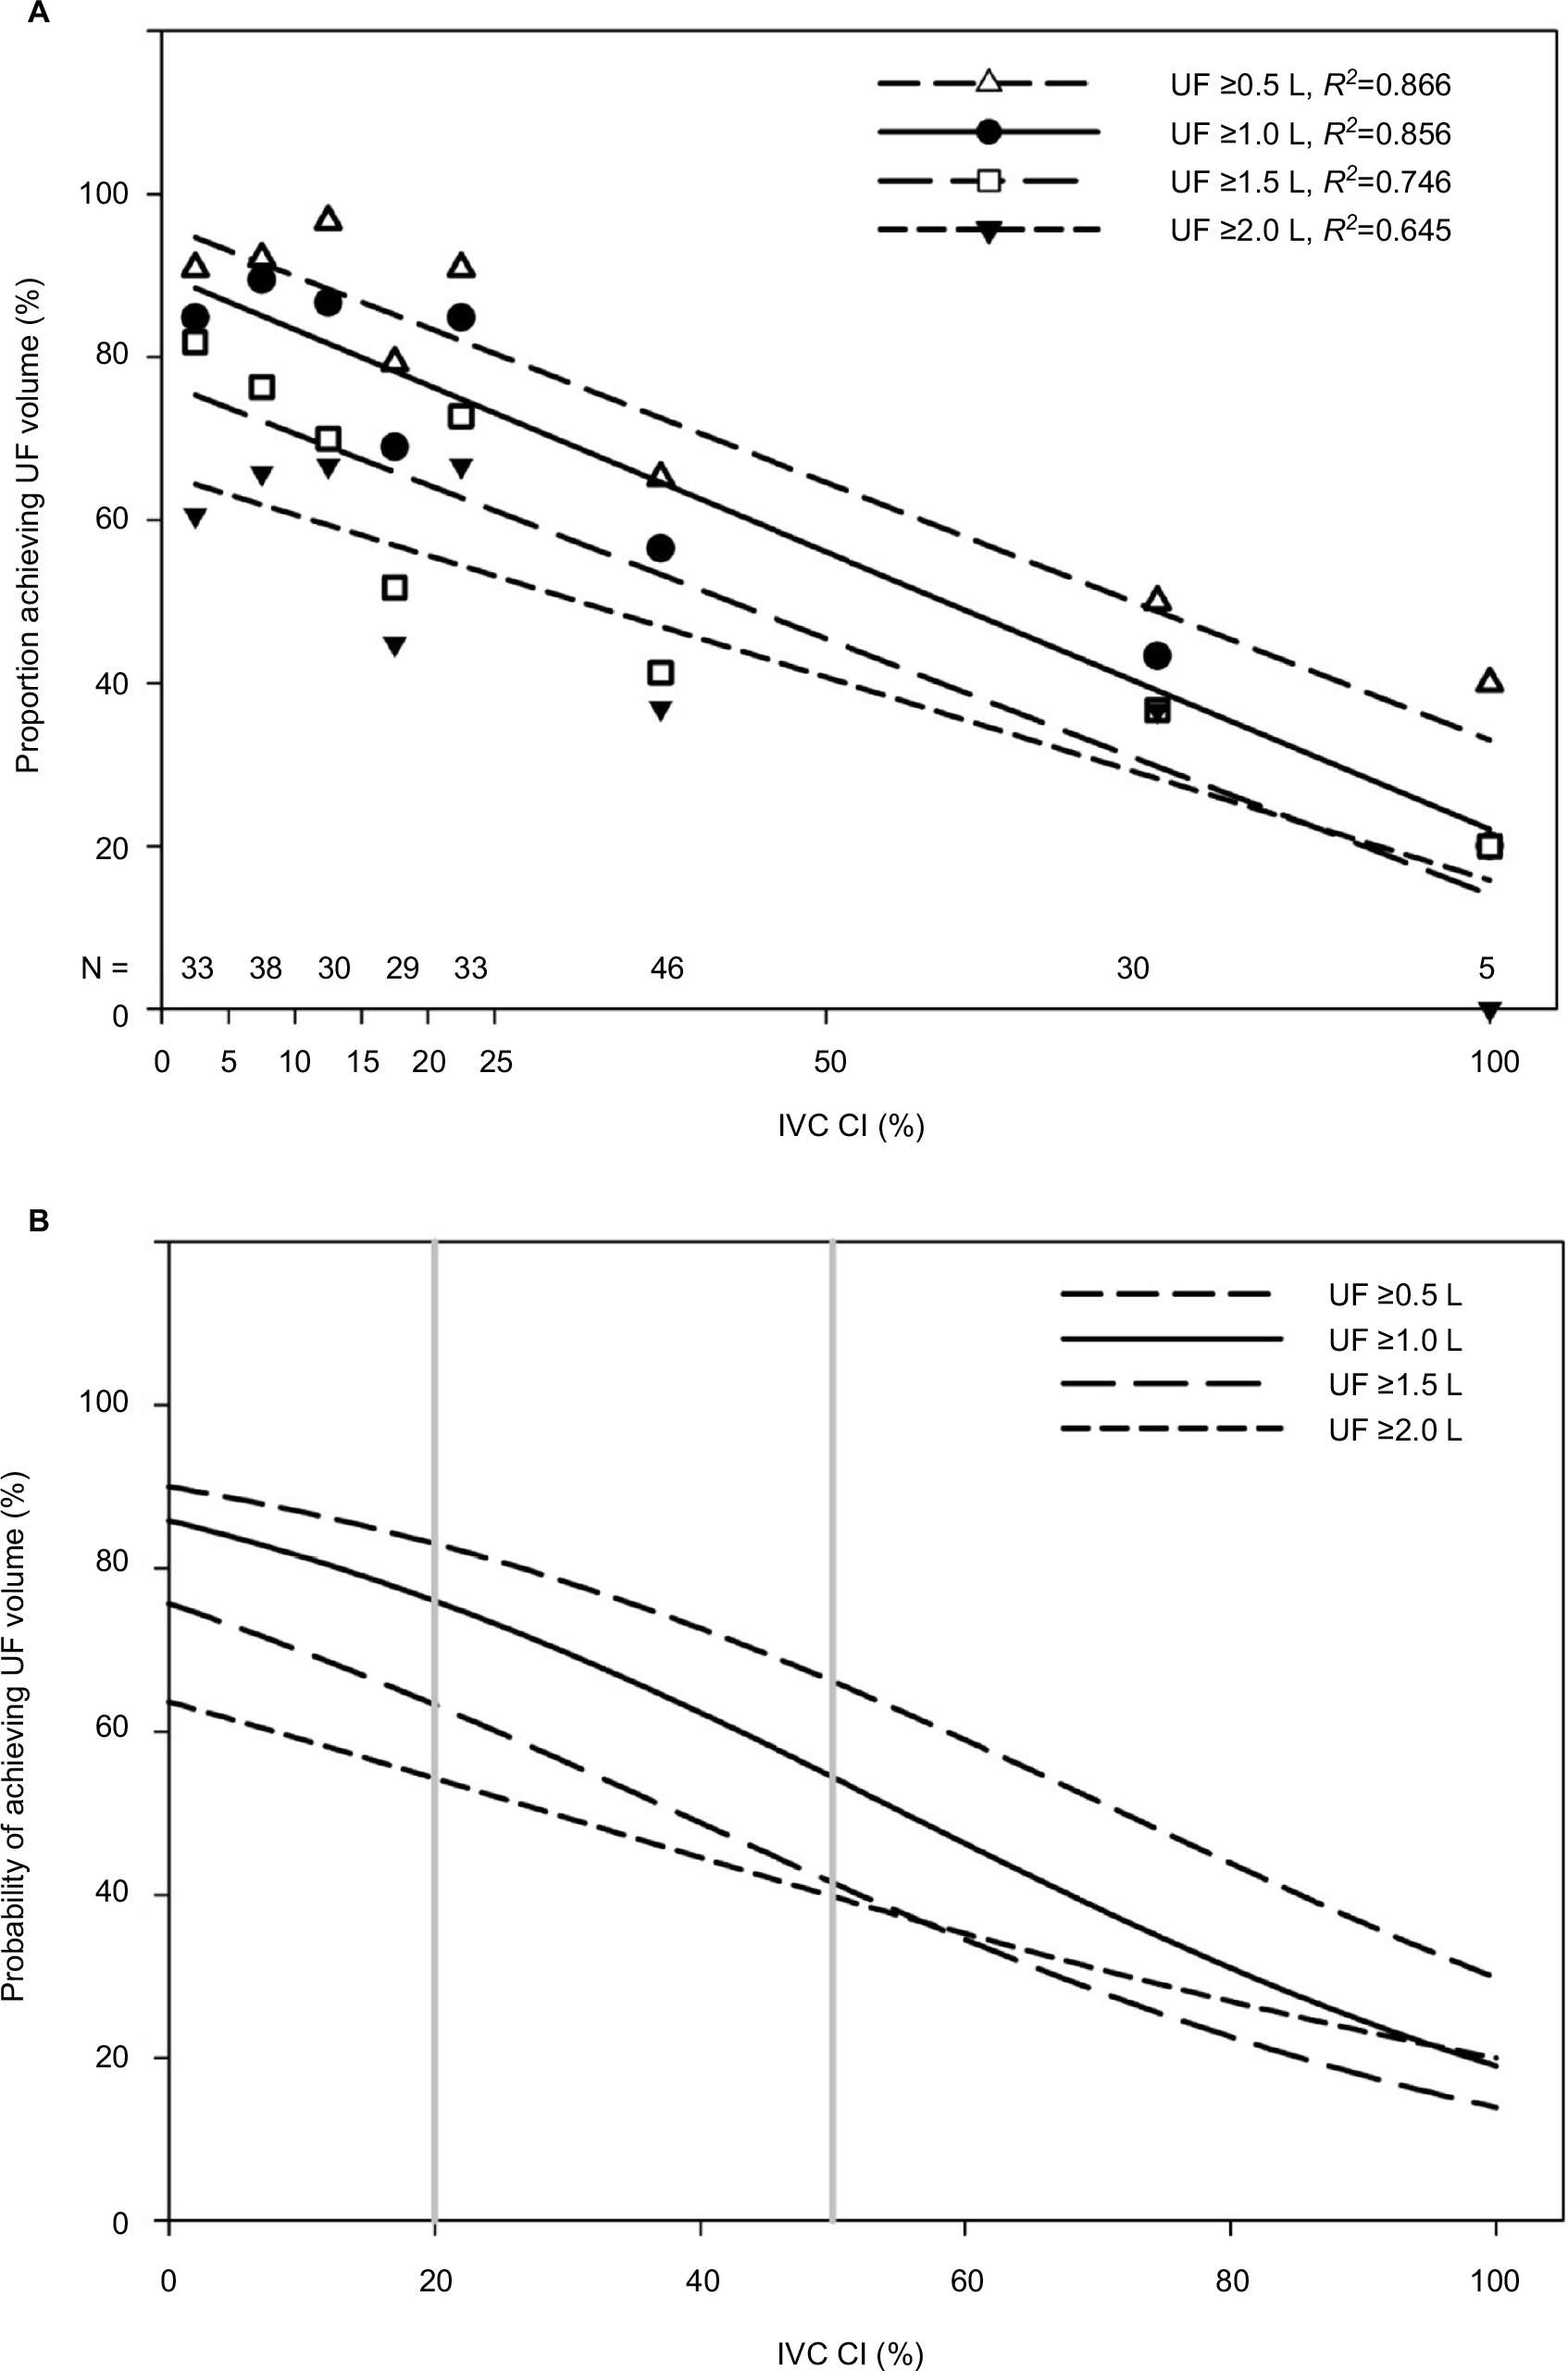 | Figure 1 (A) The proportion of patients who achieved a given net UF volume is strongly correlated with IVC CI, when n-weighted proportions are plotted against the mid-point of each IVC CI interval. IVCmax ≤0.7cm was considered “totally collapsed” and IVC CI was plotted as 100%. (B) The probability of whether a given net UF volume was achieved based on IVC CI as determined using logistic regression analysis. The vertical lines represent IVC CI cutoff values at 20% and 50%. Abbreviations: CI, collapsibility index; IVC, inferior vena cava; UF, ultrafiltration. |
Logistic regression analysis (EPISTAT Services) was used to test whether parameters, including IVCmax, IVCmin, IVC CI, mean CVP, PAOP, and cardiac output predicted the dichotomous outcome of achieving or not achieving removal of ≥0.5 L, ≥1.0 L, ≥1.5 L, or ≥2.0 L of net UF (Table 2). The IVC CI relationships were then used to calculate the probabilities of achieving the respective net UF volumes for all values of IVC CI (Figure 1B).
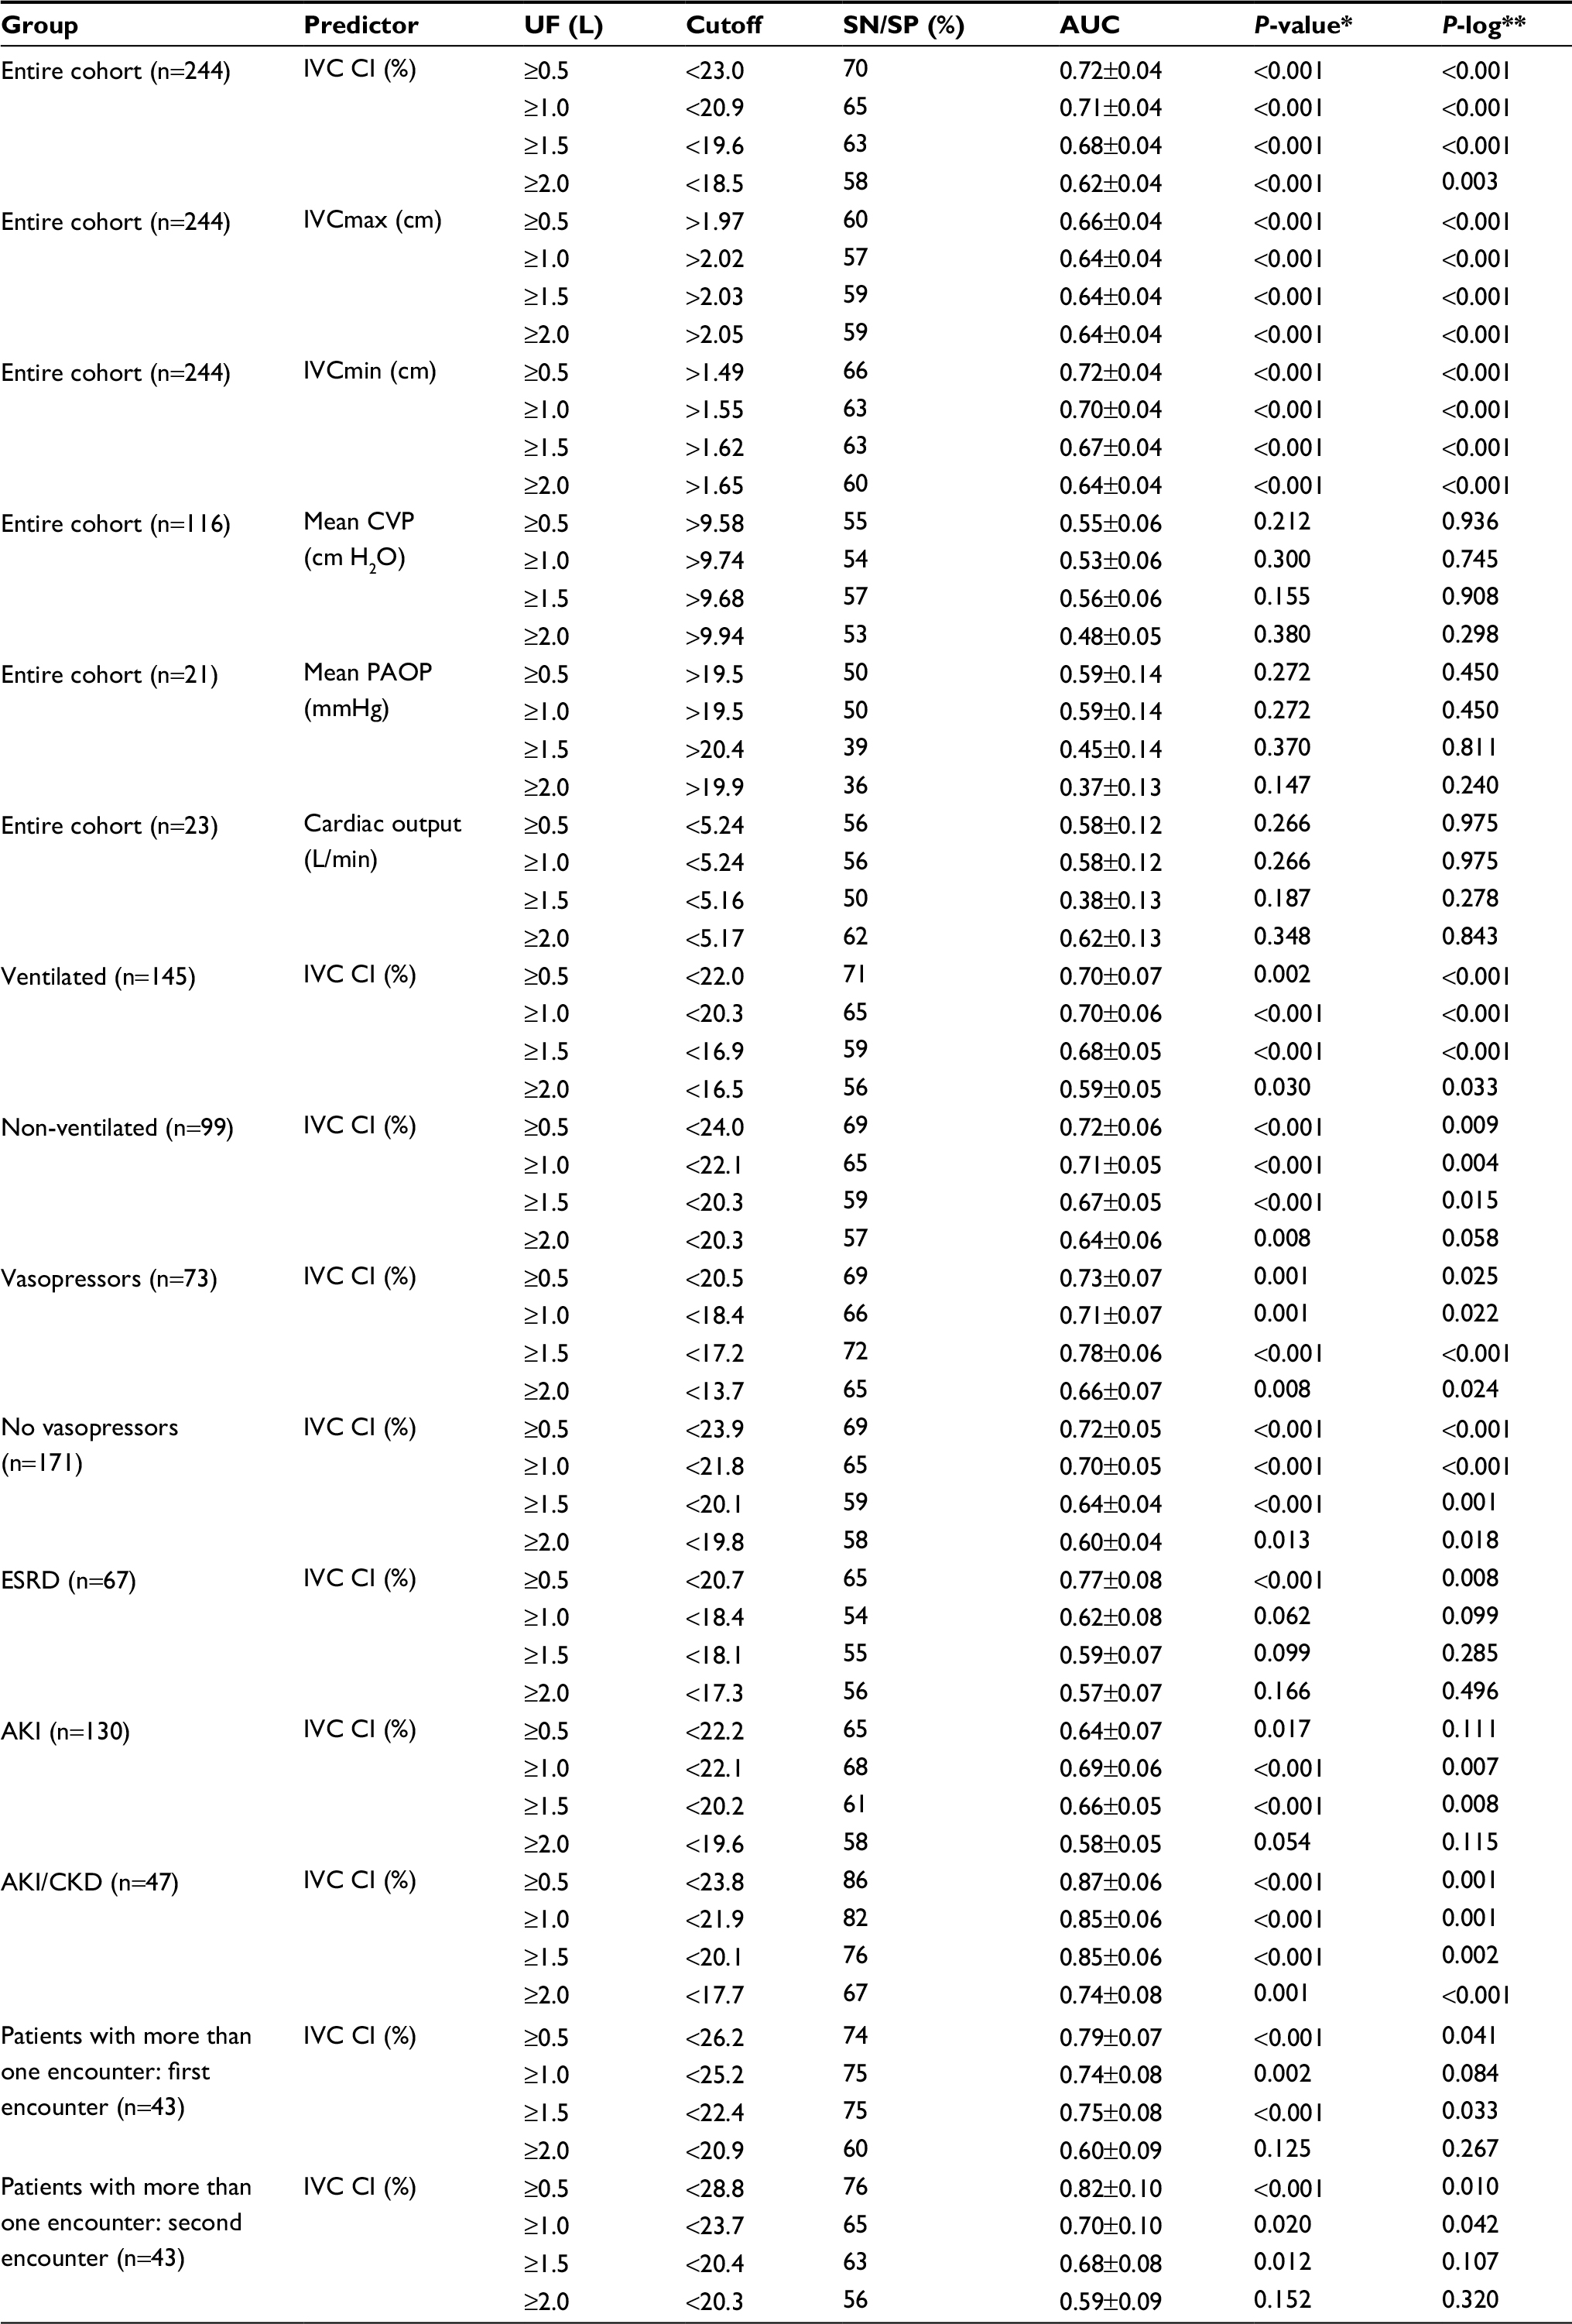 | Table 2 Sensitivity/specificity and logistic regression analyses Notes: The cutoff was chosen at the point where sensitivity equals specificity. *P-value <0.05 indicates that the area under the ROC is significantly >0.5 and that there is a relationship between the variable and whether a specific UF volume was removed or not. **P-value <0.05 indicates that the variable is a significant predictor by logistic regression of whether a specific UF volume was removed or not. Abbreviations: AKI, acute kidney injury; AUC, area under the ROC curve; CI, collapsibility index; CKD, chronic kidney disease; CVP, central venous pressure; ESRD, end-stage renal disease; IVC, inferior vena cava; n, number of encounters; PAOP, mean pulmonary artery occlusion pressure; ROC, receiver operating characteristic; SN, sensitivity; SP, specificity; UF, ultrafiltration. |
Receiver operating characteristic (ROC) curve analysis was used to calculate the area under the ROC curve, (AUC) ± SE (standard error), and determine the cutoff values that maximize sensitivity and specificity for IVC CI, IVCmax, and IVCmin, as well as for available CVP, PAOP, and cardiac output measurements (Table 2). Subgroups included ventilated versus non-ventilated, vasopressors versus no vasopressors, and ESRD versus AKI versus AKI with CKD. Since multiple IVC US measurements may have been done on the same patient during different encounters, IVC CI cutoff values may not be independent. Therefore, we calculated IVC CI cutoff values for the first and second encounters separately for patients who had multiple encounters (Table 2).
χ2 analysis was performed to assess whether there was a relationship between pre-US clinical assessment of relative intravascular volume and IVC CI. Clinical assessments classified as “hypovolemia,” “euvolemia,” or “hypervolemia,” were compared with IVC CI values, grouped as <20%, ≥20% to ≤50%, and >50%, respectively, for both initial and subsequent patient encounters (Table 3). The hypervolemia IVC CI cutoff value for our patients of <20% was derived from the data summarized in Table 2. The hypovolemia IVC CI cutoff value of >50% was taken from prior literature as described previously.
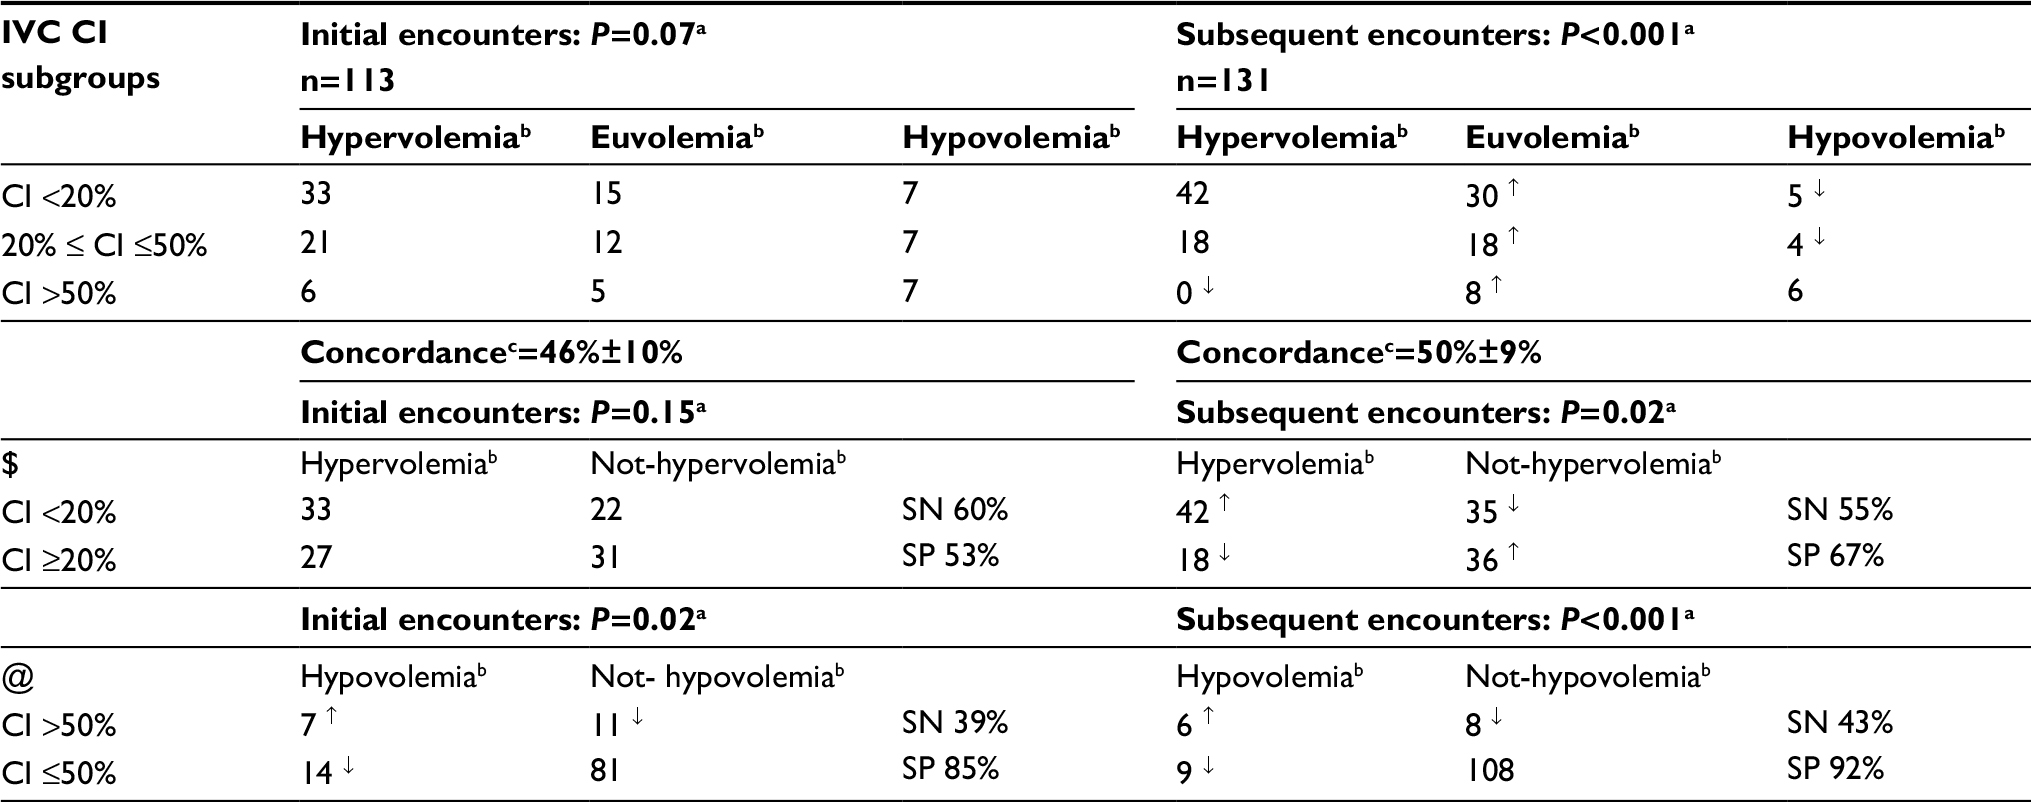 | Table 3 χ2 analyses comparing pre-ultrasound clinical intravascular volume assessments to IVC collapsibility index groups for initial and subsequent encounters Notes: aP-value indicates the probability of whether the distributions are random. bHypervolemia, euvolemia and hypovolemia are clinical assessments. The category not-hypovolemia groups patients in the categories of euvolemia and hypervolemia. ↑Frequency of occurrence is higher than would be expected due to chance. ↓Frequency of occurrence is lower than would be expected due to chance. cProportion of outcomes for which there is agreement ± 95% confidence interval. Concordance is defined as percentage of encounters in which clinical assessment of hypervolemia agrees with IVC CI <20%, euvolemia agrees with IVC CI ≥20% to ≤50%, and hypovolemia agrees with IVC CI >50%. $ Test is whether clinical assessment of hypervolemia is a predictor of CI <20%; SN and SP for this are indicated. @ Test is whether clinical assessment of hypovolemia is a predictor of CI >50%; SN and SP for this are indicated. Abbreviations: CI, collapsibility index; IVC, inferior vena cava; SN, sensitivity; SP, specificity. |
Results
Table 1A summarizes the characteristics of the 113 patients in 244 encounters in which IVC US studies were performed within 24 h preceding HD/UF. Ninety percent of our patient population had primarily medical conditions. The frequency of some primary disease states, some comorbidities, and initial SOFA scores differed among ESRD, AKI, and AKI with CKD groups. For encounter data (Table 1B), SOFA scores as well as some components of the SOFA scores differed among the 3 groups. The frequency of IDH categories and the rate of volume change during HD did not differ among the 3 groups.
For the entire cohort, 50 encounters achieved net UF volume <0.5 L, 18 had 0.5 to <1.0 L, 29 achieved 1.0 to <1.5 L, 19 achieved 1.5 to <2.0 L, 58 achieved 2.0 to <2.5 L, 21 achieved 2.5 to <3.0 L, 37 achieved 3.0 to <3.5 L, and 12 achieved ≥3.5 L. Encounters with ≥1.0 L net UF achieved had significantly lower mean IVC CI values than those achieving <0.5 L net UF (p<0.05 by Scheffe’s multiple comparisons after ANOVA).
As shown in Figure 1A, the n-weighted proportions of encounters for the entire cohort in which net UF ≥0.5 L, ≥1.0 L, ≥1.5 L, or ≥2.0 L was achieved, strongly correlated with the midpoints for each IVC CI interval (R2=0.87 to 0.64, respectively). Correlations were statistically significant but weaker for net UF ≥2.5 L (R2=0.18) and ≥3.0 L (R2=0.03), and not significant for ≥3.5 L (R2=0.006). The highest proportion achieving a given net UF volume occurs in encounters in which IVC CI is lowest, and the lowest proportion achieving a given net UF volume occurs in encounters in which IVC CI is highest. The probability curves for achieving specific net UF volumes, calculated using logistic regression for the entire cohort (Figure 1B), strongly resemble the proportion of encounters in which a given net UF volume was achieved (Figure 1A).
As shown in Table 2, for the entire cohort, IVC CI, IVCmax, and IVCmin were significant predictors by logistic regression of whether net UF volumes of ≥0.5 L, ≥1.0 L, ≥1.5 L, or ≥2.0 L were achieved. Using IVCmax and IVCmin or IVCmax and IVC CI simultaneously, as independent predictor variables using logistic regression did not improve prediction of whether given net UF volumes were achieved (data not shown). For all encounters, sensitivity/specificity analysis and AUCs indicate that IVC CI, IVCmax, and IVCmin were significant predictors of whether UF volumes from ≥0.5 L to ≥2.0 L were achieved. IVC CI had higher sensitivities and specificities than IVCmax for predicting UF volumes achieved. Mean CVP (n=116), PAOP (n=21), and cardiac output (n=23) were not significant predictors by logistic regression or ROC analysis of whether these net UF volumes were achieved.
The IVC CI cutoff value that optimizes sensitivity and specificity for predicting the achievement of given net UF volumes varying from ≥0.5 L to ≥2.0 L decreased from <23% to <18.5%, with sensitivities and specificities decreasing from 70% to 58%. IVCmax cutoff values increased from >1.97 to >2.05 cm, with sensitivities and specificities decreasing from 60% to 59%. In ventilated patients, optimal IVC CI cutoff values for predicting achievement of UF ≥0.5 L to ≥2.0 L decreased from <22% to <16.5%, and from <24% to <20% in non-ventilated patients. In patients receiving vasopressors, optimal IVC CI cutoff values for predicting achievement of UF ≥0.5 L to ≥2.0 L decreased from <20.5% to <14%, and from <24% to <20% in those not receiving vasopressors. IVC CI cutoffs were only significant for net UF volumes ≥0.5 L for the ESRD encounters, for net UF volumes ≥0.5 L to ≥1.5 L for the AKI encounters, and for net UF volumes ≥0.5 L to ≥2.0 L for the AKI with CKD encounters. Sensitivity and specificity values were higher for AKI with CKD encounters than for AKI or ESRD encounters. For the 43 patients with multiple encounters, cutoff values for IVC CI, sensitivity and specificity, and AUC for a given net UF volume were similar for the first and second encounters (Table 2).
Figure 2A shows that the net volume change achieved correlated significantly with the net volume change recommended for all encounters (R2=0.43) and was similar for ESRD (R2=0.30), AKI (R2=0.47), and AKI with CKD (R2=0.44) subgroups. Net volume change achieved tended to be less than net volume change recommended.
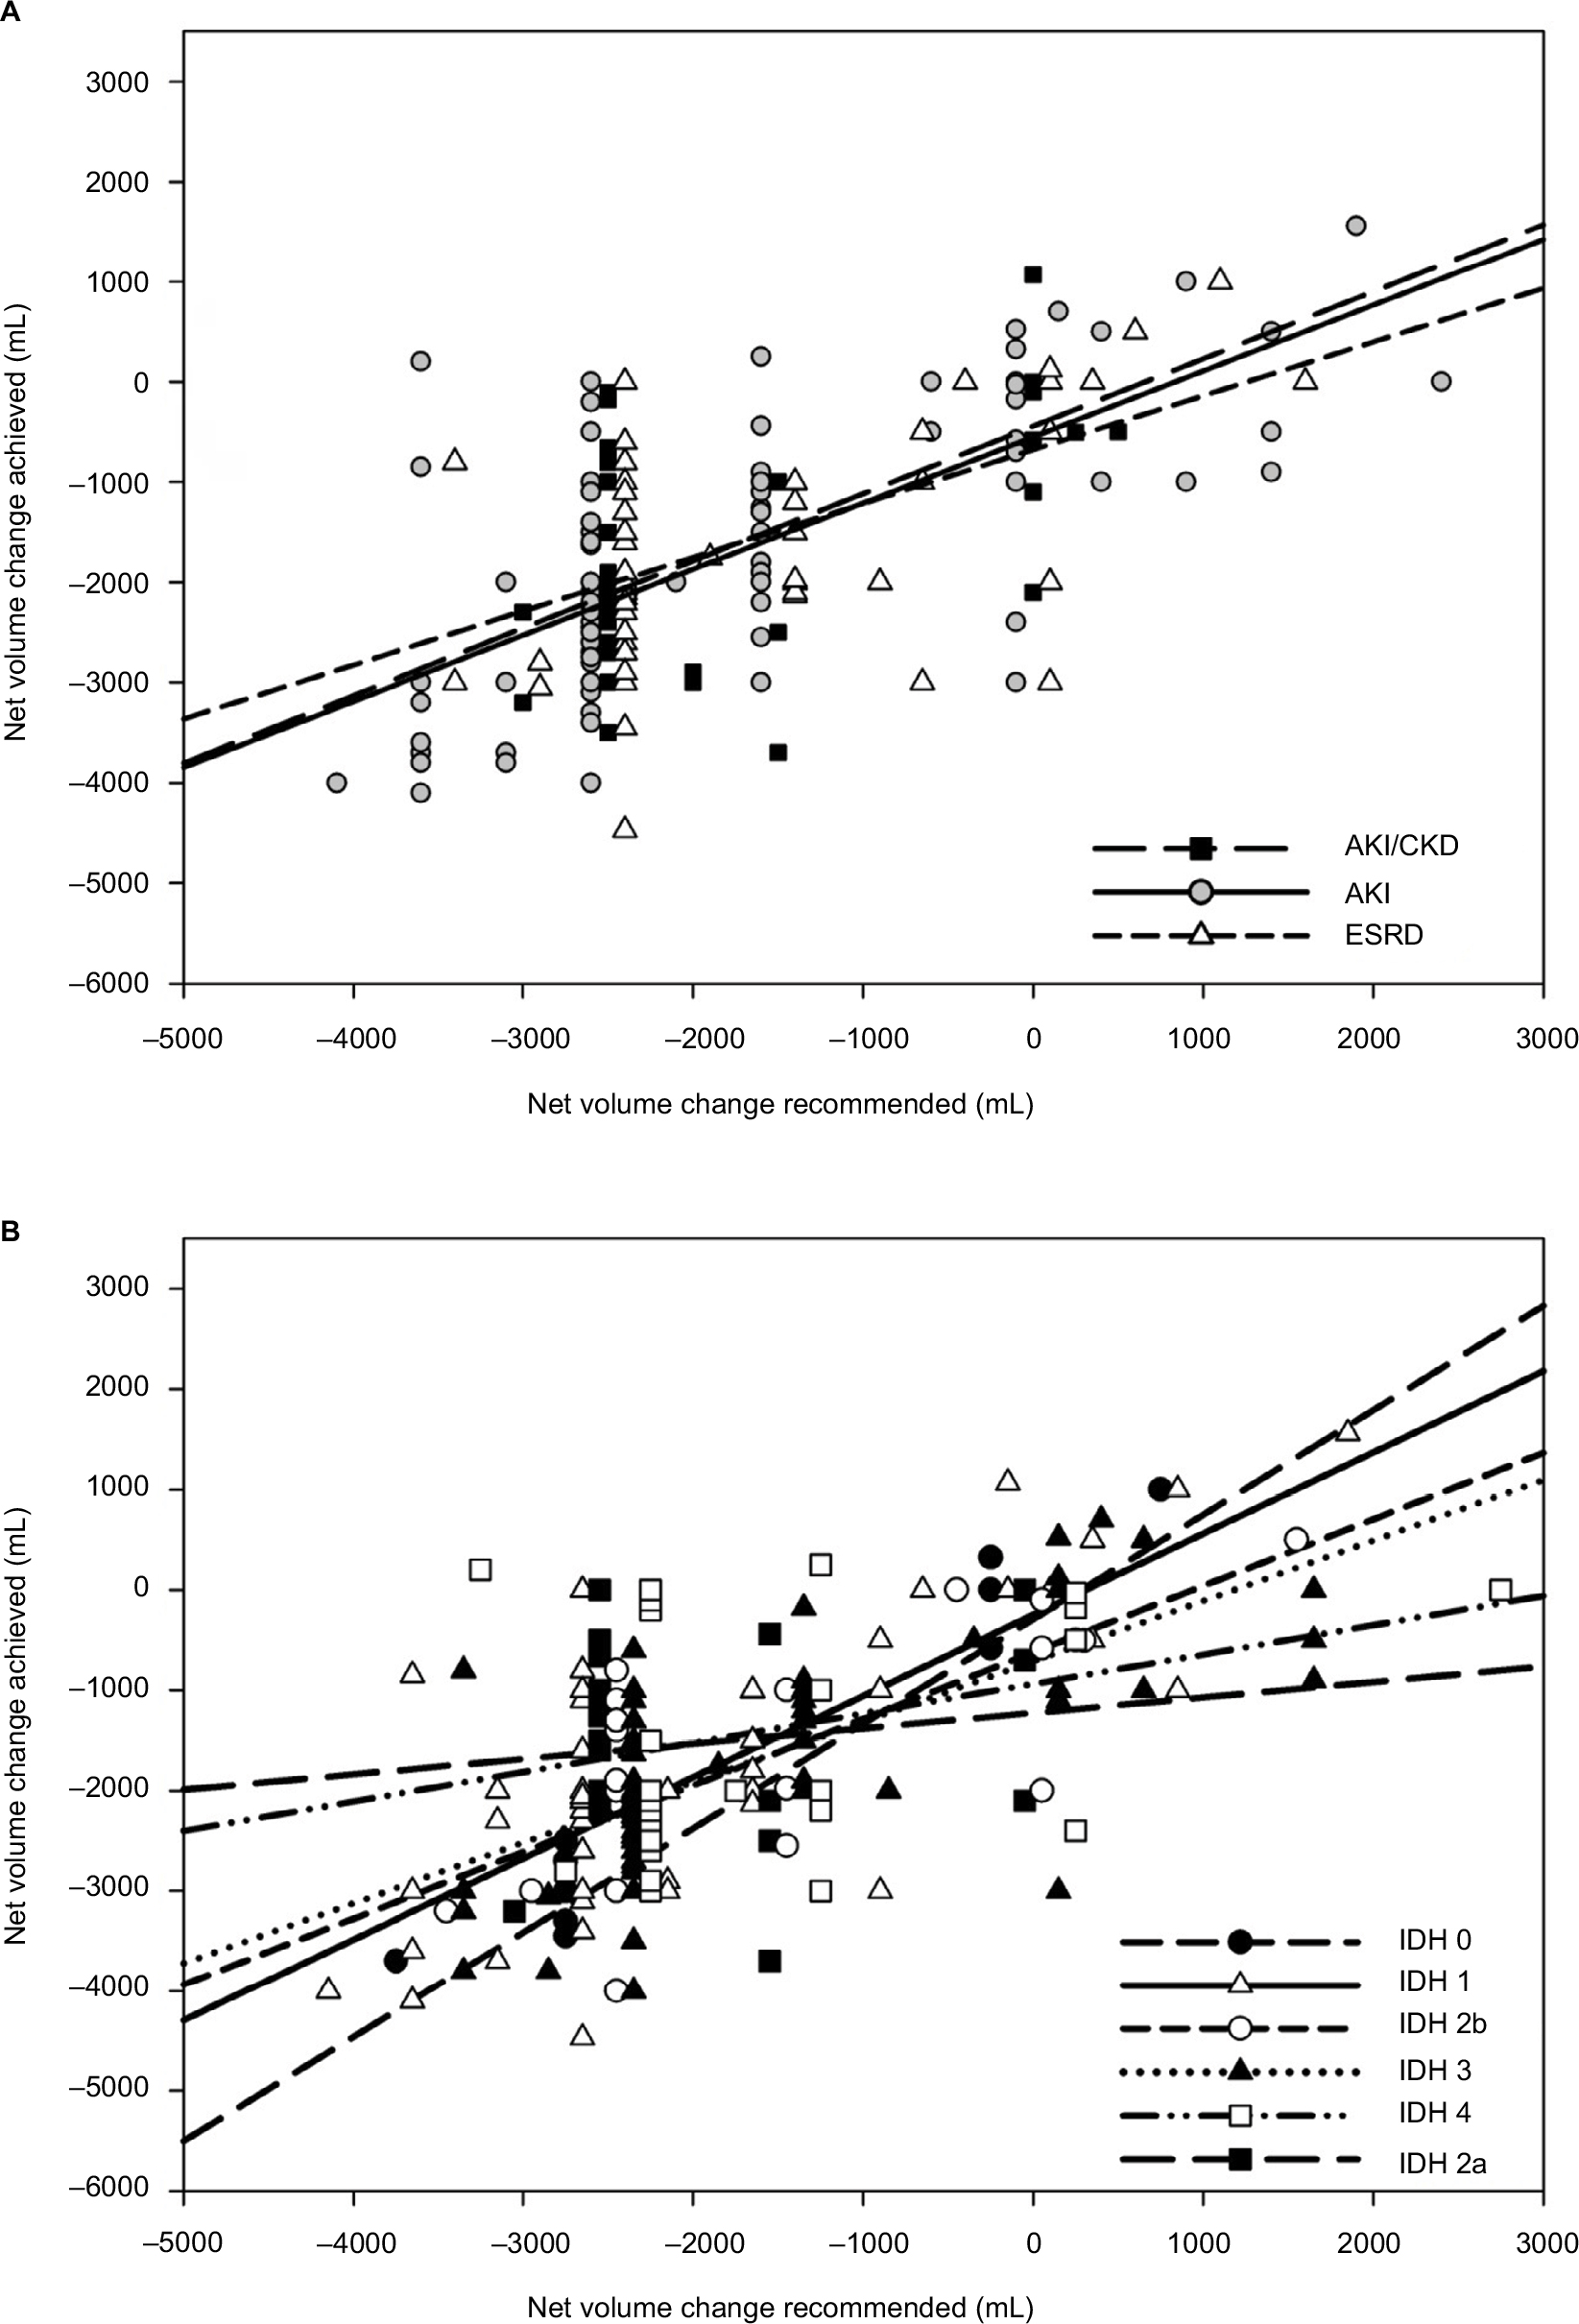 | Figure 2 (A) Relationship of net volume change achieved to net volume change recommended in ESRD, AKI, and AKI with CKD encounters. (B) Relationship of net volume change achieved to net volume change recommended for encounters with different categories of IDH. Notes: The net volume change achieved is progressively less than recommended as IDH severity increases, with the exception of category 2a. Definitions of IDH categories: IDH 0: No criteria for IDH; IDH 1: Received normal saline >500 mL or albumin IV to treat hypotension; IDH 2a: MAP <65 mmHg during HD, no vasopressors given, and HD not discontinued due to hypotension; IDH 2b: Pre-HD hypotension requiring a constant dose of vasopressors to maintain BP before and during HD/UF; IDH 3: SBP decreased >50 mmHg or MAP decreased >20%; IDH 4: Vasopressor therapy initiated or dose increased, or dialysis stopped ≤2 h due to intractable hypotension. For net volume recommended, data points are plotted at the mid-point of the recommended range with slight offsets; regression lines are not offset. Negative values denote net volume removed. Abbreviations: AKI, acute kidney injury; CKD, chronic kidney disease; ESRD, end-stage renal disease; HD, hemodialysis; IDH, intradialytic hypotension; MAP, mean arterial pressure; SBP, systolic blood pressure; UF, ultrafiltration. |
Figure 2B shows that the relationship between net volume change achieved and net volume change recommended for all encounters was significantly different for different categories of IDH. Significant correlations were seen for IDH 0 (R2=0.95, n=13), IDH 1 (R2=0.61, n=76), IDH 2b (R2=0.57, n=24), and IDH 3 (R2=0.46, n=74), but were not significant for IDH 4 (R2=0.093, n=33) and IDH 2a (R2=0.007, n=24). All slopes were significantly different from zero except for categories IDH 2a and IDH 4. The slopes decreased progressively as the severity of IDH category increased, with the exception of IDH category 2a.
Net UF rate >13 mL/kg/h occurred in 16 of 244 encounters. The rate of net volume change achieved did not relate to the categories of severity of IDH (Figure 3), and did not differ between ESRD, AKI, and AKI with CKD subgroups (Table 1).
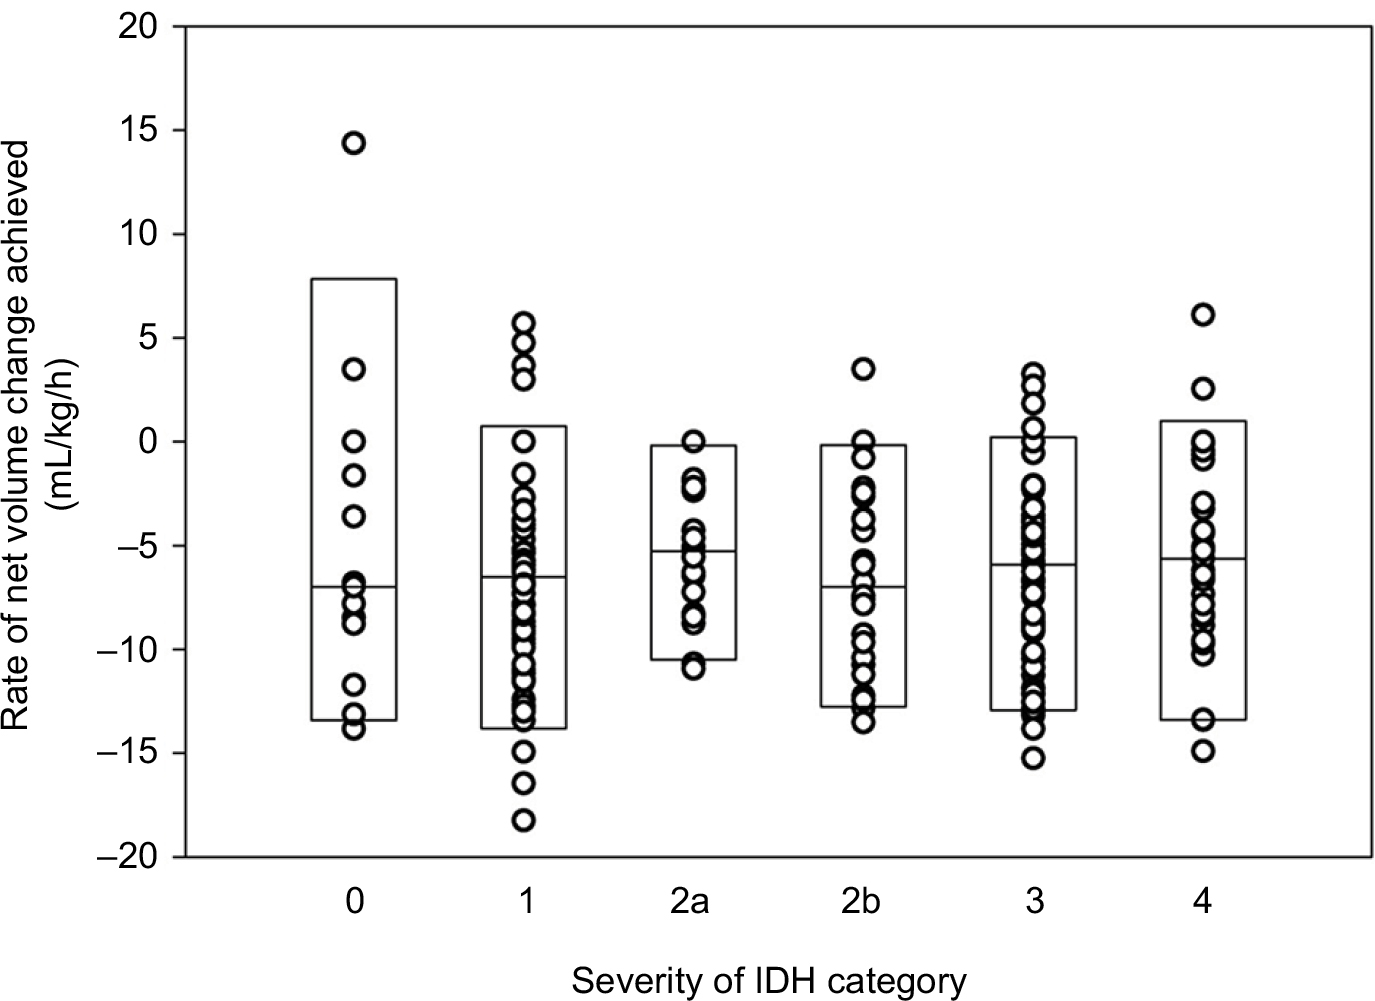 | Figure 3 The relationship of rate of net volume change achieved is plotted for all encounters by categories of severity of intradialytic hypotension. Notes: Negative values denote net volume removed. Boxes indicate medians, 5th and 95th percentile values. There is no relationship between the rate of net volume change and the category of IDH. Definitions of IDH categories are as in Figure 2B. Abbreviation: IDH, intradialytic hypotension. |
The results of χ2 analysis to compare clinical intravascular volume assessments performed prior to IVC US examination to IVC CI measurements, for initial and subsequent encounters, are shown in Table 3. For initial encounters, the proportion whose clinical assessment was consistent with IVC CI category was 46%±10% (95% confidence interval), which was not significantly better than random (37%±10% based on the observed distribution of clinical assessments and IVC CI categories for the initial encounters). For subsequent encounters, this was 50%±9%, which was not significantly better than random (39%±10% based on the observed distribution of clinical assessments and IVC CI categories for the subsequent encounters), and did not represent a statistically significant improvement compared with clinical assessments of initial encounters. Clinical assessment of hypervolemia was poor at predicting IVC CI <20% (sensitivity=60% for initial and 55% for subsequent encounters), and clinical assessment of hypovolemia was poor at predicting IVC CI >50% (sensitivity=39% for initial and 43% for subsequent encounters).
Discussion
This study shows that there is a strong inverse relationship between IVC CI and the proportion of encounters achieving a given net UF volume during HD, in a diverse cohort of ICU patients (Figure 1). The probability curves derived from logistic regression analysis (Figure 1B) closely resemble the findings by linear regression (Figure 1A), reinforcing the relationship between the respiratory/ventilatory collapsibility of the IVC and the proportion achieving a given net UF volume. These findings suggest that patients with low IVC CI most likely have relative intravascular volume overload and have a higher likelihood of achieving given amounts of net UF with HD, while patients with high IVC CI may be less likely to have intravascular volume overload and have a lower likelihood of achieving given net UF volumes.
The IVC cutoff values previously reported for IVCmax (>2.1 cm) and IVC CI (<20%) without a sniff, which are consistent with elevated RAPs,20 are similar to the cutoff values in our study (Table 2). Although cutoff values for IVC CI at different volumes of UF do show a trend, the differences are small and likely within the clinical variation of the measurement.1 Rather low sensitivities and specificities are not surprising in a heterogeneous population with varying severity of illnesses, including critically ill patients with multiple comorbidities, as well as with spontaneous breathing or mechanical ventilation.28
In our population, IVC CI has higher sensitivity and specificity for UF volumes achieved than IVCmax. IVC CI is a dynamic parameter, which takes into account variation of IVC diameter over the respiratory/ventilatory cycle, while IVCmax and IVCmin measurements individually are static parameters.1 Previous reports indicate that the IVCmax and IVCmin may be underestimated due to the cylinder tangent effect, if the US beam travels through the vessel longitudinally in an off-centered plane.29 Calculating IVC CI may help to reduce this systematic error as well as that associated with slight variations in angle of sampling, by the process of normalization.30
Our study shows IVC CI may be a valuable clinical tool for identifying when ICU patients have intravascular volume overload and may indicate patients most likely to achieve volume removal with HD/UF, as in patients with congestive heart failure.7,13 Mean CVP, PAOP, and cardiac output were poor predictors of whether a given UF volume was achieved (Table 2), which is consistent with prior findings.1,5
Since 95% of all encounters developed some degree of IDH, net UF volumes achieved may have been limited by the development of IDH (Figure 2A). The relationship between net volume change achieved and recommended for all encounters differed by IDH categories (Figure 2B). The smallest difference between volume removal achieved and recommended (steepest slope) was in the group with no criteria for IDH (IDH 0), progressively followed by the group who received volume support (IDH 1), the group with pre-HD hypotension requiring a constant dose of vasopressor(s) to maintain BP before and during HD/UF (IDH 2b), those whose SBP decreased >50 mmHg or MAP decreased >20% (IDH 3), those requiring initiation of vasopressor therapy, an increased dose of vasopressors or discontinuation of dialysis due to intractable IDH (IDH 4), and those developing MAP <65 mmHg who received no vasopressor therapy and in whom HD was not discontinued due to hypotension (IDH 2a). These findings are consistent with increasing severity of IDH relating to decreasing ability to achieve the volume management prescribed. Net volume removal may not have been achieved in IDH 2a or IDH 4 because the patients could not tolerate the volume removal recommended. The severity of IDH was not related to the rate of net volume change (Figure 3), contrary to previous reports.24
Clinical intravascular volume assessments showed poor concordance with IVC collapsibility categories in our ICU patients (Table 3). In other groups of patients, most clinical findings have been well documented to have low sensitivity and high specificity or vice versa to indicate relative intravascular volume depletion or overload.2,3 In hospitalized patients who are frequently not in steady state, inability to accurately assess relative intravascular volume from clinical findings may also be attributable to frequent mismatches between BP and intravascular volume or between intravascular and extravascular volume.1 Our findings suggest that the information obtainable by bedside IVC US may not be readily gleaned from or reproduced by other available clinical data. Knowledge of IVC CI from prior encounters did not statistically improve subsequent clinical assessments of relative intravascular volume (concordance 46%±10% and 50%±9%). This lack of improvement may be due to many clinical variables and changing intravascular volume status in hospitalized patients, suggesting that relative intravascular volume status in ICU patients is a “moving target” and should be reassessed repeatedly over time.
Limitations of this study include that it is a retrospective observational study that was not controlled, randomized, or blinded. Our volume management decisions were influenced by IVC CI findings combined with other available clinical data. Intravascular volume status may change between the time of IVC US and clinical evaluation, and the time of HD. This reflects what occurs in actual day-to-day practice. IVC US assessment is operator dependent, however, the senior author performed or supervised all scans. Clinical conditions that are known to systematically bias IVC US findings were present in many patients,1 and this was taken into account at the time of patient evaluation, but not systematically evaluated.
Conclusion
IVC CI is a good predictor of achieving net volume removal with intermittent HD in critically ill patients. The majority of patients with low IVC CI and large IVCmax had successful UF with HD regardless of ventilator or vasopressor status. IVC CI < 20% was the approximate optimal cutoff value for achieving net UF volumes ≥0.5 L to ≥2.0 L for the entire population. Net volume change achieved tended to be less than recommended and may have been limited by the development of IDH. The severity scale of IDH, which we proposed, related to ability to achieve net volume changes recommended. Severity of IDH did not correlate with UF rate in mL/kg/h. Our clinical pre-IVC US intravascular volume assessments were poor predictors of IVC collapsibility, and this did not improve with subsequent encounters. IVC US may be a useful tool for predicting whether critically ill patients will achieve volume removal with HD.
Acknowledgments
Christopher Nguyen, University of Southern California, Los Angeles, CA, USA; Vamsi Aribindi, Baylor College of Medicine, Houston, TX, USA; Divya Sreeramoju, Presence Saint Joseph Hospital-UIC, Chicago, IL, USA; and Dan Martinez, Phyu Phyu Thwe, and Carlos Andreas Rueda Mantilla, University of Southern California, Los Angeles, CA, USA for retrieving data.
Disclosure
The authors report no conflicts of interest in this work.
References
Kaptein MJ, Kaptein EM. Focused real-time ultrasonography for nephrologists. Int J Nephrol. 2017;2017:3756857:1–15. | ||
McGee S, Abernethy WB 3rd, Simel DL. The rational clinical examination. Is this patient hypovolemic? JAMA. 1999;281:1022–1029. | ||
Tuy T, Peacock WF. Fluid overload assessment and management in heart failure patients. Semin Nephrol. 2012;32:112–120. | ||
Levitov A, Frankel HL, Blaivas M, et al. Guidelines for the appropriate use of bedside general and cardiac ultrasonography in the evaluation of critically ill patients-part II: cardiac ultrasonography. Crit Care Med. 2016;44:1206–1227. | ||
Bentzer P, Griesdale DE, Boyd J, MacLean K, Sirounis D, Ayas NT. Will this hemodynamically unstable patient respond to a bolus of intravenous fluids? JAMA. 2016;316:1298–1309. | ||
Kanji HD, McCallum J, Sirounis D, MacRedmond R, Moss R, Boyd JH. Limited echocardiography-guided therapy in subacute shock is associated with change in management and improved outcomes. J Crit Care. 2014;29:700–705. | ||
Blehar DJ, Dickman E, Gaspari R. Identification of congestive heart failure via respiratory variation of inferior vena cava diameter. Am J Emerg Med. 2009;27:71–75. | ||
Goonewardena SN, Gemignani A, Ronan A, et al. Comparison of hand-carried ultrasound assessment of the inferior vena cava and N-terminal pro-brain natriuretic peptide for predicting readmission after hospitalization for acute decompensated heart failure. JACC. Cardiovasc Imaging. 2008;1:595–601. | ||
Miller JB, Sen A, Strote SR, et al. Inferior vena cava assessment in the bedside diagnosis of acute heart failure. Am J Emerg Med. 2012;30:778–783. | ||
Anderson KL, Jenq KY, Fields JM, Panebianco NL, Dean AJ. Diagnosing heart failure among acutely dyspneic patients with cardiac, inferior vena cava, and lung ultrasonography. Am J Emerg Med. 2013;31:1208–1214. | ||
Besli F, Kecebas M, Caliskan S, Dereli S, Baran I, Turker Y. The utility of inferior vena cava diameter and the degree of inspiratory collapse in patients with systolic heart failure. Am J Emerg Med. 2015;33(5):653–657. | ||
Yavasi O, Unluer EE, Kayayurt K, et al. Monitoring the response to treatment of acute heart failure patients by ultrasonographic inferior vena cava collapsibility index. Am J Emerg Med. 2014;32:403–407. | ||
Guiotto G, Masarone M, Paladino F, et al. Inferior vena cava collapsibility to guide fluid removal in slow continuous ultrafiltration: a pilot study. Intensive Care Med. 2010;36:692–696. | ||
Brennan JM, Ronan A, Goonewardena S, et al. Handcarried ultrasound measurement of the inferior vena cava for assessment of intravascular volume status in the outpatient hemodialysis clinic. Clin J Am Soc Nephrol. 2006;1:749–753. | ||
Tetsuka T, Ando Y, Ono S, Asano Y. Change in inferior vena caval diameter detected by ultrasonography during and after hemodialysis. ASAIO J. 1995;41:105–110. | ||
Kircher BJ, Himelman RB, Schiller NB. Noninvasive estimation of right atrial pressure from the inspiratory collapse of the inferior vena cava. Am J Cardiol. 1990;66:493–496. | ||
Nakao S, Come PC, McKay RG, Ransil BJ. Effects of positional changes on inferior vena caval size and dynamics and correlations with right-sided cardiac pressure. Am J Cardiol. 1987;59:125–132. | ||
Moreno FL, Hagan AD, Holmen JR, Pryor TA, Strickland RD, Castle CH. Evaluation of size and dynamics of the inferior vena cava as an index of right-sided cardiac function. Am J Cardiol. 1984;53:579–585. | ||
Capomolla S, Febo, O, Caporotondi A, et al. Non-invasive estimation of right atrial pressure by combined Doppler echocardiographic measurements of the inferior vena cava in patients with congestive heart failure. Ital Heart J. 2000;1:684–690. | ||
Rudski LG, Lai WW, Afilalo J, et al. Guidelines for the echocardiographic assessment of the right heart in adults: a report from the American Society of Echocardiography endorsed by the European Association of Echocardiography, a registered branch of the European Society of Cardiology, and the Canadian Society of Echocardiography. J Am Soc Echocardiogr. 2010;23:685–713. | ||
Beigel R, Cercek B, Luo H, Siegel RJ. Noninvasive evaluation of right atrial pressure. J Am Soc Echocardiogr. 2013;26:1033–1042. | ||
Sharma S, Waikar SS. Intradialytic hypotension in acute kidney injury requiring renal replacement therapy. Semin Dial. 2017;30(6):553–558. | ||
Lynch KE, Ghassemi F, Flythe JE, et al. Sodium modelling to reduce intradialytic hypotension during haemodialysis for acute kidney injury in the intensive care unit. Nephrology (Carlton). 2016;21:870–877. | ||
McIntyre CW, Salerno FR. Diagnosis and treatment of intradialytic hypotension in maintenance hemodialysis patients. Clin J Am Soc Nephrol. 2018;13:486–489. | ||
Ferreira FL, Bota DP, Bross A, Melot C, Vincent JL. Serial evaluation of the SOFA score to predict outcome in critically ill patients. JAMA. 2001;286:1754–1758. | ||
Steinberg MH. Structure and function of normal hemoglobins. In: Schrier SL, editor. UpToDate. Vol Topic 7072 Version 39.0. Alphen Aan Den Rign: Wolters Kluwer; 2017. | ||
Tiep BL, Carter CB. Portable oxygen delivery and oxygen conserving devices. In: Stoller JK, editor. UpToDate. Vol Topic 1442 Version 11.0. Alphen Aan Den Rijn: Worters Kluwer; 2017. | ||
Preau S, Bortolotti P, Colling D, et al. Diagnostic accuracy of the inferior vena cava collapsibility to predict fluid responsiveness in spontaneously breathing patients with sepsis and acute circulatory failure. Crit Care Med. 2017;45:e290–e297. | ||
Seif D, Mailhot T, Perera P, Mandavia D. Caval sonography in shock: a noninvasive method for evaluating intravascular volume in critically ill patients. J Ultrasound Med. 2012;31:1885–1890. | ||
Kent A, Patil P, Davila V, et al. Sonographic evaluation of intravascular volume status: Can internal jugular or femoral vein collapsibility be used in the absence of IVC visualization? Ann Thorac Med. 2015;10:44–49. |
Supplementary material
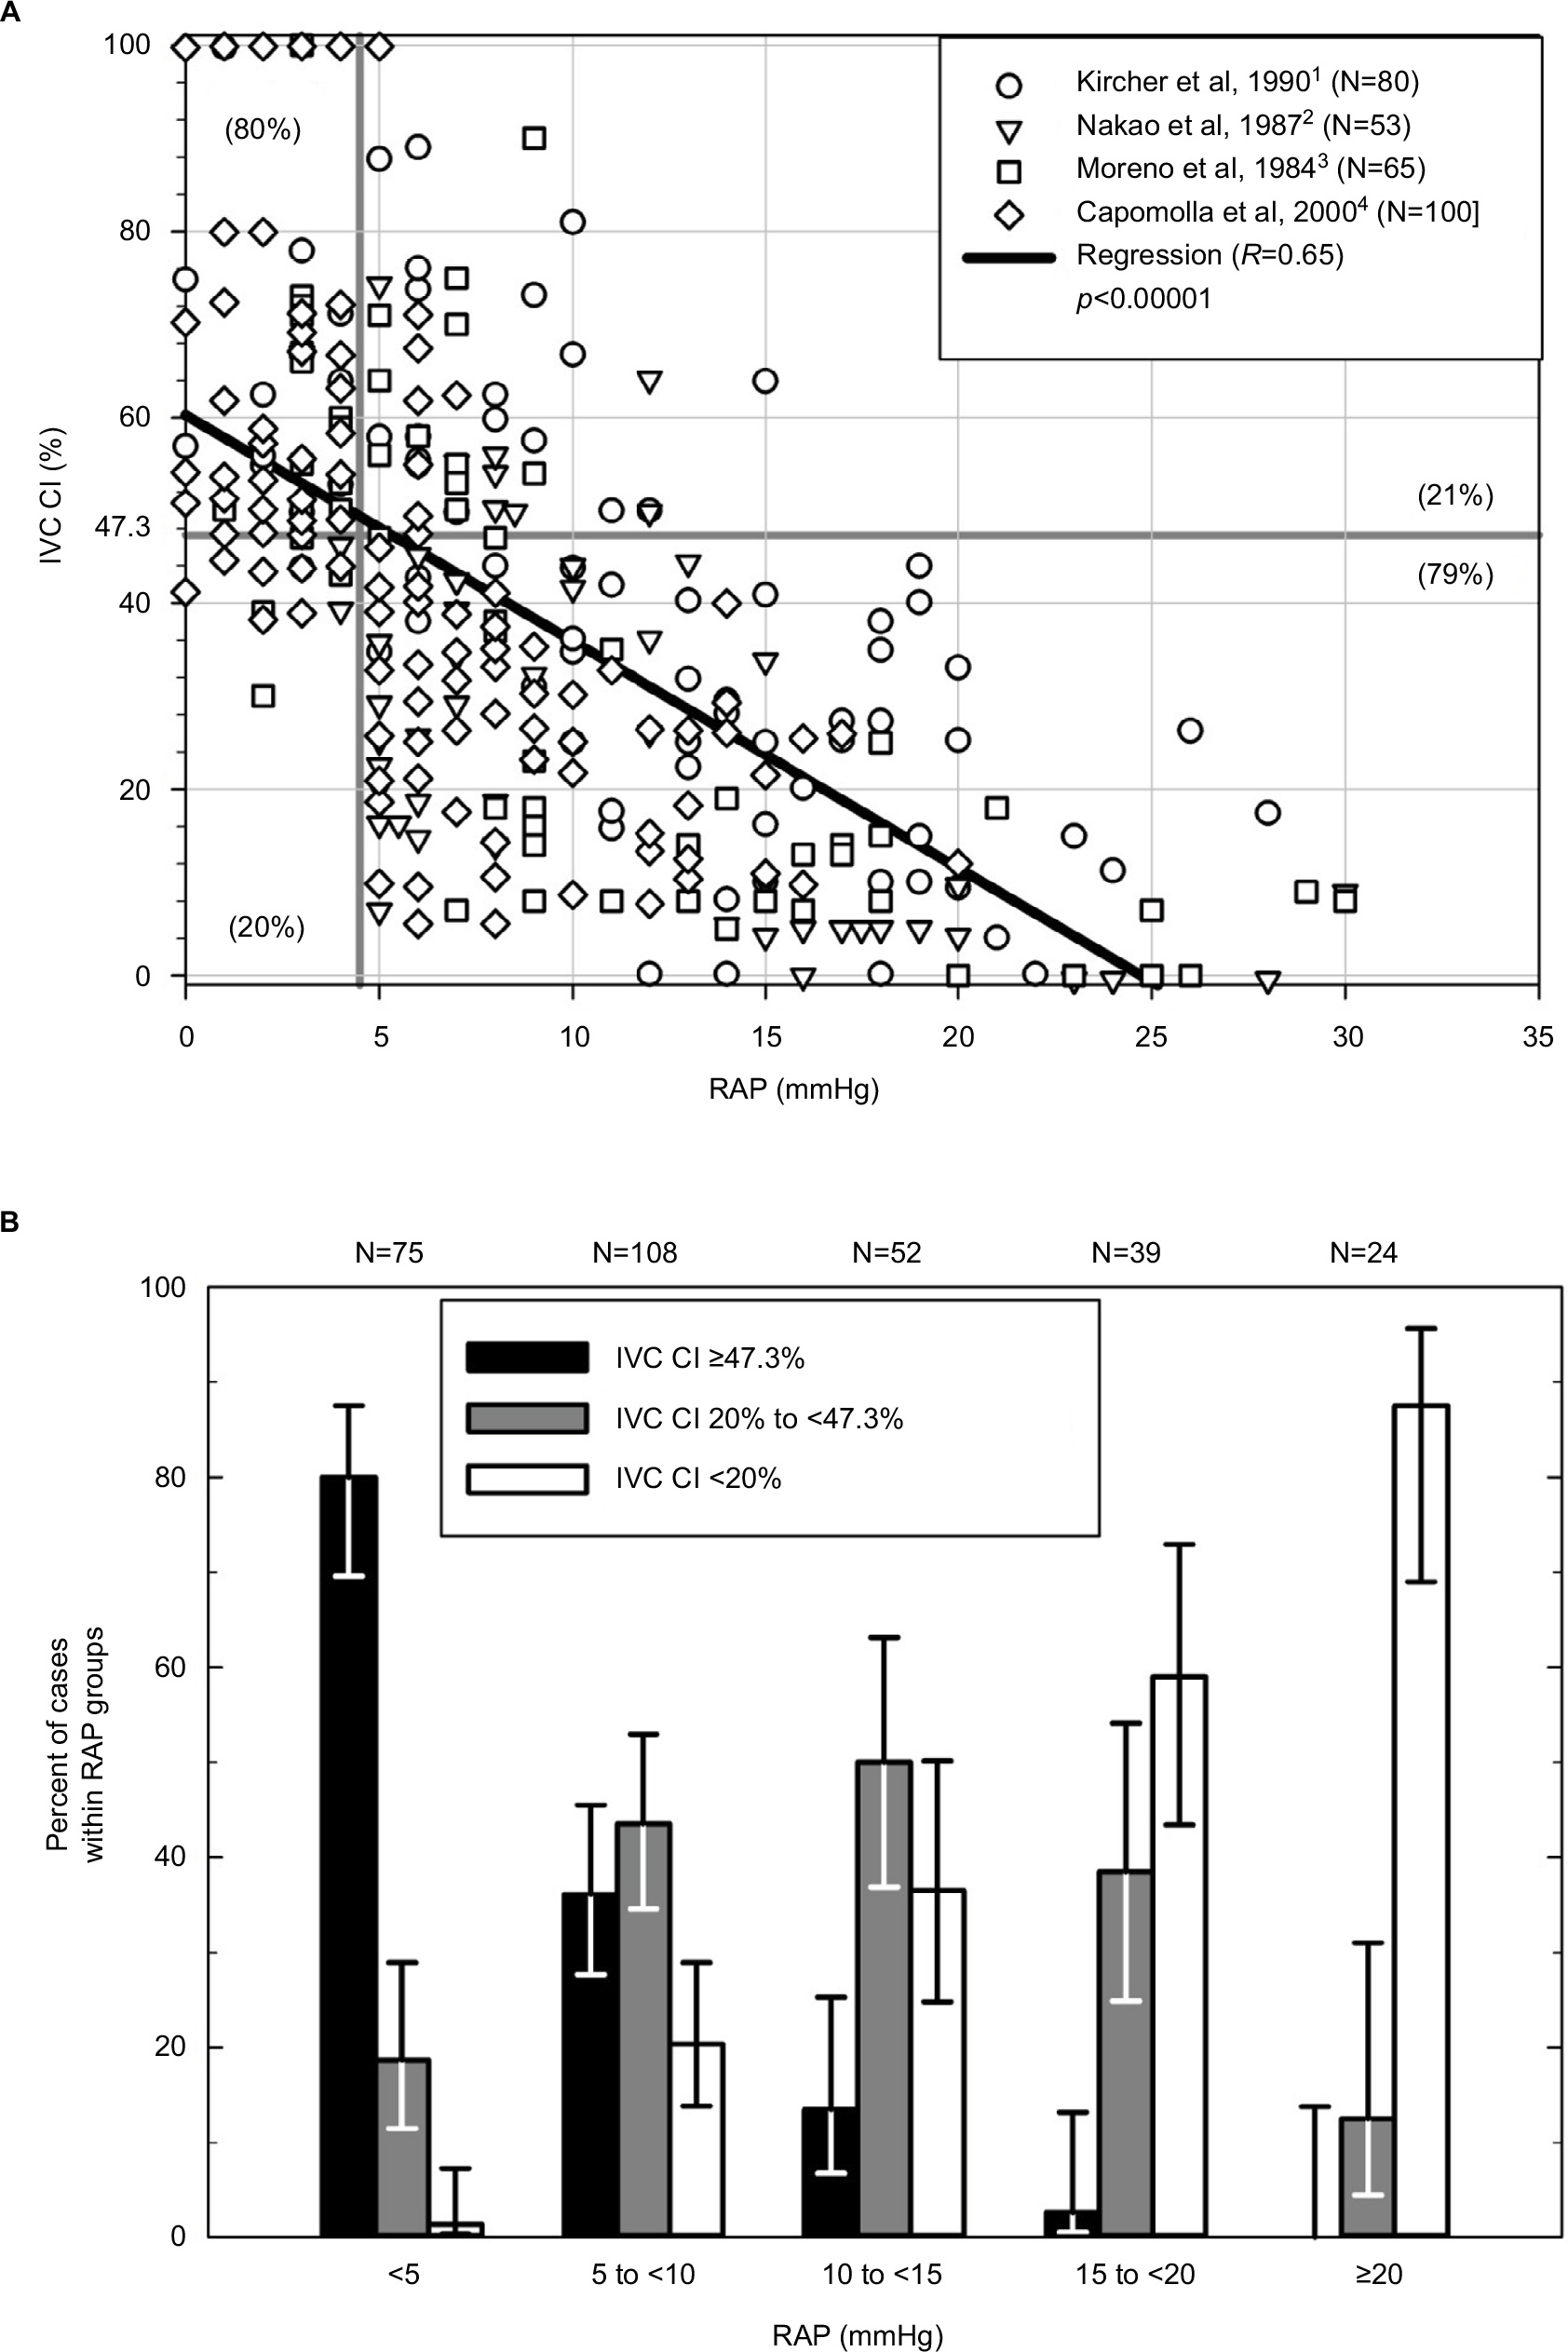 | Figure S1 (A) Relationship of IVC CI to right atrial pressure derived from four publications with more than 50 extractable data points each for RAP and IVC CI (total n=298).1–4 Optimal sensitivity (80%) and specificity (79%) were obtained at a cutoff for IVC CI of 47.3% for predicting an RAP <5 mmHg. (B) Proportions of encounters within given RAP ranges that have IVC CI ≥47.3%, 20 to <47.3%, and <20%. Abbreviations: CI, collapsibility index; IVC, inferior vena cava; RAP, right atrial pressure. |
References
Kircher BJ, Himelman RB, Schiller NB. Noninvasive estimation of right atrial pressure from the inspiratory collapse of the inferior vena cava. Am J Cardiol. 1990;66:493–496. | ||
Nakao S, Come PC, McKay RG, Ransil BJ. Effects of positional changes on inferior vena caval size and dynamics and correlations with right-sided cardiac pressure. Am J Cardiol. 1987;59:125–132. | ||
Moreno FL, Hagan AD, Holmen JR, Pryor TA, Strickland RD, Castle CH. Evaluation of size and dynamics of the inferior vena cava as an index of right-sided cardiac function. Am J Cardiol. 1984;53:579–585. | ||
Capomolla S, Febo, O, Caporotondi A, et al. Non-invasive estimation of right atrial pressure by combined Doppler echocardiographic measurements of the inferior vena cava in patients with congestive heart failure. Ital Heart J. 2000;1:684–690. |
 © 2018 The Author(s). This work is published and licensed by Dove Medical Press Limited. The full terms of this license are available at https://www.dovepress.com/terms.php and incorporate the Creative Commons Attribution - Non Commercial (unported, v3.0) License.
By accessing the work you hereby accept the Terms. Non-commercial uses of the work are permitted without any further permission from Dove Medical Press Limited, provided the work is properly attributed. For permission for commercial use of this work, please see paragraphs 4.2 and 5 of our Terms.
© 2018 The Author(s). This work is published and licensed by Dove Medical Press Limited. The full terms of this license are available at https://www.dovepress.com/terms.php and incorporate the Creative Commons Attribution - Non Commercial (unported, v3.0) License.
By accessing the work you hereby accept the Terms. Non-commercial uses of the work are permitted without any further permission from Dove Medical Press Limited, provided the work is properly attributed. For permission for commercial use of this work, please see paragraphs 4.2 and 5 of our Terms.