")
Back to Journals » Diabetes, Metabolic Syndrome and Obesity » Volume 15
Relationship Between Thyroid Hormone and Liver Steatosis Analysis Parameter in Obese Participants: A Case-Control Study
Authors Chen S , Jin Y, Xu M , Zhang P, Zhou Y , Qian X, Song Q , Bu S, Sun J , Li L
Received 3 January 2022
Accepted for publication 10 March 2022
Published 22 March 2022 Volume 2022:15 Pages 887—896
DOI https://doi.org/10.2147/DMSO.S356882
Checked for plagiarism Yes
Review by Single anonymous peer review
Peer reviewer comments 2
Editor who approved publication: Prof. Dr. Antonio Brunetti
Shuqin Chen,1,* Yong Jin,2,* Miao Xu,1 Pingping Zhang,3 Ye Zhou,1 Xingjun Qian,4 Qifa Song,5 Shizhong Bu,6 Jing Sun,7 Li Li1
1Department of Endocrinology and Metabolism, Ningbo First Hospital, Ningbo, Zhejiang Province, People’s Republic of China; 2Department of Internal Medicine, Ningbo Yinzhou Second Hospital, Ningbo, Zhejiang Province, People’s Republic of China; 3School of Public Health, Peking University, Beijing, People’s Republic of China; 4Health Management Center, Ningbo First Hospital, Ningbo, Zhejiang Province, People’s Republic of China; 5Medical Research Center, Ningbo First Hospital, Ningbo, Zhejiang Province, People’s Republic of China; 6Diabetes Research Center, School of Medicine, Ningbo University, Ningbo, Zhejiang Province, People’s Republic of China; 7School of Medicine and Dentistry, Griffith University, Gold Coast, Queensland, Australia
*These authors contributed equally to this work
Correspondence: Li Li, Department of Endocrinology and Metabolism, Ningbo First Hospital, Ningbo, Zhejiang Province, People’s Republic of China, Tel +8613757426626, Email [email protected] Jing Sun, School of Medicine and Dentistry, Griffith University, Gold Coast, Queensland, Australia, Tel +61756780924, Email [email protected]
Objective: The thyroid hormone has been demonstrated to be associated with nonalcoholic fatty liver disease (NAFLD) in different populations. However, the relationship between thyroid hormone and the degree of liver steatosis in overweight/obese subjects is still unclear. Liver ultra-sound attenuation (LiSA) is a newly developed ultrasound attenuation parameter for the analysis of hepatic steatosis. The study aimed to characterize the relationship between thyroid hormone and LiSA in overweight/obese participants.
Methods: This case-control study was performed in Ningbo First Hospital, China. A total of 24 lean, 66 overweight and 49 obese participants were consecutively recruited from January 2021 to May 2021. Thyroid hormone and other clinical features were measured. LiSA was acquired by using a Hepatus ultrasound machine. Multiple linear regression analyses were performed to examine associations of LiSA and clinic indices.
Results: Obese subjects had higher LiSA, fT3 and TSH levels than lean participants of similar age and sex (P < 0.05). LiSA was positively associated with the fT3 level. The multiple linear regression analyses showed that fT3 (ß = 0.353, P < 0.001) was independently associated with LiSA in overweight/obese participants.
Conclusion: The fT3 level was independently associated with the degree of liver steatosis among the overweight/obese participants.
Keywords: LiSA, obesity, NAFLD, thyroid hormone
Introduction
Nonalcoholic fatty liver disease (NAFLD) is characterized by excessive lipid accumulation and liver injury in the absence of significant alcohol use, which subsumes a variety of entities ranging from simple fatty liver or hepatic steatosis, non-alcoholic steatohepatitis (NASH), to liver fibrosis and cirrhosis.1–3 Currently, the prevalence of NAFLD is up to 20–30% and is projected to continue to increase because of the ongoing obesity epidemic beginning in childhood, the rise in the prevalence of diabetes, and other factors.4,5 The development of NAFLD has been ascribed to metabolic disease, such as obesity, insulin resistance, type-2 diabetes mellitus, and dyslipidemia.6 Early diagnosis and stratification of NAFLD are essential for early intervention and effective management. In 2020, experts from the European Liver Patient’s Association (ELPA) proposed a change of nomenclature from NAFLD to metabolic dysfunction-associated fatty liver disease (MAFLD), defined as hepatic steatosis along with three metabolic conditions: obesity, diabetes and metabolic disorders.7 Although MAFLD was a more positive and clinical diagnosis compared to NAFLD, the concept of MAFLD is new and the clinical research on MAFLD is relatively insufficient at present. Therefore, NAFLD instead of MAFLD was used in this study.
Among several noninvasive techniques (ultrasound, computed tomography, and magnetic resonance imaging) that can be used to diagnose liver steatosis, ultrasonography is the most widely used.8 The degree of fatty liver can be quantitatively evaluated by detecting the attenuation of ultrasound in the liver. Recently, controlled attenuation parameter (CAP) was widely used to quantitatively detect and evaluate fatty liver.9,10 However, the ultrasound signal used to calculate the CAP only comes from the one-dimensional ultrasound echo signal of a certain part of the liver. When the detected tissue position changes, the measurement result is unstable Liver Ultra-Sound Attenuation (LiSA), acquired by Hepatus (Mindray, China), is a newly developed ultrasound attenuation parameter for diagnosing liver steatosis analysis. The detection principle of LiSA is the same as that of CAP, and the results of both correspond to the sound attenuation parameters of 3.5Hz ultrasound. Compared with CAP, LiSA has obvious advantages: (1) Hepatus performs a quantitative assessment of liver fibrosis and fatty change under the visual guidance, ensuring that blood vessels and lesions are avoided, greatly reducing the difficulty of operating and improving the success rate; (2) The machine can obtain real-time two-dimensional ultrasound echo signals in a large range area and perform comprehensive calculations of ultrasound attenuation parameters. Therefore, the results are more stable and the detection efficiency is higher. A recent study has demonstrated that LiSA is an extremely efficient tool for assessing liver steatosis and can provide immediate results with high sensitivity; also, LiSA and CAP are highly correlated in diagnosing hepatic steatosis.11 The cutoff value of CAP for diagnosing fatty liver (< 238dB/m, 238 ~ 258 dB/m, 259 ~ 291 dB/m, ≥ 292 dB/m) is also applicable to LiSA, because of the same detection principle and the high correlation confirmed by literature report.12
Thyroid hormone plays an important role in maintaining metabolic homeostasis at the systemic and hepatic levels by its influence on de novo lipogenesis, beta-oxidation, cholesterol metabolism, and carbohydrate metabolism.13,14 It is increasingly recognized that the thyroid hormone levels may be associated with the risk of NAFLD.15 Our previous study found that visceral fat and thyroid hormone interacted with each other.16 However, no studies examined the relationship between thyroid hormone and LiSA in overweight/obesity participants. In this context, a case-control study was performed to evaluate the relationship between thyroid hormone and LiSA in overweight/obese participants and to explore further the new understanding and direction of the pathophysiological mechanism of NAFLD.
Materials and Methods
Study Participants
The present study consecutively enrolled 24 lean healthy, 66 overweight, and 49 obese participants aged 18–60 years from the Ningbo First Hospital (Zhejiang province, China), between January 2021 and May 2021. Considering ethnic differences, our study adopted the obesity diagnostic criteria recommended by WHO for the Chinese people:17 BMI ≥ 24 kg/m2 is overweight, and BMI ≥ 28 kg/m2 is diagnosed as obesity. The exclusion criteria were as follows:: (1) patients with a history of taking medications that can affect thyroid function; (2) hyperthyroidism or hypothyroidism; (3) History of thyroid cancer or thyroid surgery; (4) history of hypothalamus or pituitary disease; (5) long-term alcohol consumption; (6) history of viral hepatitis, autoimmune hepatitis, and Wilson’s disease; (7) total parenteral nutrition, inflammatory bowel disease, or Cushing’s syndrome; (8) Taking tamoxifen, amiodarone, sodium valproate, methotrexate, or glucocorticoids. Written informed consent was obtained from all the individuals, and the study was approved by the ethics committee of the Ningbo First Hospital. The purposes and procedures of the study were explained to the participants prior to the questionnaire and blood data collection.
Clinical and Laboratory Examination
The demographic data including age, sex and medical history were obtained from the clinical documents of outpatient department of Ningbo First Hospital and the National Standardized Metabolic Disease Management Center. According to the routine protocol, the information of complete physical examination including height, weight, waist circumference (WC) and blood pressure was recorded after overnight fasting for 8 to 10 hours, and BMI was calculated by body weight (kg)/ height squared (m2). The general laboratory tests included the levels of fasting blood glucose (FBG), fasting plasma insulin (FINS), glycated hemoglobin (HbA1c), triglyceride (TG), total cholesterol (TC), high-density lipoprotein cholesterol (HDL-C), low-density lipoprotein cholesterol (LDL-C), triiodothyronine (T3), thyroxine (T4), thyroid-stimulating hormone (TSH), free triiodothyronine (fT3), and free thyroxine (fT4). Insulin resistance index (HOMA-IR) was calculated by the formula FBG × FINS/22.5. All biochemical parameters were detected by standard automated laboratory methods using commercially available kits following the manufacturers’ protocols.
Measurement of Liver Steatosis
Measurement of LiSA was performed by Hepatus (Mindray, China), a newly developed ultrasound machine with a 3.5-MHz phased-array probe (LFP5-1U, Mindray, Re 6S, China). The attenuation of ultrasound propagation in the liver tissue was increased by fat accumulation. Therefore, the detection of ultrasonic attenuation coefficient is a quantitative method for grading liver steatosis.18 Experienced technicians performed examinations following the manufacturer’s instructions. The operator obtained real-time two-dimensional ultrasound images through the probe to locate the interested detection site (avoiding gallbladder, liver capsule, fat layer, kidney, and thick blood vessels) before the measurement. All patients were placed in the dorsal decubitus position, with their right arms extended and lifted. The examinee breathes calmly for 6–7 s, and the right hepatic lobe is assessed through an intercostal approach using ultrasound imaging. During the measurement process, the real-time synchronous two-dimensional ultrasound image helped the operator to observe whether the position of the detection target changes or not. Probes with pressure sensors are another advantage. The signal on the probe can feedback the pressure to the operator in real time, thus improving the stability and accuracy of the detection. LiSA was calculated according to the attenuation of 3.5-MHz ultrasound in two-dimensional ultrasound echo signals of the liver. The final LiSA value was the median of individual measurements, and the interquartile range < 40 dB/m was used as a quality criterion. The classification of liver ultrasonic attenuation parameters in this study refers to the French multi-center clinical study by Sasso et al.12 Using liver biopsy as the gold standard, the cut-off value of CAP for diagnosing fatty liver in patients with chronic hepatitis B, chronic hepatitis C and NAFLD was as follows: S ≥ S1 (≥ 10%): 238 dB/m; S ≥ S2 (≥ 34%): 259 dB/m; S ≥ S3 (≥ 67%): 292 dB/m12. Due to the high correlation between LiSA and CAP, the stratification method of liSA in this study was as follows: group A (LiSA≤238dB/m, no hepatic steatosis); group B (238dB/m < LiSA ≤ 291dB/m, mild and moderate hepatic steatosis); group C (LiSA > 291dB/m, severe liver steatosis).
Statistical Analysis
Statistical analyses were performed using Statistical Package for Social Sciences 24.0. Before proceeding with the statistical analysis, all the parameters were tested for a normal distribution using the Kolmogorov–Smirnov test. Normal-distribution variables were expressed as the mean ± standard deviation. Normal-distribution variables between the two groups were compared with the independent sample t-test. One-way analysis of variance was used for comparison among the three groups. Nonnormally distributed variables were expressed as the median (inter-quartile range). Nonnormally distributed variables between the two groups were compared with the Mann–Whitney test, while the Kruskal–Wallis test was used for the comparison of the three groups. Categorical variables were compared using the chi-Square (χ2) test. The relationships between LiSA and clinical parameters were evaluated using Spearman correlation coefficient. Multiple linear regression analysis was used to assess the independent correlation between thyroid hormone levels and LiSA. Two-tailed P value < 0.05 indicated a statistically significant difference.
Results
Anthropometric and Biochemical Characteristics of the Study Population
A total of 139 participants who met the inclusion criteria were included in this study, including 24 lean, 66 overweight, and 49 obese participants. The anthropometric and clinical characteristics as well as laboratory measurements of the participants are shown in Table 1. Patients with obesity had higher LiSA compared with overweight and lean individuals (P < 0.001). The serum fT3 and TSH levels were significantly higher in obese participants than in lean individuals (P < 0.05). The serum T3, T4, and fT4 levels were not significantly different among three groups. The anthropometric parameters, including BMI, WC, and SBP, were significantly higher in overweight/obesity individuals than in lean individuals (P < 0.05). TC, one of the lipid metabolic indexes, increased in obese participants (P < 0.05). HOMA-IR, representing insulin resistance, increased in overweight/obese individuals than in lean individuals (P < 0.001). No significant differences were found in sex, age, DBP, HbA1c, TG, HDL-C, LDL-C, T3, T4, and fT4 levels among the three groups (P > 0.05).
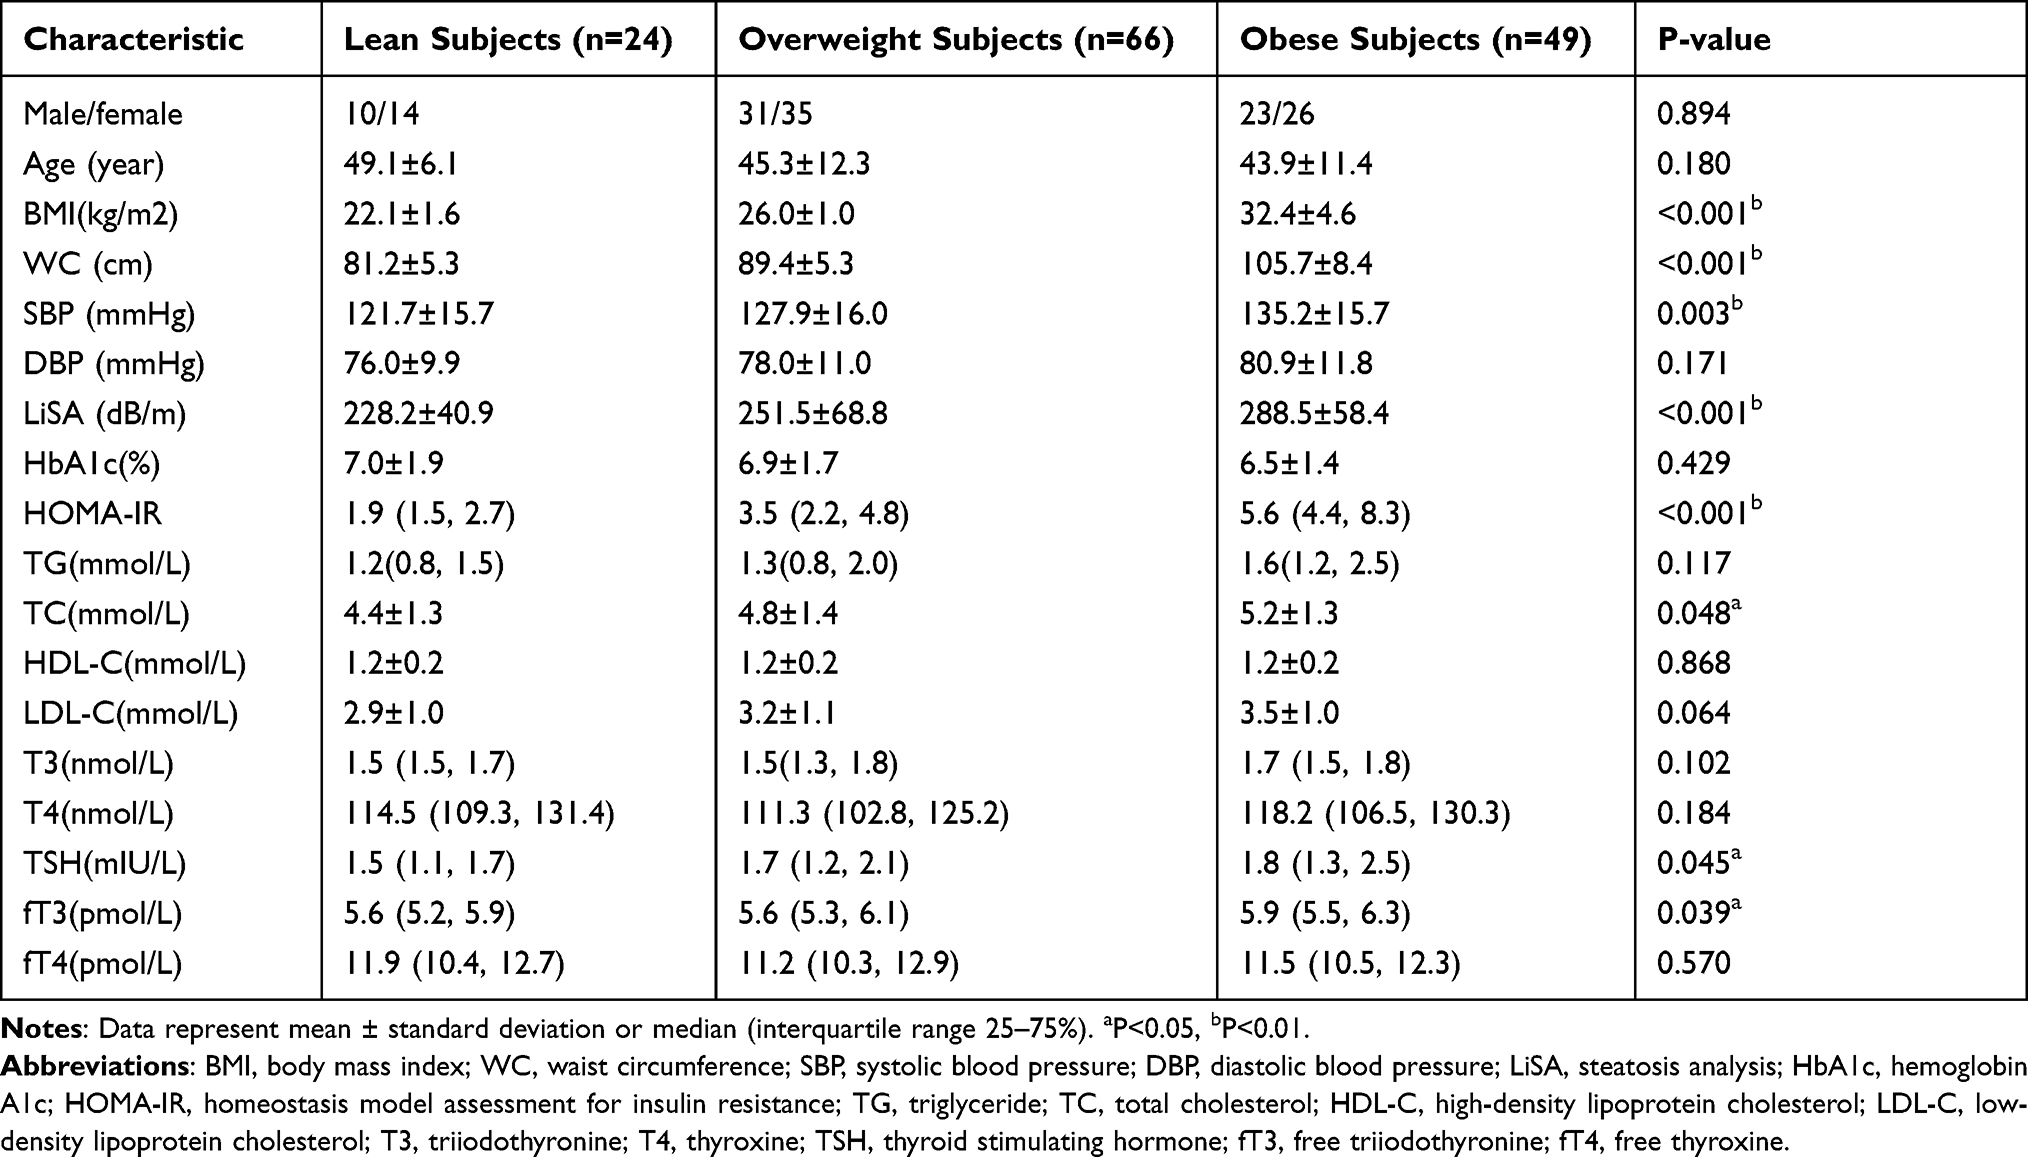 |
Table 1 Clinical and Laboratory Characteristics of Lean, Overweight and Obese Subjects |
Anthropometric and Biochemical Characteristics of Three Groups According to the Different Levels of LiSA
All participants were further divided into 3 groups according to the different levels of LiSA (Table 2), among which 59 were in group A (LiSA ≤ 238dB/m), 39 were in group B (238dB/m < LiSA ≤ 291dB/m), and 41 were in group C (LiSA > 291dB/m). Table 2 shows that the levels of BMI, WC, SBP, DBP, HbA1c, HOMA-IR, TG, TC, and LDL-C gradually increased with the increasing LiSA levels (P < 0.05). Group C participants with severe liver steatosis were more likely to be young (P < 0.05). Increased LiSA levels were also significantly associated with increased fT3 levels (P < 0.001). No significant differences were found in sex, HDL-C, T3, T4, TSH, and fT4 levels among the three groups (P > 0.05).
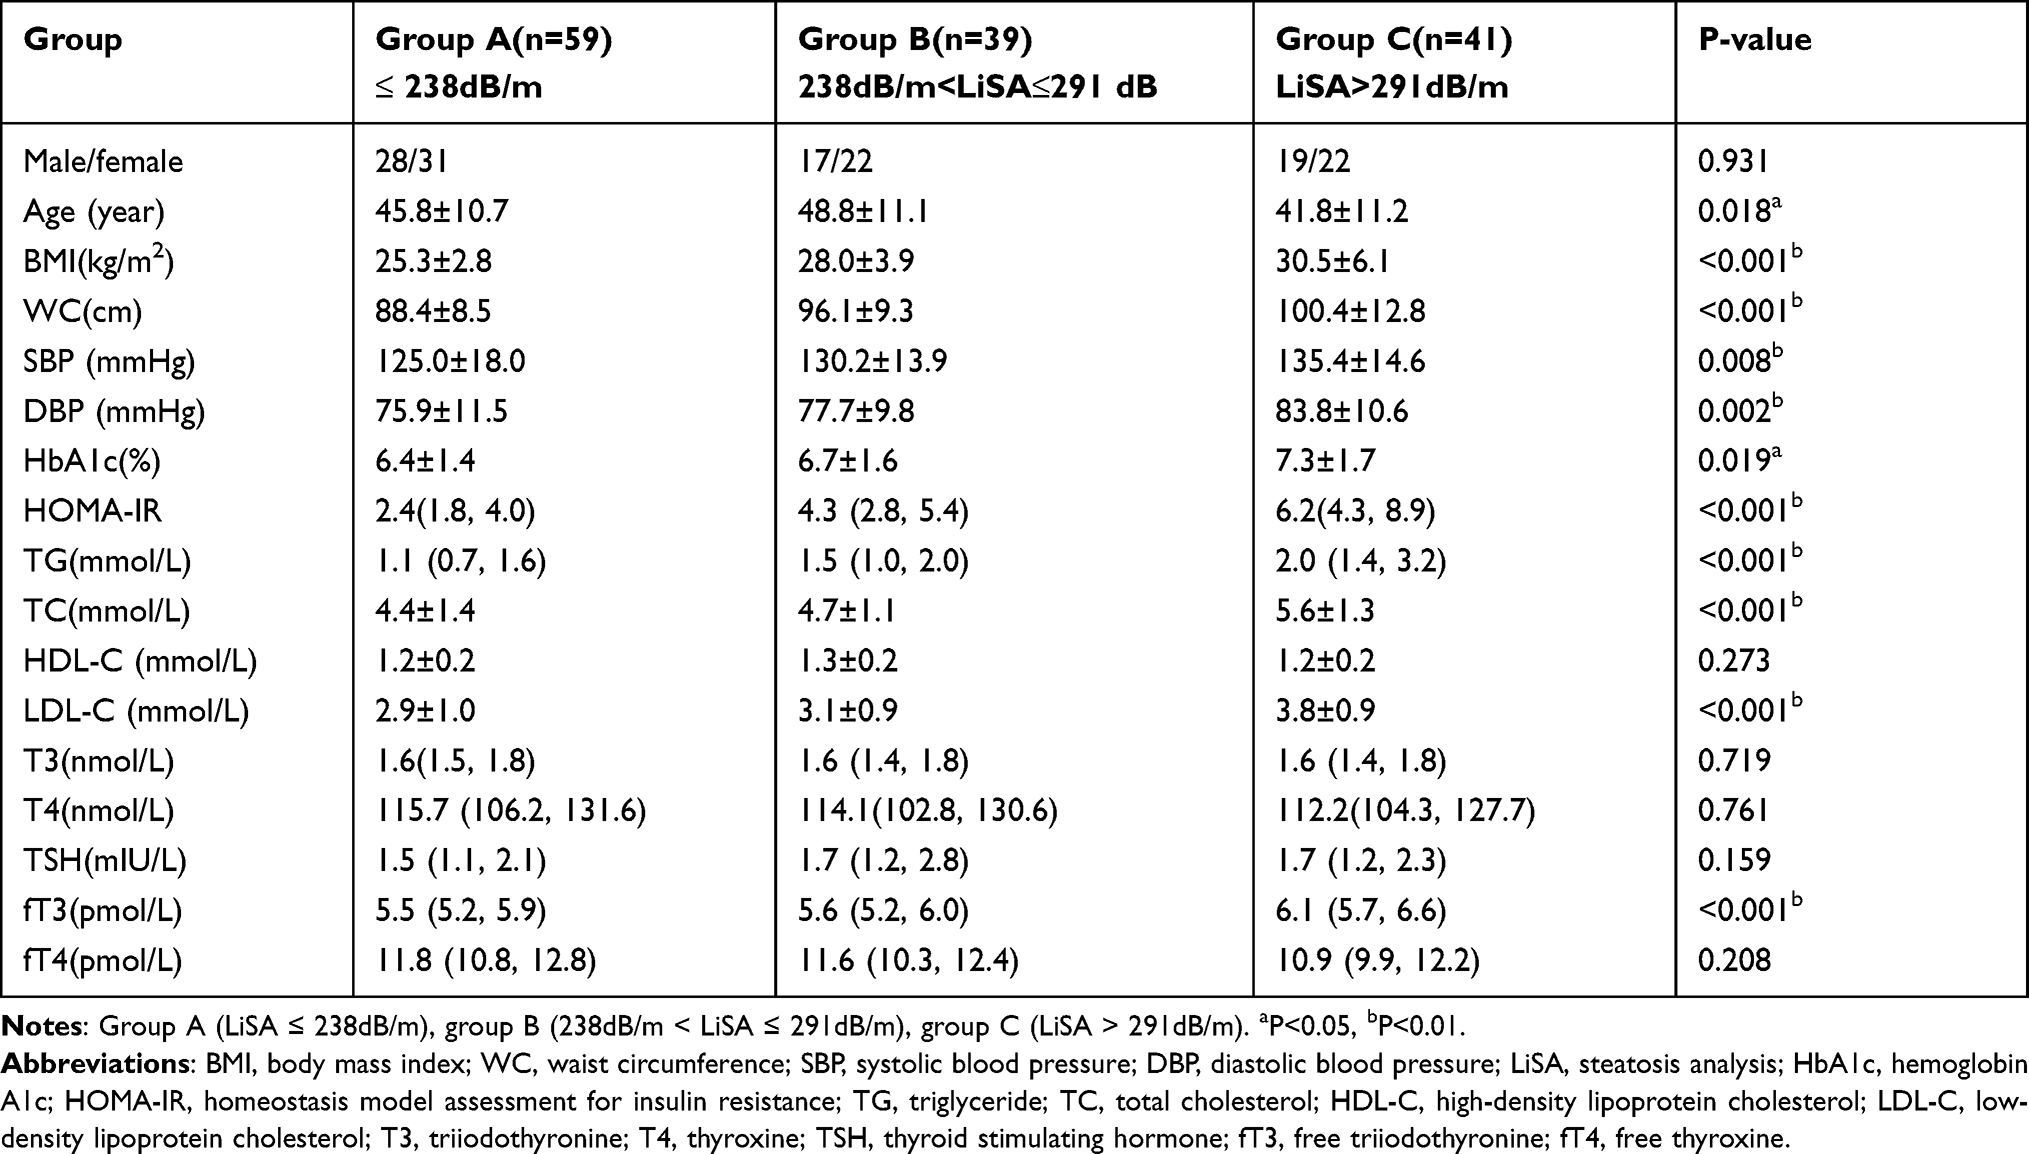 |
Table 2 Clinical and Laboratory Characteristics of Subjects with Different Degrees of LiSA |
Relationships Between LiSA and the Anthropometric and Laboratory Measurements in Lean, Overweight/Obese Participants
Spearman correlation analysis was performed between LiSA and the clinical characteristics in lean and overweight/obese participants (Table 3). The results showed that LiSA was positively associated with HbA1c in lean participants (P < 0.05). LiSA was not associated with other variables in lean participants (P > 0.05). LiSA was positively associated with BMI, WC, SBP, DBP, HbA1c, HOMA-IR, TG, TC, LDL-C, and fT3 in overweight/obese participants (P < 0.05). LiSA was not associated with other variables in obese participants (P > 0.05). The scatter plot illustrates the correlations between LiSA and clinical indicators (Figure 1A–J).
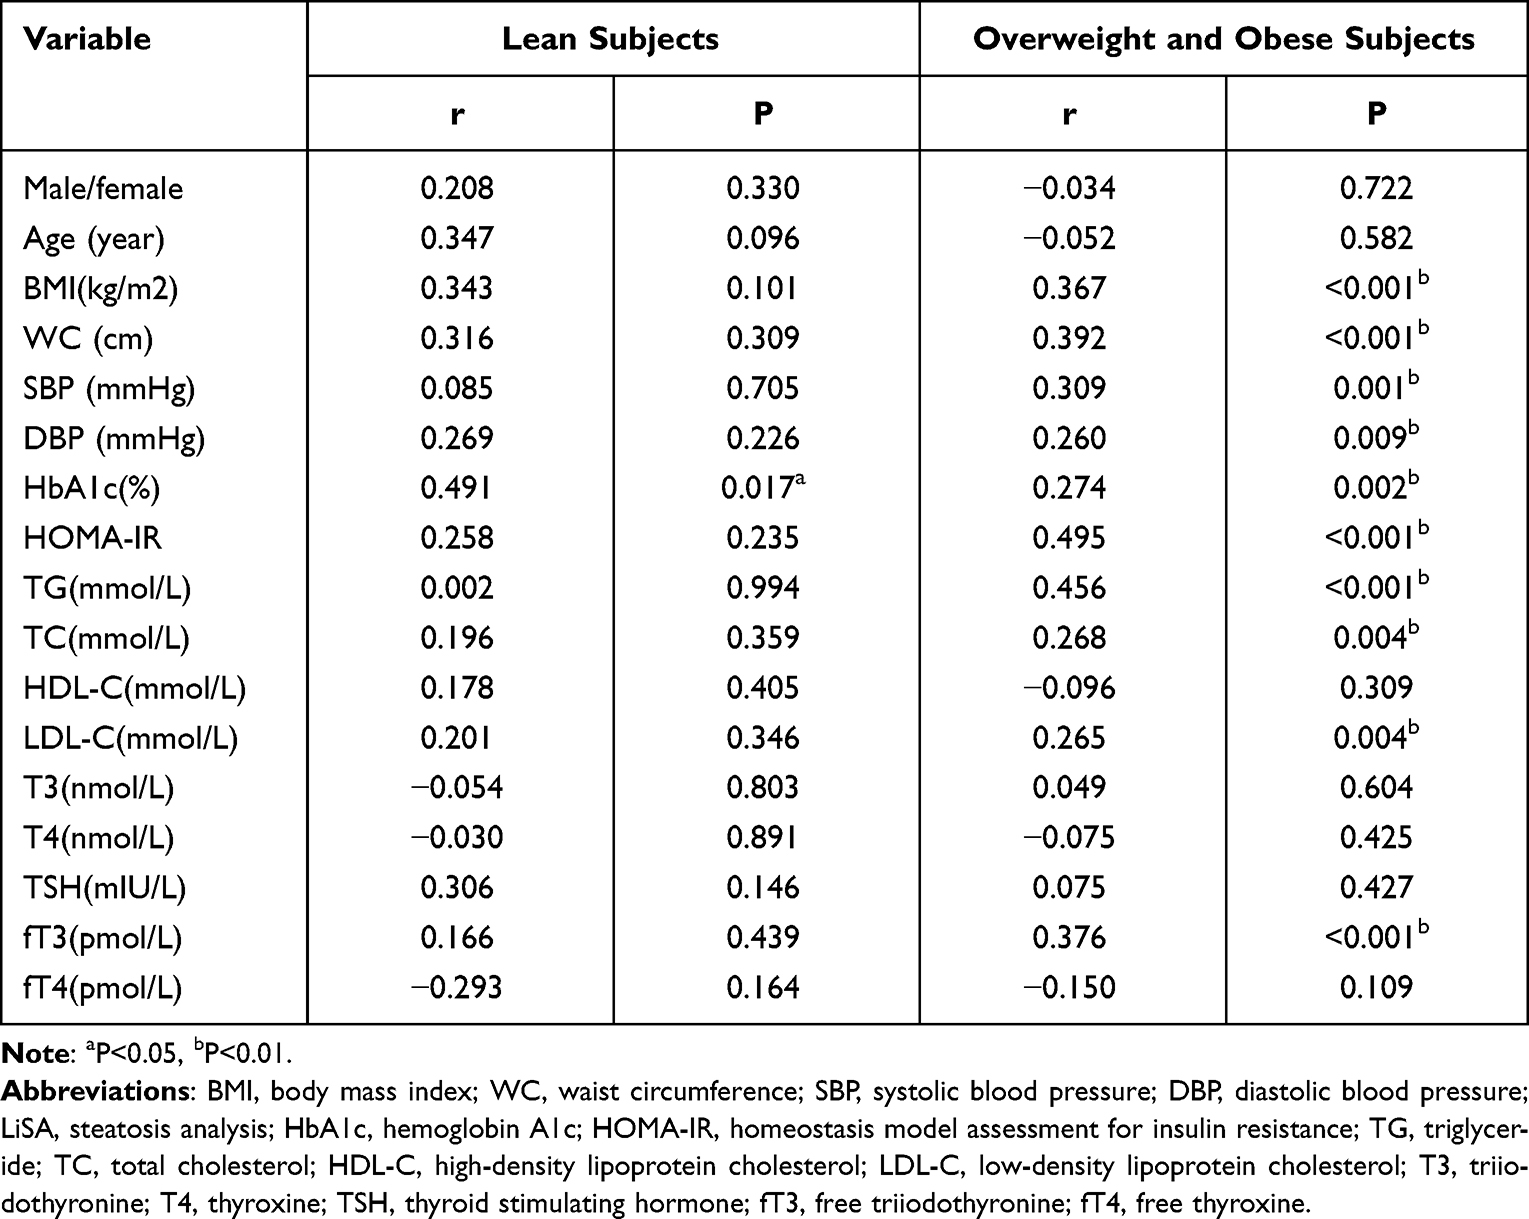 |
Table 3 Spearman Correlation Analysis of Factors Associated with LiSA in Lean, Overweight and Obese Subjects |
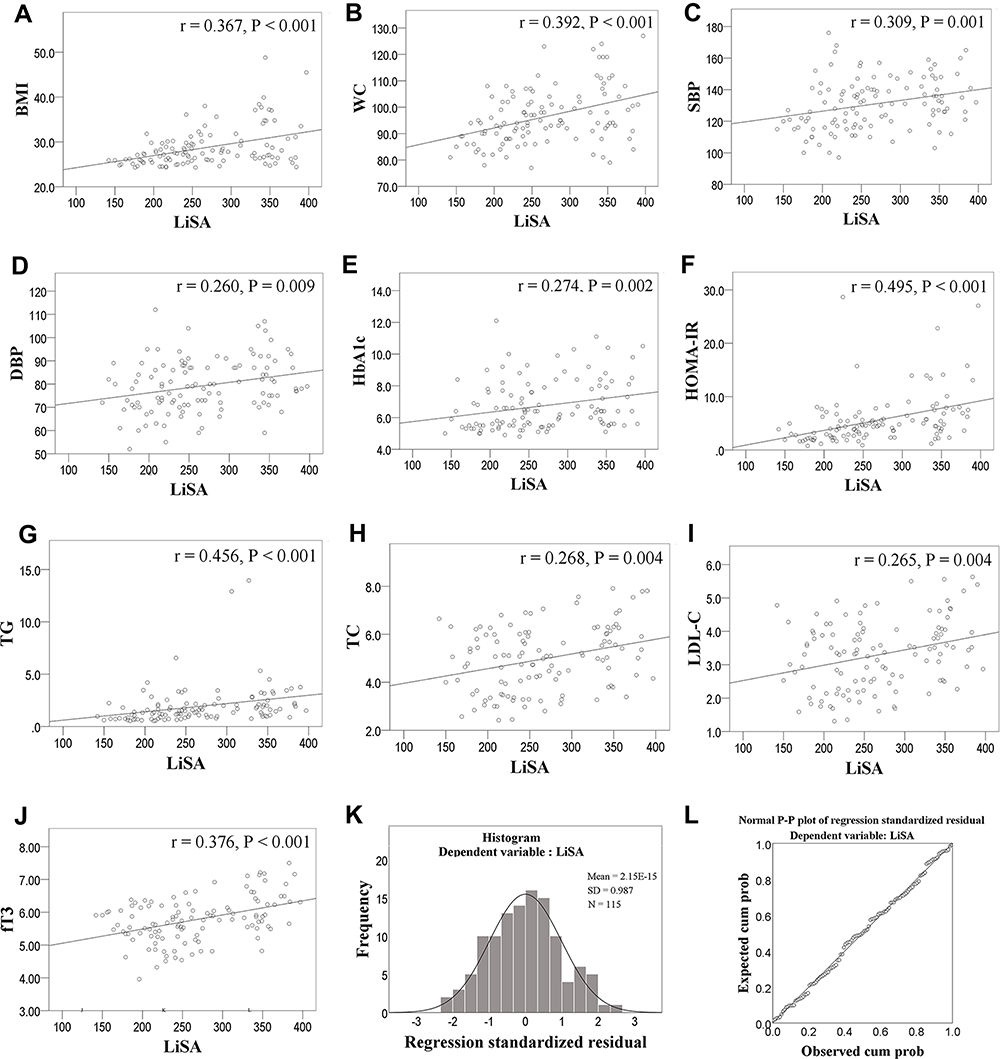 |
Figure 1 (A–J) Scatter plot showing significant Spearman correlation between LiSA and clinical indicators. (K) Histogram of residuals for the linear regression model. (L) Normal probability plot of regression standardized residual for the linear regression model. |
Multivariate Regression Analysis Regarding the Relationship Between Thyroid Hormone and LiSA in Overweight/Obese Participants
A stepwise multiple linear regression model was performed to evaluate the relationship between these variables and LiSA. The multivariate model consisted of LiSA as the dependent variable and BMI, WC, SBP, DBP, HbA1c, HOMA-IR, TG, TC, LDL-C, and fT3 as independent variables that had significant relationships with LiSA in the Spearman correlation analysis. The residuals plots for the linear regression model are shown in Figure 1K and L. The results revealed that fT3 (ß = 0.353, P < 0.001), WC (ß = 0.312, P =< 0.001) and HbA1c (ß = 0.208, P = 0.009) were independently associated with LiSA in overweight/obese participants (Table 4).
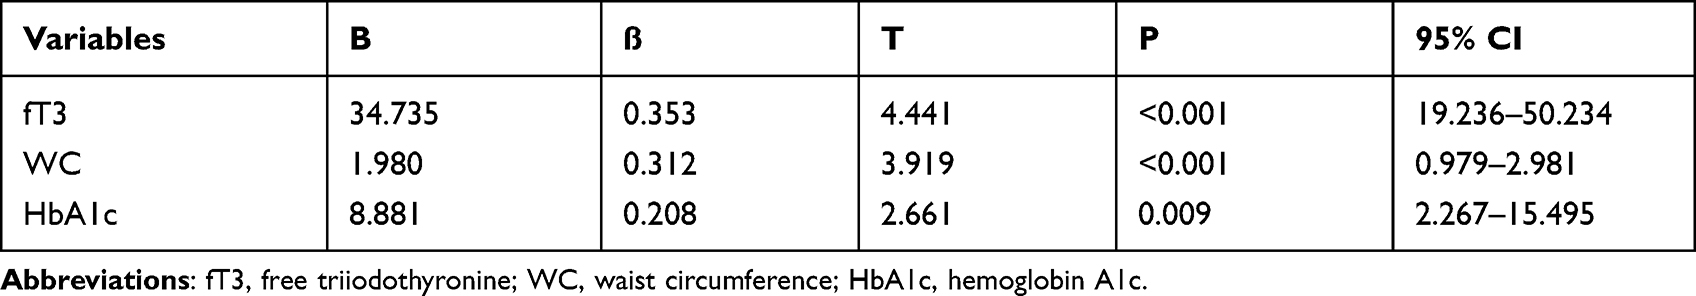 |
Table 4 Stepwise Multiple Linear Regression Analyses of Variables Associated with LiSA in Overweight and Obese Subjects |
Discussion
The present study explored the relationship of thyroid hormone (fT3) and LiSA in Chinese overweight/obese subjects using case-control study design. We found that obese subjects have higher LiSA, fT3 and TSH levels than lean participants of similar age and sex. Spearman’s correlation analyses showed that fT3 were significantly and positively correlated with LiSA. Multivariable linear regression analyses also illustrated that LiSA was positively associated with fT3 level in overweight/obese subjects after adjusting potential confounding factors. This study was novel in specifically addressing the relationship between thyroid hormone and LiSA in Chinese overweight/obese subjects.
Many studies have reported the correlation between thyroid hormone (fT3,fT4,T3,T4,TSH) and obesity-related anthropometric parameters (BMI, WC, waist-to-height ratio, visceral fat area, etc.),19–23 although the relationship and opinions in different studies differs.24 Thyroid hormone plays an important role in the balance of energy metabolism in the body, and leptin may be a potential link between thyroid hormone and obesity metabolic pathway. Leptin can promote the conversion of fT4 to fT3 by affecting the activity of deiodinase in peripheral tissues.25–27 The positive correlation between leptin and the concentration ratio of fT3/fT4 was reported in both normal and obese subjects.28 Fat accumulation of the body is an energy overload state, and the elevated fT3 levels may be an adaptive change of the body.
NAFLD is known to frequently coexist with obesity and type 2 diabetes mellitus (T2DM), and they act synergistically to promote the deterioration of adverse clinical outcomes (hepatic and extra-hepatic).29,30 Obesity and T2DM are strongest risk factors for the progression of NAFLD to nonalcoholic steatohepatitis, liver fibrosis or cirrhosis.31 The links between these three diseases are complex, and the interactions are intricated. In our study, we showed a positive association between LiSA and WC and HbA1c, which is consistent with previous research reports and the logical relationship between these diseases. It indicates that weight management and blood glucose control are very important for the treatment of NAFLD.
Several studies reported the relationships between thyroid function parameters and the risk of NAFLD, but the results are somewhat controversial. Four studies supported a positive correlation between the fT3 level and the risk of NAFLD.32–35 In contrast, two studies did not find any significant relationship between them.36,37 These discrepancies among previous studies might be due to several reasons. Firstly, the region and ethnicity were different. The study by van den Berg et al32 were performed in Germany, while the other studies were performed in China. Secondly, the age of participants was varied among studies. In the study by Xu et al, all participants were equal to or more than 65 years.36 In a study by Tao et al, the age was unrestricted.37 In the study by Liu et al, the age of participants ranged from 35 to 60 years.33 In the study by Ma et al, the mean (±SD) of age was 30.0±7.2 years old.35 Thirdly, the disease characteristics of the study population were different among studies. In the studies by Tao et al,37 Xu et al,36 Ma et al35 and van den Berg et al32 euthyroid participants were selected. In the study by Ding et al34 patients with hepatitis B virus were enrolled. Fourthly, the study design was different among studies. The study by Liu et al was a randomized controlled trial exploring the impact of levothyroxine supplementation on the prevalence of NAFLD in patients with subclinical hypothyroidism,33 and the remaining studies were cross-sectional studies.
Thyroid hormones included triiodothyronine (T3), thyroxine (T4), thyroid-stimulating hormone (TSH), free triiodothyronine (fT3), and free thyroxine (fT4). Thyroid hormones are mostly bound to thyroxine-binding globulin in peripheral blood. The main thyroid hormones that play a physiological role are FT4 and FT3, and the physiological activity of FT3 is three to four times that of FT4. In our study, we found no significant correlation between other thyroid hormones (fT4, T3, T4 and TSH) and LiSA. This is partly due to the relatively small sample size of our study. Studies with larger sample sizes and prospective studies are needed in our future research. In addition, FT3 plays a direct role in the physiological function, and its level is more directly related to the metabolic state of the body. Therefore, the statistical results of FT3 are more sensitive than other thyroid hormone indicators (fT4, T3, T4 and TSH).
Our study was unique and different from the previous studies. First of all, we selected lean participants as the control group, and found no correlation between LiSA and thyroid hormone, suggesting that the correlation between LiSA and thyroid hormones only existed in overweight/obese participants. In the second place, the lean group and overweight/obese group in our research are similar in age, which greatly eliminates the influence of confounding factors of age differences. Thirdly, we conducted the subgroup analyses according to the degree of liver steatosis to further explore the clinical characteristics of different subgroup. In addition, we conducted the stepwise multivariate analyses to further evaluate the relationship of fT3 with LiSA and to eliminate the influence of other confounding factors. Last but not least, LiSA was used to evaluate the degree of NAFLD in our study, and the effectiveness and stability of LiSA are currently superior to other ultrasonic attenuation parameter.
Two major limitations in our research should be recognized. In the first place, the sample size in our study is relatively small, so the uncertainty caused by the correlation estimation of the small sample size will increase. Secondly, the present study cannot evaluate a direct causal relationship between thyroid hormones and LiSA, and further mechanism research and prospective cohort studies are necessary.
Conclusion
The present study is novel in specifically addressing the relationship between thyroid hormone and LiSA in Chinese overweight/obese subjects. Higher level of serum fT3 was independently associated with the degree of liver steatosis. The alterations in thyroid hormone levels may be an adaptation process of liver steatosis in obesity patients. Large-scale, multi-ethnic, multi-regional, population-based, prospective studies are still needed to confirm our findings.
Data Sharing Statement
The data that support the findings of this study are available from the corresponding author upon reasonable request.
Ethics Statement
The study was approved by the Ethics Committee of Ningbo First Hospital and was conducted in accordance with the Declaration of Helsinki.
Acknowledgments
Shuqin Chen and Yong Jin contributed equally to this work. The study was supported by the Major Program of Social Development of Ningbo Science and Technology Bureau (Grant No. 2019C50094) and the Medical Health Science and Technology Project of Zhejiang Province (Grant No. 2020KY255).
Author Contributions
All authors made a significant contribution to the work reported, whether that is in the conception, study design, execution, acquisition of data, analysis and interpretation, or in all these areas; took part in drafting, revising or critically reviewing the article; gave final approval of the version to be published; have agreed on the journal to which the article has been submitted; and agree to be accountable for all aspects of the work.
Disclosure
The authors declare no conflicts of interest in this work.
References
1. Chalasani N, Younossi Z, Lavine JE, et al. The diagnosis and management of nonalcoholic fatty liver disease: practice guidance from the American Association for the Study of Liver Diseases. Hepatology. 2018;67(1):328–357. doi:10.1002/hep.29367
2. Estes C, Anstee QM, Arias-Loste MT, et al. Modeling NAFLD disease burden in China, France, Germany, Italy, Japan, Spain, United Kingdom, and United States for the period 2016–2030. J Hepatol. 2018;69(4):896–904. doi:10.1016/j.jhep.2018.05.036
3. Brunt EM, Kleiner DE, Carpenter DH, et al. NAFLD: reporting histologic findings in clinical practice. Hepatology. 2021;73(5):2028–2038. doi:10.1002/hep.31599
4. Fan JG, Kim SU, Wong VW. New trends on obesity and NAFLD in Asia. J Hepatol. 2017;67(4):862–873. doi:10.1016/j.jhep.2017.06.003
5. Cotter TG, Rinella M. Nonalcoholic fatty liver disease 2020: the state of the disease. Gastroenterology. 2020;158(7):1851–1864. doi:10.1053/j.gastro.2020.01.052
6. Cariou B, Byrne CD, Loomba R, Sanyal AJ. Nonalcoholic fatty liver disease as a metabolic disease in humans: a literature review. Diabetes Obes Metab. 2021;23(5):1069–1083. doi:10.1111/dom.14322
7. Eslam M, Newsome PN, Sarin SK, et al. A new definition for metabolic dysfunction-associated fatty liver disease: an international expert consensus statement. J Hepatol. 2020;73(1):202–209. doi:10.1016/j.jhep.2020.03.039
8. Li Q, Dhyani M, Grajo JR, Sirlin C, Samir AE. Current status of imaging in nonalcoholic fatty liver disease. World J Hepatol. 2018;10(8):530–542. doi:10.4254/wjh.v10.i8.530
9. De Sousa Magalhães R, Xavier S, Magalhães J, Rosa B, Marinho C, Cotter J. Transient elastography through controlled attenuated parameter assisting the stratification of cardiovascular disease risk in NAFLD patients. Clin Res Hepatol Gastroenterol. 2021;45(5):101580. doi:10.1016/j.clinre.2020.11.010
10. Zhang X, Heredia NI, Balakrishnan M, Thrift AP. Prevalence and factors associated with NAFLD detected by vibration controlled transient elastography among US adults: results from NHANES 2017–2018. PLoS One. 2021;16(6):e0252164. doi:10.1371/journal.pone.0252164
11. Ren X, Xia S, Zhang L, et al. Analysis of liver steatosis analysis and controlled attenuation parameter for grading liver steatosis in patients with chronic hepatitis B. Quant Imaging Med Surg. 2021;11(2):571–578. doi:10.21037/qims-19-1091
12. Sasso M, Beaugrand M, de Ledinghen V, et al. Controlled attenuation parameter (CAP): a novel VCTE™ guided ultrasonic attenuation measurement for the evaluation of hepatic steatosis: preliminary study and validation in a cohort of patients with chronic liver disease from various causes. Ultrasound Med Biol. 2010;36(11):1825–1835. doi:10.1016/j.ultrasmedbio.2010.07.005
13. Sinha RA, Bruinstroop E, Singh BK, Yen PM. Nonalcoholic fatty liver disease and hypercholesterolemia: roles of thyroid hormones, metabolites, and agonists. Thyroid. 2019;29(9):1173–1191. doi:10.1089/thy.2018.0664
14. Ritter MJ, Amano I, Hollenberg AN. Thyroid hormone signaling and the liver. Hepatology. 2020;72(2):742–752. doi:10.1002/hep.31296
15. Liu Y, Wang W, Yu X, Qi X. Thyroid function and risk of non-alcoholic fatty liver disease in euthyroid subjects. Ann Hepatol. 2018;17(5):779–788. doi:10.5604/01.3001.0012.3136
16. Jin Y, Zhou Y, Wang X, et al. Association between thyroid hormones and visceral fat area in the patients with type 2 diabetes. Chi J Endocrinol Metab. 2020;(02):
17. Endocrinology Branch of the Chinese Medical Association, Diabetes Branch of Chinese Medical Association, Obesity and Diabetes Surgeons Committee of Surgeons Branch of Chinese Medical Doctor Association. Multidisciplinary clinical consensus on diagnosis and treatment of obesity (2021 edition). Chi J Digest Surg. 2021;20(11):1137–1152. doi:10.3760/cma.j.cn115610-20210829-00422
18. Sasso M, Miette V, Sandrin L, Beaugrand M. The controlled attenuation parameter (CAP): a novel tool for the non-invasive evaluation of steatosis using Fibroscan. Clin Res Hepatol Gastroenterol. 2012;36(1):13–20. doi:10.1016/j.clinre.2011.08.001
19. Knudsen N, Laurberg P, Rasmussen LB, et al. Small differences in thyroid function may be important for body mass index and the occurrence of obesity in the population. J Clin Endocrinol Metab. 2005;90(7):4019–4024. doi:10.1210/jc.2004-2225
20. Motamed B, Eftekharzadeh A, Hosseinpanah F, Tohidi M, Hasheminia M, Azizi F. The relation between changes in thyroid function and anthropometric indices during long-term follow-up of euthyroid subjects: the Tehran Thyroid Study (TTS). Eur J Endocrinol. 2016;175(4):247–253. doi:10.1530/eje-16-0414
21. Shin JA, Mo EY, Kim ES, Moon SD, Han JH. Association between lower normal free thyroxine concentrations and obesity phenotype in healthy euthyroid subjects. Int J Endocrinol. 2014;2014:104318. doi:10.1155/2014/104318
22. Ren R, Jiang X, Zhang X, et al. Association between thyroid hormones and body fat in euthyroid subjects. Clin Endocrinol (Oxf). 2014;80(4):585–590. doi:10.1111/cen.12311
23. Roef GL, Rietzschel ER, Van Daele CM, et al. Triiodothyronine and free thyroxine levels are differentially associated with metabolic profile and adiposity-related cardiovascular risk markers in euthyroid middle-aged subjects. Thyroid. 2014;24(2):223–231. doi:10.1089/thy.2013.0314
24. Teixeira P, Dos Santos PB, Pazos-Moura CC. The role of thyroid hormone in metabolism and metabolic syndrome. Ther Adv Endocrinol Metab. 2020;11:2042018820917869. doi:10.1177/2042018820917869
25. Cabanelas A, Lisboa PC, Moura EG, Pazos-Moura CC. Acute effects of leptin on 5’-deiodinases are modulated by thyroid state of fed rats. Horm Metab Res. 2007;39(11):818–822. doi:10.1055/s-2007-991169
26. Macek Jílková Z, Pavelka S, Flachs P, Hensler M, Kůs V, Kopecký J. Modulation of type I iodothyronine 5’-deiodinase activity in white adipose tissue by nutrition: possible involvement of leptin. Physiol Res. 2010;59(4):561–569. doi:10.33549/physiolres.931866
27. Araujo RL, Andrade BM, Padrón AS, et al. High-fat diet increases thyrotropin and oxygen consumption without altering circulating 3,5,3’-triiodothyronine (T3) and thyroxine in rats: the role of iodothyronine deiodinases, reverse T3 production, and whole-body fat oxidation. Endocrinology. 2010;151(7):3460–3469. doi:10.1210/en.2010-0026
28. Roef G, Lapauw B, Goemaere S, et al. Body composition and metabolic parameters are associated with variation in thyroid hormone levels among euthyroid young men. Eur J Endocrinol. 2012;167(5):719–726. doi:10.1530/eje-12-0447
29. Younossi ZM. Non-alcoholic fatty liver disease - A global public health perspective. J Hepatol. 2019;70(3):531–544. doi:10.1016/j.jhep.2018.10.033
30. Targher G, Corey KE, Byrne CD, Roden M. The complex link between NAFLD and type 2 diabetes mellitus - mechanisms and treatments. Nat Rev Gastroenterol Hepatol. 2021;18(9):599–612. doi:10.1038/s41575-021-00448-y
31. Mantovani A, Scorletti E, Mosca A, Alisi A, Byrne CD, Targher G. Complications, morbidity and mortality of nonalcoholic fatty liver disease. Metabolism. 2020;111s:154170. doi:10.1016/j.metabol.2020.154170
32. van den Berg EH, van Tienhoven-wind LJ, Amini M, et al. Higher free triiodothyronine is associated with non-alcoholic fatty liver disease in euthyroid subjects: the Lifelines Cohort Study. Metabolism. 2017;67:62–71. doi:10.1016/j.metabol.2016.11.002
33. Liu G, Zheng X, Guan L, et al. Free triiodothyronine levels are positively associated with non-alcoholic fatty liver disease in euthyroid middle-aged subjects. Endocr Res. 2015;40(4):188–193. doi:10.3109/07435800.2014.987399
34. Ding WJ, Wang MM, Wang GS, Shen F, Qin JJ, Fan JG. Thyroid function is associated with non-alcoholic fatty liver disease in chronic hepatitis B-infected subjects. J Gastroenterol Hepatol. 2015;30(12):1753–1758. doi:10.1111/jgh.12998
35. Ma D, Zeng J, Huang B, et al. Independent associations of thyroid-related hormones with hepatic steatosis and insulin resistance in euthyroid overweight/obese Chinese adults. BMC Gastroenterol. 2021;21(1):431. doi:10.1186/s12876-021-02011-0
36. Xu C, Xu L, Yu C, Miao M, Li Y. Association between thyroid function and nonalcoholic fatty liver disease in euthyroid elderly Chinese. Clin Endocrinol (Oxf). 2011;75(2):240–246. doi:10.1111/j.1365-2265.2011.04016.x
37. Tao Y, Gu H, Wu J, Sui J. Thyroid function is associated with non-alcoholic fatty liver disease in euthyroid subjects. Endocr Res. 2015;40(2):74–78. doi:10.3109/07435800.2014.952014
 © 2022 The Author(s). This work is published and licensed by Dove Medical Press Limited. The full terms of this license are available at https://www.dovepress.com/terms.php and incorporate the Creative Commons Attribution - Non Commercial (unported, v3.0) License.
By accessing the work you hereby accept the Terms. Non-commercial uses of the work are permitted without any further permission from Dove Medical Press Limited, provided the work is properly attributed. For permission for commercial use of this work, please see paragraphs 4.2 and 5 of our Terms.
© 2022 The Author(s). This work is published and licensed by Dove Medical Press Limited. The full terms of this license are available at https://www.dovepress.com/terms.php and incorporate the Creative Commons Attribution - Non Commercial (unported, v3.0) License.
By accessing the work you hereby accept the Terms. Non-commercial uses of the work are permitted without any further permission from Dove Medical Press Limited, provided the work is properly attributed. For permission for commercial use of this work, please see paragraphs 4.2 and 5 of our Terms.