")
Back to Journals » Diabetes, Metabolic Syndrome and Obesity » Volume 15
Relationship Between Subclinical Cardiovascular Diseases and Cardiac Morpho-Functional Parameters in Preclinical Stage A/B Heart Failure Adults with Type 2 Diabetes
Authors Xiao Y , Yao XY, Wang YH, Han LW, Li LX, Li M, Gao S
Received 19 August 2022
Accepted for publication 25 November 2022
Published 15 December 2022 Volume 2022:15 Pages 3923—3931
DOI https://doi.org/10.2147/DMSO.S385088
Checked for plagiarism Yes
Review by Single anonymous peer review
Peer reviewer comments 2
Editor who approved publication: Professor Gian Paolo Fadini
Yan Xiao,1 Xin-Yue Yao,1 Yong-Hui Wang,1 Lan-Wen Han,1 Lian-Xia Li,1 Ming Li,2 Shan Gao3
1Department of Endocrinology, Beijing Chaoyang Hospital, Capital Medical University, Beijing, People’s Republic of China; 2Department of Endocrinology, National Health Commission (NHC) Key Laboratory of Endocrinology, Peking Union Medical College Hospital, Peking Union Medical College and Chinese Academy of Medical Sciences, Beijing, People’s Republic of China; 3Department of Endocrinology, Beijing Xuanwu Hospital, Capital Medical University, Beijing, People’s Republic of China
Correspondence: Shan Gao, Department of Endocrinology, Beijing Xuanwu Hospital, Capital Medical University, No. 45 Changchun Street, Xuanwu District, Beijing, 100053, People’s Republic of China, Tel +8613910599635, Email [email protected]
Purpose: Type 2 diabetes mellitus (T2DM) is a common risk factor for cardiovascular disease which increases the risk of heart failure. This study aimed to determine whether clinical characteristics and subclinical cardiovascular disease (CVD) features are correlated with echocardiographic morpho-functional parameters of T2DM patients.
Patients and Methods: Two hundred and fifty-five T2DM patients without a history of coronary heart disease were enrolled in this cross-sectional study. The demographic characteristics, glucose and lipid levels were assessed for each patient. Carotid ultrasonography and peripheral artery examination were performed to measure carotid intima-media thickness (cIMT), carotid plaque, ankle-brachial index (ABI), brachial artery pulse wave velocity (baPWV), and carotid-femoral pulse wave velocity (cfPWV). Furthermore, echocardiography was conducted to evaluate cardiac morphology and systolic and diastolic function. The relationship between clinical characteristics, subclinical cardiovascular diseases, and cardiac morpho-functional parameters was explored with the Pearson and stepwise multivariable linear regression analyses.
Results: A total of 255 subjects aged 18– 80 years were enrolled in the study. Multiple regression analysis revealed that left ventricular mass index (LVMI) was correlated with age (β=0.463, p = 0.000) and systolic blood pressure (SBP) (β=0.179, p = 0.003). Relative wall thickness (RWT) was related to cfPWV (β=0.006, p = 0.007) and homeostasis model assessment of insulin resistance (HOMA-IR) (β=0.000, p = 0.036). In contrast, left ventricular ejection fraction (LVEF) was inversely related to cIMT (β=− 0.925, p = 0.019). The ratio of the peak flow velocity of early diastole to atrial contraction (peak E/A) was correlated with age (β=− 0.014, p = 0.000), diastolic blood pressure (DBP) (β=− 0.006, p = 0.001) and cfPWV (β=− 0.025, p = 0.044).
Conclusion: In preclinical stage A/B heart failure adults with T2DM, age, BP, HOMA-IR, cfPWV and cIMT are correlated with cardiac morpho-functional parameters.
Keywords: type 2 diabetes mellitus, preclinical stage A/B heart failure, subclinical cardiovascular diseases, echocardiography
Introduction
Type 2 diabetes mellitus (T2DM) is mainly caused by a decrease in β-cell insulin secretion in the context of insulin resistance.1 The global diabetes atlas released by the International Diabetes Federation in 2021 reported that about 537 million adults (20–79 years old) worldwide had diabetes, and the prevalence is expected to rise to 643 million by 2030 and 783 million by 2045. China has the highest number of people with diabetes (n=140.9 million, aged 20–79), which is expected to remain unchanged by 2045 (n=174.4 million).2,3 T2DM is the most common cardiovascular risk factor and has been shown to be associated with increased risk of heart failure. The prevalence of heart failure in T2DM patients is estimated to be 9–22%, which is 4 times higher than that of the non-diabetic population, with an even higher prevalence in T2DM people over 60 years old.4 Studies have shown that hyperglycemia, hyperinsulinemia, insulin resistance, and other risk factors of T2DM jointly promote cardiac interstitial fibrosis and cardiac stiffness/diastolic dysfunction by inducing systemic metabolic disorders, oxidative stress and other pathophysiological processes, which in turn lead to systolic dysfunction and heart failure.5,6 The 2022 AHA/ACC/HFSA guidelines for the management of heart failure classify the condition into four stages based on clinical symptoms and potential pathophysiological changes.7 T2DM patients without symptoms of heart failure are classified as preclinical stage A or stage B. The number of patients in stage B is estimated to be twice that of patients in stage C and D combined, and patients who transition from stage B to stage C exhibit a five-fold increase in mortality.8,9 Stage A/B heart failure patients are asymptomatic for signs of heart failure but manifest changes such as increased left ventricular mass, diastolic dysfunction, and impaired LV deformation, which are related to poor prognosis and reduced survival.4,8,10,11 Therefore, early identification and intervention of stage A/B heart failure patients who may progress to stage C/D heart failure is crucial.
Growing evidence suggests that arterial stiffness is associated with a variety of cardiovascular diseases, including heart failure. It is also an independent risk factor for the development of cardiovascular diseases and is an important predictor of cardiovascular events and death.12–14 To date, few studies have investigated associations among clinical indexes, arterial stiffness markers (ankle-brachial index [ABI], carotid-femoral pulse wave velocity [cfPWV], brachial artery pulse wave velocity [baPWV]), and subclinical arteriosclerosis indicators (carotid intima-media thickness [cIMT], carotid plaque) and cardiac morpho-functional parameters in preclinical stage A/B heart failure individuals with T2DM. The 2019 ESC Guidelines on diabetes, pre-diabetes, and cardiovascular diseases, developed in collaboration with the EASD, indicate that echocardiography is the first-line method for evaluating structural and functional abnormalities associated with DM. Therefore, our study aimed to investigate the correlations among clinical parameters, subclinical cardiovascular disease measures (ABI, cfPWV, baPWV, cIMT, carotid plaque), and echocardiographic morpho-functional parameters in preclinical stage A/B heart failure patients with T2DM.
Research Design and Methods
Participants
Diabetes mellitus patients aged 18–80 years who were treated in the Department of Endocrinology, Beijing Chaoyang Hospital West Branch from March 2021 to March 2022 were enrolled in this study. The participants were either previously diagnosed with diabetes and treated with insulin and/or oral hypoglycemic drugs or were newly diagnosed according to the 2021 ADA Classification and Diagnosis of Diabetes: Standards of Medical Care in Diabetes. Exclusion criteria were: (1) type 1 diabetes, gestational diabetes and other special types of diabetes; (2) acute complications of diabetes or severe infection; (3) presence of heart failure, coronary artery diseases, cardiac arrhythmia, moderate or severe valvular heart disease, cardiomyopathy and cardiovascular symptoms (such as angina pectoris); (4) eGFR <30 mL/minute/1.7m2; (5) impaired consciousness or refusal to sign informed consent. The study protocol was approved by the Ethics Committee of Peking Union Medical Hospital and respected the ethical principles of the Declaration of Helsinki for medical research involving human subjects. Written informed consent was obtained from all participants.
Demographic Characteristics and Clinical Assessments
After admission, the height and weight of the patients were measured, and BMI was calculated as weight divided by height squared. The blood pressure (BP) was measured three times in a sitting position after resting for at least 30 minutes, and the average of the last two measurements was taken. Lifestyle factors, health history, and medication status were obtained through questionnaires and medical record review. Smoking was self-reported, and was divided into current smoking and no smoking, whereas alcohol intake status was based on self-reported current alcohol intake (yes/no). Venous blood samples were drawn from all participants to evaluate glucose and lipids levels as well as liver and kidney function after fasting for at least 8 hours. Insulin resistance was assessed using the homeostasis model assessment of insulin resistance (HOMA-IR), calculated as fasting insulin (uIU/mL) × fasting blood glucose (mmol/l)/22.5.15 The CKD-EPI formula was used to calculate the estimated glomerular filtration rate (eGFR) according to the 2012 guidelines for the evaluation and management of chronic kidney disease.16
Subclinical Cardiovascular Indicators
Ultrasonic images of the carotid artery were obtained by experienced physicians using a LOGIQ E9 ultrasonogram equipped with an 11L probe. The probe was placed parallel to the vessel wall, and the carotid artery intimal medial thickness (cIMT) (right and left cIMT mean), defined as the vertical distance from the superior edge of intima to the superior edge of adventitia, was measured at the distal segment of common carotid artery (1–1.5cm below the level of bifurcation) and/or the bulb of the common carotid artery (where the initial segment of the internal carotid artery was relatively enlarged). Plaques were defined as protrusions from the lumen or localized thickening above 50% of the peripheral IMT. The presence or absence of plaques was also analyzed.
ABI and PWV were automatically obtained through the ABI-system 100 non-invasive peripheral artery examination instrument. Briefly, the patient was placed on supine position, and the detection cuff was placed on the limbs according to standard procedures. The systolic blood pressure of the upper extremity artery and the dorsal pedal artery was measured synchronously. Bilateral ABI was obtained by dividing the dorsal pedal systolic pressure by upper extremity systolic pressure, and the average ABI was analyzed. The baroreceptor was placed at locations with visible pulsation (carotid-femoral artery and brachial artery-ankle artery), cfPWV and baPWV were recorded using the pulse wave velocity measuring device.
Echocardiography
A LOGIQ E9 ultrasonogram equipped with an M5S probe was used for non-invasive transthoracic echocardiography to record M-mode, two-dimensional and Doppler echocardiographic images. Standard views such as parasternal long-axis, parasternal short-axis and four-chamber views were visualized in the left recumbent position. Echocardiographic measurements were taken and analyzed by experienced physicians. The collected cardiac morpho-functional parameters included interventricular septal thickness (IVST), left ventricular end-diastolic diameter (LVEDD), left ventricular posterior wall thickness (LVPWT), left ventricular mass index (LVMI), relative wall thickness (RWT), left ventricular ejection fraction (LVEF), the peak flow velocity of early diastole (peak E), atrial contraction (peak A), and the ratio of peak flow velocity of early diastole to atrial contraction (peak E/A). LVM was calculated using the Penn-cube formula: LVM (g) = 1.04* [(IVST LVPWT LVEDD) ³- (LVEDD) ³]-13.6.17 Cardiac hypertrophy was evaluated based on LVMI index which was used to adjust for the influence of growth among individuals with the following formula: LVMI (g/m2) = LVM/body surface area (BSA). Relative wall thickness (RWT) = 2*(left ventricular posterior wall thickness/left ventricular end-diastolic diameter).18
Statistical Analysis
Normality was assessed using histograms. Variables without normal distribution, such as insulin and TG, were normalized by transforming them using the natural logarithm (Ig-transformed) to assume a normal distribution. Continuous data were expressed as mean [±standard deviation (SD)], whereas categorical variables were expressed as a percentage. Pearson’s correlation analysis was conducted to identify associations between clinical characteristics, sub-clinical cardiovascular disease measures, echocardiographic parameters of cardiac structure and function. Stepwise multiple linear regression (MLR) was performed to investigate the relationships between clinical characteristics, sub-clinical cardiovascular disease indicators and echocardiographic parameters. The stepping criteria employed for entry and removal were based on the significance level of the F-value and set at 0.05 and 0.1, respectively. Multiple imputations by chained equations (MICE) method was used to estimate missing values.19 Statistical analyses were conducted using the SPSS version 26 (Statistical Package for Social Sciences, Chicago, IL, USA). A p-value <0.05 (two-sided) was considered statistically significant.
Results
The study protocol is shown in Figure 1.
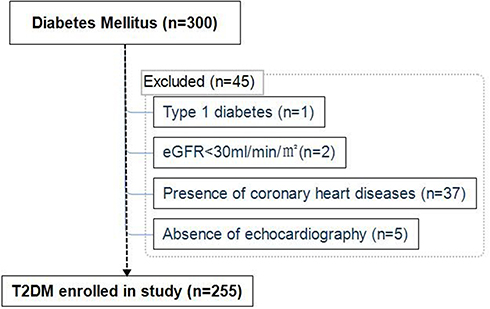 |
Figure 1 Study protocol. At baseline 300 participants with diabetes mellitus were recruited; 45 subjects were excluded and reasons for ineligibility are shown. A total of 255 subjects with T2DM were finally included in the analyses. Abbreviations: eGFR, estimated glomerular filtration; T2DM, type 2 diabetes mellitus. |
Characteristics of Participants
The clinical and subclinical arterial disease features and echocardiographic measures of the study participants are shown in Tables 1 and 2. Of the 255 participants, 177 (69.4%) were male, with an average age of 49.82 ±12.28 years, average BMI of 27.16 ±5.05kg/m2, average HbA1c of 9.52 ±1.97%, and a median duration of diabetes of 5.00 (1.00, 11.00) years.
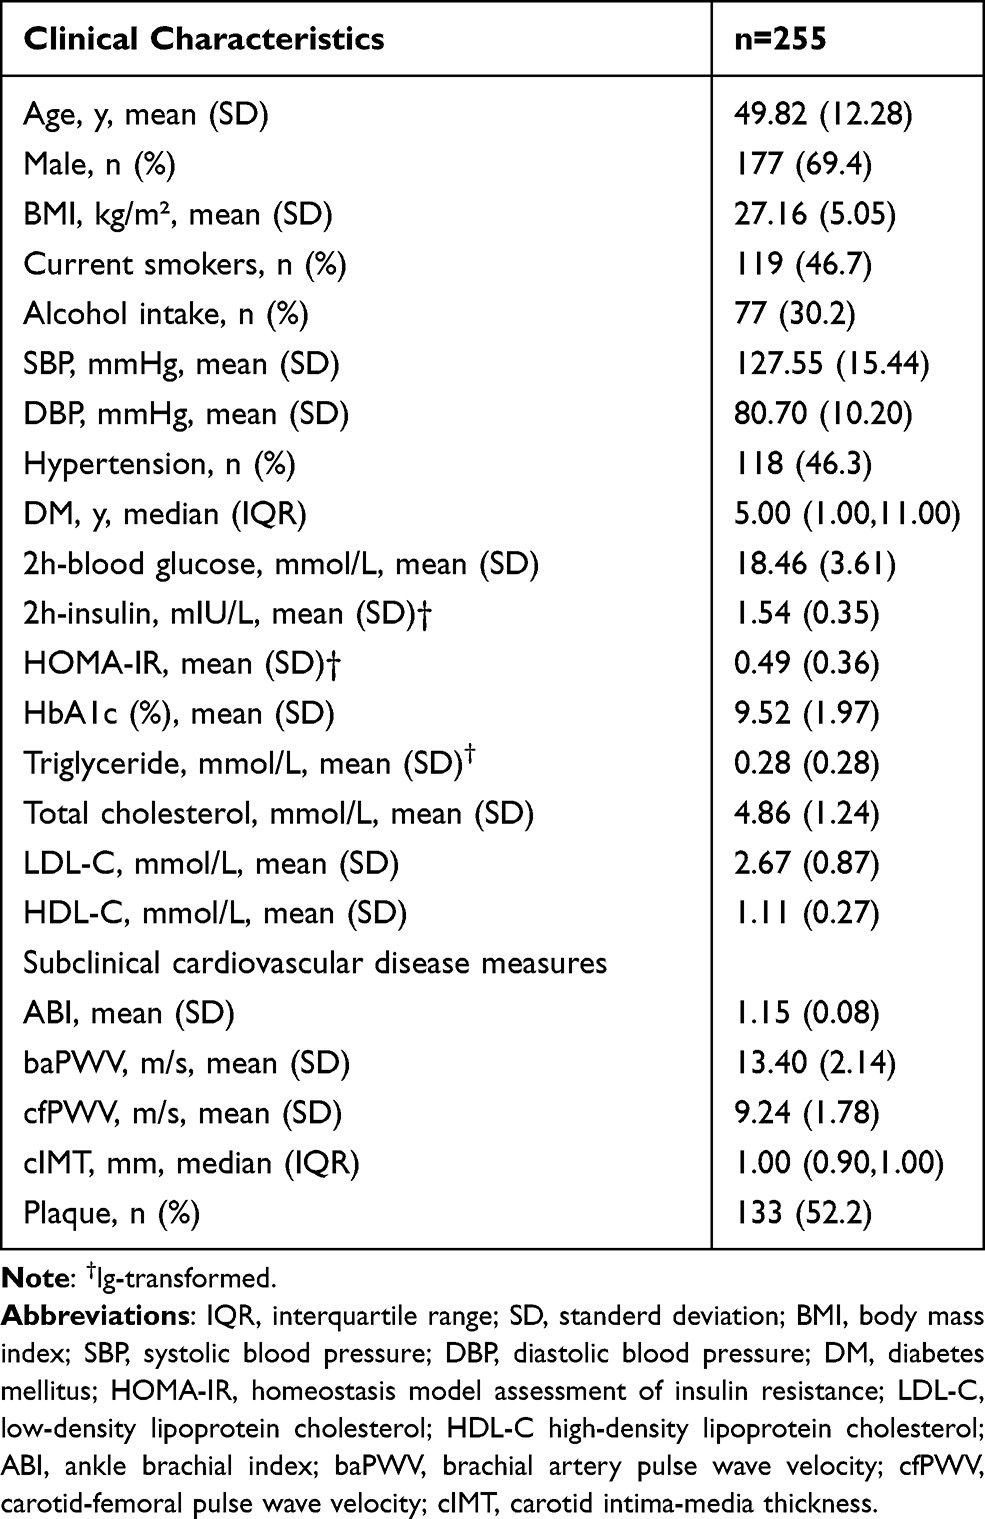 |
Table 1 Demographic, Anthropometric, Biochemical and Subclinical Cardiovascular Diseases Characteristics |
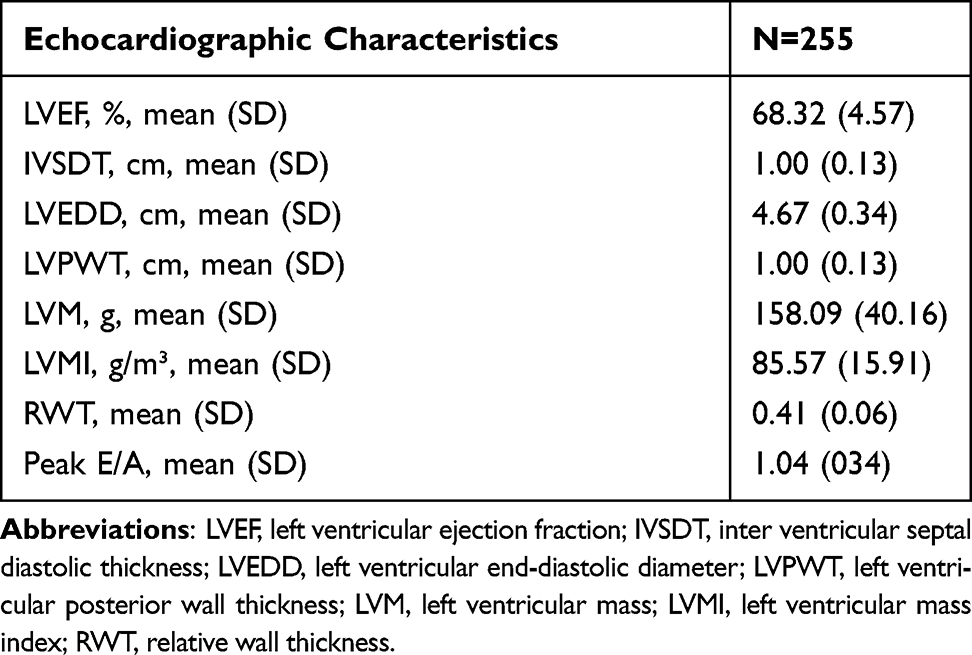 |
Table 2 Cardiac Morpho-Functional Parameters |
Of the 255 T2DM patients, 86.3% received glucose-lowering therapy, and 38.8% were put on insulin therapy. Notably, 46.3% of participants had hypertension, with an antihypertensive treatment rate of 80.5%. All patients showed an LVEF greater than 50%. Analysis of LVMI and RWT revealed that 46.7% of the participants had left ventricular hypertrophy (data not shown).
Correlations Between Clinical, Subclinical Cardiovascular Diseases Measures and Echocardiographic Parameters
Tables 3 and 4 display the results of univariate correlation analysis and multiple linear regression, respectively. In univariate correlation analysis, LVMI was not only correlated with gender (r = 0.166, p = 0.008), age (r = 0.376, p = 0.000), SBP (r = 0.220, p = 0.000) and duration of T2DM (r = 0.181, p = 0.004), but also with cfPWV (r = 0.193, p = 0.002) and carotid plaque (r = 0.173, p = 0.006). In contrast, multiple regression analysis revealed a correlation with age (β=0.463), SBP (β=0.179), and 2h insulin (β=−0.024). In univariable correlation analysis, cfPWV (r = 0.143, p = 0.022) was significantly correlated with RWT. However, in multiple regression analysis, cfPWV (β=0.006) and HOMA-IR (β=0.000) were found to be independently associated with RWT. In addition, LVEF was correlated with cIMT both in univariable correlation analysis and multiple linear regression analysis. Finally, the peak E/A was associated with age (r=−0.538, p = 0.000), BMI (r = 0.204, p = 0.001), SBP (r=−0.226, p = 0.000), duration of T2DM (r=−0.276, p = 0.000), baPWV (r=−0.337, p = 0.000), cfPWV (r=−0.418, p = 0.000), carotid plaque (r=−0.317, p = 0.000). However, it was only correlated with age (β=−0.014), DBP (β=−0.006) and cfPWV (β=−0.025) after adjusting for variables.
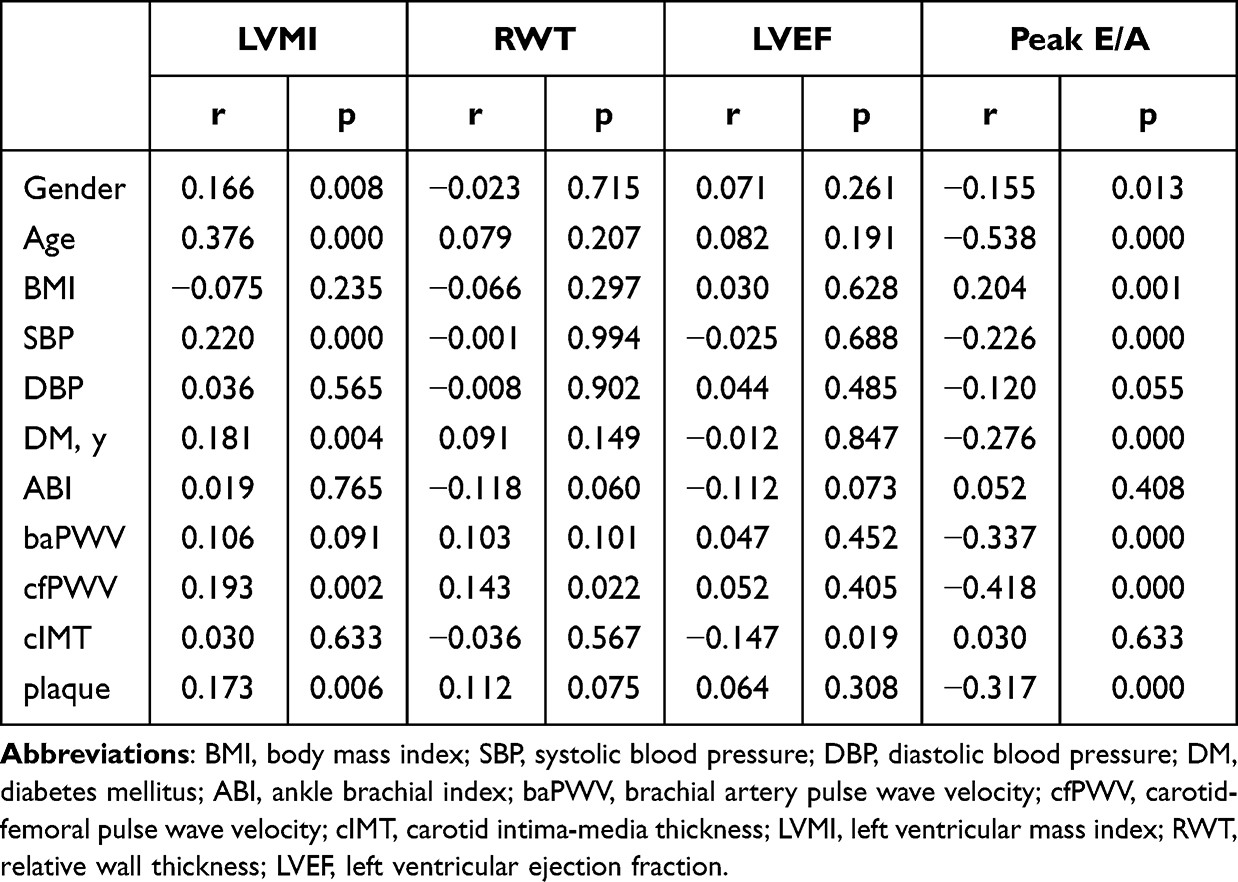 |
Table 3 Correlation Between Clinical, Subclinical Cardiovascular Diseases Characteristics and Cardiac Parameters |
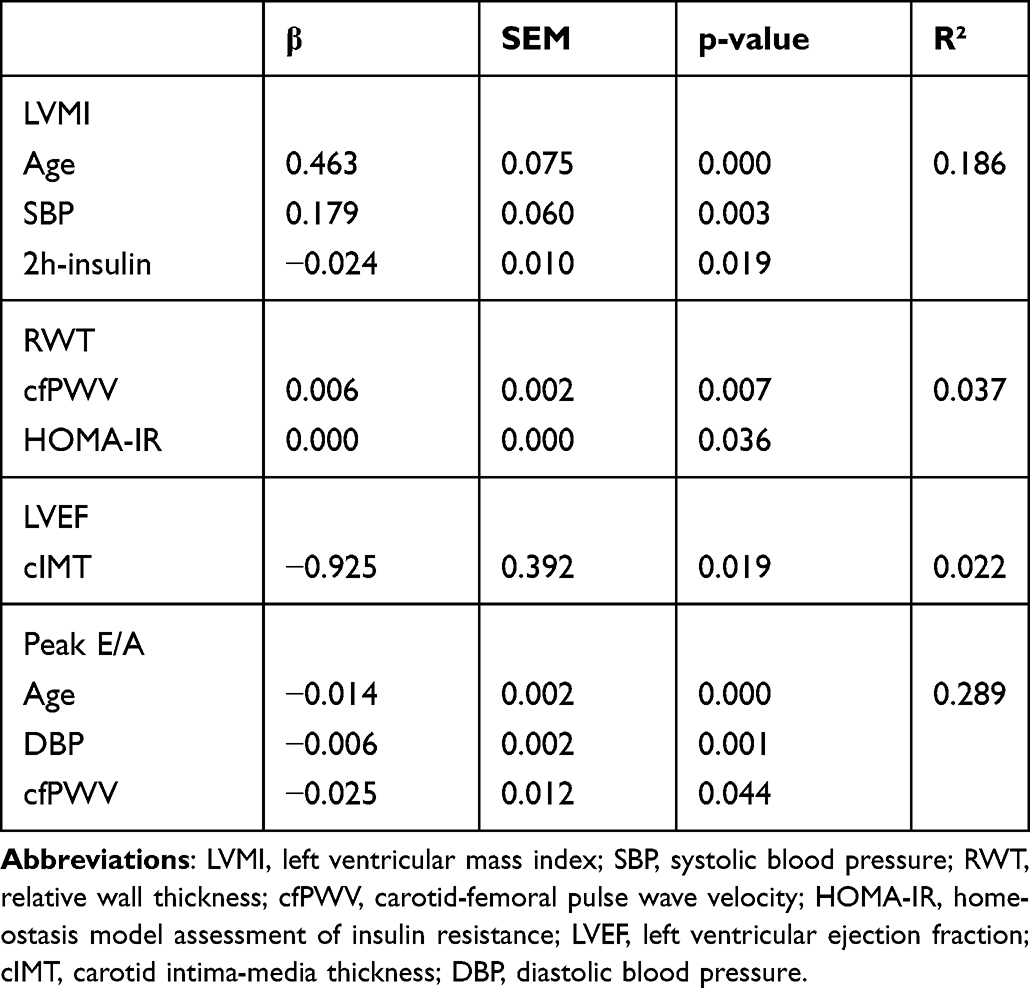 |
Table 4 Multivariable Associations Between Clinical, Subclinical Cardiovascular Diseases Characteristics and Cardiac Parameters |
Discussion
In this study, we examined the relationship between several indicators of subclinical CVD and cardiac morpho-functional parameters in preclinical stage A/B HF patients with T2DM.
Consistent with previous reports, cardiac function was correlated with age and systolic and diastolic blood pressure.20 No association was found between BMI, duration of diabetes, glycaemic control, such as HbA1c, and cardiac morpho-functional parameters.
In addition, RWT was associated with HOMA-IR whereas LVMI was negatively associated with 2-hour insulin levels in stepwise multivariate regression analysis. Notably, LVMI increased by 0.024 for every 1 unit decrease in 2h-insulin (P = 0.019). Numerous studies have shown that insulin resistance/hyperinsulinemia can lead to LVH through direct or indirect mechanisms, such as, lipotoxicity, glucotoxicity, myocardial hypertrophy and matrix remodeling, enhanced activity of the sympathetic system, overactivation of the renin-angiotensin-aldosterone system (RAAS). These effects can also induce arteriosclerosis leading to left ventricular hypertrophy and remodeling.21–23 Most studies have shown that fasting insulin levels and HOMA-IR may be indicators of insulin resistance/hyperinsulinism.15 To date, a limited number of studies exists regarding the correlation between 2h-insulin levels post oral glucose tolerance (OGTT) and diabetes and/or its complications. Previously, Wang et al24 found that 2-hour insulin levels can reflect insulin resistance/hyperinsulinemia and affect cardiac structure and function. Here, we found a negative correlation between 2-hour insulin levels and LVMI, which is inconsistent with the findings by Velagaleti et al.25 This discrepancy may be caused by factors associated with patient selection. For instance, patients in our study had a moderate duration of T2DM with a median duration of 5 years. Moreover, almost all patients included in the study had HbA1c above 7% and the mean HbA1c was 9.52%. It appears that participants in our study had poor glycemic control at least in the past three months. Poor diabetes control may lead to overstimulation of pancreatic β cell and then influence the measurement of insulin levels. Moreover, 38.8% of patients received exogenous insulin, which may affect measurement of insulin levels and correlation of LVMI with 2h insulin. Therefore, we re-analyzed the correlation of subclinical cardiovascular disease indicators and cardiac parameters after excluding T2DM patients who had been treated with exogenous insulin. LVMI was found to have no association with 2h insulin (data not shown). Additionally, the indicators used in our study did not fully reflect islet function. Therefore, further research should investigate plasma glucose, C-peptide and insulin levels at five time points (0′, 15′, 30′, 1 and 2 hour post oral glucose tolerance test) to fully assess islet function.
RWT and peak E/A were associated with cfPWV, which was consistent with results from previous studies.12,26 An increase in 1 unit of cfPWV was associated with a 0.006 increase in RWT (P = 0.007) and a 0.025 decrease in E/A (P = 0.044). Previous studies have demonstrated that arterial stiffness increases the central systolic blood pressure thereby increasing left ventricular afterload, which in turn causes myocardial hypertrophy and impaired relaxation function. A decrease in central diastolic pressure caused by arterial stiffness can reduce coronary perfusion, subendocardial ischemia and induce myocardial fibrosis. These adverse effects result in left ventricular stiffness, remodeling, and diastolic dysfunction.13,27
Univariate Pearson’s correlation analysis revealed an inverse correlation between cIMT and LVEF. The LVEF remained to be an independent risk factor associated with cIMT in stepwise multivariate linear regression analysis after adjustment for traditional cardiovascular risk factors and T2DM indicators. Moreover, LVEF increased by 0.925% for every 1-unit decrease in cIMT (P = 0.019). In a study involving 338 obese T2DM patients, Mehta et al found a negative correlation between cIMT and left ventricular global longitudinal strain (LVGLS) but not LVEF.28 We speculate that there may be a correlation between subclinical cIMT and cardiac systolic parameters. The inconsistency in results from different studies may be due to variations in sensitivity of LVEF and LVGLS as indicators of systolic cardiac function. The study by Chahal et al indicated that carotid plaque disease but not cIMT was closely related to LVEF in multiple linear regression analysis.29 The carotid plaque, which is another indicator of subclinical atherosclerosis, was not associated with LVEF in the study. Carotid plaque and cIMT are different biological and genetic phenotypes of subclinical atherosclerosis, and previous studies have shown that they are associated with several cardiovascular risk factors and are indicators of cardiovascular diseases, such as stroke and myocardial infarction.30,31 This discrepancy may be attributed to factors such as patient’s age. CIMT can be measured at all ages, whereas carotid plaque is more strongly associated with traditional risk factors and coronary artery disease and is more likely to appear in older people.31 The mechanism by which cIMT affects systolic cardiac function remains unclear, although it is speculated to induce chronic inflammation in patients with subclinical atherosclerosis, thereby causing left ventricular systolic dysfunction.32
This study has several strengths. Few studies have investigated preclinical stage A/B heart failure. Our study included stage A/B HF patients with T2DM diagnosed according to the latest heart failure guidelines. Moreover, we included several subclinical cardiovascular disease indicators to comprehensively study the factors related to heart function. However, there are some limitations that should also be acknowledged. Firstly, the data analyzed in our study are cross-sectional, and thus causal relationships between changes in subclinical cardiovascular indicators and cardiac function cannot be determined. Secondly, the enrolled cohort mainly included hospitalized T2DM patients, and thus our conclusions cannot be extrapolated to other populations. Finally, in clinical practice, invasive hemodynamic measurements and detection of biomarkers, such as B-type natriuretic peptide (BNP) and N-terminal prohormone of B-type natriuretic peptide (NT-proBNP), are not performed for preclinical stage A/B HF patients. Therefore, cardiac function was based on non-invasive echocardiography. Furthermore, the indexes used in our study cannot fully reflect islet function. Therefore, future multicenter prospective studies are needed to further identify risk factors of preclinical stage A/B heart failure with T2DM.
Conclusion
We observed that the main risk factors of LVMI were age, systolic blood pressure and 2h insulin level, while the main factors influencing RWT were cfPWV and HOMA-IR. In addition, LVEF was related to cIMT; peak E/A was mainly related to age, DBP and cfPWV. Therefore, effective blood pressure control and carotid artery ultrasound and peripheral vascular examination may be beneficial to patients with T2DM. Given that the data analyzed in this study are cross-sectional, future investigations are needed to identify clinical and subclinical cardiovascular disease indicators related to cardiac parameters over a long period of time.
Data Sharing Statement
The datasets generated during and/or analyzed during the current study are available from the corresponding author on reasonable request.
Ethical Approval
Our research has been approved by the ethics review board of Peking Union Medical Hospital, China. The ID of the approval was J5-2564. Informed consent for participation was obtained in this study. All procedures performed in the study involving human participants were in accordance with the Helsinki declaration and its later amendments or comparable ethical standards.
Consent to Publication
The authors declare that we agree to the publication of the detail of article.
Acknowledgment
We are grateful to Dr Yonghui Wang for help in the implementation of this study.
Funding
The work was supported by a grant from the Capital health research and development of special (No. 2020-2Z-40117).
Disclosure
The authors declare that there is no conflict of interests.
References
1. Draznin B, Aroda VR, Bakris G, et al; American Diabetes Association Professional Practice Committee. Classification and diagnosis of diabetes: standards of medical care in diabetes-2022. Diabetes Care. 2022;45(Suppl1):S17–S38. doi:10.2337/dc22-S002
2. IDF Diabetes Atlas. IDF diabetes Atlas.10th edn. International Diabetes Federation; 2021. Available from: https://diabetesstlas.org.
3. Tinajero MG, Malik VS. An update on the epidemiology of type 2 diabetes. Endocrinol Metab Clin North Am. 2021;50(3):337–355. doi:10.1016/j.ecl.2021.05.013
4. Dunlay SM, Givertz MM, Aguilar D, et al. Type 2 diabetes mellitus and heart failure: a scientific statement from the American Heart Association and the Heart Failure Society of America: this statement does not represent an update of the 2017 ACC/AHA/HFSA heart failure guideline update. Circulation. 2019;140(7):e294–e324. doi:10.1161/cir.0000000000000691
5. Jia G, Whaley-Connell A, Sowers JR. Diabetic cardiomyopathy: a hyperglycaemia- and insulin-resistance-induced heart disease. Diabetologia. 2018;61(1):21–28. doi:10.1007/s00125-017-4390-4
6. Kenny HC, Abel ED. Heart failure in type 2 diabetes mellitus. Circ Res. 2019;124(1):121–141. doi:10.1161/CIRCRESAHA.118.311371
7. Heidenreich PA, Bozkurt B, Aguilar D, et al. 2022 AHA/ACC/HFSA guideline for the management of heart failure: a report of the American College of Cardiology/American Heart Association joint committee on clinical practice guidelines. J Am Coll Cardiol. 2022;79(17):e263–e421. doi:10.1016/j.jacc.2021.12.012
8. Kale P, Afzal A. Stage B heart failure: to strain or not to strain. JACC Cardiovasc Imaging. 2018;11(10):1401–1404. doi:10.1016/j.jcmg.2018.04.022
9. Sørensen MH, Bojer AS, Broadbent DA, Plein S, Madsen PL, Gæde P. Cardiac perfusion, structure, and function in type 2 diabetes mellitus with and without diabetic complications. Eur Heart J Cardiovasc Imaging. 2020;21(8):887–895. doi:10.1093/ehjci/jez266
10. Goldberg LR, Jessup M. Stage B heart failure: management of asymptomatic left ventricular systolic dysfunction. Circulation. 2006;113(24):2851–2860. doi:10.1161/CIRCULATIONAHA.105.600437
11. Gong FF, Campbell DJ, Prior DL. Noninvasive cardiac imaging and the prediction of heart failure progression in preclinical stage A/B subjects. JACC Cardiovasc Imaging. 2017;10(12):1504–1519. doi:10.1016/j.jcmg.2017.11.001
12. Chow B, Rabkin SW. The relationship between arterial stiffness and heart failure with preserved ejection fraction: a systemic meta-analysis. Heart Fail Rev. 2015;20(3):291–303. doi:10.1007/s10741-015-9471-1
13. Chirinos JA, Segers P, Hughes T, Townsend R. Large-artery stiffness in health and disease: JACC state-of-the-art review. J Am Coll Cardiol. 2019;74(9):1237–1263. doi:10.1016/j.jacc.2019.07.012
14. Hill MA, Yang Y, Zhang L, et al. Insulin resistance, cardiovascular stiffening and cardiovascular disease. Metabolism. 2021;119:154766. doi:10.1016/j.metabol.2021.154766
15. Matthews DR, Hosker JP, Rudenski AS, Naylor BA, Treacher DF, Turner RC. Homeostasis model assessment: insulin resistance and beta-cell function from fasting plasma glucose and insulin concentrations in man. Diabetologia. 1985;28(7):412–419. doi:10.1007/bf00280883
16. Stevens PE, Levin A. Evaluation and management of chronic kidney disease: synopsis of the kidney disease: improving global outcomes 2012 clinical practice guideline. Ann Intern Med. 2013;158(11):825–830. doi:10.7326/0003-4819-158-11-201306040-00007
17. Devereux RB, Alonso DR, Lutas EM, et al. Echocardiographic assessment of left ventricular hypertrophy: comparison to necropsy findings. Am J Cardiol. 1986;57(6):450–458. doi:10.1016/0002-9149(86)90771-x
18. Lang RM, Badano LP, Mor-Avi V, et al. Recommendations for cardiac chamber quantification by echocardiography in adults: an update from the American Society of Echocardiography and the European Association of Cardiovascular Imaging. J Am Soc Echocardiogr. 2015;28(1):1–39 e14. doi:10.1016/j.echo.2014.10.003
19. Miyamura K, Nawa N, Isumi A, Doi S, Ochi M, Fujiwara T. The association of passive smoking and dyslipidemia among adolescence in Japan: results from A-CHILD study. J Clin Endocrinol Metab. 2021;106(7):e2738–e2748. doi:10.1210/clinem/dgab094
20. Li H, Hastings MH, Rhee J, Trager LE, Roh JD, Rosenzweig A. Targeting age-related pathways in heart failure. Circ Res. 2020;126(4):533–551. doi:10.1161/CIRCRESAHA.119.315889
21. Guo CA, Guo S. Insulin receptor substrate signaling controls cardiac energy metabolism and heart failure. J Endocrinol. 2017;233(3):R131–r143. doi:10.1530/joe-16-0679
22. Stanton AM, Vaduganathan M, Chang LS, Turchin A, Januzzi JL
23. Riehle C, Abel ED. Insulin signaling and heart failure. Circ Res. 2016;118(7):1151–1169. doi:10.1161/CIRCRESAHA.116.306206
24. Wang Y, Zhao H, Li Y, Zhang J, Tan J, Liu Y. Relationship between recurrent miscarriage and insulin resistance. Gynecol Obstet Invest. 2011;72(4):245–251. doi:10.1159/000325165
25. Velagaleti RS, Gona P, Chuang ML, et al. Relations of insulin resistance and glycemic abnormalities to cardiovascular magnetic resonance measures of cardiac structure and function: the Framingham heart study. Circ Cardiovasc Imaging. 2010;3(3):257–263. doi:10.1161/CIRCIMAGING.109.911438
26. Kwak S, Kim HL, In M, et al. Associations of Brachial-Ankle pulse wave velocity with left ventricular geometry and diastolic function in untreated hypertensive patients. Front Cardiovasc Med. 2021;8:647491. doi:10.3389/fcvm.2021.647491
27. Boutouyrie P, Chowienczyk P, Humphrey JD, Mitchell GF. Arterial stiffness and cardiovascular risk in hypertension. Circ Res. 2021;128(7):864–886. doi:10.1161/circresaha.121.318061
28. Mehta S, Khoury PR, Madsen NL, Dolan LM, Kimball TR, Urbina EM. Arterial thickness and stiffness are independently associated with left ventricular strain. J Am Soc Echocardiogr. 2018;31(1):99–104. doi:10.1016/j.echo.2017.10.002
29. Chahal NS, Lim TK, Jain P, Chambers JC, Kooner JS, Senior R. The distinct relationships of carotid plaque disease and carotid intima-media thickness with left ventricular function. J Am Soc Echocardiogr. 2010;23(12):1303–1309. doi:10.1016/j.echo.2010.08.021
30. Bauer M, Caviezel S, Teynor A, Erbel R, Mahabadi AA, Schmidt-Trucksass A. Carotid intima-media thickness as a biomarker of subclinical atherosclerosis. Swiss Med Wkly. 2012;142:w13705. doi:10.4414/smw.2012.13705
31. Spence JD. Measurement of intima-media thickness vs. carotid plaque: uses in patient care, genetic research and evaluation of new therapies. Int J Stroke. 2006;1(4):216–221. doi:10.1111/j.1747-4949.2006.00068.x
32. Nakanishi K, Daimon M, Yoshida Y, et al. Carotid intima-media thickness and subclinical left heart dysfunction in the general population. Atherosclerosis. 2020;305:42–49. doi:10.1016/j.atherosclerosis.2020.05.019
 © 2022 The Author(s). This work is published and licensed by Dove Medical Press Limited. The full terms of this license are available at https://www.dovepress.com/terms.php and incorporate the Creative Commons Attribution - Non Commercial (unported, v3.0) License.
By accessing the work you hereby accept the Terms. Non-commercial uses of the work are permitted without any further permission from Dove Medical Press Limited, provided the work is properly attributed. For permission for commercial use of this work, please see paragraphs 4.2 and 5 of our Terms.
© 2022 The Author(s). This work is published and licensed by Dove Medical Press Limited. The full terms of this license are available at https://www.dovepress.com/terms.php and incorporate the Creative Commons Attribution - Non Commercial (unported, v3.0) License.
By accessing the work you hereby accept the Terms. Non-commercial uses of the work are permitted without any further permission from Dove Medical Press Limited, provided the work is properly attributed. For permission for commercial use of this work, please see paragraphs 4.2 and 5 of our Terms.