")
Back to Journals » Journal of Inflammation Research » Volume 14
Relationship Between Prognostic Nutritional Index and Mortality in Overweight or Obese Patients with Cancer: A Multicenter Observational Study
Authors Zhang X , Li JH, Zhang Q, Li QQ, Zhang KP, Tang M, Ge YZ, Li W, Xu HX, Guo ZQ, Shi HP
Received 27 May 2021
Accepted for publication 28 July 2021
Published 14 August 2021 Volume 2021:14 Pages 3921—3932
DOI https://doi.org/10.2147/JIR.S321724
Checked for plagiarism Yes
Review by Single anonymous peer review
Peer reviewer comments 2
Editor who approved publication: Dr Monika Sharma
Xi Zhang,1– 3 Jing-Hua Li,4 Qi Zhang,1,3 Qin-Qin Li,1,3 Kang-Ping Zhang,1,3 Meng Tang,1,3 Yi-Zhong Ge,1,3 Wei Li,5 Hong-Xia Xu,6 Zeng-Qing Guo,7 Han-Ping Shi1,3
1Department of Gastrointestinal Surgery/Department of Clinical Nutrition, Beijing Shijitan Hospital, Capital Medical University, Beijing, 100038, People’s Republic of China; 2Department of Radiotherapy, Affiliated Hospital of Hebei University, Baoding, 071000, People’s Republic of China; 3Beijing International Science and Technology Cooperation Base for Cancer Metabolism and Nutrition, Beijing, 100038, People’s Republic of China; 4Department of Hepatobiliary Surgery, Affiliated Hospital of Hebei University, Baoding, 071000, People’s Republic of China; 5Cancer Center of the First Hospital of Jilin University, Changchun, 130021, People’s Republic of China; 6Department of Clinical Nutrition, Daping Hospital, Third Military Medical University (Army Medical University), Chongqing, 400042, People’s Republic of China; 7Department of Medical Oncology, Fujian Cancer Hospital, Fujian Medical University, Fujian, 350014, People’s Republic of China
Correspondence: Han-Ping Shi
Department of Gastrointestinal Surgery/Department of Clinical Nutrition, Beijing Shijitan Hospital, Capital Medical University, Beijing, 100038, People’s Republic of China
Tel +86-10-6392 6985
Fax +86-10-6392 6325
Email [email protected]
Background: Overweight and obese patients with cancer present with chronic inflammation, dysfunctional antitumor immunity and malnutrition risk. Prognostic nutritional index (PNI) is a promising indicator for predicting inflammatory, immunological and nutritional states; however, its prognostic value in overweight and obese patients with cancer has not been explored. Therefore, the aim of the current study was to explore the prognostic value of PNI levels in overweight and obese patients with cancer.
Methods: The current large-scale retrospective cohort multicenter study included 3532 patients. Time-dependent receiver operating characteristic (ROC) curve analysis was used to determine the prediction accuracy of PNI levels for mortality of overweight and obese patients with cancer. Restricted cubic splines were used to model the association between PNI levels and mortality. Association between low PNI and overall survival rate was analyzed using the Kaplan–Meier method and Cox regression model.
Results: Area under the curve (AUC) of the PNI for all-cause mortality was higher compared with that of the neutrophil to lymphocyte ratio (NLR) and platelet to lymphocyte ratio (PLR) in overweight and obese patients with cancer. There was a significant inverse relationship between PNI levels and all-cause mortality (per SD increment-HR: 0.79; 95% CI: 0.74, 0.85; P< 0.001). Subgroup analysis showed that the risk for mortality significantly decreased with increase in PNI levels in patients at risk of malnutrition (per SD increment-HR: 0.67; 95% CI: 0.57, 0.78; P< 0.001) and elderly patients (per SD increment-HR: 0.74; 95% CI: 0.64, 0.84; P< 0.001). In addition, PNI levels showed an inverse association with mortality in patients without malnutrition risk (per SD increment-HR: 0.81; 95% CI: 0.75, 0.88; P< 0.001). Subgroup analysis based on tumor type showed that low PNI was an independent predictor of poor prognosis for patients with lung cancer, gastric cancer and hepatobiliary and pancreatic cancer.
Conclusion: Low PNI levels are associated with an increased risk for all-cause mortality. PNI level is a potential effective inflammation-based prognostic tool for overweight and obese patients with cancer.
Keywords: PNI, mortality, overweight or obese, prognosis, cancer patients
Introduction
Obesity and excessive weight are major public health concerns worldwide. The rate of affected individuals among adults in China is approximately 46% and 15% in children.1,2 Studies report that excess body weight, commonly expressed as increased body mass index (BMI), is associated with high risk for several types of cancer. Therefore, a significant percentage of cancer patients are present with overweight or obesity at diagnosis.3,4 Obesity affects inflammatory and immune systems, leading to dysregulated immune responses and impaired antitumor immunity.5,6 Previous studies report that obesity is associated with improved treatment response and survival in cancer patients treated with immunotherapy.7–9 In addition, overweight or obese cancer patients might be at risk of malnutrition. A recent study using Patient-Generated Subjective Global Assessment Short Form reported that the prevalence of malnutrition risk in overweight/obese cancer patients was 64%.10 These findings show that prognostic nutritional index (PNI), which indicates an interplay among inflammation, immunological status and nutrition,11 may be a promising biomarker with predictive and prognostic value for overweight and obese patients with cancer. PNI is a multiparametric indicator based on serum albumin concentration and total lymphocyte count in peripheral blood. Studies report that PNI is an accurate prognostic predictor in various types of human cancers.12–15 In addition, PNI is correlated with the tumor-infiltrating lymphocyte (TIL) score15 and is a useful biomarker for predicting efficacy of immunotherapy.16 Similarly, neutrophil to lymphocyte ratio (NLR) and platelet to lymphocyte ratio (PLR) are commonly used as conventional indicator of systemic inflammation and immunological status and are emerging as prognostic biomarkers in many cancer types.17,18 Although these three markers can be easily evaluated by blood tests, it is still unclear as to which of these biomarkers is the most reliable prognostic predictor for overweight and obese patients with cancer. Therefore, the aims of this large-scale retrospective cohort study were (i) to compare the prognostic ability of the PNI with NLR and PLR, (ii) to comprehensively explore the relationship between PNI levels and all-cause mortality of overweight and obese patients with cancer.
Methods
Study Design and Population
A total of 3532 overweight or obese patients with cancer from multiple centers including Daping Hospital of the Third Military Medical University, Fujian Cancer Hospital and the First Hospital of Jilin University were included in the current retrospective study between April 2013 and February 2019. All patients were undergoing antitumor treatments including surgery, chemotherapy, radiotherapy and other anti-cancer therapies. Data for the first admission were analyzed for patients with multiple hospitalizations. The study inclusion criteria included: (1) age >18 years old; (2) length of hospital stay longer than 48 hours; (3) diagnosis of solid tumors at any stage; (4) patients that presented with a BMI ≥24 kg/m2. Patients with incomplete clinical data or lost to follow-ups at the beginning and subsequent follow-ups were excluded. This study was carried out following the ethical standards of the Helsinki Declaration and was approved by the Medical Ethics Committee of First Affiliated Hospital of Sun yat-sen University. The study was registered under the Chinese Clinical Trial Registry (Registration number: ChiCTR1800020329). Informed consent was waived due to this study’s retrospective nature and the anonymized processing of patient data. All patients were regularly followed up by telephone interviews or outpatient visits.
Patient Characteristics
Pretreatment clinicopathological characteristics including age, gender, medical comorbidity, alcohol consumption, smoking status, previous treatments (surgery, chemotherapy and radiotherapy), primary tumor site, TNM stage, Karnofsky Performance Status (KPS), and European Organization for Research and Treatment of Cancer Quality of Life Questionnaire (EORTC QLQ‐C30) summary score were recorded. Nutritional and inflammatory assessments were performed using several parameters including hemoglobin, total protein, weight loss, BMI, PNI, NLR and PLR. PNI was calculated using the formula PNI = (10× Alb g/dL) + (0.005 × total lymphocyte counts/mm3).11 BMI was classified as overweight (24.0–27.9 kg/m2) and obese (≥28.0 kg/m2) based on reclassification of BMI for Chinese adults provided by the Ministry of Health of the People’s Republic of China.19 The nutritional status of all patients was evaluated using the Nutritional Risk Screening-2002 (NRS-2002), and a total score of≥3 points was considered at risk of malnutrition. The following categories were used to convert KPS data to the Eastern Cooperative Oncology Group performance status (ECOG PS): KPS 100 (ECOG PS 0), KPS 90 to 80 (ECOG PS 1), KPS 70 to 60 (ECOG PS 2), KPS 50 to 40 (ECOG PS 3), and KPS 30 to 0 (ECOG PS 4).20 QLQ‐C30 summary score was calculated as the mean of the combined 13 QLQ‐C30 scale and item scores (excluding global QoL and financial impact), with a higher score indicating a better QoL.21,22 T, N and M categories were not included in this analysis since each tumor type had distinct T/N/M categories. Stages of these patients were classified following the guidelines by the eighth AJCC TNM staging system.
Anthropometric Measurements
BMI was calculated as body weight in kilograms divided by height in meters squared. Body weight change was determined by taking the body weight of patients six months prior to admission, then comparing with the weight determined at the time of admission. Mid-arm circumference (MAC) and calf circumference (CC) were determined using a standard tape with a 0.1-cm increment. Tricep skinfold was determined using a skinfold caliper with 1 mm increments. Mid-arm muscle circumference (MAMC) was calculated using the following formula: MAMC (mm) = mid-arm circumference (mm) - (3.14 × triceps skinfold (mm)).23 Hand grip strength (HGS) was determined using a hand dynamometer from the patient’s dominant hand.
Statistical Analysis
Categorical variables were presented as numbers and percentages. Differences among groups were compared using χ2 test or Fisher’s exact test. Comparison of continuous variables was performed using Student’s independent t test or Mann‐Whitney test for data that did not show normal distribution. Maximally selected rank statistics were used to calculate the optimal cutoff value of the PNI.24 Cut‐off value for PNI associated with overall survival was <46.05 based on our calculation. Then the calculated cut‐off point was used to classify patients as low PNI and high PNI group. Hazard ratios (HRs) of PNI for all-cause mortality were determined as a continuous variable using restricted cubic splines with three knots at the 5th, 50th, and 95th centiles. Survival curves were plotted using the Kaplan–Meier method and the Log rank test. Cox proportional hazards model was used for univariate and multivariate survival analyses. Two sensitivity analyses were performed as follows: one analysis excluded patients who died within 3 months to reduce the potential impact of reverse causation as a result of severe disease. In addition, propensity score-matching analysis was used to minimize the confounding prognostic factors affecting the prognostic significance of PNI. Propensity scores were estimated using a logistic regression model according to the following 9 factors: age, gender, smoking, drinking, ECOG PS, TNM stage, weight loss, tumor types and hemoglobin level. After amending these confounding factors, the prognostic significance of PNI was reevaluated in overweight or obese patients with cancer. P < 0.05 was considered statistically significant. All analyses were performed using R software, version 3.6.1.
Results
Patient Characteristics
A total of 3532 patients were included in the study after excluding 627 patients lost to follow-ups at the beginning and subsequent follow-ups or who had missing data (Figure S1). Baseline demographic and clinical data of all patients including age, gender, smoking and alcohol consumption status, primary tumor site, TNM stage, M category, previous treatments, comorbidity, ECOG PS, BMI category, weight loss, albumin, hemoglobin, NLR, PLR, QoL and information on anthropometric measures are presented in Table 1. A total of 912 events (deaths) were observed over a median follow-up time of 30 months.
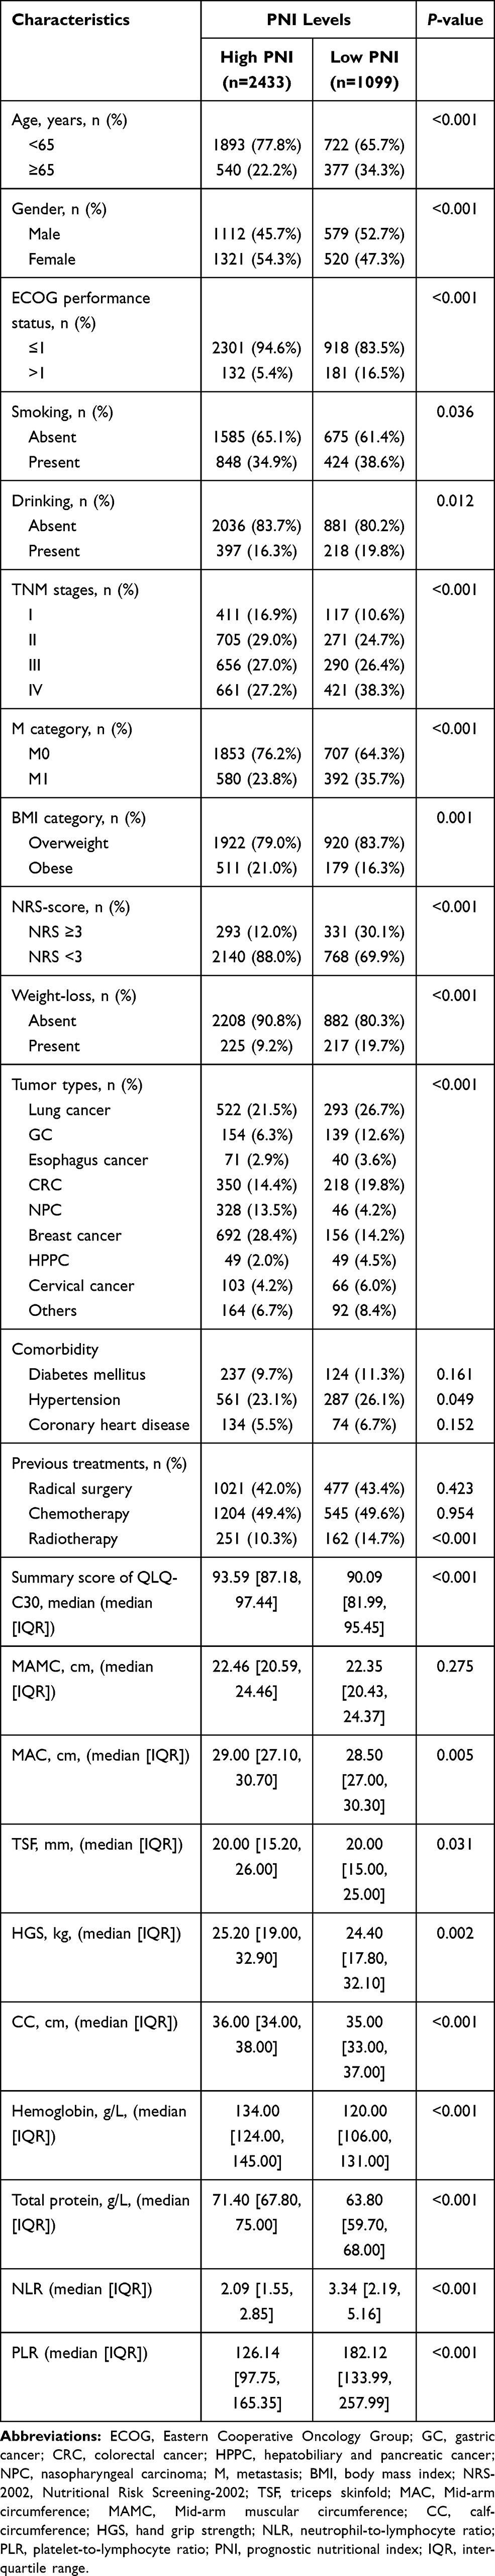 |
Table 1 Detailed Baseline Characteristics of the Study Population |
Relationship Between PNI Levels and Clinicopathologic Variables
Time-dependent ROC curves of the inflammation-based prognostic score (NLR, PLR and PNI) for the overall survival (OS) rate are shown in Figure 1. The AUCs of PNI, NLR and PLR for the 1-year mortality rate were 0.692, 0.666 and 0.615, respectively. The AUCs of PNI, NLR and PLR for the 3-year mortality rate were 0.659, 0.639 and 0.600, respectively. The area under the curve (AUC) of PNI was higher compared with that of NLR and PLR, indicating that PNI was a better prognostic biomarker for predicting the overall survival rate of overweight and obese patients with cancer. The mean PNI value was lower in patients ≥65 years of age compared with those patients less than 65 years of age except for patients with breast cancer. HPPC group (mean 45.43) showed the lowest mean PNI value, whereas the NPC group (mean 51.51) had the highest PNI for patients <65 years of age. Patients with gastric cancer (mean 44.72) had the lowest mean PNI, and patients with breast cancer (mean 48.18) showed the highest PNI for patients ≥65 years of age (Figure S2). Analysis using the maximally selected rank statistics method showed that the optimal threshold of the PNI was 46.05 (Figure S3), and the prevalence of low PNI was 1099 (31.1%) in overweight or obese patients with cancer. Low PNI was highly correlated with old age, male gender, history of smoking and alcohol consumption, poor ECOG performance, advanced TNM stage, high malnutrition risk, lower total protein and hemoglobin, high NLR and PLR levels and treatment using radiotherapy. In addition, patients with low PNI showed weight loss, low MAC, low CC, low TSF, low HGS and a low QLQ-C30 summary score (Table 1).
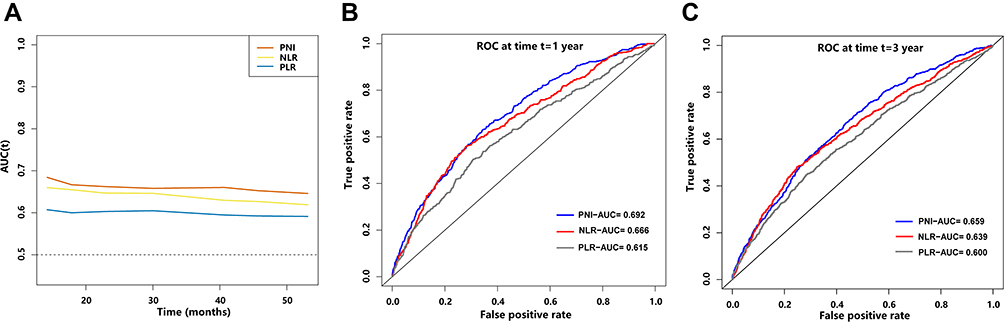 |
Figure 1 Time-dependent changes in the area under the curve (AUC) for overall survival of prognostic nutritional index (PNI), neutrophil-to-lymphocyte ratio (NLR) and platelet-to-lymphocyte ratio (PLR). (A) Temporal changes of the AUC, (B) ROC curves for 1-year mortality, (C) ROC curves for 3-year mortality. |
Relationship Between PNI Levels and All-Cause Mortality
Analysis showed a significant inverse relationship between PNI levels and all-cause mortality (per SD increment-HR: 0.79; 95% CI: 0.74, 0.85, P < 0.001) (Figure 2). The risk of all-cause mortality was significantly lower in patients with high PNI compared with individuals with low PNI (defined by cutoff values: PNI <46.05), with an adjusted HR of 0.73 (95% CI: 0.63,0.84, P < 0.001). Analysis after grouping of PNI levels into quartiles showed significantly lower mortality in participants in quartile 3 (HR; 0.81, 95% CI: 0.67, 0.98, P=0.027) and quartile 4 (HR; 0.56, 95% CI: 0.44, 0.70, P < 0.001) compared with that of participants in quartile 1 (Table 2). Low PNI was associated with worse OS rates in cancer patients who were overweight or obese. After multivariate Cox regression analysis, low PNI was demonstrated to be an independent prognostic factor for OS rates (HR; 1.45, 95% CI: 1.26, 1.68, P < 0.001) (Table S1) in overweight and obese patients with cancer.
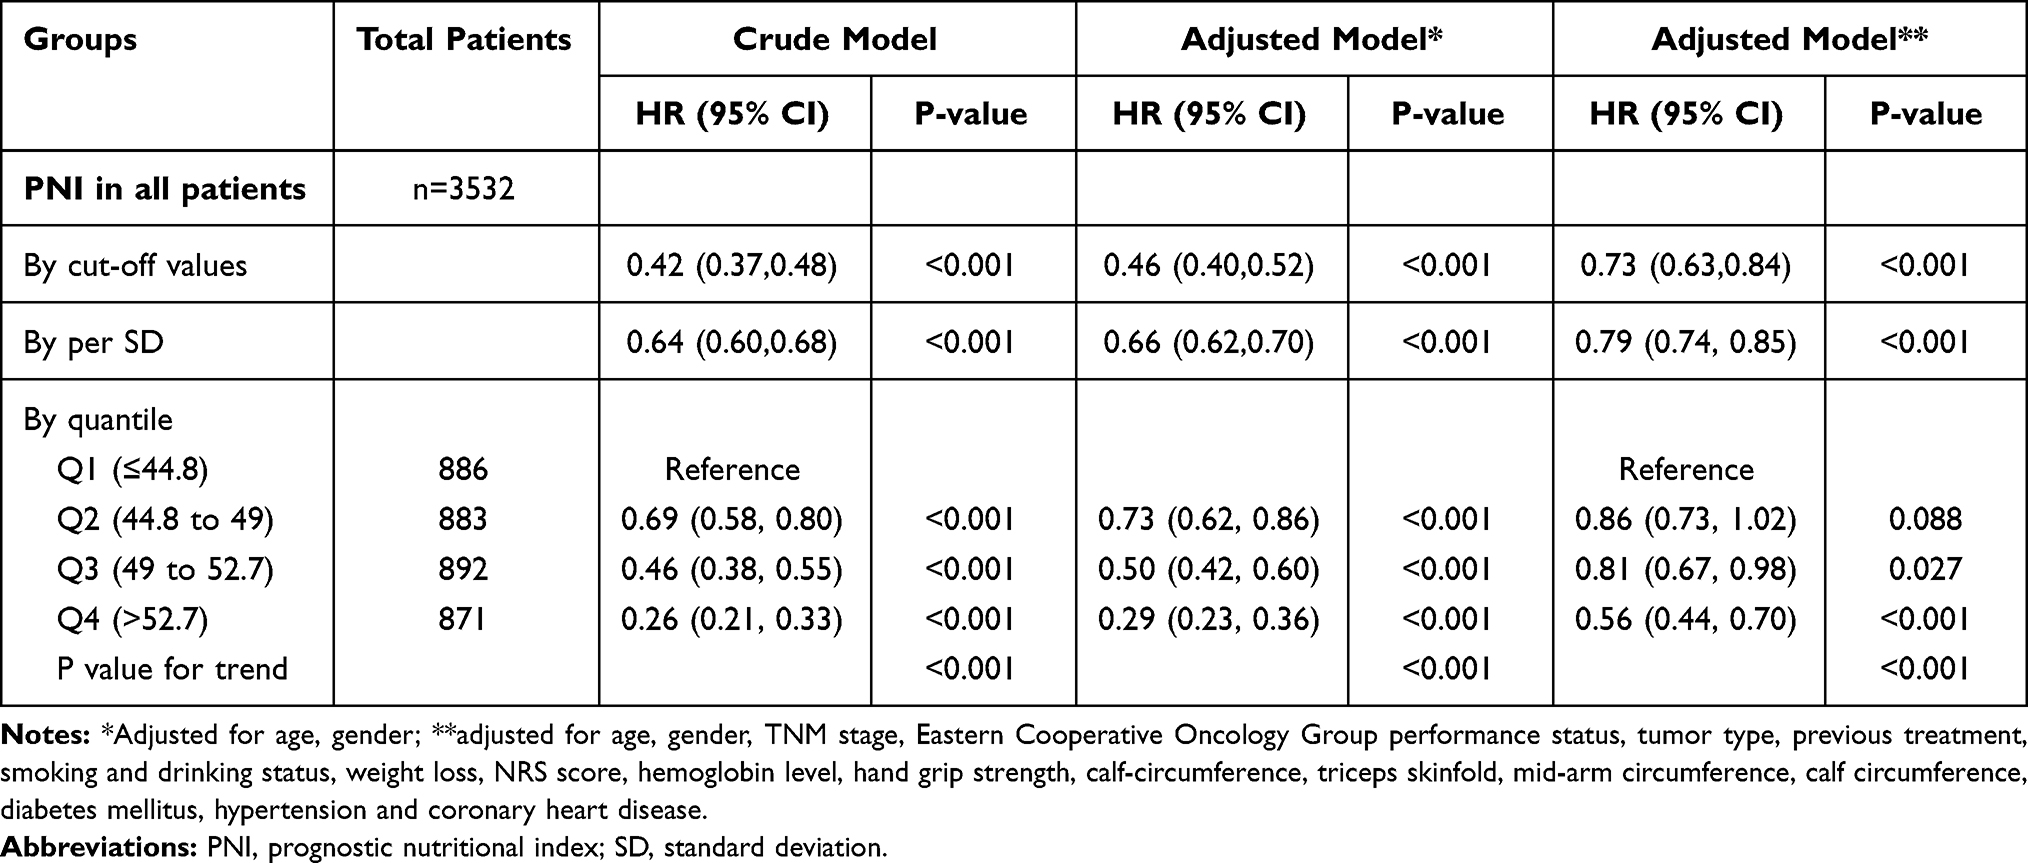 |
Table 2 The Association Between PNI Level and All-Cause Mortality in Overweight or Obese Patients with Cancer |
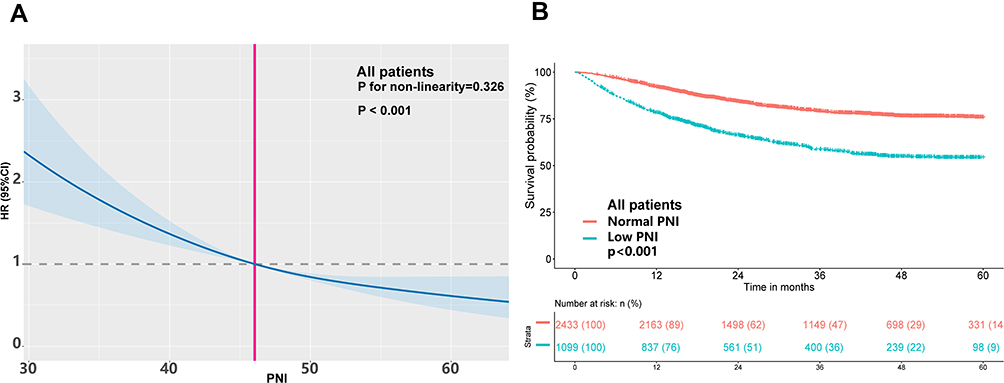 |
Figure 2 Association of PNI levels with mortality (A) and Kaplan-Meier survival analysis of OS (B) in overweight or obese patients with cancer. Hazard ratios are indicated by solid lines and 95% confidence intervals (CIs) by shaded area. Reference point was calculated cut-off value (PNI=46.05). The model was adjusted for cofounders including age, gender, TNM stage, Eastern Cooperative Oncology Group performance status, tumor type, previous treatment, smoking and drinking status, weight loss, NRS score, hemoglobin levels, hand grip strength, calf-circumference, triceps skinfold, mid-arm circumference, calf circumference, diabetes mellitus, hypertension and coronary heart disease. Abbreviations: OS, overall survival; PNI, prognostic nutritional index. |
Effect of PNI Levels on All-Cause Mortality Stratified by Age, Nutrition Status and Tumor Type
The spline of the HRs for PNI showed a strong L-shaped relationship in patients ≥65 years of age (per SD increment-HR: 0.74; 95% CI: 0.64, 0.84, P < 0.001) and a linear decrease in patients <65 years old (per SD increment-HR: 0.82; 95% CI: 0.75, 0.89, P < 0.001). In addition, mortality decreased with increase in PNI in patients with no malnutrition risk (per SD increment-HR: 0.81; 95% CI: 0.75, 0.88, P < 0.001), but showed a more pronounced decreasing tendency in patients at risk of malnutrition (per SD increment-HR: 0.67; 95% CI: 0.57, 0.78, P < 0.001) (Table 3) (Figure S4). Findings from multivariate analysis indicated that low PNI was an independent predictor of worse prognosis across age groups (<65 years or ≥65 years) and nutrition status (NRS score <3 or NRS score ≥3). Stratification by tumor type showed that mortality risk significantly decreased with increase in PNI levels for patients with lung cancer, gastric cancer, colorectal cancer, cervical cancer, nasopharyngeal carcinoma, hepatobiliary cancer and pancreatic cancer (HPPC) and tended to be decreased for patients with cervical cancer and esophageal cancer, but was not significantly decreased for patients with breast cancer (Figure S5). Although low PNI was associated with poor OS rates in each of these tumor types (Figure 3), multivariate analysis showed that low PNI was an independent predictor of worse prognosis for patients with lung cancer, gastric cancer and HPPC and tended to be an independent predictor for esophageal cancer (Figure 4).
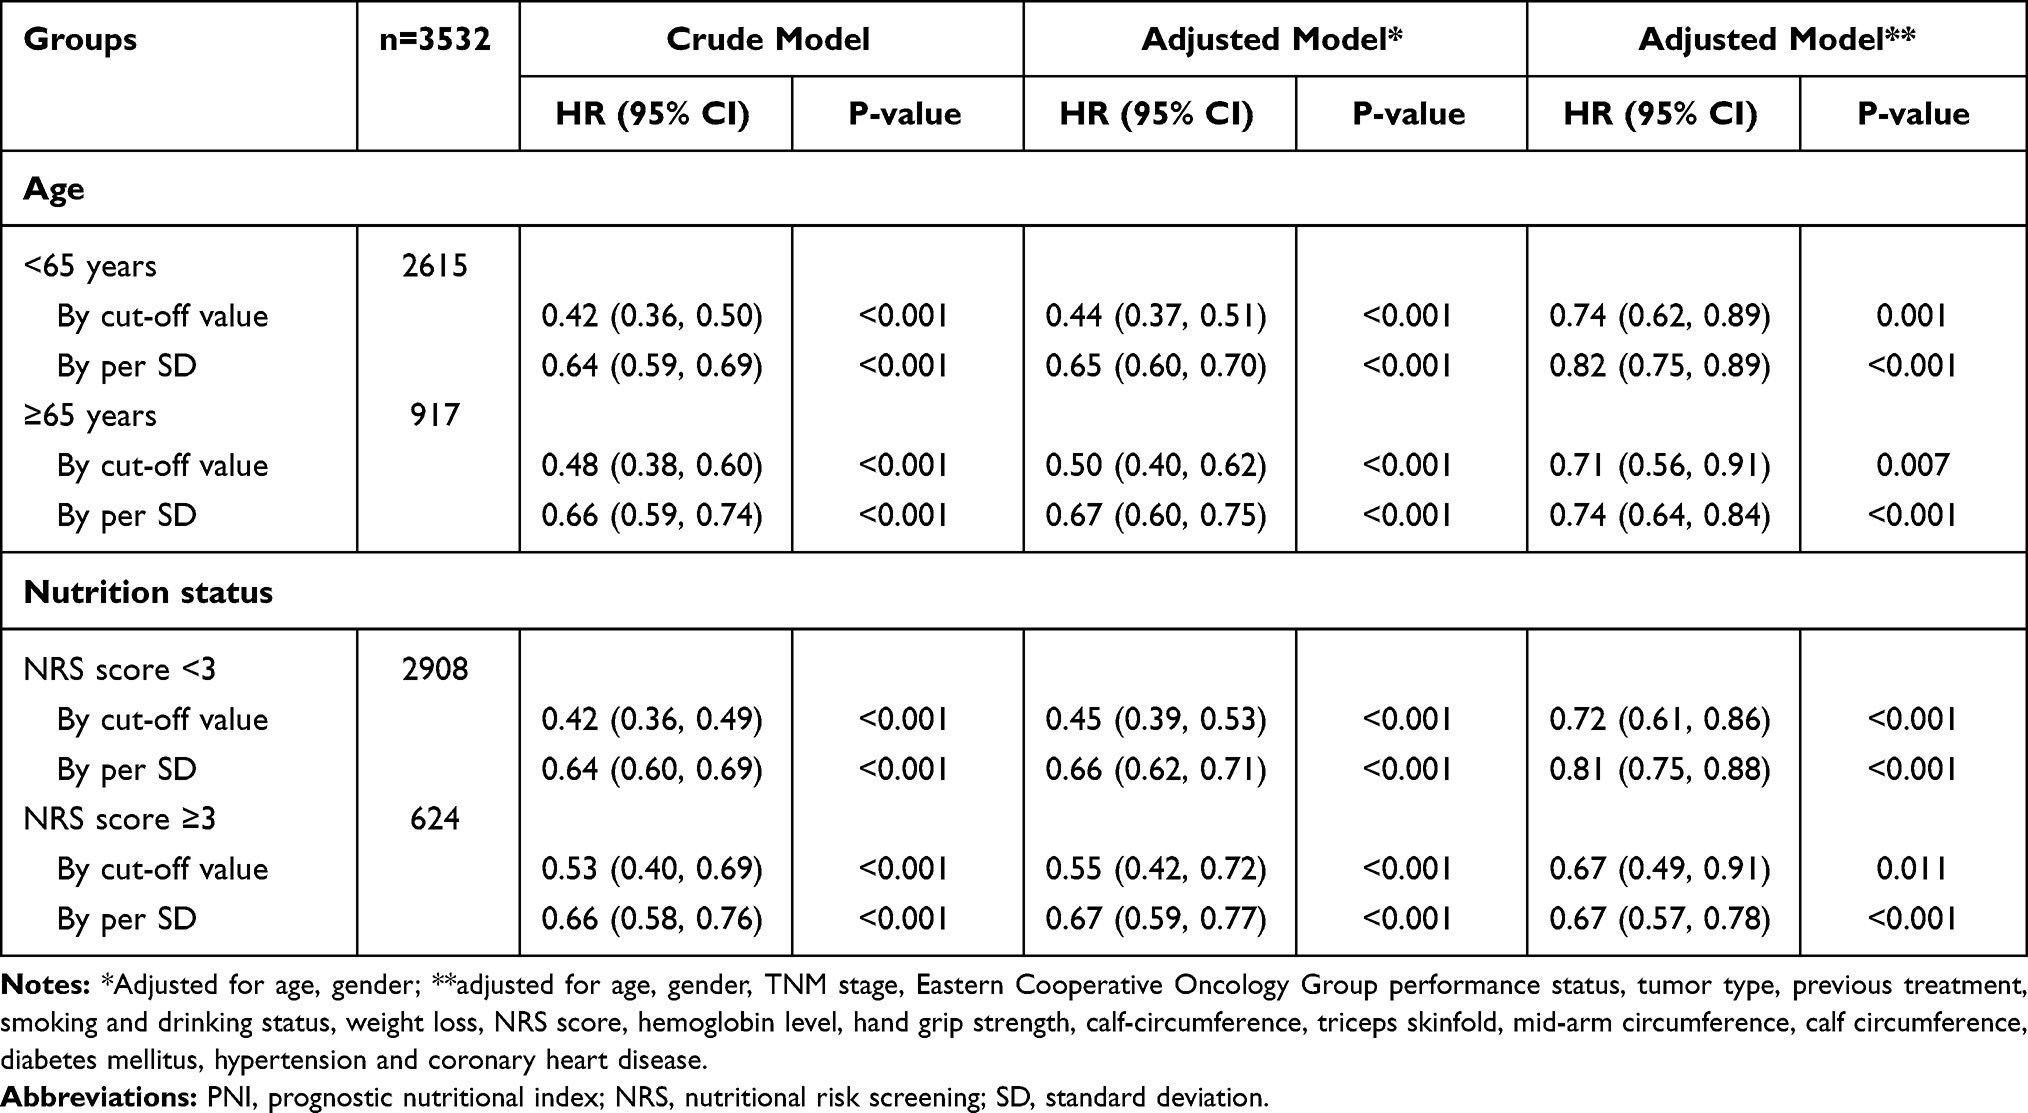 |
Table 3 The Association Between PNI and All-Cause Mortality Stratified by Age and Nutrition Status |
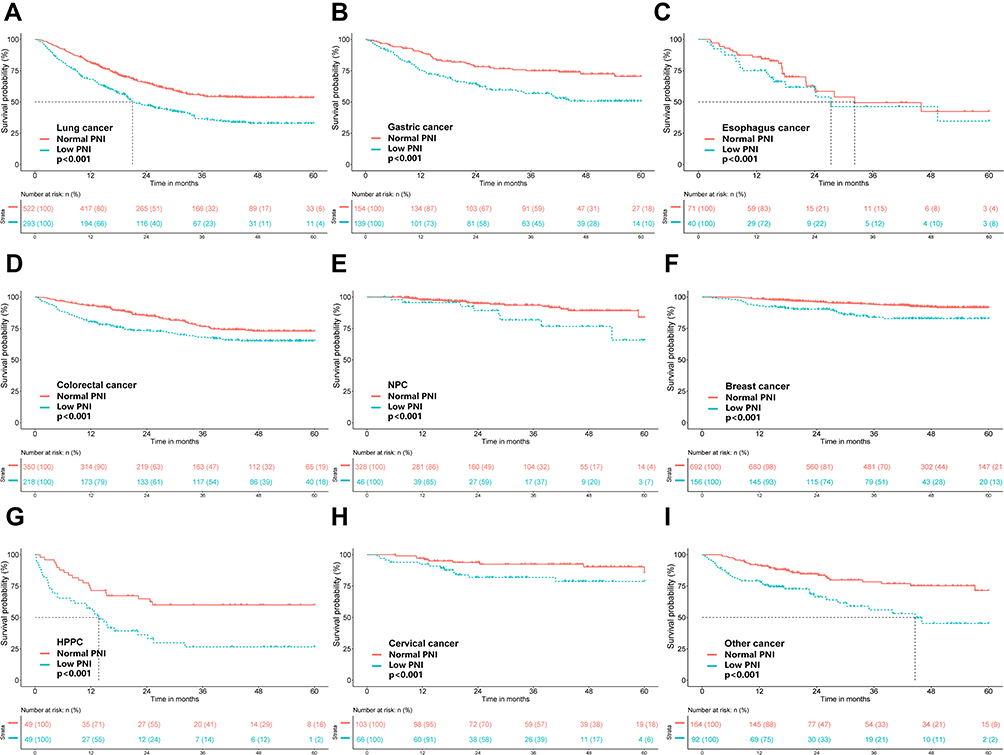 |
Figure 3 Kaplan-Meier survival analysis for overweight or obese patients with cancer according to PNI levels stratified by tumor type. (A) OS of lung cancer; (B) OS of gastric cancer; (C) OS of esophagus cancer; (D) OS of colorectal cancer; (E) OS of nasopharyngeal carcinoma (NPC); (F) OS of breast cancer; (G) OS of hepatobiliary and pancreatic cancer (HPPC); (H) OS of cervical cancer; (I) OS of other cancer. Abbreviation: OS, overall survival. |
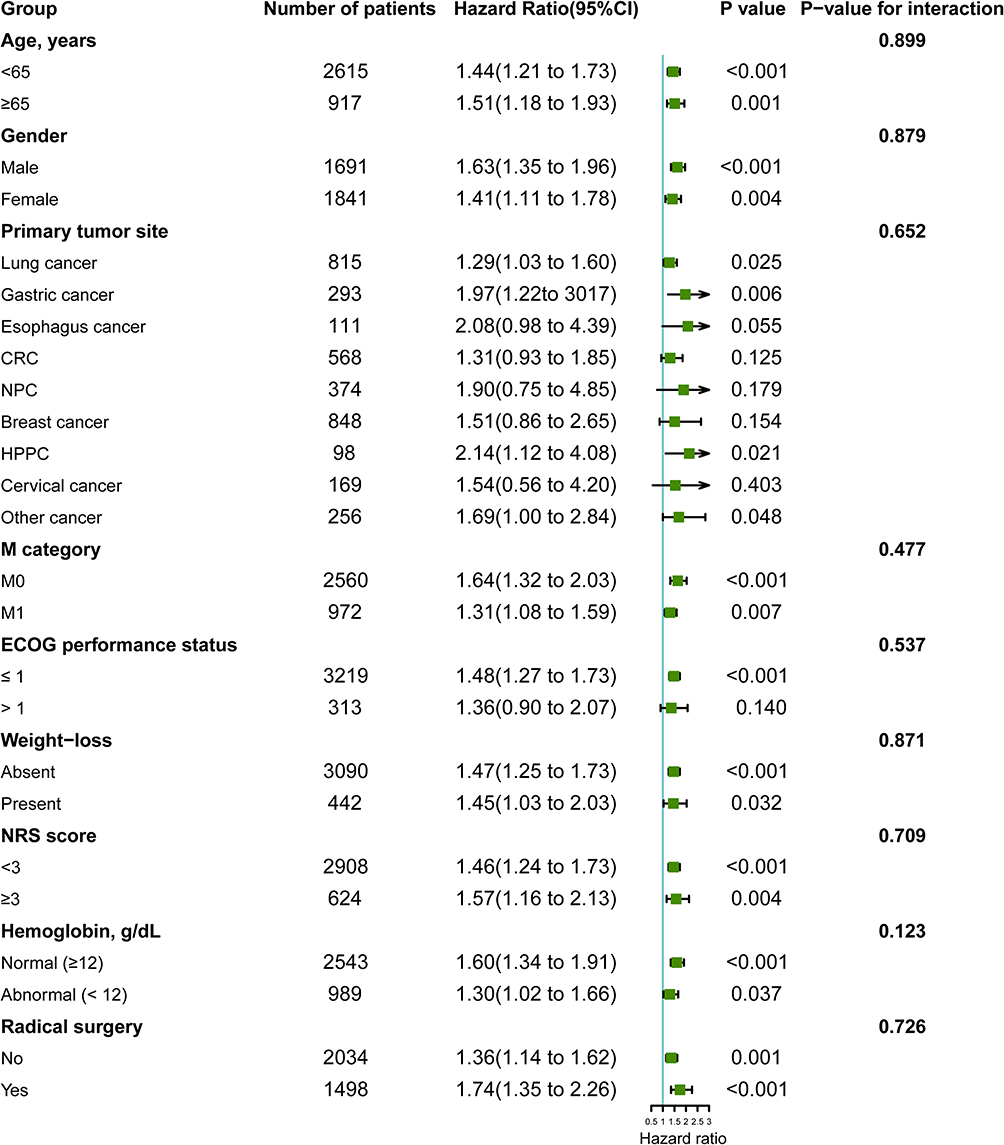 |
Figure 4 Subgroup analysis for evaluating the prognostic effect of PNI on overall survival. Abbreviations: ECOG, Eastern Cooperative Oncology Group; CRC, colorectal cancer; HPPC, hepatobiliary and pancreatic cancer; NPC, nasopharyngeal carcinoma; M, metastasis; NRS, Nutritional Risk Screening; PNI, prognostic nutritional index. |
Prognostic Significance of Low PNI Stratified by Potential Effect Modifiers
Subgroup analyses were performed to explore the prognostic effect of PNI on overweight or obese cancer patients. The association between low PNI and poor prognosis was not significantly modified by age (P for interaction=0.899), gender (P for interaction=0.879), primary tumor site (P for interaction=0.652), M category (P for interaction=0.477), ECOG performance status (P for interaction=0.537), weight loss (P for interaction=0.871), NRS score (P for interaction=0.709), and radical surgery (P for interaction=0.726), but tended to be modified by hemoglobin levels (P for interaction=0.123) (Figure 4). In addition, the relationship between low PNI level and worse survival outcome was also confirmed by excluding patients who died within 3 months or the propensity score-matching analysis (Figure S6, Figure S7, Table S2, Table S3).
Discussion
The findings of the current study indicated that PNI level is inversely correlated with all-cause mortality of overweight or obese patients with cancer. Notably, a 21% decrease in mortality risk was observed per SD increase in PNI level. Decrease in mortality risk was observed with increase in PNI level across age groups (<65 years and ≥65 years) and nutrition status (NRS score <3 or NRS score ≥3). A strong L-shaped relationship was observed between PNI levels and mortality for patients at risk of malnutrition and elderly patients. Intriguingly, an inverse association was observed between PNI levels and all-cause mortality in patients without malnutrition risk. This finding indicated that PNI level may be an inflammation-based prognostic marker in overweight and obese patients with cancer. The optimal cut‐off point for low PNI was 46.05. Analysis using this threshold showed that low PNI was independently correlated with worse prognosis in overweight or obese cancer patients. Given the increased prevalence of overweight or obese patients with cancer, our observations are likely to improve the prediction and stratification of prognosis for these patients.
Previous studies report that PNI is significantly correlated with poor prognosis in patients with adenocarcinoma of the esophagogastric junction (AEG) and upper gastric cancer (UGC) or patients with hepatocellular carcinoma compared with NLR and PLR.25–27 In the current study, the findings showed that PNI was a better predictor of OS rates in overweight and obese patients with cancer compared with the NLR and PLR which is consistent with previous findings. PNI was determined based on the serum albumin level and peripheral blood total lymphocyte count (TLC). Hypoalbuminemia has been reported to be associated with cancer progression and poor survival outcomes in several cancer types.28,29 Both systemic inflammatory reactions and malnutrition might result in decreased albumin in overweight and obese patients with cancer. TLC is a component of PNI and plays an important role in the host immune response by inhibiting formation and progression of tumors.30 High peripheral blood lymphocyte count is correlated with increased TILs; thus, it may improve patient prognosis through local antitumor immunity.15 Several studies report that tumors with abundant TILs are associated with a better prognosis compared with those with few TILs.31,32
PNI levels are affected by systemic inflammatory reactions, and serum albumin levels are decreased by inflammation.33 The findings of the current study showed that low PNI was independently associated with increased all-cause mortality in overweight and obese patients without malnutrition risk. Thus, the PNI level is more likely to be modified by inflammation status and is an inflammation-based prognostic marker in such patients. In line with our results, Evans et al reported that serum albumin, a component of the PNI, should be recognized as an inflammatory marker rather than a malnutrition indicator.33 Moreover, for overweight and obese patients with malnutrition risk, the risk of mortality showed a more pronounced decreasing trend with increasing PNI levels. We speculate that patients with both malnutrition and inflammation burden experience a severe PNI reduction, resulting in increased all-cause mortality. Therefore, the PNI level might mainly characterize inflammation rather than nutrition status in overweight and obese patients with cancer. However, PNI level is more likely to reflect both inflammatory and nutritional conditions in patients with underweight. Okadome et al found low PNI was associated with the poor prognosis in underweight patients with esophageal cancer.15 The underweight condition of patients could be related to malnutrition and inflammatory state resulting in lower serum albumin levels and lymphopenia.34–36 In addition, old age is associated with increased malnutrition risk and deterioration of T lymphocytes, which can be exacerbated by obesity.37,38 In the present study, low PNI levels were mainly observed in elderly patients with cancer and showed a significant association with all-cause mortality in elderly patients. Similarly, a recent study reported that low PNI score is an independent prognostic factor for predicting worse OS in elderly patients with gastric cancer.39
Several studies report that PNI is significantly associated with prognosis in various cancer types, such as lung, esophageal, renal cell and hepatocellular and biliary cancers.12–15,40,41 However, previous studies have not evaluated the relationship between PNI levels and mortality in overweight and obese patients with cancer. Analysis using the calculated cut-off value showed that low PNI was an independent prognostic factor in overweight or obese patients with lung cancer, gastric cancer and HPCC and tended to be a significant prognostic factor in patients with esophageal cancer. One possible explanation for this finding might be that those with primary upper gastrointestinal tract and lung tumors and are more likely to experience chronic inflammation and malnutrition. In addition, intratumoral genomic alterations have been reported to be associated with BMI and PNI levels. A recent study found BMI and PNI are independent factors for overall survival in patients with gastric cancer and those patients with higher BMI values had fewer copy number variation events and less tumor suppressor gene loss.42 For patients with HPPC, low PNI levels may be caused by impaired liver function and sustained systemic inflammatory response.43 However, the correlation between PNI levels and increased mortality was not significant for overweight or obese patients with breast cancer. This result could be partly explained by the suppressed local antitumor immune response in obese subjects with breast cancer. Floris et al reported that high sTIL levels were significantly correlated with high pathological complete response (pCR) rate and better survival outcomes in lean patients (≥18.5 and <25 kg/m2) but not in heavier patients (BMI ≥25 kg/m2) with triple-negative breast cancer.44
The current study used a large sample size to explore the relationship between PNI levels and all-cause mortality in obese and overweight patients with cancer. However, the current study has some limitations. First, this cohort was retrospective; therefore, the results of this study may have been subjected to selection bias. In addition, those patients who were lost to follow-ups at the beginning and subsequent follow-ups were excluded from the study, which may result in overestimation of the association between low PNI level and worse survival outcome. However, the completeness of clinicopathological data and a relatively large sample size may partially compensate for this limitation. Second, serum albumin levels are not a reliable tool for determining malnutrition, as systemic inflammatory cytokines may affect serum albumin levels. However, the PNI tended to be an inflammation-based prognostic marker but not a nutritional parameter in overweight and obese patients with cancer.
Conclusion
The findings of the current study showed that a low PNI was associated with increased risk for all-cause mortality in overweight or obese patients with cancer. Mortality was significantly higher in patients at risk of malnutrition or in elderly patients. As PNI can be evaluated easily by collecting blood from a peripheral vein, it might be a useful inflammation-based prognostic tool for overweight and obese patients with cancer.
Data and Materials Availability
All data needed to evaluate the conclusions in the paper are present in the paper and/or the Supplementary Materials. Additional data related to this paper may be requested from the authors.
Acknowledgments
This work was supported by the National Key Research and Development Program (2017YFC1309200).
Author Contributions
All authors contributed to data analysis, drafting or revising the article, gave final approval of the version to be published, agreed to the submitted journal, and agree to be accountable for all aspects of the work.
Disclosure
The authors report no conflicts of interest in this work.
References
1. Ng M, Fleming T, Robinson M, et al. Global, regional, and national prevalence of overweight and obesity in children and adults during 1980–2013: a systematic analysis for the Global Burden of Disease Study 2013. Lancet. 2014;384(9945):766–781. doi:10.1016/S0140-6736(14)60460-8
2. Wang Y, Wang L, Qu W. New national data show alarming increase in obesity and noncommunicable chronic diseases in China. Eur J Clin Nutr. 2017;71(1):149–150. doi:10.1038/ejcn.2016.171
3. Lauby-Secretan B, Scoccianti C, Loomis D, et al. Body fatness and Cancer–Viewpoint of the IARC Working Group. N Engl J Med. 2016;375(8):794–798. doi:10.1056/NEJMsr1606602
4. Arnold M, Leitzmann M, Freisling H, et al. Obesity and cancer: an update of the global impact. Cancer Epidemiol. 2016;41:8–15. doi:10.1016/j.canep.2016.01.003
5. Mirsoian A, Murphy WJ. Obesity and cancer immunotherapy toxicity. Immunotherapy. 2015;7(4):319–322. doi:10.2217/imt.15.12
6. Wang Z, Monjazeb AM, Murphy WJ. The complicated effects of obesity on cancer and immunotherapy. Immunotherapy. 2019;11(1):11–14. doi:10.2217/imt-2018-0133
7. McQuade JL, Daniel CR, Hess KR, et al. Association of body-mass index and outcomes in patients with metastatic melanoma treated with targeted therapy, immunotherapy, or chemotherapy: a retrospective, multicohort analysis. Lancet Oncol. 2018;19(3):310–322. doi:10.1016/S1470-2045(18)30078-0
8. Heidelberger V, Goldwasser F, Kramkimel N, et al. Sarcopenic overweight is associated with early acute limiting toxicity of anti-PD1 checkpoint inhibitors in melanoma patients. Invest New Drugs. 2017;35(4):436–441. doi:10.1007/s10637-017-0464-x
9. Cortellini A, Bersanelli M, Buti S, et al. A multicenter study of body mass index in cancer patients treated with anti-PD-1/PD-L1 immune checkpoint inhibitors: when overweight becomes favorable. J Immunother Cancer. 2019;7(1):57. doi:10.1186/s40425-019-0527-y
10. Martin L, Gioulbasanis I, Senesse P, et al. Cancer-associated malnutrition and CT-defined sarcopenia and myosteatosis are endemic in overweight and obese patients. JPEN J Parenter Enteral Nutr. 2020;44(2):227–238. doi:10.1002/jpen.1597
11. Onodera T, Goseki N, Kosaki G. Prognostic nutritional index in gastrointestinal surgery of malnourished cancer patients. Nihon Geka Gakkai Zasshi. 1984;85(9):1001–1005.
12. Pinato DJ, North BV, Sharma R. A novel, externally validated inflammation-based prognostic algorithm in hepatocellular carcinoma: the prognostic nutritional index (PNI). Br J Cancer. 2012;106(8):1439–1445. doi:10.1038/bjc.2012.92
13. Jeon HG, Choi DK, Sung HH, et al. Preoperative prognostic nutritional index is a significant predictor of survival in renal cell carcinoma patients undergoing nephrectomy. Ann Surg Oncol. 2016;23(1):321–327. doi:10.1245/s10434-015-4614-0
14. Oh SE, Choi MG, Seo JM, et al. Prognostic significance of perioperative nutritional parameters in patients with gastric cancer. Clin Nutr. 2019;38(2):870–876. doi:10.1016/j.clnu.2018.02.015
15. Okadome K, Baba Y, Yagi T, et al. Prognostic nutritional index, tumor-infiltrating lymphocytes, and prognosis in patients with esophageal cancer. Ann Surg. 2020;271(4):693–700. doi:10.1097/SLA.0000000000002985
16. Johannet P, Sawyers A, Qian Y, et al. Baseline prognostic nutritional index and changes in pretreatment body mass index associate with immunotherapy response in patients with advanced cancer. J Immunother Cancer. 2020;8(2):e001674. doi:10.1136/jitc-2020-001674
17. Templeton AJ, Ace O, McNamara MG, et al. Prognostic role of platelet to lymphocyte ratio in solid tumors: a systematic review and meta-analysis. Cancer Epidemiol Biomarkers Prev. 2014;23(7):1204–1212. doi:10.1158/1055-9965.EPI-14-0146
18. Templeton AJ, McNamara MG, Šeruga B, et al. Prognostic role of neutrophil-to-lymphocyte ratio in solid tumors: a systematic review and meta-analysis. J Natl Cancer Inst. 2014;106(6):dju124. doi:10.1093/jnci/dju124
19. Chen C, Lu FC. Department of disease control ministry of health, PR China. The guidelines for prevention and control of overweight and obesity in Chinese adults. Biomed Environ Sci. 2004;17:
20. Ma C, Bandukwala S, Burman D, et al. Interconversion of three measures of performance status: an empirical analysis. Eur J Cancer. 2010;46(18):3175–3183. doi:10.1016/j.ejca.2010.06.126
21. Aaronson NK, Ahmedzai S, Bergman B, et al. The European Organization for Research and Treatment of Cancer QLQ-C30: a quality-of-life instrument for use in international clinical trials in oncology. J Natl Cancer Inst. 1993;85(5):365–376. doi:10.1093/jnci/85.5.365
22. Nordin K, Steel J, Hoffman K, et al. Alternative methods of interpreting quality of life data in advanced gastrointestinal cancer patients. Br J Cancer. 2000;85(9):1265–1272. doi:10.1054/bjoc.2001.2046
23. Antonelli Incalzi R, Landi F, Cipriani L, et al. Nutritional assessment: a primary component of multidimensional geriatric assessment in the acute care setting. J Am Geriatr Soc. 1996;44(2):166–174. doi:10.1111/j.1532-5415.1996.tb02434.x
24. Lausen B, Schumacher M. Maximally selected rank statistics. Biometrics. 1992;48:73–85. doi:10.2307/2532740
25. Kudou K, Nakashima Y, Haruta Y, et al. Comparison of inflammation-based prognostic scores associated with the prognostic impact of adenocarcinoma of esophagogastric junction and upper gastric cancer. Ann Surg Oncol. 2021;28(4):2059–2067. doi:10.1245/s10434-020-08821-y
26. Imai D, Maeda T, Shimokawa M, et al. Prognostic nutritional index is superior as a predictor of prognosis among various inflammation-based prognostic scores in patients with hepatocellular carcinoma after curative resection. Hepatol Res. 2020;50(1):101–109. doi:10.1111/hepr.13431
27. Chan AW, Chan SL, Wong GL, et al. Prognostic Nutritional Index (PNI) predicts tumor recurrence of very early/early stage hepatocellular carcinoma after surgical resection. Ann Surg Oncol. 2015;22(13):4138–4148. doi:10.1245/s10434-015-4516-1
28. Jung AR, Roh JL, Kim JS, et al. Prognostic value of body composition on recurrence and survival of advanced-stage head and neck cancer. Eur J Cancer. 2019;116:98–106. doi:10.1016/j.ejca.2019.05.006
29. Gupta D, Lis CG. Pretreatment serum albumin as a predictor of cancer survival: a systematic review of the epidemiological literature. Nutr J. 2010;9:69. doi:10.1186/1475-2891-9-69
30. Hanahan D, Weinberg RA. Hallmarks of cancer: the next generation. Cell. 2011;144(5):646–674. doi:10.1016/j.cell.2011.02.013
31. Salgado R, Denkert C, Demaria S, et al. The evaluation of tumor-infiltrating lymphocytes (TILs) in breast cancer: recommendations by an International TILs Working Group 2014. Ann Oncol. 2015;26(2):259–271. doi:10.1093/annonc/mdu450
32. Garnelo M, Tan A, Her Z, et al. Interaction between tumour-infiltrating B cells and T cells controls the progression of hepatocellular carcinoma. Gut. 2017;66(2):342–351. doi:10.1136/gutjnl-2015-310814
33. Evans DC, Corkins MR, Malone A, et al. The use of visceral proteins as nutrition markers: an ASPEN position paper. Nutr Clin Pract. 2021;36(1):22–28. doi:10.1002/ncp.10588
34. Murphy PM, Blackshaw GR, Paris HJ, et al. Prospective evaluation of nutritional status related to body mass indices and outcomes after modified D2 gastrectomy for carcinoma. Clin Nutr. 2004;23(4):477–483. doi:10.1016/j.clnu.2003.07.009
35. Zhou XL, Zhu WG, Zhu ZJ, et al. Lymphopenia in esophageal squamous cell carcinoma: relationship to malnutrition, various disease parameters, and response to concurrent chemoradiotherapy. Oncologist. 2019;24(8):e677–e686. doi:10.1634/theoncologist.2018-0723
36. McMillan DC. The systemic inflammation-based Glasgow Prognostic Score: a decade of experience in patients with cancer. Cancer Treat Rev. 2013;39(5):534–540. doi:10.1016/j.ctrv.2012.08.003
37. Zhang X, Tang M, Zhang Q, et al. The GLIM criteria as an effective tool for nutrition assessment and survival prediction in older adult cancer patients. Clin Nutr. 2021;40(3):1224–1232. doi:10.1016/j.clnu.2020.08.004
38. Ringel AE, Drijvers JM, Baker GJ, et al. Obesity shapes metabolism in the tumor microenvironment to suppress anti-tumor immunity. Cell. 2020;183(7):1848–1866.e26. doi:10.1016/j.cell.2020.11.009
39. Takahashi T, Kaneoka Y, Maeda A, et al. The preoperative prognostic nutrition index is a prognostic indicator for survival in elderly gastric cancer patients after gastrectomy: a propensity score-matched analysis. Updates Surg. 2020;72(2):483–491. doi:10.1007/s13304-020-00745-2
40. Salati M, Filippi R, Vivaldi C, et al. The prognostic nutritional index predicts survival and response to first-line chemotherapy in advanced biliary cancer. Liver Int. 2020;40(3):704–711. doi:10.1111/liv.14314
41. Watanabe I, Kanauchi N, Watanabe H. Preoperative prognostic nutritional index as a predictor of outcomes in elderly patients after surgery for lung cancer. Jpn J Clin Oncol. 2018;48(4):382–387. doi:10.1093/jjco/hyy014
42. Sánchez Y, Vaca-Paniagua F, Herrera L, et al. Nutritional indexes as predictors of survival and their genomic implications in gastric cancer patients. Nutr Cancer. 2021;73(8):1429–1439. doi:10.1080/01635581.2020.1797833
43. Esper DH, Harb WA. The cancer cachexia syndrome: a review of metabolic and clinical manifestations. Nutr Clin Pract. 2005;20:369–376. doi:10.1177/0115426505020004369
44. Floris G, Richard F, Hamy AS, et al. Body mass index and tumor-infiltrating lymphocytes in triple-negative breast cancer. J Natl Cancer Inst. 2021;113(2):146–153. doi:10.1093/jnci/djaa090
 © 2021 The Author(s). This work is published and licensed by Dove Medical Press Limited. The full terms of this license are available at https://www.dovepress.com/terms.php and incorporate the Creative Commons Attribution - Non Commercial (unported, v3.0) License.
By accessing the work you hereby accept the Terms. Non-commercial uses of the work are permitted without any further permission from Dove Medical Press Limited, provided the work is properly attributed. For permission for commercial use of this work, please see paragraphs 4.2 and 5 of our Terms.
© 2021 The Author(s). This work is published and licensed by Dove Medical Press Limited. The full terms of this license are available at https://www.dovepress.com/terms.php and incorporate the Creative Commons Attribution - Non Commercial (unported, v3.0) License.
By accessing the work you hereby accept the Terms. Non-commercial uses of the work are permitted without any further permission from Dove Medical Press Limited, provided the work is properly attributed. For permission for commercial use of this work, please see paragraphs 4.2 and 5 of our Terms.