")
Back to Journals » International Journal of Chronic Obstructive Pulmonary Disease » Volume 10 » Issue 1
Relationship between nutritional risk and exercise capacity in severe chronic obstructive pulmonary disease in male patients
Authors Shan X, Liu J, Luo Y, Xu X, Han Z, Li H
Received 2 February 2015
Accepted for publication 1 April 2015
Published 23 June 2015 Volume 2015:10(1) Pages 1207—1212
DOI https://doi.org/10.2147/COPD.S82082
Checked for plagiarism Yes
Review by Single anonymous peer review
Peer reviewer comments 2
Editor who approved publication: Dr Richard Russell
Xizheng Shan,1 Jinming Liu,2 Yanrong Luo,1 Xiaowen Xu,1 Zhiqing Han,1 Hailing Li1
1Department of Respiratory Medicine, Yangpu Hospital, Tongji University School of Medicine, Shanghai, People’s Republic of China; 2Department of Pulmonary Circulation, Pulmonary Hospital, Tongji University School of Medicine, Shanghai, People’s Republic of China
Objective: The nutritional status of chronic obstructive pulmonary disease (COPD) patients is associated with their exercise capacity. In the present study, we have explored the relationship between nutritional risk and exercise capacity in severe male COPD patients.
Methods: A total of 58 severe COPD male patients were enrolled in this study. The patients were assigned to no nutritional risk group (n=33) and nutritional risk group (n=25) according to the Nutritional Risk Screening (NRS, 2002) criteria. Blood gas analysis, conventional pulmonary function testing, and cardiopulmonary exercise testing were performed on all the patients.
Results: Results showed that the weight and BMI of the patients in the nutritional risk group were significantly lower than in the no nutritional risk group (P<0.05). The pulmonary diffusing capacity for carbon monoxide of the no nutritional risk group was significantly higher than that of the nutritional risk group (P<0.05). Besides, the peak VO2 (peak oxygen uptake), peak O2 pulse (peak oxygen pulse), and peak load of the nutritional risk group were significantly lower than those of the no nutritional risk group (P<0.05) and there were significantly negative correlations between the NRS score and peak VO2, peak O2 pulse, or peak load (r<0, P<0.05).
Conclusion: The association between exercise capacity and nutritional risk based on NRS 2002 in severe COPD male patients is supported by these results of this study.
Keywords: nutritional risk, exercise capacity, chronic obstructive pulmonary disease, conventional pulmonary function testing, cardiopulmonary exercise testing
Introduction
Chronic obstructive pulmonary disease (COPD), as a common problem in the elderly, is a major cause of chronic morbidity and mortality throughout the world.1 It is characterized by chronic obstruction of expiratory flow affecting peripheral airways, and is often associated with chronic bronchitis and emphysema, thereby accelerating the decline in lung function.2,3
Previous studies have found that nutritional status is the prognostic factor that is associated with the mortality in COPD.4–6 Weight loss is the major characteristic of malnutrition in COPD.7 In 2002, “nutritional risk” was defined by the European Society for Parenteral and Enteral Nutrition (ESPEN).8 Recently, nutritional risk was found to be associated with the exacerbation of COPD in the patients who were hospitalized because of COPD.9 Meanwhile, it has been reported that nutritional risk is related to the development of COPD in male smokers.10
In addition, the exercise capacity is also another factor related to mortality in COPD.11 Limitation of the exercise capacity seriously affects the quality of life in COPD patients.12 Therefore, many studies have aimed at strategies for improving the exercise capacity of COPD patients.13,14 However, this effective and feasible strategy still needs further exploration. It has been reported that nutritional status could affect the exercise capacity in COPD patients.15,16 Moreover, nutritional supply seems to contribute to improving the exercise capacity.15,17 In view of these findings, we speculated that there might be some relationship between nutritional risk and exercise capacity. Therefore, we explored this relationship in severe COPD male patients in this study, which could provide evidence for the effect of nutritional supply on exercise capacity.
Materials and methods
Patients
Between January 2012 and December 2013, a total of 58 severe COPD male patients (age range: 47–78 years) who were hospitalized in the Department of Respiratory Medicine, Shanghai Pulmonary Hospital, affiliated to Tongji University, were enrolled in the present study. All the patients were diagnosed with severe COPD (forced expiratory volume in 1 second as percentage of predicted, FEV1%pred <50) according to the new Global initiative for chronic Obstructive Lung Disease (GOLD) classification criteria of 2012.18 The patients were excluded if they had diseases in other organs (such as the cardiovascular, renal, endocrine, digestive, and nervous systems). The study protocol was approved by the Ethics Committee of Tongji University. Patients provided written informed consent before inclusion.
Nutritional risk assessment
Before nutritional risk assessment, the height (m) and weight (kg) of patients were measured. Body mass index (BMI) was calculated according to formula BMI = weight/height squared (kg/m2). Nutritional risk assessment was conducted using the continuous sampling method according to the Nutritional Risk Screening (NRS, 2002) criteria developed by ESPEN.19 The NRS score (0–7) was the sum of the scores in disease severity, nutritional status, and age. Disease severity of the patients was scored based on the diagnosis records at admission. The nutritional status of each patient was scored based on the changes in body weight and BMI in the recent 1–3 months and food intake in the recent 1 week. Besides, one score was assigned to the patients who were more than 70 years old. According to the NRS score, the patients were divided into two groups: nutritional risk group (NRS score ≥3) and no nutritional risk group (NRS score <3).
Blood gas analysis
Blood samples were collected from the right forearm radial artery before conventional pulmonary function testing (PFT) and cardiopulmonary exercise testing (CPET) were performed. Blood gas analysis was performed to confirm whether partial pressure of oxygen in the artery (PaO2) and partial pressure of carbon dioxide in the artery (PaCO2) were in the normal range (PaO2: 80–100 mmHg; PaCO2: 35–45 mmHg) using an ABL 800 FLEX blood gas analyzer (Radiometer Medical A/S, Copenhagen, Denmark). It was used to evaluate whether the patients had respiratory failure. Patients with respiratory failure were excluded from this study.
PFT and CPET
PFT and CPET were performed on the patients in stable condition.
A Master Screen Diffusion system (Jaeger Corp., Hoechberg, Germany) was used for PFT. Strict calibration was required before PFT. Prediction equations for normal lung function, which were developed in 1988, were used in this assessment.20 The following parameters were detected in this testing: forced vital capacity (FVC), forced expiratory volume in 1 second (FEV1), FEV1%pred, FEV1/FVC ratio, residual volume (RV), total lung capacity (TLC), RV/TLC, and pulmonary diffusing capacity for carbon monoxide (DLco). PFT was performed three times for each patient and the best result was chosen for analysis.
CPET was performed using a cardiopulmonary exercise testing system (Mastercreen-CPX; Jaeger Corp.). Before CPET was performed, the flow sensors and gas analyzers were strictly calibrated. In this testing, a symptom-limited incremental exercise test was performed with different loads (10–25 W/min) based on the conditions of the patients.21 During testing, the indicators, consisting of 12-lead electrocardiogram (ECG), blood pressure, pulse oximetry, pulmonary ventilation, gas exchange of oxygen and carbon dioxide (real-time breath-by-breath analysis), and anaerobic threshold (AT, V-slope analysis), were monitored. First, a 3-minute rest was used to stabilize the data of each indicator. Afterward, exercise without load was performed for 3 minutes, and then the load was gradually increased until some symptoms (such as leg pain, exhaustion, or difficulty in breathing) occurred. In addition, the testing would be stopped when one of the following conditions occurred: 1) 2 mm of ST-segment depression with chest pain or 3 mm of ST segment without chest pain; 2) frequent ventricular premature beat; 3) second- or third-degree atrioventricular block; 4) systolic blood pressure ≥250 mmHg or/and diastolic blood pressure ≥120 mmHg; 5) decreased blood pressure ≥30 mmHg compared to the baseline level; or 6) pulse oxygen saturation ≤80%. The prediction value for CEPT was calculated according to the American Thoracic Society/American College of Chest Physicians statement on CPET in 2003.22,23 After testing, the following data were recorded: peak load, peak VO2 (peak oxygen uptake), peak VO2%pred (peak oxygen uptake as percentage of predicted), peak VO2/kg (peak oxygen uptake per kilogram of body mass), peak O2 pulse (peak oxygen pulse).
Statistical analyses
Data are shown as mean ± SD. A two-sample t-test was used for comparison between the groups. The correlations between NRS score and peak VO2, peak O2 pulse, or peak load were determined using Pearson correlation analysis. For all the analysis, P<0.05 was considered statistically significant.
Results
Characteristics of patients
Among the total 58 severe COPD male patients, 25 were assessed as having nutritional risk and assigned to the nutritional risk group. The other 33 patients without nutritional risk were enrolled into the no nutritional risk group. The age (no nutritional risk group, 63.73±9.03 years; nutritional risk group, 61.52±7.13 years; P=0.319) and the height (no nutritional risk group, 166.52±6.10 cm; nutritional risk group, 167.12±5.83 cm; P=0.707) of the patients in the nutritional risk group were similar to those in the no nutritional risk group. However, the weight (no nutritional risk group, 64.58±6.31 kg; nutritional risk group, 51.24±4.68 kg; P<0.0001) and BMI (no nutritional risk group, 23.30±2.02 m/kg; nutritional risk group, 18.34±1.33 m/kg; P<0.0001) of the patients in the nutritional risk group were significantly lower than those in the no nutritional risk group (Table 1).
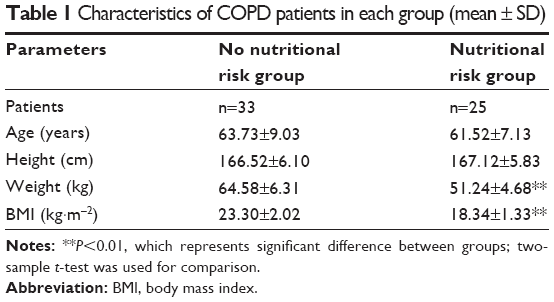 | Table 1 Characteristics of COPD patients in each group (mean ± SD) |
Results for blood gas analysis
Before exercise, there was no statistically significant difference in PaO2 (no nutritional risk group, 73.30±10.71; nutritional risk group, 73.68±13.00; P=0.903) and PaCO2 (no nutritional risk group, 42.85±6.82; no nutritional risk group, 41.95±7.84; P=0.643) between severe COPD male patients with and without nutritional risk (Table 2). All the patients had normal PaCO2 and PaO2. No one was excluded due to respiratory failure.
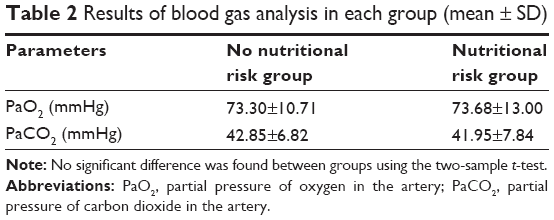 | Table 2 Results of blood gas analysis in each group (mean ± SD) |
Pulmonary function comparison between groups
The results for PFT are shown in Table 3. There was no significant difference between severe COPD male patients with and without nutritional risk in FVC (no nutritional risk group, 2.26±0.53; nutritional risk group, 2.29±0.67; P=0.850), FEV1 (no nutritional risk group, 0.86±0.25; nutritional risk group, 0.80±0.23; P=0.353), FEV1%pred (no nutritional risk group, 32.40±8.47; nutritional risk group, 29.00±8.97; P=0.146), FEV1/FVC (no nutritional risk group, 37.92±5.34; nutritional risk group, 36.39±8.47; P=0.433), TLC (no nutritional risk group, 7.89±1.39; nutritional risk group, 7.80±1.93; P=0.844), RV (no nutritional risk group, 5.66±1.31; nutritional risk group, 5.66±2.12; P=1.000), and RV/TLC (no nutritional risk group, 71.28±6.53; nutritional risk group, 71.40±11.01; P=0.962). Nevertheless, the DLCO (no nutritional risk group, 11.98±4.02; nutritional risk group, 8.97±4.37; P=0.009) of the patients in the no nutritional risk group was significantly higher than that of the patients in the nutritional risk group.
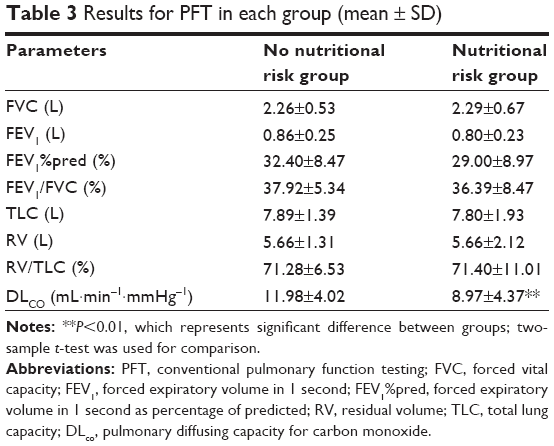 | Table 3 Results for PFT in each group (mean ± SD) |
Results for CPET
As shown in Table 4, the severe COPD male patients in the no nutritional risk group had significantly higher peak VO2 (no nutritional risk group, 1,068.33±327.38; nutritional risk group, 871.24±219.37; P=0.008), peak VO2%pred (no nutritional risk group, 60.27±17.13; nutritional risk group, 52.04±12.64; P=0.048), and peak O2 pulse (no nutritional risk group, 8.80±2.37; nutritional risk group, 7.32±1.47; P=0.008) than those in the nutritional risk group. But there was no significant difference between the groups in peak load (no nutritional risk group, 61.21±30.04; nutritional risk group, 49.48±20.82; P=0.100) and peak VO2/kg (no nutritional risk group, 16.57±4.61; nutritional risk group, 16.92±3.50; P=0.753).
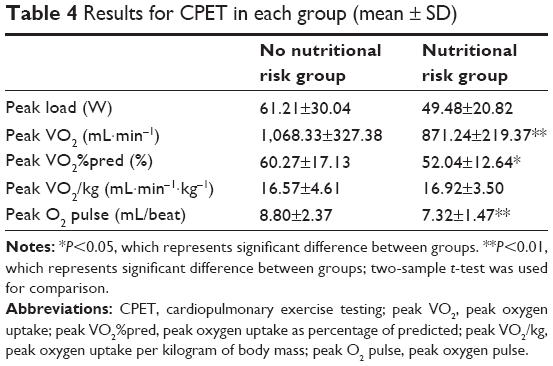 | Table 4 Results for CPET in each group (mean ± SD) |
Correlation between NRS score and peak VO2, peak O2 pulse, or peak load
Figure 1 shows the correlation between the NRS score and peak VO2, peak O2 pulse, or peak load. The results show that there are significant negative correlations between the NRS score and peak VO2 (r=−0.353, P<0.01), peak O2 pulse (r=−0.322, P<0.05), or peak load (r=−0.272, P<0.05) in severe COPD male patients.
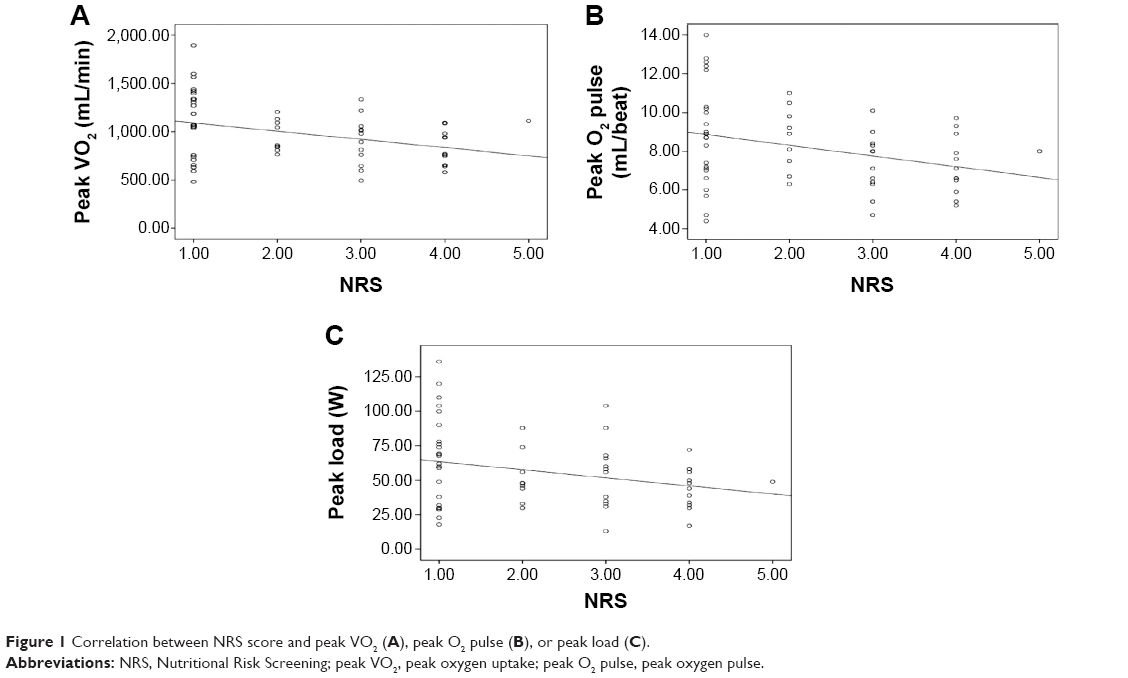 | Figure 1 Correlation between NRS score and peak VO2 (A), peak O2 pulse (B), or peak load (C). |
Discussion
Lack of exercise capacity limits the quality of life of COPD patients.12 Some previous studies have found that there was an association between the nutritional status and exercise capacity in COPD patients.15,16 However, it is still unclear whether a correlation exists between nutritional risk and exercise capacity in COPD patients. Therefore, we investigated the relationship between nutritional risk and exercise capacity in severe COPD male patients.
In this study, we found significantly lower weight and BMI in severe COPD male patients with nutritional risk compared to those of severe COPD male patients without nutritional risk, which are the characteristics of COPD patients with nutritional risk.24–26 Besides, PFT showed that DLCO in severe COPD male patients without nutritional risk was significantly higher than that in severe COPD male patients with nutritional risk. It has been reported that reduced DLCO could impair exercise capacity in patients with heart failure through increased dead space ventilation.27 Meanwhile, a low DLCO could impair oxygen transport by a reduction in maximum oxygen consumption.28 Moreover, it has been reported that weakened exercise capacity is attributed to reduced locomotor muscle oxygen transport.29,30 Normally, oxygen transport would adaptively vary with oxygen demand during exercise,31,32 and oxygen uptake would increase during exercise for biochemical adaptations.33,34 Thus, the exercise capacity can decline through impaired oxygen transport, which cannot adaptively regulate the oxygen uptake during exercise.
As expected, the impaired oxygen transport might limit the oxygen uptake in severe COPD male patients with nutritional risk, as seen in this study. CPET showed that the peak VO2 and peak O2 pulse of the nutritional risk group were significantly lower than those of the no nutritional risk group and there were significant negative correlations between the NRS score and peak VO2 or peak O2 pulse. These results indicate that the oxygen uptake of severe COPD male patients with nutritional risk was significantly lower than that of severe COPD male patients without nutritional risk, which might be due to the impaired oxygen transport in COPD,33,35 thereby affecting the utilization of oxygen.36 It was reported that inadequate oxygen supply during exercise caused accumulation of oxygen deficit, which was responsible for the reduced exercise capacity in patients with COPD.37,38 Meanwhile, decreased muscle oxygen utilization could reduce the exercise capacity in patients with COPD.39 Thus, impaired oxygen transport may be the main reason for reduced exercise capacity in COPD patients with nutritional risk.
In addition, it has been reported that nutritional depletion is related to the respiratory and peripheral skeletal muscle function in outpatients with COPD.40,41 Nutritional supplements have been found to be useful for the prevention and treatment of exercise-induced skeletal muscle injury.42 Moreover, muscle function is associated with the oxygen transport.43–45 Thus, patients with nutritional risk may have decreased exercise capacity due to impaired oxygen transport. Given these facts, there may be a close relationship between nutritional risk and exercise capacity.
Furthermore, blood gas analysis indicated that the PaO2 and PaCO2 of patients were all in normal ranges before exercise and they were similar between groups. However, the PaO2 and PaCO2 were not measured after the exercise. The changes induced by exercise in oxygen and CO2 pressure in arterial blood could not be assessed. This is a limitation of this study. Further studies are required to investigate whether nutritional risk could affect the changes induced by exercise in oxygen and CO2 pressures in arterial blood.
Besides the above results, there are some other limitations of this study. First, we enrolled only male patients, and the sample size was small. Second, we assessed only the total weight but not the fat-free mass, so further studies are required. In addition, not all of the indicators in PFT and CEPT were found to be associated with the nutritional risk. Thus, the relationship between nutritional risk and exercise capacity should be further investigated in female patients and also studies with large sample sizes for verifying the result of this study.
Conclusion
The results of this study supported the association between exercise capacity and nutritional risk according to NRS 2002 in severe COPD male patients. The impairment of oxygen transport may be the main mechanism of this relationship between nutritional risk and exercise capacity. More studies are needed to confirm this relationship in COPD.
Disclosure
The authors declare no conflicts of interest in this work.
References
Nazir SA, Erbland ML. Chronic obstructive pulmonary disease: an update on diagnosis and management issues in older adults. Drugs Aging. 2009;26:813–831. | ||
Suzuki M, Makita H, Ostling J, et al. Lower leptin/adiponectin ratio and risk of rapid lung function decline in chronic obstructive pulmonary disease. Ann Am Thorac Soc. 2014;11(10):1511–1519. | ||
Donaldson GC, Seemungal TA, Bhowmik A, Wedzicha JA. Relationship between exacerbation frequency and lung function decline in chronic obstructive pulmonary disease. Thorax. 2002;57:847–852. | ||
Hallin R, Gudmundsson G, Suppli Ulrik C, et al. Nutritional status and long-term mortality in hospitalised patients with chronic obstructive pulmonary disease (COPD). Respir Med. 2007;101:1954–1960. | ||
Gray-Donald K, Gibbons L, Shapiro SH, Macklem PT, Martin JG. Nutritional status and mortality in chronic obstructive pulmonary disease. Am J Respir Crit Care Med. 1996;153:961–966. | ||
Landbo C, Prescott E, Lange P, Vestbo J, Almdal TP. Prognostic value of nutritional status in chronic obstructive pulmonary disease. Am J Respir Crit Care Med. 1999;160:1856–1861. | ||
Schwartz DB. Malnutrition in chronic obstructive pulmonary disease. Respir Care Clin N Am. 2006;12:521–531. | ||
Anthony PS. Nutrition screening tools for hospitalized patients. Nutr Clin Pract. 2008;23:373–382. | ||
Hallin R, Koivisto-Hursti UK, Lindberg E, Janson C. Nutritional status, dietary energy intake and the risk of exacerbations in patients with chronic obstructive pulmonary disease (COPD). Respir Med. 2006;100:561–567. | ||
Celik F, Topcu F. Nutritional risk factors for the development of chronic obstructive pulmonary disease (COPD) in male smokers. Clin Nutr. 2006;25:955–961. | ||
Oga T, Nishimura K, Tsukino M, Sato S, Hajiro T. Analysis of the factors related to mortality in chronic obstructive pulmonary disease: role of exercise capacity and health status. Am J Respir Crit Care Med. 2003;167:544–549. | ||
Jacobsen R, Frølich A, Godtfredsen NS. Impact of exercise capacity on dyspnea and health-related quality of life in patients with chronic obstructive pulmonary disease. J Cardiopulm Rehabil Prev. 2012;32:92–100. | ||
Broekhuizen R, Wouters E, Creutzberg E, Weling-Scheepers C, Schols A. Polyunsaturated fatty acids improve exercise capacity in chronic obstructive pulmonary disease. Thorax. 2005;60:376–382. | ||
Pascual-Guardia S, Wodja E, Gorostiza A, et al. Mejoría de la calidad de vida y capacidad de ejercicio sin cambios en la biología muscular tras entrenamiento general en pacientes con enfermedad pulmonar obstructiva crónica grave. [Improvement in quality of life and exercise capacity without muscular biology changes after general training in patients with severe chronic obstructive pulmonary disease]. Med Clin. 2013;140:200–206. Spanish. | ||
Steiner MC, Barton RL, Singh SJ, Morgan MD. Nutritional enhancement of exercise performance in chronic obstructive pulmonary disease: a randomised controlled trial. Thorax. 2003;58:745–751. | ||
Sabino PG, Silva BM, Brunetto AF. Nutritional status is related to fat-free mass, exercise capacity and inspiratory strength in severe chronic obstructive pulmonary disease patients. Clinics. 2010;65:599–605. | ||
Rao Y, Xing X, Guo X. Effect of breathing-exercise combined with nutritional support treatment on rehabilitation in patients with chronic obstructive pulmonary disease. J North China Coal Med Univ. 2010;5:004. | ||
Lange P, Marott JL, Vestbo J, et al. Prediction of the clinical course of chronic obstructive pulmonary disease, using the new gold classification: a study of the general population. Am J Respir Crit Care Med. 2012;186:975–981. | ||
Kondrup J, Rasmussen HH, Hamberg O, Stanga Z; Ad Hoc ESPEN Working Group. Nutritional risk screening (NRS 2002): a new method based on an analysis of controlled clinical trials. Clin Nutr. 2003;22:321–336. | ||
Zhao RY, Zhu L, Li L, Chen Q, Yang YJ. 1988. | ||
Yan R, Yang W, Liu J, Gao B, Guo K, Sun D. Cardiopulmonary exercise capacity and ventilation effectiveness in patients after clinical cure of acute irritant gas poisoning. Cell Biochem Biophys. 2015;71(2):789–794. | ||
Ross RM. ATS/ACCP statement on cardiopulmonary exercise testing. Am J Respir Crit Care Med. 2003;167:1451; author reply 1451. | ||
American Thoracic Society; American College of Chest Physicians. ATS/ACCP statement on cardiopulmonary exercise testing. Am J Respir Crit Care Med. 2003;167:211–277. | ||
Hanson AM, Harrison BC, Young MH, Stodieck LS, Ferguson VL. Longitudinal characterization of functional, morphologic, and biochemical adaptations in mouse skeletal muscle with hindlimb suspension. Muscle Nerve. 2013;48:393–402. | ||
Rossiter HB, Howlett RA, Holcombe HH, Entin PL, Wagner HE, Wagner PD. Age is no barrier to muscle structural, biochemical and angiogenic adaptations to training up to 24 months in female rats. J Physiol. 2005;565:993–1005. | ||
Laude K, Cai H, Fink B, et al. Hemodynamic and biochemical adaptations to vascular smooth muscle overexpression of p22phox in mice. Am J Physiol Heart Circ Physiol. 2005;288:H7–H12. | ||
Hicks A, Ohlendieck K, Gopel SO, Pette D. Early functional and biochemical adaptations to low-frequency stimulation of rabbit fast-twitch muscle. Am J Physiol. 1997;273:C297–C305. | ||
McAllister RM, Reiter BL, Amann JF, Laughlin MH. Skeletal muscle biochemical adaptations to exercise training in miniature swine. J Appl Physiol. 1997;82:1862–1868. | ||
Wetter TJ, Harms CA, Nelson WB, Pegelow DF, Dempsey JA. Influence of respiratory muscle work on VO(2) and leg blood flow during submaximal exercise. J Appl Physiol. 1999;87:643–651. | ||
Harms CA, Wetter TJ, St Croix CM, Pegelow DF, Dempsey JA. Effects of respiratory muscle work on exercise performance. J Appl Physiol. 2000;89:131–138. | ||
Shaw SR, Zernicke RF, Vailas AC, DeLuna D, Thomason DB, Baldwin KM. Mechanical, morphological and biochemical adaptations of bone and muscle to hindlimb suspension and exercise. J Biomech. 1987;20:225–234. | ||
Dudley GA, Abraham WM, Terjung RL. Influence of exercise intensity and duration on biochemical adaptations in skeletal muscle. J Appl Physiol Respir Environ Exerc Physiol. 1982;53:844–850. | ||
Holloszy JO, Booth FW. Biochemical adaptations to endurance exercise in muscle. Annu Rev Physiol. 1976;38:273–291. | ||
Holloszy JO. Biochemical adaptations in muscle. Effects of exercise on mitochondrial oxygen uptake and respiratory enzyme activity in skeletal muscle. J Biol Chem. 1967;242:2278–2282. | ||
Terjung RL, Koerner JE. Biochemical adaptations in skeletal muscle of trained thyroidectomized rats. Am J Physiol. 1976;230:1194–1197. | ||
Bhan A, Malhotra A, Scheuer J. Biochemical adaptations in cardiac muscle: effects of physical training on sulfhydryl groups of myosin. J Mol Cell Cardiol. 1975;7:435–442. | ||
Yano T, Yunoki T, Ogata H. Relationship in simulation between oxygen deficit and oxygen uptake in decrement-load exercise starting from low exercise intensity. J Physiol Anthropol Appl Human Sci. 2003;22:1–5. | ||
Sperlich B, Schiffer T, Hoffmann U, Strueder HK, Hollmann W. The spirografic oxygen deficit: its role in cardiopulmonary exercise testing. Int J Sports Med. 2013;34(12):1074–1078. | ||
Oscai LB, Holloszy JO. Biochemical adaptations in muscle. II. Response of mitochondrial adenosine triphosphatase, creatine phosphokinase, and adenylate kinase activities in skeletal muscle to exercise. J Biol Chem. 1971;246:6968–6972. | ||
Engelen MP, Schols AM, Baken WC, Wesseling GJ, Wouters EF. Nutritional depletion in relation to respiratory and peripheral skeletal muscle function in out-patients with COPD. Eur Respir J. 1994;7:1793–1797. | ||
Izawa KP, Watanabe S, Hirano Y, et al. The relation between geriatric nutritional risk index and muscle mass, muscle strength, and exercise capacity in chronic heart failure patients. Int J Cardiol. 2014;177:1140–1141. | ||
Bloomer RJ. The role of nutritional supplements in the prevention and treatment of resistance exercise-induced skeletal muscle injury. Sports Med. 2007;37:519–532. | ||
Arai E, Watanabe S, Takeyasu N, et al. OJ-347 relation between muscle function and early dynamics of oxygen uptake at the onset of constant workload exercise (exercise test/cardiac rehabilitation 4 (IHD): OJ42)(oral presentation (Japanese)). Circ J. 2004;68:313. | ||
Gregorevic P, Lynch GS, Williams DA. Hyperbaric oxygen improves contractile function of regenerating rat skeletal muscle after myotoxic injury. J Appl Physiol. 2000;89:1477–1482. | ||
Hoppeler H, Weibel ER. Structural and functional limits for oxygen supply to muscle. Acta Physiol Scand. 2000;168:445–456. |
 . [The applicability of the 1988 version of the prediction equations for adult normal lung function in shanghai]. Zhonghua Jie He He Hu Xi Za Zhi. 2011;34:586–589. Chinese.
 © 2015 The Author(s). This work is published and licensed by Dove Medical Press Limited. The full terms of this license are available at https://www.dovepress.com/terms.php and incorporate the Creative Commons Attribution - Non Commercial (unported, v3.0) License.
By accessing the work you hereby accept the Terms. Non-commercial uses of the work are permitted without any further permission from Dove Medical Press Limited, provided the work is properly attributed. For permission for commercial use of this work, please see paragraphs 4.2 and 5 of our Terms.
© 2015 The Author(s). This work is published and licensed by Dove Medical Press Limited. The full terms of this license are available at https://www.dovepress.com/terms.php and incorporate the Creative Commons Attribution - Non Commercial (unported, v3.0) License.
By accessing the work you hereby accept the Terms. Non-commercial uses of the work are permitted without any further permission from Dove Medical Press Limited, provided the work is properly attributed. For permission for commercial use of this work, please see paragraphs 4.2 and 5 of our Terms.