")
Back to Journals » Diabetes, Metabolic Syndrome and Obesity » Volume 7
Relationship between insulin resistance and plasma vitamin D in adults
Authors Badawi A, Sayegh S, Sadoun E, Al-Thani M, Arora P, Haddad P
Received 12 January 2014
Accepted for publication 13 February 2014
Published 7 July 2014 Volume 2014:7 Pages 297—303
DOI https://doi.org/10.2147/DMSO.S60569
Checked for plagiarism Yes
Review by Single anonymous peer review
Peer reviewer comments 4
Alaa Badawi,1 Suzan Sayegh,2 Eman Sadoun,3 Mohamed Al-Thani,2 Paul Arora,4 Pierre S Haddad5
1Office of Biotechnology, Genomics and Population Health, Public Health Agency of Canada, Toronto, ON, Canada; 2Department of Public Health, 3Clinical Research Division, Supreme Council of Health, Doha, Qatar; 4Dalla Lana School of Public Health, University of Toronto, ON, Canada; 5Department of Pharmacology, Faculty of Medicine, University of Montreal, Montreal, QC, Canada
Abstract: A recent relationship between vitamin D deficiency and the risk of type 2 diabetes mellitus (T2DM) and insulin resistance has been established through several studies. Research suggests a correlation between serum vitamin D and glycemic status measures. The aim of this study was to investigate the relationship between the plasma vitamin D levels (25[OH]D) and the factors linked to insulin resistance in a representative sample of Canadians ranging in age from 16–79 years. Data were used from the Canadian Health Measures Survey where direct measures of health and wellness were reported from 1,928 subjects. These data were gathered from March 2007–February 2009 at 15 sites selected through a multistage sampling strategy. An inverse relationship between insulin resistance and plasma vitamin D level in both men and women was observed. This study provides additional evidence for the role of vitamin D in T2DM. If causally associated, the supplementation of vitamin D may help in preventing insulin resistance and subsequent T2DM.
Keywords: HOMA-IR, plasma 25(OH)D, diabetes
Introduction
Type 2 diabetes mellitus (T2DM) is a major global health problem. About six people approximately die every minute from the disease worldwide; a rate that will soon portray T2DM as one of the most prevalent health problems in the world.1 T2DM is associated with increased morbidity and mortality due to its predisposing factor for cardiovascular disease and stroke. T2DM risk factors include age ≥40 years, obesity, ethnicity, genetics, diet, and physical activity.2,3
T2DM is a progressive chronic disease recognized by both insulin resistance and β-cell dysfunction. Insulin resistance is described as the inadequate response of the skeletal muscle, liver, and adipose tissue to the endogenous insulin secretions. In addition to insulin resistance, β-cell dysfunction plays an integral role in the pathogenesis of T2DM. In healthy individuals, β-cells can reverse insulin resistance by increasing the production and secretion of insulin.4 Glucose sensors located on β-cells sense the rising blood glucose levels despite high insulin secretion. This continuous hyperglycemia generates a series of events, which eventually cause an increase in β-cell expression, β-cell mass, and enhanced insulin secretion capacity of the pancreas. This upregulation in β-cell activity is disrupted in subjects with T2DM.5
Recently, a novel association between vitamin D deficiency and T2DM has been proposed.6 Several studies have revealed the existing link between vitamin D status and the risk of T2DM or insulin resistance. Vitamin D deficiency is thought to influence insulin resistance and the pathogenesis of T2DM by affecting either insulin sensitivity, β-cell function, or both.7,8 Several cross-sectional studies have shown the existing inverse relationship between serum vitamin D (25[OH]D) and glycemic status measures, such as oral glucose tolerance tests, hemoglobin A1c (HbA1c), fasting plasma glucose, and insulin resistance (defined from the homeostatic model assessment [HOMA-IR]) as well as with conditions such as metabolic syndrome and obesity, in both diabetic and healthy subjects.9–16
Certain mechanisms have been suggested to further describe the role of vitamin D deficiency in insulin resistance. Vitamin D deficiency may play a role in mediating low-grade inflammation resulting from an imbalanced innate immune system, related proinflammatory cytokines, and acute phase reactants.6,20,21
This mechanism has been linked to diverse chronic disorders (eg, metabolic syndrome, obesity, and insulin resistance) that predispose individuals deficient in vitamin D to the development of T2DM at a later stage.6,21 Furthermore, polymorphisms of genes related to vitamin D metabolism (vitamin D 1α-hydroxylase, CYP27B1), transport (vitamin D binding protein), and action (vitamin D receptors) all affect insulin release and may disrupt vitamin D overall efficacy.22–26 Moreover, vitamin D deficiency is commonly linked to a status of hypocalcemia that can cause a decrease in glucose-stimulated insulin secretion in β-cell.27 Low serum vitamin D levels are also associated with elevating parathyroid hormones (PTH), which lead to reduced glucose uptake by liver, muscle, and adipose cell.28
Despite the overall inverse association observed between vitamin D intake or serum level and the development of insulin resistance, findings are still conflicting. For example, serum vitamin D concentration has not correlated with insulin action or secretion in Europeans with metabolic syndrome.17 Therefore, additional investigations are warranted to further explore this relationship in different populations. Given the role of insulin resistance in the later manifestation of T2DM and cardiovascular diseases, if the relationship is causal, strategies to improve the status of vitamin D may be proposed in a public health setting given recent evidence demonstrating vitamin D insufficiency in several regions around the world (eg,18,19), notably the Northern hemisphere.
The present study attempts to quantify the association between plasma vitamin D levels, insulin resistance, and related factors in a representative sample of the general Canadian population using data from the Canadian Health Measures Survey (CHMS).29
Materials and methods
Study design and population
Data were used from the CHMS cycle 3.1, which is a representative sample of Canadians ranging in age from 16–79 years. The direct indicators of wellness and health were measured among this population. Details regarding the sampling design and strategy, methods, and data collection have been published elsewhere.29 Data were gathered from March 2007–February 2009 among 15 sites that were selected through a multistage sampling strategy. These sites cover 96.3% of the Canadian population; however, people residing in the Crown lands, Aboriginal reserves, remote regions, health institutions, and full-time members of the Canadian Forces were excluded. Out of the 8,772 households selected, 6,106 agreed to participate in this study at a response rate of 69.6%. A total of 6,604 (88.3%) people out of 7,483 people selected from these households agreed to respond to the study questionnaire where 5,604 (84.9%) of the 6,604 agreed to provide their physical measurements. The overall response rate for the survey was 51.7%. A written informed consent was provided by all participants and the study received approval from the Health Canada and the Public Health Agency of Canada’s Research Ethics Board. Subjects younger than 16 years and nonfasting survey responders were excluded from this study. This resulted in a sample size of 1,928 people, representing 25,057,060 Canadians.18
Biologic and anthropometric measures
Details of the collection and handling of biological samples have been described elsewhere.30 By using standard operating procedures, at the Nutrition Research Division, Bureau of Nutritional Sciences, Health Canada Laboratory, samples were analyzed for cardiometabolic biomarkers, which includes fasting insulin, glucose, C-reactive protein (CRP), total cholesterol, triglycerides, low-density lipoprotein cholesterol, high-density lipoprotein cholesterol (HDL-C), as well as apolipoprotein A1 (ApoA1) and ApoB. The ratio of total cholesterol to HDL-C was calculated from measured values for total cholesterol and HDL-C. Body mass index (BMI) was derived from weight (kg) divided by height (m2) for the measured height and weight. Waist circumference was measured by using a measuring tape at the midpoint between the last floating rib and the top of the iliac crest in the midaxillary line. Systolic and diastolic blood pressures were measured by using BP-TRU automated oscillometric devices (BP-TRU Medical Devices, Ltd, Coquitlam, BC, Canada). Daily energy expenditure was calculated from self-reported leisure time physical activities during the past 3 months. Self-reported race of each person was categorized according to one of three groups: Caucasian; Asian (Korean, Filipino, Japanese, Chinese, South Asian, Southeast Asian, Arab, and West Asian); and other.
Insulin resistance and vitamin D
The HOMA-IR was computed from the fasting measures of both insulin (IU/mL) and glucose (mmol/mL) as insulin multiplied by glucose and divided by 22.5. As for plasma 25(OH)D, it was measured through chemiluminescence assay by using the Liaison 25-hydroxyvitamin D Total assay (DiaSorin Inc., Stillwater, MN, USA). Moreover, based on preliminary testing using external quality controls from Bio-Rad (Bio-Rad Laboratories Inc., Hercules, CA, USA) and DiaSorin, the within-run and between-run coefficients of variation for this assay varied from 3.2%–8.5% and 6.9%–12.7%, respectively. The samples analyzed by Health Canada appeared within these ranges.
Statistical analyses
All statistical analyses were carried out through the utilization of survey procedures in SAS version 9.2 (SAS Institute Inc., Cary, NC, USA). The α error was set at 0.05, and we reported two-sided P values. A P value of ≤0.05 was considered significant. We applied bootstrap weights for variance estimates and sampling weights for point estimates to account for the complex survey design. The distribution of continuous variables was examined through histogram plotting and natural log or square root transformed skewed variables as required before analysis to improve the relationships’ linearity and residuals’ normality. In addition, we used t-tests to explore the correlation between continuous variables, and χ2 tests to examine insulin resistance and related factors by sex. The unadjusted weighted mean level of insulin resistance was generated by quartiles of 25(OH)D. Linear regression models were developed to examine the linear association between insulin resistance and plasma levels of 25(OH)D adjusted for: waist circumference; sex; hormone use; physical activity; and the season of clinic visit to generate β coefficients and associated P-values. We dropped “age” from regression models due to its multicolinearity with waist circumference. We also dropped “race” from the models due to the existing heterogeneous nature and insignificant sample size of the non-Caucasian group.
Results and discussion
The present study explored the correlation between plasma vitamin D and insulin resistance in 1,928 Canadian subjects from the CHMS. Characteristics of the study population and the levels of metabolic phenotypes are presented in Table 1. On average, the study population was middle aged (mean age =43.5 years) and slightly overweight (mean BMI =26.8 kg/m2).31 The population had an even sex distribution and was predominantly Caucasian (84.8%). In the study population, serum levels of the cardiometabolic markers and the components of insulin resistance are within the normal clinical ranges. Plasma 25(OH)D level was 67.5 nmol/L, slightly below the cutoff level of sufficiency of 75 nmol/L.
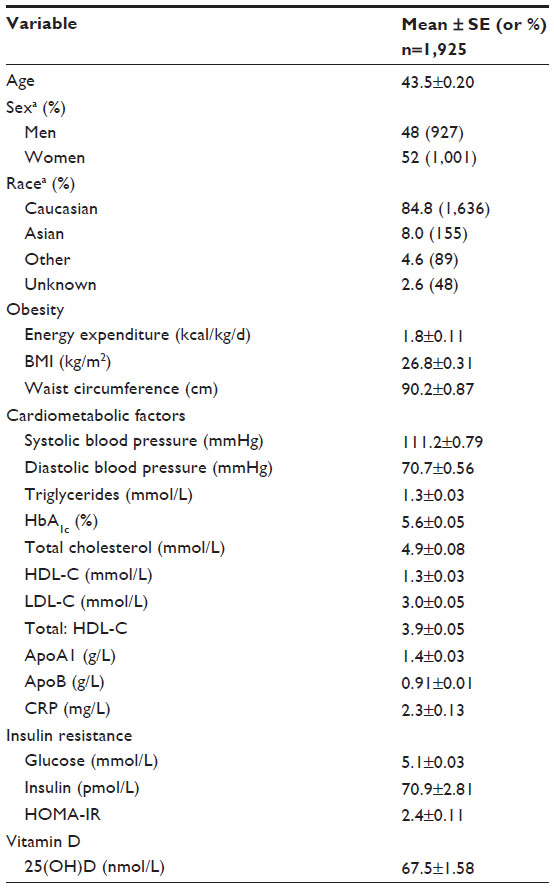 | Table 1 Characteristics of the study population |
Mean levels of glucose, insulin, and HOMA-IR by quartiles of plasma 25(OH)D are shown in Figure 1. The levels of plasma 25(OH)D for the different quartiles were, respectively, 38.1±0.8, 57.9±0.4, 74.4±0.4, and 102.5±2 nmol/L. Inverse linear associations were observed between plasma 25(OH)D, insulin (P<0.003; β=−0.16±0.04) and HOMA-IR (P=0.002; β=−0.18±0.05), but not glucose (Figure 1). The lack of association between vitamin D, insulin, and HOMA-IR – despite its absence with glucose – may be explained by the strong relationship in both males and females, as shown in Table 2, between serum 25(OH)D and insulin levels.
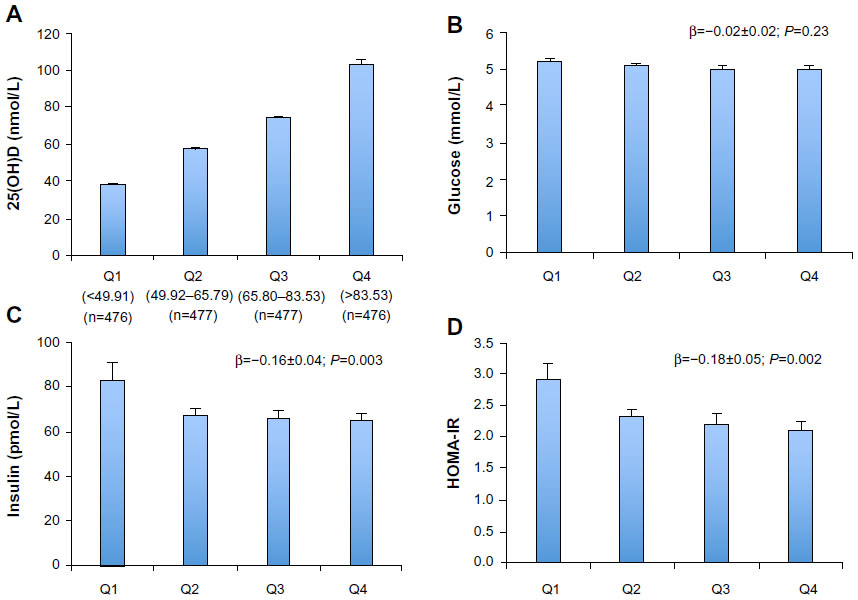 | Figure 1 Insulin resistance and related markers by quartile of vitamin D. |
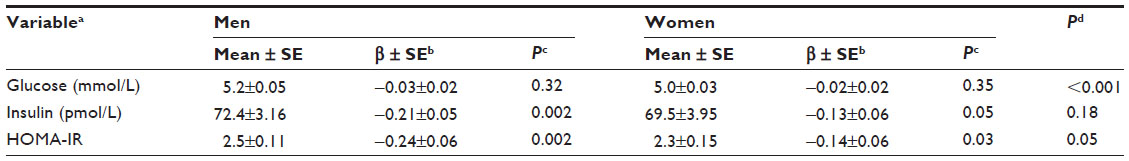 | Table 2 Linear regression examining insulin resistance and vitamin D in males and females |
The relationship between 25(OH)D and insulin resistance and its biomarkers segregated by sex is shown in Table 2. Levels of fasting glucose and HOMA-IR were significantly lower in women than in men. In both sexes, plasma 25(OH)D was inversely associated with insulin and HOMA-IR, but not glucose. We noted a trend showing that 25(OH)D may be a stronger predictor, among men than women, of fasting insulin levels and HOMA-IR: (insulin, β=−0.21 among men versus −0.13 among women; and HOMA-IR, β=−0.24 among men versus −0.14 among women).
We have thus examined the association between insulin resistance and its biomarkers and vitamin D status in a representative sample of Canadians and established its inverse association with insulin and insulin resistance. This pattern was similar for both men and women. Recently, we observed an inverse association between plasma 25(OH)D and metabolic syndrome risk14 and obesity15 in the Canadian population. Nevertheless, to our knowledge, this is the first study to explore the relation between insulin resistance and its biomarkers and plasma vitamin D levels in the general Canadian population. The inverse associations between insulin resistance and 25(OH)D are in agreement with previously published reports that have highlighted the association of low 25(OH)D with impaired biomarkers of glycemic control and lipid metabolism.14,32 The understanding of the degree to which disease-associated processes is affected by low nutritional status of vitamin D is essential to develop recommendations, at both the individual and population levels, to obtain and maintain adequate vitamin D levels. Although the present study is cross-sectional and only implicates an association between vitamin D insufficiency and insulin resistance rather than causality, together with previous research conducted in Canada and elsewhere,11,14,32,33 it suggests that the adequate vitamin D status among individuals may help prevent the development of insulin resistance and the subsequent T2DM.
Several mechanisms were suggested to further explore the role of vitamin D deficiency in insulin resistance. As we indicated earlier, vitamin D deficiency may be linked to low-grade innate immunity-related chronic inflammatory responses6,20,21 known to be associated a range of chronic conditions (including insulin resistance) that predispose individuals to the development of T2DM at a later stage.6,21 As stated above, polymorphisms in CYP27B1, vitamin D binding protein, and vitamin D receptors – that respectively mediate vitamin D synthesis, transport, and action – disrupt glucose homeostasis and the hormonal action of vitamin D.22–26 Furthermore, since serum 25(OH)D is a well-known regulator of PTH, the latter is a likely candidate to mediate systemic changes in glucose metabolism and uptake. The regulation of serum calcium levels via PTH and vitamin D has been proposed to control the effects of vitamin D on insulin resistance.27,28 It should be noted that there is little, if any, effect of age or sex on the PTH dynamics in adult population as previously observed.34
A number of in vitro studies suggested that vitamin D can play a role in improving insulin sensitivity and secretion.35,36 However, the associations between each of 25(OH)D, markers of insulin resistance, and glucose homeostasis in humans have been inconsistent.32,33,37,38 This inconsistency may be due to the small sample sizes and the different racial backgrounds as well as the disease status of the studied subjects. Recently, we reported an inverse association between 25(OH)D and insulin resistance, as measured by HOMA-IR, in people without diabetes.14 Such an inverse association was also apparent when diabetic subjects were included into the analysis. Taken together, these observations indicate a possible role for 25(OH)D in modulating glycemic responses, in both healthy people and individuals with impaired glycemic control. Vitamin D supplementation may have a role to play in modulating insulin resistance and in improving its downstream complications. We noted a trend indicating that 25(OH)D may be considered as a stronger predictor of glycemic control biomarkers in men than in women. Such a sex-based difference may be more apparent among populations with greater incidence of insulin resistance; further research is required to explore sex-tailored approaches for disease prevention.
Although the present study is representative of the racial distribution of the Canadian population, the small sample size in the non-Caucasian groups prevented examining the associations between 25(OH)D and insulin resistance in other Canadian ethnic groups living in Canada. Indeed, several studies have shown a race-associated variation in 25(OH)D levels, despite a similar vitamin D intake.39,40 Furthermore, we have indicated that lower serum 25(OH)D is more significant among Asian Canadians than their Caucasian counterparts.14 As such, the understanding of the existing relationship between 25(OH)D and insulin resistance across ethnic groups in Canada may contribute to the development of intervention strategies targeted to at-risk subpopulation. These ethnic-related differences and serum 25(OH)D levels may be linked to the interethnic genetic variability known to exist between various ethnicities.41 We cannot rule out the possibility of residual confounding from measured and unmeasured sources,42 including diet, work-or-transportation-related physical activity, sun exposure, or other unassessed biomarkers, such as leptin, fibroblast growth factor-23 (FGF-23), or α-Klotho.
Conclusion
The present study reports an inverse association between 25(OH)D and insulin resistance and its related biomarkers in a population-based cohort representative of Canadian adults. Our results contribute to the increased body of evidence suggesting that vitamin D moderates risk of T2DM associated processes at the population level. It should be noted that this study was cross-sectional in nature and, therefore, causality cannot be determined from the presented association and cannot be used to guide optimal vitamin D levels in at-risk population. However, if this relationship is causal, these findings suggest that recommending appropriate vitamin D intake may prevent insulin resistance and the subsequent possible development of T2DM.
Acknowledgments
SS, ES, and MA-T are supported by the Supreme Council of Health, Doha, Qatar.
Author contributions
AB conceived the study idea and design, acquisition, analysis and interpretation of data and wrote the manuscript. PA assisted in data acquisition, analysis and interpretation. ES, MA-T, SS and PSH provided input into the study and helped in drafting the article. All authors critically reviewed the manuscript, approved the final draft and agreed to be accountable for all aspects of the work.
Disclosure
The authors report no conflicts of interest in this work.
References
Rathmann W, Giani G. Global prevalence of diabetes: estimates for the year 2000 and projection for 2030. Diabetes Care. 2004;27(10):2568–2569. | |
Comeau P. New diabetes treatment and prevention strategies needed. CMAJ. 2007;176(10):1401–1402. | |
Moore AF, Florez JC. Genetic susceptibility to type 2 diabetes and implications for antidiabetic therapy. Annu Rev Med. 2008;59:95–111. | |
Swenne I. Pancreatic beta-cell growth and diabetes mellitus. Diabetologia. 1992;35(3):193–201. | |
Butler AE, Janson J, Bonner-Weir S, Ritzel R, Rizza RA, Butler PC. Beta-cell deficit and increased beta-cell apoptosis in humans with type 2 diabetes. Diabetes. 2003;52(1):102–110. | |
Badawi A, Klip A, Haddad P, et al. Type 2 diabetes mellitus and inflammation: Prospects for biomarkers of risk and nutritional intervention. Diabetes Metab Syndr Obes. 2010;3:173–186. | |
Deleskog A, Hilding A, Brismar K, Hamsten A, Efendic S, östenson CG. Low serum 25-hydroxyvitamin D level predicts progression to type 2 diabetes in individuals with prediabetes but not with normal glucose tolerance. Diabetologia. 2012;55(6):1668–1678. | |
Chiu KC, Chu A, Go VL, Saad MF. Hypovitaminosis D is associated with insulin resistance and beta cell dysfunction. Am J Clin Nutr. 2004;79(5):820–825. | |
Mokdad AH, Bowman BA, Ford ES, Vinicor F, Marks JS, Koplan JP. The continuing epidemics of obesity and diabetes in the United States. JAMA. 2001;286(10):1195–1200. | |
Badawi A, Garcia-Bailo B, Arora P, Al-Thani MH, Sadoun E, Farid M, El-Sohemy A. The utility of vitamins in the prevention of type 2 diabetes mellitus and its complications: A public health perspective. In: Oguntibeju O, editor. Diabetes Mellitus - Insights and Perspectives. Rijeka: InTech Publ; 2013;1–16. Doi: 10.5772/47834. | |
Ford ES, Ajani UA, McGuire LC, Liu S. Concentrations of serum vitamin D and the metabolic syndrome among US adults. Diabetes Care. 2005;28(5):1228–1230. | |
Hyppönen E, Power C. Vitamin D status and glucose homeostasis in the 1958 British birth cohort: the role of obesity. Diabetes Care. 2006;29(10):2244–2246. | |
Need AG, O’Loughlin PD, Horowitz M, Nordin BE. Relationship between fasting serum glucose, age, body mass index and serum 25 hydroxyvitamin D in postmenopausal women. Clin Endocrinol (Oxf). 2005;62(6):738–741. | |
Brenner DR, Arora P, Garcia-Bailo B, et al. Plasma vitamin D levels and risk of metabolic syndrome in Canadians. Clin Invest Med. 2011;34(6):E377–E384. | |
Da Costa LA, Arora P, García-Bailo B, Karmali M, El-Sohemy A, Badawi A. The association between obesity, cardiometabolic disease biomarkers, and innate immunity-related inflammation in Canadian adults. Diabetes Metab Syndr Obes. 2012;5:347–355. | |
Liu S, Song Y, Ford ES, Manson JE, Buring JE, Ridker PM. Dietary calcium, vitamin D, and the prevalence of metabolic syndrome in middle-aged and older US women. Diabetes Care. 2005;28(12):2926–2932. | |
Gulseth HL, Gjelstad IM, Tierney AC, et al. Serum vitamin D concentration does not predict insulin action or secretion in European subjects with the metabolic syndrome. Diabetes Care. 2010;33(4):923–925. | |
García-Bailo B, Da Costa LA, Arora P, Karmali M, El-Sohemy A, Badawi A. Plasma vitamin D and biomarkers of cardiometabolic disease risk in adult Canadians, 2007–2009. Prev Chronic Dis. 2013;10:E91. | |
Badawi A, Arora P, Sadoun E, Al-Thani A, Al-Thani MH. Prevalence of vitamin D deficiency in Qatar: a systematic review. J Pub Health Res. 2012;1(3):229–235. | |
García-Bailo B, Roke K, Mutch DM, El-Sohemy A, Badawi A. Association between circulating ascorbic acid, α-tocopherol, 25-hydroxyvitamin D, and plasma cytokine concentrations in young adults: a cross-sectional study. Nutr Metab (Lond). 2012;9(1):102. | |
Garcia-Bailo B, El-Sohemy A, Haddad P, Arora P, BenZaied F, Karmali M, Badawi A. Vitamins D, C, and E in the prevention of type 2 diabetes mellitus: modulation of inflammation and oxidative stress. Biologics. 2011;5:7–19. | |
Baier LJ, Dobberfuhl AM, Pratley RE, Hanson RL, Bogardus C. Variations in the vitamin D-binding protein (Gc locus) are associated with oral glucose tolerance in nondiabetic Pima Indians. J Clin Endocrinol Metab. 1998;83(8):2993–2996. | |
McDermott MF, Ramachandran A, Ogunkolade BW, et al. Allelic variation in the vitamin D receptor influences susceptibility to IDDM in Indian Asians. Diabetologia. 1997;40(8):971–975. | |
Pani MA, Knapp M, Donner H, et al. Vitamin D receptor allele combinations influence genetic susceptibility to type 1 diabetes in Germans. Diabetes. 2000;49(3):504–507. | |
Malecki MT, Klupa T, Wolkow P, Bochenski J, Wanic K, Sieradzki J. Association study of the vitamin D: 1alpha-hydroxylase (CYP1alpha) gene and type 2 diabetes mellitus in a Polish population. Diabetes Metab. 2003;29(2 Pt 1):119–124. | |
García-Bailo B, Jamnik J, Da Costa LA, Badawi A, El-Sohemy A. Genetic variation in the vitamin D receptor, plasma 25-hydroxyvitamin D, and biomarkers of cardiometabolic disease in Caucasian young adults. J Nutrigenet Nutrigenomics. 2013;6(4–5):256–267. | |
Beaulieu C, Kestekian R, Havrankova J, Gascon-Barré M. Calcium is essential in normalizing intolerance to glucose that accompanies vitamin D depletion in vivo. Diabetes. 1993;42(1):35–43. | |
Teegarden D, Donkin SS. Vitamin D: emerging new roles in insulin sensitivity. Nutr Res Rev. 2009;22(1):82–92. | |
Tremblay MS, Connor Gorber SC. Canadian health measures survey: brief overview. Can J Public Health. 2007;98(6):453–456. | |
Giroux S. Canadian Health Measures Survey: sampling strategy overview. Health Rep. 2007;18 Suppl:31–36. | |
Health Canada. Health Risk Classification According to Body Mass Index (BMI); 2003. Available from: www.hc-sc.gc.ca/fn-an/nutrition/weights-poids/guide-ld-adult/cg_quick_ref-ldc_rapide_ref-table1-eng.php. Accessed June 6, 2014. | |
Kayaniyil S, Vieth R, Retnakaran R, et al. Association of vitamin D with insulin resistance and beta-cell dysfunction in subjects at risk for type 2 diabetes. Diabetes Care. 2010;33(6):1379–1381. | |
Scragg R, Sowers M, Bell C; Third National Health and Nutrition Examination Survey. Serum 25-hydroxyvitamin D, diabetes, and ethnicity in the Third National Health and Nutrition Examination Survey. Diabetes Care. 2004;27(12):2813–2818. | |
Haden ST, Brown EM, Hurwitz S, Scott J, El-Hajj Fuleihan G. The effects of age and gender on parathyroid hormone dynamics. Clin Endocrinol (Oxf). 2000;52(3):329–338. | |
Bourlon PM, Billaudel B, Faure-Dussert A. Influence of vitamin D3 deficiency and 1,25 dihydroxyvitamin D3 on de novo insulin biosynthesis in the islets of the rat endocrine pancreas. J Endocrinol. 1999;160(1):87–95. | |
Maestro B, Campión J, Dávila N, Calle C. Stimulation by 1,25-dihydroxyvitamin D3 of insulin receptor expression and insulin responsiveness for glucose transport in U-937 human promonocytic cells. Endocr J. 2000;47(4):383–391. | |
Chacko SA, Song Y, Manson JE, et al. Serum 25-hydroxyvitamin D concentrations in relation to cardiometabolic risk factors and metabolic syndrome in postmenopausal women. Am J Clin Nutr. 2011;94(1):209–217. | |
Del Gobbo LC, Song Y, Dannenbaum DA, Dewailly E, Egeland GM. Serum 25-hydroxyvitamin D is not associated with insulin resistance or beta cell function in Canadian Cree. J Nutr. 2011;141(2):290–295. | |
Whiting SJ, Langlois KA, Vatanparast H, Greene-Finestone LS. The vitamin D status of Canadians relative to the 2011 Dietary Reference Intakes: an examination in children and adults with and without supplement use. Am J Clin Nutr. 2011;94(1):128–135. | |
Vatanparast H, Calvo MS, Green TJ, Whiting SJ. Despite mandatory fortification of staple foods, vitamin D intakes of Canadian children and adults are inadequate. J Steroid Biochem Mol Biol. 2010;121(1–2):301–303. | |
Freedman BI, Register TC. Effect of race and genetics on vitamin D metabolism, bone and vascular health. Nat Rev Nephrol. 2012;8(8):459–466. | |
Brenner DR, Arora P, Garcia-Bailo B, El-Sohemy A, Karmali M, Badawi A. The relationship between metabolic syndrome components and inflammatory markers among non-diabetic Canadian adults. J Diab Metabol. 2011;S2:003. Doi: 10.4172/2155-6156. |
 © 2014 The Author(s). This work is published and licensed by Dove Medical Press Limited. The full terms of this license are available at https://www.dovepress.com/terms.php and incorporate the Creative Commons Attribution - Non Commercial (unported, v3.0) License.
By accessing the work you hereby accept the Terms. Non-commercial uses of the work are permitted without any further permission from Dove Medical Press Limited, provided the work is properly attributed. For permission for commercial use of this work, please see paragraphs 4.2 and 5 of our Terms.
© 2014 The Author(s). This work is published and licensed by Dove Medical Press Limited. The full terms of this license are available at https://www.dovepress.com/terms.php and incorporate the Creative Commons Attribution - Non Commercial (unported, v3.0) License.
By accessing the work you hereby accept the Terms. Non-commercial uses of the work are permitted without any further permission from Dove Medical Press Limited, provided the work is properly attributed. For permission for commercial use of this work, please see paragraphs 4.2 and 5 of our Terms.