")
Back to Journals » Diabetes, Metabolic Syndrome and Obesity » Volume 15
Relationship Analysis of Inorganic Arsenic Exposure and Metabolic Syndrome Based on Propensity Score Matching in Xinjiang, China
Authors Nie Y, Wang C, Yang L, Yang Z, Sun Y, Tian M , Ma Y, Zhang Y, Yuan Y, Zhang L
Received 19 November 2021
Accepted for publication 17 March 2022
Published 25 March 2022 Volume 2022:15 Pages 921—931
DOI https://doi.org/10.2147/DMSO.S349583
Checked for plagiarism Yes
Review by Single anonymous peer review
Peer reviewer comments 3
Editor who approved publication: Professor Ming-Hui Zou
Yanwu Nie,1,* Chenchen Wang,2,* Lei Yang,3 Zhen Yang,4 Yahong Sun,4 Maozai Tian,5,6 Yuhua Ma,7,8 Yuxia Zhang,9 Yimu Yuan,10 Liping Zhang6
1State Key Laboratory of Pathogenesis, Prevention and Treatment of High Incidence Diseases in Central Asia, School of Public Health, Xinjiang Medical University, Urumqi, 830017, People’s Republic of China; 2Center for Disease Control and prevention of Xinjiang Uygur Autonomous Region, Urumqi, 830017, People’s Republic of China; 3School of Nursing, Xinjiang Medical University, Urumqi, 830017, People’s Republic of China; 4School of Public Health, Xinjiang Medical University, Urumqi, 830017, People’s Republic of China; 5Center for Applied Statistics, School of Statistics, Renmin University of China, Beijing, 100872, People’s Republic of China; 6College of Medical Engineering and Technology, Xinjiang Medical University, Urumqi, 830017, People’s Republic of China; 7Department of Oncology, Shanghai East Hospital, Tongji University School of Medicine, Shanghai, 200120, People’s Republic of China; 8Department of Pathology, Karamay Central Hospital of XinJiang Karamay, Karamay, Xinjiang Uygur Autonomous Region, 834000, People’s Republic of China; 9Department of Clinical Nutrition, Urumqi Maternal and Child Health Institute, Urumqi, 830001, People’s Republic of China; 10Department of General Practice Medicine, Xinjiang Corps Hospital, Urumqi, People’s Republic of China
*These authors contributed equally to this work
Correspondence: Liping Zhang, Email [email protected]
Purpose: The role of inorganic arsenic (iAs) in the risk of metabolic syndrome (MetS) remains unclear. This investigation focused on the effect of iAs exposure on MetS and whether the results are consistent in different subgroups.
Patients and Methods: The present study was conducted on 629 men and 616 women aged 35– 70 years and living in Xinjiang Uygur Autonomous Region, China. The 1:1 propensity score matching (PSM) was adopted to regulate the confounding factors, and the multivariate logistic regression was performed to assess the relationship between urinary iAs and MetS.
Results: The median content of urinary iAs was examined as 2.20 μg/dL (interquartile range: 1.30– 3.20 μg/dL), and the MetS prevalence reached 23.69% (295 cases/950 participants). After the confounding factors were adjusted, the ORs (95% CIs) for MetS from the minimal to the maximum urinary iAs quartiles reached 1.171 (0.736,1.863), 1.568 (1.008, 2.440) and 2.011 (1.296, 3.120), respectively (referencing 1.00) (P for trend=0.001). After the PSM, the urinary iAs content still plays a potential prediction role in MetS (P for trend=0.011). In addition, as revealed from the subgroup analysis, the urinary iAs content was a predictor of MetS in the female patients, whereas it did not serve as a significant predictor of MetS in the male patients (P for interaction< 0.05).
Conclusion: The increased urinary iAs content was associated with the increased prevalence of MetS in Chinese population. More attention should be paid to female urinary iAs content to avoid the high prevalence of MetS.
Keywords: metabolic syndrome, urinary inorganic arsenic, propensity score matching, subgroup analysis
Introduction
Metabolic syndrome (MetS), affects the health of 25% of the global adult population, is a pathological state which has a set of metabolic abnormalities, including high blood pressure, hyperglycaemia, central adiposity, dyslipidemia1,2 MetS instances in China have risen substantially over the last few years, with an estimated 110 million people suffering from the disease.1 Moreover, MetS is associated with many diseases.3 The current study demonstrates that when compared to non MetS patients, MetS patients have a threefold greater risk of cardiovascular disease, and a fivefold increased risk of type 2 diabetes.4,5 A study from South Korea showed that the risk of type 2 diabetes decreased by 36% when the number of MetS components decreased in second follow-up visits. All components of the MetS were independent risk factors for type 2 diabetes.6 Additionally, patients with MetS are predisposed to cardiovascular, brain, liver and kidney complications, atherosclerosis, sudden death and other diseases.7 All of them have imposed a significant strain on society.
Metabolic illnesses are a result of a combination of hereditary and environmental variables, making them complicated. As evidenced by relevant epidemiological investigations, genetic factors accounted for 13% ~ 60% of the risk factors, while environmental factors contributed to 40% ~ 87%.8–11 Due to their inability to decompose, heavy metals become the most difficult environmental contaminants.12 Previous research has established a link between MetS and a variety of heavy metals.13–16 Copper (Cu), nickel (Ni), lead (Pb) all have positive association with the amount of MetS components.13,14 Obese senior men were also shown to have higher amounts of manganese (Mn) and chromium (Cr) in their bloodstreams, which may contribute to the development of MetS. In the same population, lower serum magnesium levels directly increased the risk of MetS.15 However, additional research is needed to confirm the link between iAs and MetS.
In nature, arsenic is mostly found as inorganic arsenic and organic arsenic, the latter of which is extremely hazardous.17 It is well accepted that inorganic arsenic is a major environmental hazard that may be inhaled, ingested or absorbed via the skin.18 Ingestion of iAs-contaminated water is the most prevalent method of exposure.19 Besides, MetS and its components are also linked to iAs, which shows metalloid characteristics.20,21 A review by Wang w et al showed that for every 100 µg/L increment of iAs in drinking water, the risk of type 2 diabetes increased by 13% after the inclusion of 14 published articles.22 In adults who had never smoked and consumed a lot of rice, iAs exposure was favorably related with both systolic and diastolic blood pressure, according to a research from Spain.23 Besides, a prospective cohort study showed that iAs exposure was associated with higher risk of overall MetS and elevated waist circumference but not with any other MetS component,24 whereas some studies did not report any relationship between iAs exposure and MetS.25 Meanwhile, there is still no relationship between iAs and MetS in areas with low arsenic exposure.26 In summary, the connection between iAs exposure and MetS continues to be a source of contention.
Xinjiang Uygur Autonomous Region, located in northwest China, has become one of the cities most polluted by iAs in China due to the region’s complicated geography and people’s lifestyle.27 Peyziwat county in southwest Xinjiang and the alluvial plain in the middle and lower parts of Kashgar, which is impacted by specific landforms and earthquakes, geological conditions and recharging of groundwater, has significantly raised levels of iAs in drinking water.28 Peyziwat county is an appropriate place to study the association between iAs exposure and MetS because of the enormous support provided by the Chinese government in reducing water iAs concentration and determining the distribution of iAs in water.
Although several studies confirmed the relationships between iAs exposure and MetS, the balance between the case group and the control is insufficient, so the effect of various confounding factors is difficult to exclude. In addition, data from China on the relationship between iAs exposure and MetS has been limited. Propensity score matching (PSM) expresses the influence of multiple covariates through Propensity score (PS) value. Then, Match according to PS value to overcome the problem of insufficient balance between case group and control group in non randomized controlled trials.29 It was for these reasons that the the PSM was employed to eliminate any potential sources of bias from the data. Subgroup analyses were conducted to explore whether the results of different subgroups were consistent. In addition, the urinary iAs content fell into quartiles in logistic regression equation to explore the effect of different doses of the urinary iAs on MetS, as an attempt to lay a basis for the relationship between the urinary iAs content and MetS.
Materials and Methods
Data Source and Study Population
The 300 administrative villages in Peyziwat County fell into the control area (water As concentration <10ug/L), the low water As exposure area (water As concentration 10ug/L~ 50ug/L) and the high water As exposure area (water As concentration >50ug/L),30 with 169, 95 and 29 administrative regions, respectively. The random number table approach was used to choose two administrative villages from each category. Subsequently, cluster sampling was adopted to investigate all residents aged over 35 years. Qualified investigators conducted the questionnaire survey in person, collecting the data listed below (eg, name, gender, age, education, smoking, drinking and family history). A team of medical professionals also investigated the biochemical and metabolic indicators. Of the total 1321 individuals who satisfied the following inclusion and exclusion criteria, 1245 signed their agreement to participate in the study.
Blood Biochemistry Test
It was essential that all participants have been fasting for at least eight hours prior to the survey being administered. The venous blood of the individuals was obtained the next morning by professional nurses. 5 mL of blood was taken from each patient and put in a biochemical tube. All of the blood samples were transported to the Hospital’s laboratory for testing. In order to measure fasting plasma glucose (FPG), total cholesterol (TC), triglyceride (TG), low density lipoprotein cholesterol (LDL-C), high density lipoprotein cholesterol (HDL-C) and other blood indicators, a full-automatic biochemical analyzer was utilized.
Determination of Inorganic Arsenic (iAs) Content in Urine
The content of iAs in urine was determined by hydride atomic fluorescence spectrometry. This method has higher sensitivity and lower LOD (0.01μg/L). The instrument used is atomic fluorescence photometer (AFS-930), and the specific determination process is as follows:
(1) Take 10mL of sample into the colorimetric tube.
(2) Preparation of standard series: Draw 0mL, 0.1mL, 0.3mL, 0.5mL, 0.7mL, 1.0mL and 2.0mL of arsenic standard solution into the colorimetric tube respectively. Then, fix the volume to 10mL with pure water to make the concentration of arsenic 0μg/L, 1.0μg/L, 3.0μg/L, 5.0μg/L, 7.0μg/L, 10.0μg/L, 20.0μg/L respectively.
(3) Add 1mL hydrochloric acid and 1mL thiourea + ascorbic acid solution to the sample, blank and standard solution tubes respectively and mix well.
(4) Instrument condition: Arsenic lamp current: 45mA; Negative high voltage: 305V; Atomizer height: 8.5mm; carrier gas flow rate: 500mL/min; Shielding gas flow rate: 1000mL/min; Injection volume: 0.5mL; Current carrying: hydrochloric acid solution.
(5) Determination: Set the best conditions of the instrument after startup, ignite the atomization furnace wire, and start the determination after stabilizing for 30min, draw the standard curve and calculate the regression equation (y=ax+b).
(6) Calculation: Find the arsenic concentration (μg/L) in the sample solution from the standard curve or regression equation based on the fluorescence intensity of the measured sample.
Definition of Smoking and Drinking
Smoking is defined as: regular smokers, former smokers and never smokers.1) To be a “regular smoker”, one must smoke at least one pack of cigarettes every day for at least six months.; 2) Former smokers are those who have smoked in the past but have not smoked in over six months.; 3) Never smokers refer to people who have never smoked. Regular smokers were included in a smoker group, while never smokers and former smokers were combined in a non-smoker group.31
Drinking is defined as: regular drinkers, former drinkers and never drinkers. 1) Regular drinkers refer to those who drink alcoholic beverages at least once a week for more than half a year; 2) Former drinkers refer to persons who have previously drank but have not done so in the last six months; 3) A never drinker is someone who has never had a drink. Regular drinkers were divided into a drinker group, whereas never drinkers and former drinkers were amalgamated into a non-drinker group.32
Definition of MetS
By complying with the diagnostic criteria for MetS in China’s guideline for preventing and treating type 2 diabetes,5 MetS was defined as the presence of at least 3 of the component conditions below:
(1) Central obesity: male waist circumference ≥ 90 cm, female ≥ 85 cm.
(2) hyperglycemia: fasting blood glucose ≥ 6.10 mmol/L or blood glucose ≥7.80 mmol/L after 2 h of glucose load or was diagnosed as diabetes.
(3) hypertension: blood pressure ≥130/85 mmHg or hypertension was diagnosed.
(4) high triglyceride: Fasting TG ≥1.70 mmol/L.
(5) low high-density lipoprotein: Fasting HDL-C <1.04 mmol/L.
Statistical Analysis
The normally distributed data were performing t-test to compare between the groups and expressing as mean±standard deviation. The categorized variables were conducting the chi-square test for the analysis between the groups and performing as a composition ratio.Three models were established in this study to investigate the connection between urinary iAs and MetS. The urinary iAs content was represented as a continuous variable and a grade variable in each of the three models. As a continuous variable, the urinary iAs content had to be converted to log because it did not follow the normal distribution. At the same time, considering the influence of confounding factors, model 1 controlled the most common risk factors age and BMI in general demographic characteristics. Model 2 controlled the variables with P value less than 0.1 in univariate analysis. Model 3 conducted a 1:1 PSM in baseline characteristics between with MetS and without MetS. The nearest neighborhood method without replacement was adopted with a caliper width of 0.02. To assess the matching effect of the PSM, figures were generated for the propensity score distribution and standardized differences of variables before and after the PSM. When the standardized deviation of each variable is within ± 10%, it indicates that the matching belongs to the high precision.33 Finally, subgroup analysis was used to ascertain the consistency of the data from various subgroups. SPSS 25.0 was used for univariate analysis and logistic regression analysis. Stata 16.0 conduct propensity score matching analysis to determine the matched samples, and R 4.1.0 draw the forest map for subgroup analysis.
Results
Baseline Characteristics and PSM Method Implementation
On the whole, 629 men and 616 women were included in this study, of which 295 people suffered from MetS, and the prevalence rate was 23.69%. The median content of urinary iAs was 2.20 μg/dL (interquartile range from 1.30 to 3.20 μg/dL). Taking MetS as the categorical variable, Table 1 lists the general demographic characteristics and biochemical indexes before and after the matching. Before the PSM, compared with those without MetS, the research objects with MetS had higher age, BMI, PLT, GPT, Total cholesterol, as well as LDL cholesterol (P<0.05), while the others were statistically insignificant. After the PSM, 496 subjects were included. The P values of all variables exceeded 0.1, thereby demonstrating that the distribution of the respective variable was balanced.
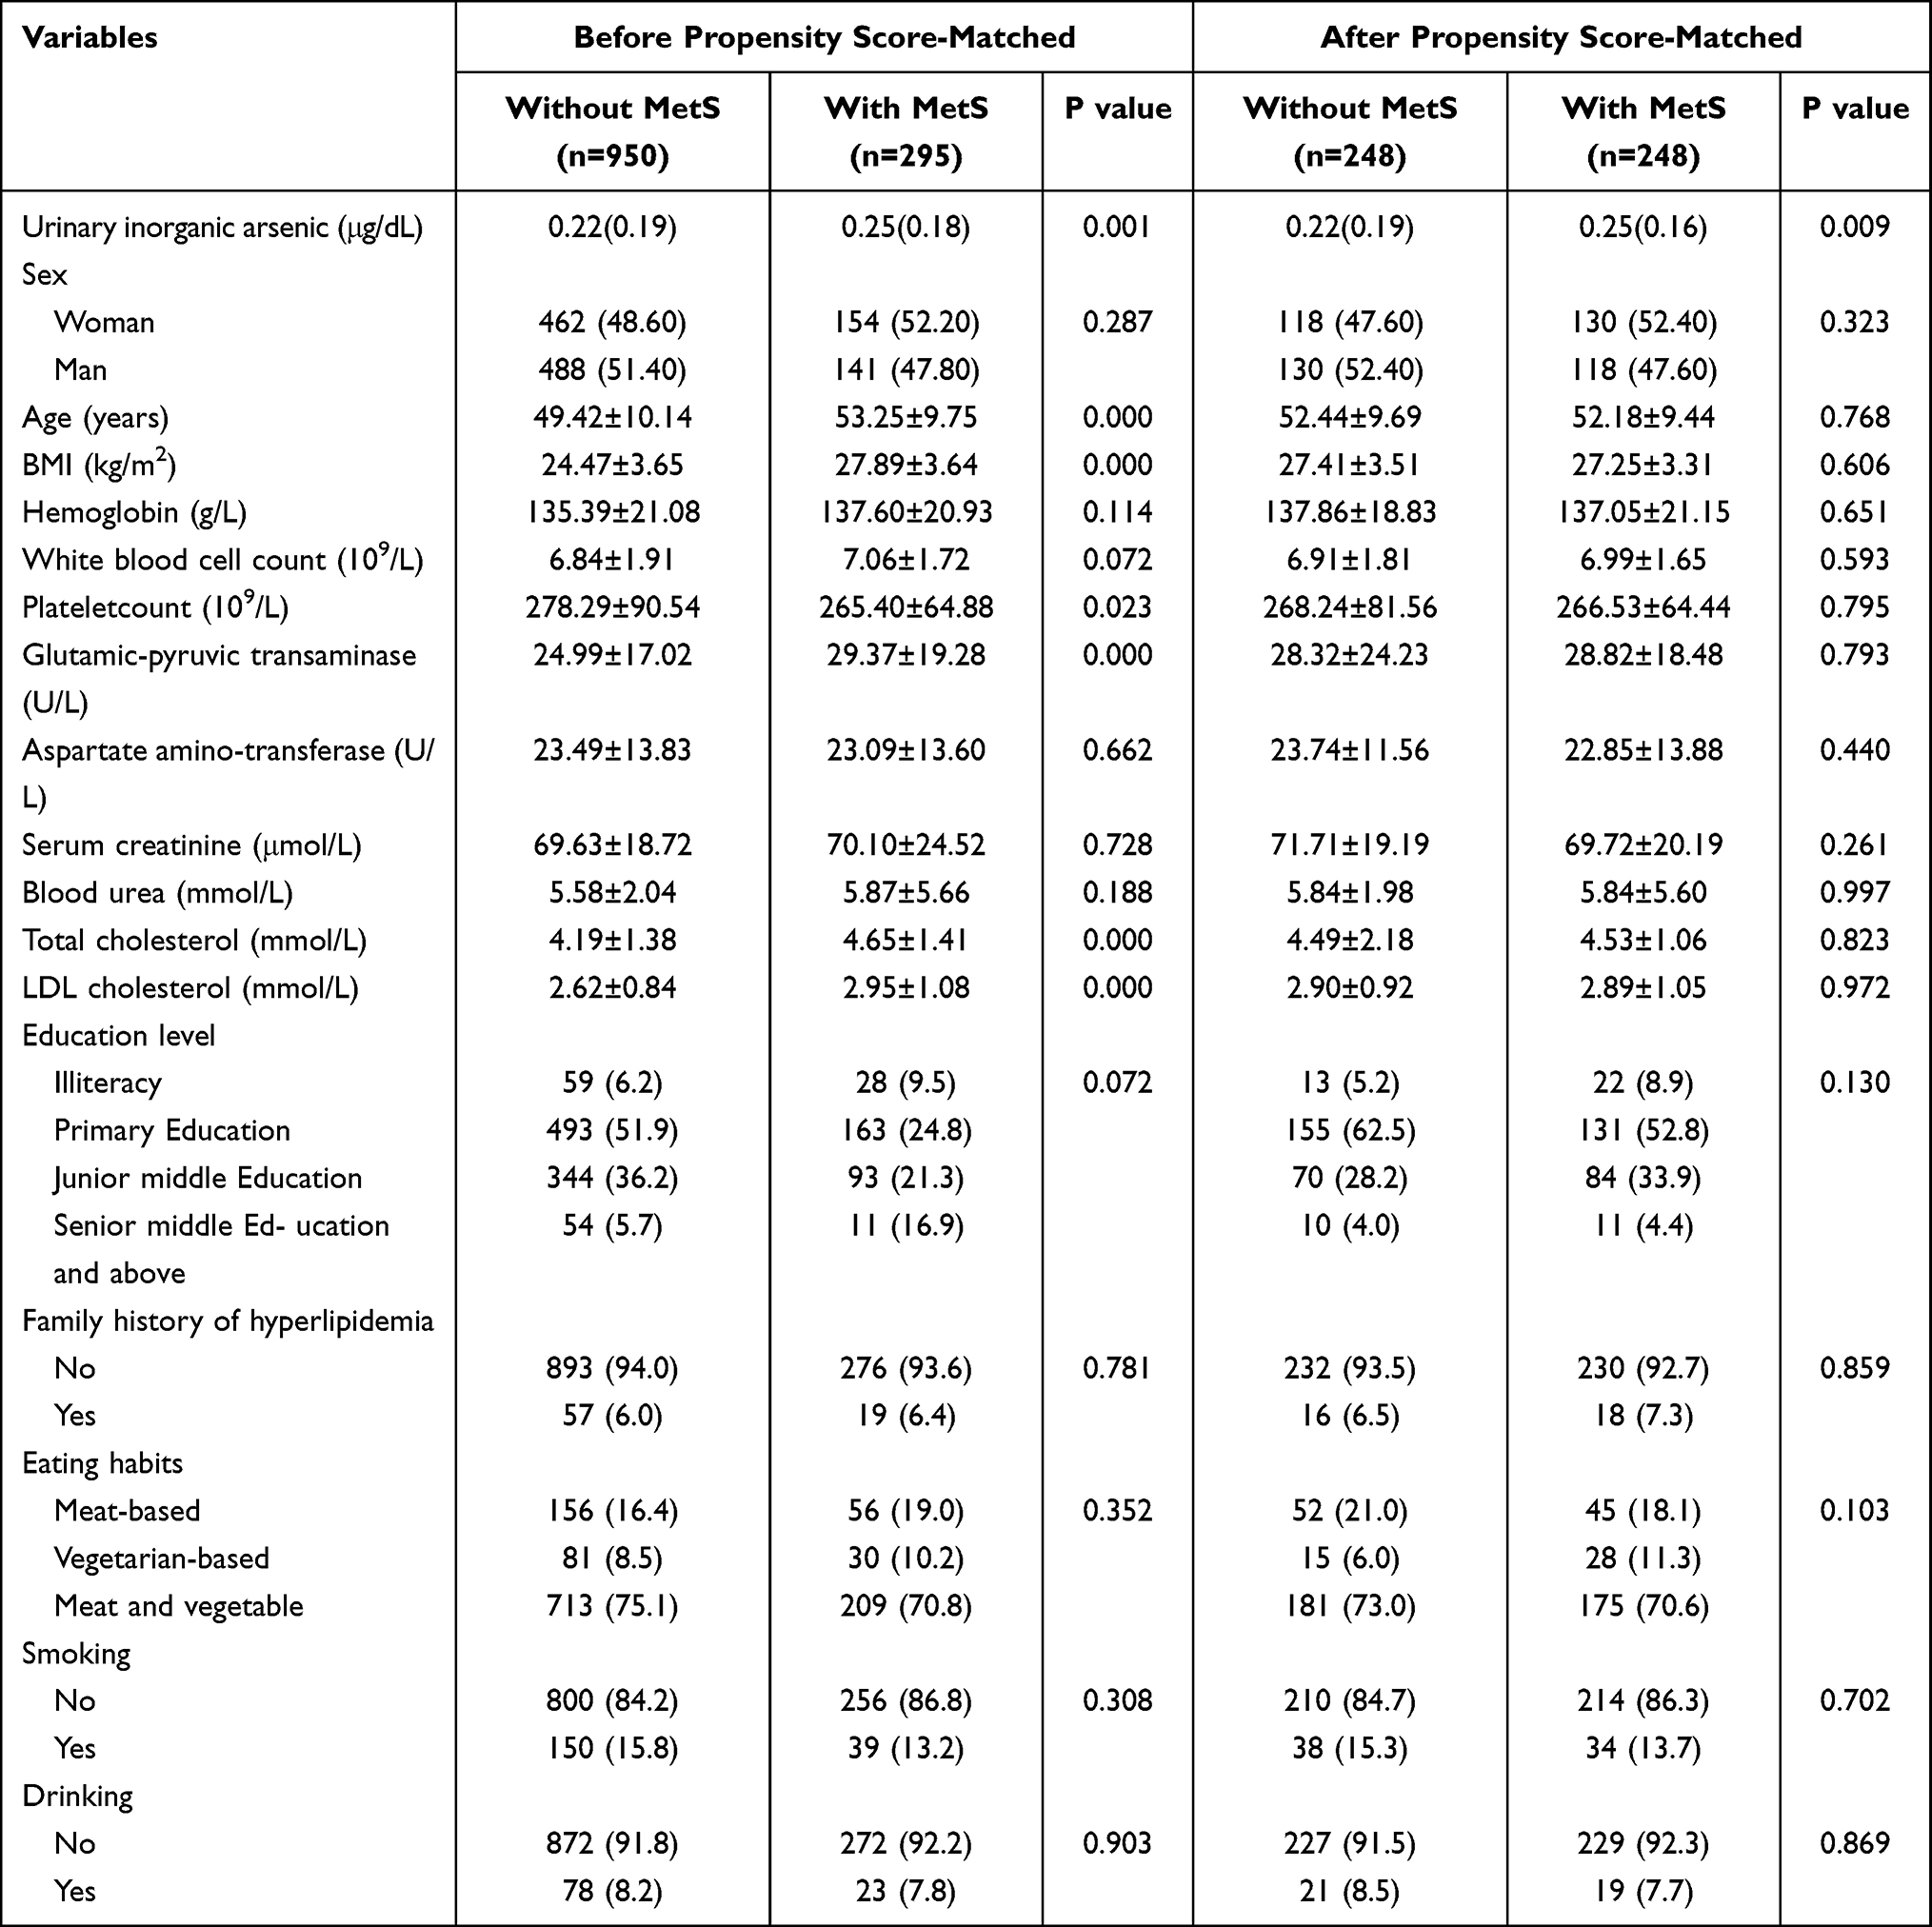 |
Table 1 Baseline Characteristics Before and After Propensity Score Matching (PSM) |
PSM Effectiveness Verification
To further verify the matching effect of the PSM, distribution of propensity scores (Figure 1) and standardized differences of variables (Figure 2) were drawn. It can be seen from Figure 1 that, there was a large gap in the distribution of propensity scores between the case group and the control before matching, and the two curves almost coincide after matching, which proves that the propensity score matching was good. After matching, the average standardized deviation was decreased from 21.5% to 3.5% and the standardized deviation of each variable was within ±10%, which indicates that the matching belongs to the high accuracy range.
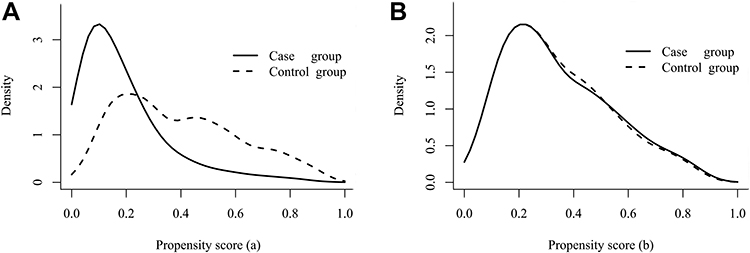 |
Figure 1 Distribution of propensity score before and after propensity score matching (PSM). (A) Propensity score distribution before PSM, (B) propensity score distribution after PSM. PSM matches by calculating the propensity score. When the propensity scores are consistent, it is considered that the matching efficiency is better. |
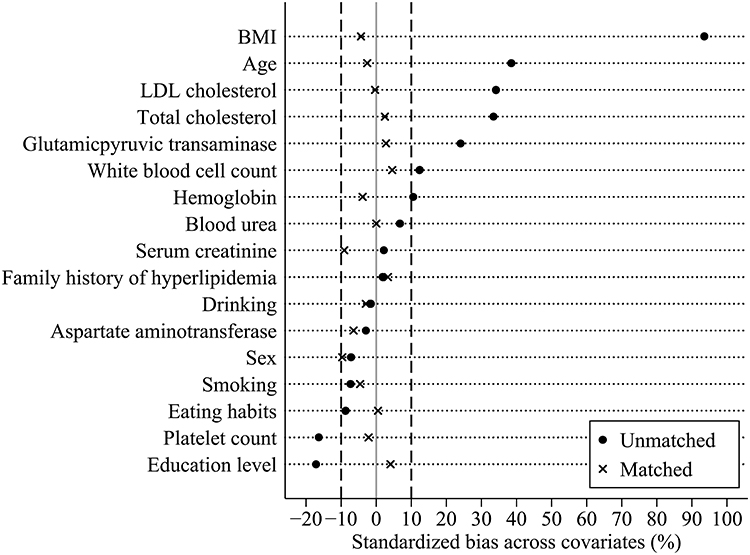 |
Figure 2 Standardized bias of variables before and after propensity score matching (PSM). ● Denotes the standardized bias of variables before PSM; x Denotes the standardized bias of variables after PSM; the two vertical dashed lines represent ±10% of the standardized bias respectively. |
Prevalence of Metabolic Syndrome Components Before PSM
As Figure 3 show, the prevalence rates of MetS components in MetS patients are as follows: central obesity (93.56%), low HDL (84.75%), high Triglycerides (67.80%), hypertension (64.41%), and Hyperglycemia (30.17%). In the population with MetS and without Mets, the prevalence of central obesity was the highest and the prevalence of hyperglycemia was the lowest.
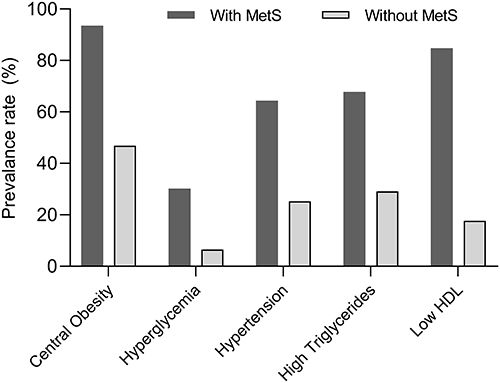 |
Figure 3 Prevalence of metabolic syndrome components before PSM. Abbreviations: MetS, metabolic syndrome; Low HDL, low high density lipoprotein. |
Relationship Between Urinary iAs Content and MetS
To explore the relationship between urinary iAs content and MetS, three models were established with MetS as dependent variable (Table 2). The three models included urinary iAs content in the form of continuous variable and grade variable respectively. When the urinary iAs content was included in the form of grade variable. Before the PSM, the ORs (95% CIs) for MetS from the lowest to the highest urinary iAs quartiles were 1.146 (0.729, 1.799), 1.591 (1.036, 2.443) and 2.113 (1.392, 3.208), respectively (referencing 1.00) (P for trend <0.001) (Table 2), after adjusting for age, BMI (model 1). Further adjusting other variables (model 2), there was no substantial change in the relationship between urinary iAs and MetS (P for trend=0.001). After the PSM, the relationship was slightly weakened (model 3), but urinary iAs content was still a potential prediction role of MetS (P for trend =0.011). When the urinary iAs content was included in the form of continuous variable, all three models showed that urinary iAs content was a potential prediction role of MetS (all P value ≤0.01).
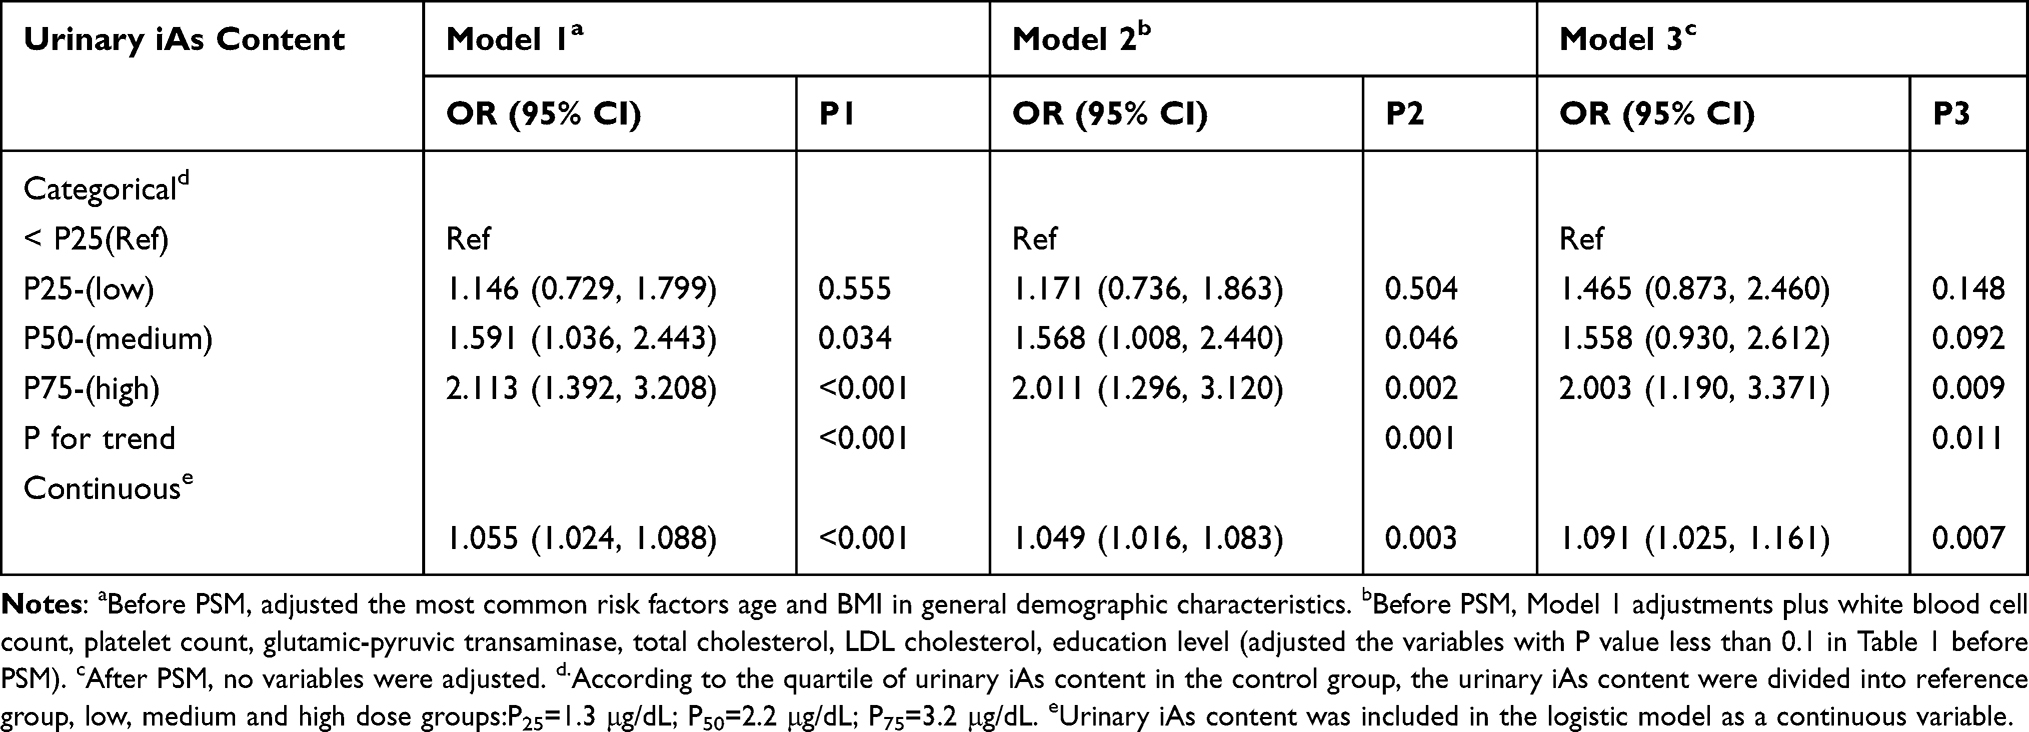 |
Table 2 Logistic Regression Between Urinary Inorganic Arsenic (iAs) Content and MetS Before and After PSM |
Subgroup Analysis
Logistic regression was further used to assess the relationship between urinary iAs content and MetS among subgroups (Figure 4). The results showed that there was significant interaction only in different gender groups (P for interaction=0.022), thereby demonstrating that urinary iAs content served as a predictor MetS in female patients (OR=1.474, 95% CI=(1.180, 1.858)), whereas it was not a significant predictor of MetS in male patients (OR=1.014, 95% CI=(0.809, 1.272)).
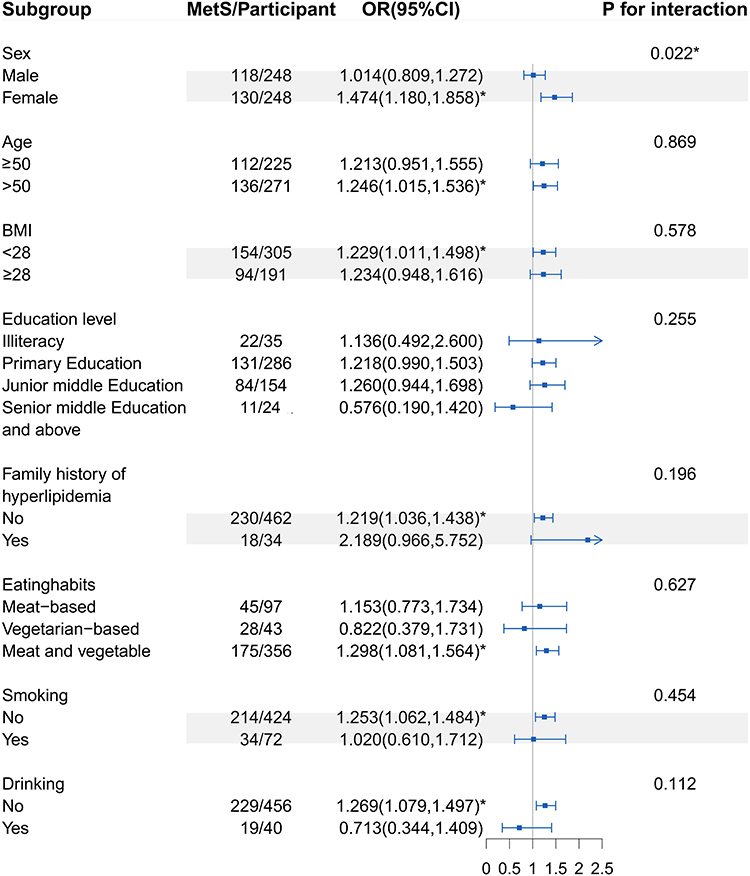 |
Figure 4 Relationship between urinary iAs and MetS in different subgroups. OR (95% CI) greater than 1 indicates that iAs plays a predictive role in MetS. OR (95% CI) less than 1 indicates that iAs has a protective effect on MetS. * Denotes significance at a P value of <0.05. Abbreviations: BMI, body mass index; OR, odds ratio; MetS, metabolic syndrome; iAs, inorganic arsenic. |
Discussion
In this study, 1245 participants in Peyziwat County, Xinjiang were taken as the research object for a cross-sectional study. PSM method was used to control confounding factors. Logistic regression was used to analyze the relationship between urinary iAs content and MetS. We found that urinary iAs content was positively associated with MetS.
The prevalence of MetS in this study was greater than the prevalence level reported in China, according to the definition of MetS by the Chinese Diabetes Society (CDS).34 This can be attributed to a variety of factors, including one’s dietary habits, the surrounding environment, and so on. Local residents eat three meals a day primarily baked Nang or other pasta made of white flour as raw materials, and the intake of carbohydrates was high.35 Short-term high carbohydrate diet could up-regulate the concentration of plasma TG.36 In addition, this study is located in the area with high exposure level of iAs which has been proved to be a risk factor for components of MetS such as diabetes and hypertension.21,37
For short-term iAs exposure, urinary iAs content was regarded an excellent marker and the most accurate sign.38 The median content of urinary iAs in our research object was 2.20μg/dL (interquartile range: 1.30–3.20 μg/dL). However, in most previously published studies, urinary iAs content varied from 0.56 to 1.50 μg/dL among people living in USA, Arica.39,40 This study’s high level of urinary iAs was attributed to the fact that China is one of the countries affected by endemic iAs poisoning. IAs endemic areas were concentrated in more than 10 provinces and regions such as Xinjiang, Shanxi and Inner Mongolia.41 Peyziwat county is located in the southwest of Xinjiang Uygur Autonomous Region. Over the past few years, the government has invested considerable money to improve water in iAs poisoning areas. The monitoring data revealed that though water has been improved in Xinjiang drinking water endemic arsenism monitoring village, large-scale centralized water improvement projects exceeding the standard remain.42
The results demonstrated that the increased content of urinary iAs was associated with the increased prevalence of MetS. At present, there has been rare studies to prove the relationship between urinary iAs content and MetS. Among residents in Taiwan’s industrial areas, hair iAs is associated with the clinical diagnosis of MetS.43 However, Claire pace et al, reported no association between iAs exposure and MetS, which contradicts the findings of this study.24 This might be explained by the study’s modest iAs exposure. When the content of iAs are low, the relationship between iAs exposure and MetS is not obvious.24 In addition, it is unknown if or to what extent these variations between studies may be explained by changes in sample size, iAs exposure levels, measurement techniques, or other variables affecting urinary iAs metabolism. The link between iAs exposure and MetS, in general, requires further investigation and observation. More large-scale population tests are required in the future to prove the causal link. Although the mechanism between iAs and MetS is unclear, relevant studies have demonstrated that oxidative stress was considered to result in MetS,44 hyperglycemia and obesity.45,46 At the same time, oxidative stress was associated with iAs exposure. Exposure to AS and its metabolites will produce reactive oxygen species (ROS) and free radicals, hydroxyl radicals, nitric oxide and superoxide anions in a variety of cell lines.47,48 Moreover, a human study conducted in a high iAs exposed population in China reported that iAs exposed subjects showed higher oxidative stress (measured by using up-regulated lipid peroxide serum levels) than control subjects. Moreover, this study reported a significant relationship between oxidative stress and methylated AS metabolites.49 Accordingly, a relationship between iAs and oxidative stress and between oxidative stress and MetS has been evidenced.
This study also discussed the relationship between the urinary iAs content and MetS among subgroups. As reported in relevant literature, differences were identified among subgroups only when a significant interaction existed in the subgroup analysis. Otherwise, it would cause excessive interpretation. Only the gender subgroup was shown to have a significant interaction in this investigation. The findings revealed that, in comparison to males, women’s urinary iAs content should be monitored more closely to avoid an increased occurrence of MetS.This is probably because women have higher As methylation ability, ie, the higher proportion of dimethylarsinic acid (DMA) in women’s urine and the lower proportion of iAs.50 This difference in methylation may be attributed to estrogen.51 Estrogen levels can affect the single carbon cycle (eg, choline),52 thereby increasing the proportion of monomethylarsonic acid (MMA) in urine.53 Another possible reason is the high obesity rate of local women. A survey from Xinjiang reported that obese and abdominal obese women were higher than men.54 The obesity level (BMI) was negatively associated with MMA% and positively associated with DMA% in women, whereas it was not in men.55 Furthermore, relevant studies reported a higher risk of MetS at low levels of MMA and a high proportion of DMA.24
As far as we know, the PSM has been extensively adopted to balance the differences between groups and reduce the effect of confounding factors, which can overcome the problem of insufficient balance between case group and the control in non-randomized controlled trials.27 At present, rare studies have utilized PSM to control confounding and logistic regression to examine the relationship between the urinary iAs content and MetS. Moreover, the iAs exposure range designed in this study was rather broad. At the sampling stage of the research design, stratifying the samples according to their iAs content in water may more accurately depict the association between urinary iAs and MetS in diverse iAs exposure situations. Besides, the analysis of this study on the relationship between urinary iAs content and MetS presented more insights into this relationship in cohort studies associated with the Chinese population.
Conclusion
In brief, as indicated from the results of this study, increased urinary iAs content was associated with the increased prevalence of MetS in a Chinese population. Moreover, The subgroup study also found that urinary iAs content was a predictor of MetS in female patients, but it was not in the case of men. To avoid a rise in the occurrence of MetS, we need to pay more attention to the iAs content in women’s urine. The effect of iAs metabolism on MetS needs further discussion.
Ethical Approval and Considerations
The project was reviewed and approved by the Center for Disease Control and Prevention of Xinjiang Uygur Autonomous Region. After explaining the objectives and protocols of the study, written informed consent and verbal consent were obtained from all the participants. In addition, we followed the guidelines outlined in the Declaration of Helsinki.
Acknowledgments
This work was funded by State Key Laboratory of Pathogenesis, Prevention and Treatment of High Incidence Diseases in Central Asia Fund (SKL-HIDCA-2020-9), National Natural Science Foundation of China (Grant No. 72163033, 72064036, 72174175) and the Natural science funding of Xinjiang Uygur Autonomous Region (2021D01A21), China.
Disclosure
The authors declare that they have no competing interests.
References
1. Saklayen MG. The Global Epidemic of the Metabolic Syndrome. Curr Hypertens Rep. 2018;20(2):12. doi:10.1007/s11906-018-0812-z
2. Shin S, Jee H. Prevalence of metabolic syndrome in the Gulf Cooperation Council countries: meta-analysis of cross-sectional studies. J Exerc Rehabil. 2020;16(1):27–35. doi:10.12965/jer.1938758.379
3. Kassi E, Pervanidou P, Kaltsas G, et al. Metabolic syndrome: definitions and controversies. BMC Med. 2011;9:48. doi:10.1186/1741-7015-9-48
4. Lu JL, Wang LM, Li M, et al. Metabolic Syndrome Among Adults in China: the 2010 China Noncommunicable Disease Surveillance. Clin Endocrinol Metab. 2017;102(2):507–515. doi:10.1210/jc.2016-2477
5. Chinese Diabetes Society. Guidelines for the prevention and control of type 2 diabetes in China (2017 Edition). Chin J Practical Internal Med. 2018;38:292–344.
6. Lee MK, Han K, Kim MK, et al. Changes in metabolic syndrome and its components and the risk of type 2 diabetes: a nationwide cohort study. Sci Rep. 2020;10(1):2313. doi:10.1038/s41598-020-59203-z
7. Kao TW, Huang CC. Recent Progress in Metabolic Syndrome Research and Therapeutics. Int J Mol Sci. 2021;22(13):6862. doi:10.3390/ijms22136862
8. Min J, Hu X, Zhang J, et al. Short-Term Changes in Metabolically Healthy Overweight/Obesity Status Impact the Susceptibility to Type 2 Diabetes in Chinese Adults. Diabetes Metab Syndr Obes. 2021;14:2561–2571. doi:10.2147/DMSO.S313475
9. Sharifpour P, Dehvan F, Dalvand S, et al. Examination of the Relationship Between Metabolic Syndrome and Obstructive Sleep Apnea in Iranian Patients with Type 2 Diabetes: a Case-Control Study. Diabetes Metab Syndr Obes. 2020;13:2251–2257. doi:10.2147/DMSO.S260677
10. Kolb H, Martin S. Environmental/lifestyle factors in the pathogenesis and prevention of type 2 diabetes. BMC Med. 2017;15(1):131. doi:10.1186//s12916-017-0901-x
11. Hall EM, Acevedo J, López FG, et al. Hypertension among adults exposed to drinking water arsenic in Northern Chile. Environ Res. 2017;153:99–105. doi:10.1016/j.envres.2016.11.016
12. Sarker A, Kim JE, Islam ARMT, et al. Heavy metals contamination and associated health risks in food webs-a review focuses on food safety and environmental sustainability in Bangladesh. Environ Sci Pollut Res Int. 2022;29(3):3230–3245. doi:10.1007/s11356-021-17153-7
13. Huang S, Zhong D, Lv Z, et al. Associations of multiple plasma metals with the risk of metabolic syndrome: a cross-sectional study in the mid-aged and older population of China. Ecotoxicol Environ Saf. 2022;231:113183. doi:10.1016/j.ecoenv.2022.113183
14. Rotter I, Kosik-Bogacka D, Dołęgowska B, et al. Relationship between the concentrations of heavy metals and bioelements in aging men with metabolic syndrome. Int J Environ Res Public Health. 2015;12(4):3944–3961. doi:10.3390/ijerph120403944
15. Huang M, Chen J, Yan G, et al. Plasma titanium level is positively associated with metabolic syndrome: a survey in China’s heavy metal polluted regions. Ecotoxicol Environ Saf. 2021;208:111435. doi:10.1016/j.ecoenv.2020.111435
16. González-Domínguez Á, Visiedo-García FM, Domínguez-Riscart J, et al. Iron Metabolism in Obesity and Metabolic Syndrome. Int J Mol Sci. 2020;21(15):5529. doi:10.3390/ijms21155529
17. Garbinski LD, Rosen BP, Chen J. Pathways of arsenic uptake and efflux. Environ Int. 2019;126:585–597. doi:10.1016/j.envint.2019.02.058
18. Agusa T, Fujihara J, Takeshita H, et al. Individual variations in inorganic arsenic metabolism associated with AS3MT genetic polymorphisms. Int J Mol Sci. 2011;12(4):2351–2382. doi:10.3390/ijms12042351
19. Liu TY, Shi CX, Gao R, et al. Irisin inhibits hepatic gluconeogenesis and increases glycogen synthesis via the pi3k/akt pathway in type 2 diabetic mice and hepatocytes. Clin Sci. 2015;129(10):839–850. doi:10.1042/CS20150009
20. Li X, Li B, Xi S, et al. Association of urinary monomethylated arsenic concentration and risk of hypertension: a cross-sectional study from arsenic contaminated areas in northwestern China. Environ Health. 2013;12:37. doi:10.1186/1476-069X-12-37
21. Bulka CM, Persky VW, Daviglus ML, et al. Multiple metal exposures and metabolic syndrome: a cross-sectional analysis of the National Health and Nutrition Examination Survey 2011-2014. Environ Res. 2019;168:397–405. doi:10.1016/j.envres.2018.10.022
22. Wang W, Xie Z, Lin Y, et al. Association of inorganic arsenic exposure with type 2 diabetes mellitus: a meta-analysis. J Epidemiol Community Health. 2014;68(2):176–184. doi:10.1136/jech-2013-203114
23. Scannell bryan M, Sofer T, Mossavar-Rahmani Y, et al. Mendelian randomization of inorganic arsenic metabolism as a risk factor for hypertension- and diabetes-related traits among adults in the Hispanic Community Health Study/Study of Latinos (HCHS/SOL) cohort. Int J Epidemiol. 2019;48(3):876–886. doi:10.1093/ije/dyz046
24. Spratlen MJ, Grau-Perez M, Best LG, et al. The Association of Arsenic Exposure and Arsenic Metabolism With the Metabolic Syndrome and Its Individual Components: prospective Evidence From the Strong Heart Family Study. Am J Epidemiol. 2018;187(8):1598–1612. doi:10.1093/aje/kwy048
25. Kazemifar AM, Shafikhani AA, Mozhdehipanah H, et al. Evaluation of different types of arsenic methylation and its relationship with metabolic syndrome in an area chronically exposed to arsenic. Environ Anal Health Toxicol. 2020;35(2):e2020006. doi:10.5620/eaht.e2020006
26. Pace C, Smith-Gagen J, Angermann J. Arsenic Methylation Capacity and Metabolic Syndrome in the 2013-2014 U.S. National Health and Nutrition Examination Survey (NHANES). Int J Environ Res Public Health. 2018;15(1):168. doi:10.3390/ijerph15010168
27. De Anda V, Chen LX, Dombrowski N, et al. Brockarchaeota, a novel archaeal phylum with unique and versatile carbon cycling pathways. Nat Commun. 2021;12(1):2404. doi:10.1038/s41467-021-22736-6
28. Song X, Li Y, Liu J, et al. Changes in serum adiponectin in mice chronically exposed to inorganic arsenic in drinking water. Biol Trace Elem Res. 2017;179(1):140–147. doi:10.1007/s12011-017-0950-1
29. Austin PC. Optimal caliper widths for propensity-score matching when estimating differences in means and differences in proportions in observational studies. Pharm Stat. 2011;10(2):150–161. doi:10.1002/pst.433
30. Ye R, Scherer PE. Adiponectin, driver or passenger on the road to insulin sensitivity? Mol Metab. 2013;2(3):133–141. doi:10.1016/j.molmet.2013.04.001
31. Fujita ÂTL, Rodrigues-Junior AL, Gomes NC, et al. Socio-demographic and psychological features associated with smoking in pregnancy. J Bras Pneumol. 2021;47(5):e20210050. doi:10.36416/1806-3756/e20210050
32. Wilsnack RW, Wilsnack SC, Gmel G, Kantor LW. Gender Differences in Binge Drinking. Alcohol Res. 2018;39(1):57–76.
33. Xiong Y, Zhang Y, Tan J, et al. The association between metabolic syndrome and lower urinary tract symptoms suggestive of benign prostatic hyperplasia in aging males: evidence based on propensity score matching. Transl Androl Urol. 2021;10(1):384–396. doi:10.21037/tau-20-1127
34. Jiang B, Zheng Y, Chen Y, et al. Age and gender-specific distribution of metabolic syndrome components in East China: role of hypertriglyceridemia in the SPECT-China study. Lipids Health Dis. 2018;17(1):92. doi:10.1186/s12944-018-0747-z
35. Li CH, Guo SX, Ma RL, et al. Prevalence of metabolic syndrome among Uighur population in Kashgar, Xinjiang in 2010. Chin J Prevent Med. 2012;5:419–423.
36. Mittendorfer B, Sidossis LS. Mechanism for the increase in plasma triacylglycerol concentrations after consumption of short-term, high-carbohydrate diets. Am J Clin Nutr. 2001;73(5):892–899. doi:10.1093/ajcn/73.5.892
37. Xu L, Polya DA. Exploratory study of the association in the United Kingdom between hypertension and inorganic arsenic (iAs) intake from rice and rice products. Environ Geochem Health. 2021;43(7):2505–2538. doi:10.1007/s10653-020-00573-8
38. Hopenhayn-Rich C, Biggs ML, Kalman DA, et al. Arsenic methylation patterns before and after changing from high to lower concentrations of arsenic in drinking water. Environ Health Perspect. 1996;104(11):1200–1207. doi:10.1289/ehp.961041200
39. Shiue I. Urinary arsenic, pesticides, heavy metals, phthalates, polyaromatic hydrocarbons, and polyfluoroalkyl compounds are associated with sleep troubles in adults: USA NHANES, 2005-2006. Environ Sci Pollut Res Int. 2017;24(3):3108–3116. doi:10.1007/s11356-016-8054-6
40. Muñoz MP, Valdés M, Muñoz-Quezada MT, et al. Urinary Inorganic Arsenic Concentration and Gestational Diabetes Mellitus in Pregnant Women from Arica, Chile. Int J Environ Res Public Health. 2018;15(7):1418. doi:10.3390/ijerph15071418
41. Sun GF, Li X, Pi JB, et al. Current research problems of chronic arsenicosis in China. J Health Popul Nutr. 2006;24(2):176–181.
42. Karn SK. Arsenic (As) contamination: a major risk factor in Xinjiang Uyghur autonomous region of China. Environ Pollut. 2015;207:434–435. doi:10.1016/j.envpol.2015.05.005
43. Chiou HY, Huang WI, Su CL, et al. Dose-response relationship between prevalence of cerebrovascular disease and ingested inorganic arsenic[J]. Stroke. 1997;28(9):1717–1723. doi:10.1161/01.str.28.9.1717
44. Hopps E, Noto D, Caimi G, et al. A novel component of the metabolic syndrome: the oxidative stress. Nutr Metab Cardiovasc Dis. 2010;20(1):72–77. doi:10.1016/j.numecd.2009.06.002
45. Andreeva-Gateva P, Popova D, Orbetsova V. antioxidant parameters in metabolic syndrome – a dynamic evaluation during oral glucose tolerance test. Vutr Boles. 2001;33(2–3):48–53.
46. Roberts CK, Barnard RJ, Sindhu RK, et al. Oxidative stress and dysregulation of NAD(P)H oxidase and antioxidant enzymes in diet-induced metabolic syndrome. Metabolism. 2006;55(7):928–934. doi:10.1016/j.metabol.2006.02.022
47. Pace C, Banerjee TD, Welch B, et al. Monomethylarsonous acid, but not inorganic arsenic, is a mitochondria-specific toxicant in vascular smooth muscle cells. Toxicol In Vitro. 2016;35:188–201. doi:10.1016/j.tiv.2016.06.006
48. Barchowsky A, Dudek EJ, Treadwell MD, et al. Arsenic induces oxidant stress and nf-kappa b activation in cultured aortic endothelial cells. Free Radic Biol Med. 1996;21(6):783–790. doi:10.1016/0891-5849(96)00174-8
49. Pi J, Yamauchi H, Kumagai Y, et al. Evidence for induction of oxidative stress caused by chronic exposure of Chinese residents to arsenic contained in drinking water. Environ Health Perspect. 2002;110(4):331–336. doi:10.1289/ehp.02110331
50. Gao J, Yu J, Yang L. Urinary arsenic metabolites of subjects exposed to elevated arsenic present in coal in Shaanxi Province, China. Int J Environ Res Public Health. 2011;8(6):1991–2008. doi:10.3390/ijerph8061991
51. Kile ML, Ronnenberg AG. Can folate intake reduce arsenic toxicity? Nutr Rev. 2008;66(6):349–353. doi:10.1111/j.1753-4887.2008.00043.x
52. Huang CF, Yang CY, Chan DC, et al. Arsenic Exposure and Glucose Intolerance/Insulin Resistance in Estrogen-Deficient Female Mice. Environ Health Perspect. 2015;123(11):1138–1144. doi:10.1289/ehp.1408663
53. López-Carrillo L, Gamboa-Loira B, Becerra W, et al. Dietary micronutrient intake and its relationship with arsenic metabolism in Mexican women. Environ Res. 2016;151:445–450. doi:10.1016/j.envres.2016.08.015
54. He J. Research on Prevalence and Characteristic of Obesity and Relationship to the Related Diseases among Rural Adult Residents in Hazakh and Uygur Population from Xinjiang. Shihezi University; 2014.
55. Abuawad A, Spratlen MJ, Parvez F, et al. Association between body mass index and arsenic methylation in three studies of Bangladeshi adults and adolescents. Environ Int. 2021;149:106401. doi:10.1016/j.envint.2021.106401
 © 2022 The Author(s). This work is published and licensed by Dove Medical Press Limited. The full terms of this license are available at https://www.dovepress.com/terms.php and incorporate the Creative Commons Attribution - Non Commercial (unported, v3.0) License.
By accessing the work you hereby accept the Terms. Non-commercial uses of the work are permitted without any further permission from Dove Medical Press Limited, provided the work is properly attributed. For permission for commercial use of this work, please see paragraphs 4.2 and 5 of our Terms.
© 2022 The Author(s). This work is published and licensed by Dove Medical Press Limited. The full terms of this license are available at https://www.dovepress.com/terms.php and incorporate the Creative Commons Attribution - Non Commercial (unported, v3.0) License.
By accessing the work you hereby accept the Terms. Non-commercial uses of the work are permitted without any further permission from Dove Medical Press Limited, provided the work is properly attributed. For permission for commercial use of this work, please see paragraphs 4.2 and 5 of our Terms.