")
Back to Journals » International Journal of Nanomedicine » Volume 11
Reinjury risk of nano-calcium oxalate monohydrate and calcium oxalate dihydrate crystals on injured renal epithelial cells: aggravation of crystal adhesion and aggregation
Authors Gan Q, Sun X , Bhadja P, Yao X, Ouyang J
Received 18 January 2016
Accepted for publication 21 March 2016
Published 14 June 2016 Volume 2016:11 Pages 2839—2854
DOI https://doi.org/10.2147/IJN.S104505
Checked for plagiarism Yes
Review by Single anonymous peer review
Peer reviewer comments 3
Editor who approved publication: Professor Lei Yang
Qiong-Zhi Gan,1,2 Xin-Yuan Sun,1,2 Poonam Bhadja,1,2 Xiu-Qiong Yao,1,2 Jian-Ming Ouyang1,2
1Department of Chemistry, Jinan University, Guangzhou, People’s Republic of China; 2Institute of Biomineralization and Lithiasis Research, Jinan University, Guangzhou, People’s Republic of China
Background: Renal epithelial cell injury facilitates crystal adhesion to cell surface and serves as a key step in renal stone formation. However, the effects of cell injury on the adhesion of nano-calcium oxalate crystals and the nano-crystal-induced reinjury risk of injured cells remain unclear.
Methods: African green monkey renal epithelial (Vero) cells were injured with H2O2 to establish a cell injury model. Cell viability, superoxide dismutase (SOD) activity, malonaldehyde (MDA) content, propidium iodide staining, hematoxylin–eosin staining, reactive oxygen species production, and mitochondrial membrane potential (ΔΨm) were determined to examine cell injury during adhesion. Changes in the surface structure of H2O2-injured cells were assessed through atomic force microscopy. The altered expression of hyaluronan during adhesion was examined through laser scanning confocal microscopy. The adhesion of nano-calcium oxalate monohydrate (COM) and calcium oxalate dihydrate (COD) crystals to Vero cells was observed through scanning electron microscopy. Nano-COM and COD binding was quantitatively determined through inductively coupled plasma emission spectrometry.
Results: The expression of hyaluronan on the cell surface was increased during wound healing because of Vero cell injury. The structure and function of the cell membrane were also altered by cell injury; thus, nano-crystal adhesion occurred. The ability of nano-COM to adhere to the injured Vero cells was higher than that of nano-COD crystals. The cell viability, SOD activity, and ΔΨm decreased when nano-crystals attached to the cell surface. By contrast, the MDA content, reactive oxygen species production, and cell death rate increased.
Conclusion: Cell injury contributes to crystal adhesion to Vero cell surface. The attached nano-COM and COD crystals can aggravate Vero cell injury. As a consequence, crystal adhesion and aggregation are enhanced. These findings provide further insights into kidney stone formation.
Keywords: nano-calcium oxalate crystals, cell injury, crystal adhesion, kidney stones
Introduction
Crystal formation and retention lead to kidney stone development.1 Crystal retention can be caused by the adherence of crystals to renal tubular epithelial cells.2 Thus, stone development occurs when crystals bind to the epithelial cell surface.3 Epithelial cell injury induces crystals to attach to the site of injury.4,5 Cell injury is also required for crystal–cell adhesion.6–8
Exposure to calcium oxalate (CaOx) crystals can induce oxidative stress in renal epithelial cells; oxidative stress occurs during the attachment of crystals to renal tubular cells.9 CaOx crystals can generate toxicity in renal epithelial cells via several approaches; for instance, crystals can change the composition and function of membrane surfaces, disrupt membrane potential, increase lipid peroxidation, promote mitochondrial dysfunction, induce reactive oxygen species (ROS) production, and cause an imbalance in the antioxidant mechanism;10 as a result, renal epithelial cells become injured. Injured cells express crystal adhesion molecules, such as hyaluronic acid (HA) and OPN, which promote crystal adhesion and retention.
Approximately 80% of kidney stones are composed of CaOx.11 The most common forms are calcium oxalate monohydrate (COM) and calcium oxalate dihydrate (COD).12 An important number of COM stones are developed as a consequence of the transformation of thermodynamically unstable COD crystals into stable COM crystals.13 This is a liquid (urine)-mediated process, but takes place once the stone is generated, and is a slow process. This means that the first generated crystals were COD, not COM crystals, and in spite of this transformation, the calculus can be considered a COD calculus. In fact, the etiology of such calculi is exactly the same as the COD calculi.
Urinary crystals in healthy persons and lithogenic patients are frequently diverse in terms of crystal size and phase.14,15 Laser-scattering spectroscopy has revealed that the particle size distribution of nano-crystallites in healthy urine is relatively uniform; conversely, this distribution is nonuniform in lithogenic urine, and particle size broadly increases from 100 nm to more than 1,000 nm.16 The nonuniform nano-particles are easily aggregated; as a consequence, stone formation may occur.
Studies have demonstrated the adhesion of COM and COD to renal tubular epithelial cells; however, studies have focused on micron-graded crystals.17,18 Although these micron crystals are usually formed from nano-crystals,19 especially urinary crystals that require a short residence time to flow through renal tubules, numerous nano-crystals are also formed. Therefore, the adhesion of nano-COM and COD to renal epithelial cells, especially injured renal epithelial cells, should be further investigated. Nano-sized crystals cause more serious injury than micron-sized crystals in normal epithelial cells.20 Our study evaluated the differences in the ability of nano-COM and COD to adhere to injured Vero cells and provided the relationship between cell injury and nano-crystal adhesion. Our results helped reveal the mechanisms of the formation of COM papillary renal stones or COD stones associated with tubular Randall’s plugs.
Materials and methods
Materials and equipment
African green monkey kidney epithelial (Vero) cells were purchased from Shanghai Institute of Cell Bank (Shanghai, People’s Republic of China). Other materials included the Dulbecco’s Modified Eagle’s Medium (HyClone, Logan, UT, USA), fetal bovine serum (Hangzhou Evergreen Biological Engineering Materials Co., Ltd., Hangzhou, People’s Republic of China), and penicillin and streptomycin (Beijing probe biological technology Co., Ltd, Beijing, People’s Republic of China). Cell culture plates were purchased from Wuxi Nest Bio-Tech Co., Ltd. (Wuxi, People’s Republic of China).
Cell proliferation assay kit (Cell Counting Kit-8 [CCK-8]) was purchased from Dojindo Laboratory, Kumamoto, Japan. Superoxide dismutase (SOD) kit and malonaldehyde (MDA) kit were purchased from Nanjing Jiancheng Institute of Biotechnology (Nanjing, People’s Republic of China). Propidium iodide (PI), anti-quencher, hematoxylin–eosin (H&E) dye, 2′,7′-dichlorofluorescein diacetate dye (DCFH-DA) and 5,5′,6,6′-tetrachloro-1,1′,3,3′-tetraethyl-imidacarbocyanine iodide were purchased from Shanghai Beyotime Bio-Tech Co., Ltd. (Shanghai, People’s Republic of China). bHABP was purchased from Merck Corporation (Darmstadt, Germany), Fluorescein isothiocyanate–avidin was purchased from Wuhan Boster Biological Engineering Co., Ltd (Wuhan, People’s Republic of China). Other conventional reagents were analytically pure and purchased from Guangzhou Chemical Reagent Factory (Guangzhou, People’s Republic of China).
Apparatus included X-L type environmental scanning electron microscope (Philips, Eindhoven, the Netherlands), D/max2400X X-ray powder diffractometer (Rigaku Corporation, Tokyo, Japan), laser scanning confocal microscope (LSM510 META Duo Scan, Carl Zeiss Meditec AG, Jena, Germany), inverted fluorescence microscope (IX51, Olympus Corporation, Tokyo, Japan), flow cytometer (FACS Aria, BD Biosciences, San Jose, CA, USA), microplate reader (Safire2, Tecan, Mannedorf, Switzerland), inductively coupled plasma atomic emission spectrometer (Optima 2000DV, PerkinElmer Inc., Waltham, MA, USA), and atomic force microscope (AutoProbe CP, Thermomicroscopes, Veeco, Plainview, NY, USA).
Experimental methods
Synthesis and characterization of nano-COM, COD crystals
According to our previous research,21 nano-COM and COD crystals were synthesized. For synthesis of nano-COM, CaCl2 (300 mmol/L) and K2Ox (300 mmol/L) solutions were prepared in water. A 50 mL aliquot of each solution was mixed directly at 25°C reaction temperature. The reaction mixture was stirred with a magnetic stirrer (1,250 rpm) followed by washing twice with anhydrous ethanol under ultrasonication. The crystals were collected by suction filtration and dried in drying oven for 24 hours. For synthesis of nano-COD, CaCl2 solution (192 mmol/L) was added to buffer solution (pH =6.8), before adding K2Ox solution (50 mmol/L) to reaction mixture at 25°C. The reaction mixture was stirred with a magnetic stirrer (1,250 rpm) followed by washing twice with anhydrous ethanol under ultrasonication. The crystals were collected by suction filtration and dried in drying oven for 24 hours. The morphology and crystal phase of the prepared sample were characterized by scanning electron microscopy (SEM) and X-ray powder diffraction.
Cell culture
African green monkey kidney epithelial (Vero) cells in our experiments were obtained from Shanghai Institute of Cell Bank (Shanghai, People’s Republic of China). As no in vivo experiments were performed in this study, ethical consent to use these cell lines was not needed, as approved by the ethics committee of Jinan University, Guangzhou, People’s Republic of China. Vero cells were cultured in Dulbecco’s Modified Eagle’s Medium-F12 culture medium supplemented with 10% fetal bovine serum. Cells were incubated in an atmosphere of 5% CO2 air at 37°C and saturated humidity. After the cells were trypsinized, 100 μL of cell suspension (1×10⁵ cells/mL) was plated in 96-well plates and cultured for 24 hours. The culture medium was removed by suction and the cells were washed twice with phosphate-buffered saline (PBS). The experimental model was divided into three groups: a) normal control group: only serum-free medium was added; b) injury control group: cells were exposed to a serum-free medium containing 0.3, 0.5, and 1.0 mmol/L H2O2 for 1 hour; c) crystal-treated group: cells were treated with 0.3, 0.5, and 1.0 mmol/L H2O2 for 1 hour, after which the culture medium was removed by suction, washed twice with PBS, then incubated with 100 μg/mL serum-free medium containing nano-COM or COD for 6 hours.
We selected 6 hours of incubation in the following cell experiments because the transit time of urinary crystals across the kidney is only several minutes;1 this period is too short for crystals to become large enough to be trapped. After the crystals become fixed on the surface of renal tubular epithelial cells, the free urinary crystals can grow and form stones. These adhered crystals could be fixed on the epithelial cell surface for a long time and could even grow large enough to block renal tubules. The treatment time of 6 hours in this study is consistent with that described in previous studies on kidney stones.22,23
We selected the concentrations of H2O2 and crystals based on the following reasons. The commonly used H2O2 concentration to induce cell injury ranged from 10 to 1,000 μmol/L.24,25 We also set a series of crystal concentrations (50, 100, 200, and 400 μg/mL) in our preexperiment; among these concentrations, 100 μg/mL yielded moderate results. This concentration did not induce severe cellular damage or minor cell injury; this status could be easily compared in terms of the differences in adhesion behavior and reinjury ability. The CaOx concentration utilized in several studies is also 100 μg/mL, which is a frequently used dose.26,27
Cell viability, SOD activity, and MDA content detection
An amount of 100 μL of cell suspension (1×10⁵ cells/mL) was plated per well in 96-well plates, and incubated in Dulbecco’s Modified Eagle’s Medium culture medium containing 10% fetal bovine serum for 24 hours. After that, the cells were divided into three groups as per the “Cell culture” section, and then cell viability assay was carried out using the CCK-8 test method. Simultaneously, SOD activity and MDA content were measured using the SOD and MDA kits, respectively.
PI staining
PI staining assay was performed on cells of each group as per the “Cell culture” section. After the treatment time, the supernatant was removed by suction and cells were washed three times with PBS, and then 5 μL PI staining solution was added and the cells were incubated at 4°C for 20–30 minutes. The cells were washed with PBS three times again, followed by observing the dead cells under the fluorescence microscope.
PI quantitative analysis: 100 μL of cell suspension was inoculated in 96-well plates with the concentration of 1×10⁵ cells/mL, PI fluorescence intensity was measured directly in accordance with the earlier operation using a microplate reader.
H&E staining
An amount of 1 mL cell suspension (1×10⁵ cells/mL) was seeded per well in 12-well plates and grouped as discussed in the “Cell culture” section. After the treatment time, the supernatant was removed by suction and washed three times with PBS. Afterwards, the cells were fixed with 4% paraformaldehyde for 15 minutes at room temperature. Cells were washed thrice with PBS. After fixation, the cells were stained with hematoxylin and incubated for 15 minutes. Then cells were washed with distilled water for 2 minutes to remove excess stain. After that, the cells were stained with eosin staining solution for 5 minutes. The cells were washed with distilled water for 2 minutes to remove excess eosin. After treatment, the cells were observed under the microscope, cell nucleus was stained purple or blue, cytoplasm was stained pink or red.
Atomic force microscopy analysis
An amount of 1 mL cell suspension with a cell density of 1×10⁵ cells/mL was plated per well in 12-well plates. Afterward, the cells were treated with 0, 0.3, and 1.0 mmol/L H2O2 and incubated for 1 hour. Then, atomic force microscopy (AFM) was used to observe the morphology of cell and structural change of cell surface. The values of cell surface roughness, mean height, and distribution of particle size on cell surface were obtained automatically by AFM with software IP 2.1. (Thermomicroscopes, Veeco, Plainview, NY, USA) Scanning range of nuclear area was 5×5 μm. Histogram of the cell surface particles was also obtained automatically by AFM. Root-mean-square roughness and average roughness of cell surface were obtained by the following equations:
|
|
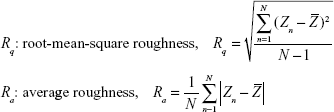
where N represents the total number of data points within the specified area, Zn is the height of the nth point,  is the average height.
ROS generation
ROS production of each group was measured according to our previous research.19 In brief, 2 mL of cell suspension with a cell concentration of 1×10⁵ cells/mL was inoculated per well in six-well plates. After synchronization, the cells were divided into three groups as per the “Cell culture” section. The cells were resuspended by adding 500 mL PBS in a microcentrifuge tube. The samples were then stained with 2′,7′-dichlorofluorescein diacetate. ROS distribution was observed under fluorescent microscope; the fluorescence intensity of intracellular ROS was quantitatively detected by microplate reader.
Measurement of mitochondrial membrane potential (Δψm)
The cell suspension (2 mL) with a concentration of 1×10⁵ cells/mL was inoculated per well in six-well plates for 24 hours. After synchronization, the cells were divided into three groups as per the “Cell culture” section. After 6 hours of incubation with nano-COD and COM crystals at the concentration of 100 μg/mL, the supernatant was aspirated and the cells were washed twice with PBS and digested with 0.25% trypsin. The cells were suspended by pipetting, followed by centrifugation (1,000 rpm, 5 minutes). The supernatant was aspirated and the cells were washed with PBS and centrifuged again to obtain a cell pellet. The cells were resuspended by adding and thoroughly mixing 500 μL of PBS in a microcentrifuge tube. Finally, the samples were stained with 5,5′,6,6′-tetrachloro-1,1′,3,3′-tetraethyl-imidacarbocyanine iodide and then quantitatively detected by flow cytometer.
Hyaluronic acid (HA) detection
HA detection was analyzed in the media as described previously.28 Briefly, 1 mL of cell suspension with a cell concentration of 1×10⁵ cells/mL was inoculated per well in 12-well plates. After synchronization, the cells were grouped; 0.3, 0.5, and 1.0 mmol/L H2O2 were used to damage Vero cells. Then 100 μg/mL nano-COM or COD crystals were added to the injured cells. After 6 hours’ incubation, the supernatant was aspirated and the cells were washed twice with PBS. Afterward, the cells were fixed with fixative (composed of 5% glacial acetic acid, 10% formalin, and 70% ethyl alcohol) and washed with PBS three times. An amount of 100 μL of 5 mg/mL bHABP solution was then added to the cells and incubated at 4°C overnight. After washing thrice with PBS, 100 μL of fluorescein isothiocyanate–avidin was added to the cells and they were incubated for 1 hour. The prepared samples were mounted with anti-fade fluorescence mounting medium and observed using a confocal microscope.
Quantitative analysis: HA fluorescence intensity was analyzed using Axiovision software (Carl Zeiss Meditec AG). HA expressions in 100 cells were quantitatively detected for each group.
SEM observation of crystal adhesion to cell surface
Cells were grouped as per the “Cell culture” section; after incubating with 100 μg/mL nano-COM and COD crystals for 6 hours, the supernatant was removed by suction and cells were washed three times with PBS, fixed in 2.5% glutaraldehyde at 4°C for 24 hours, then fixed with 1% OsO4, washed again three times with PBS, dehydrated in gradient ethanol (30%, 50%, 70%, 90%, and 100%, respectively), dried under the critical point of CO2, treated with gold sputtering, and finally observed under SEM.
Quantitative determination of crystal adhesion
An amount of 1 mL of cell suspension with a cell concentration of 1×10⁵ cells/mL was inoculated per well in 12-well plates and incubated for 12 hours. Cells were grouped as per the “Cell culture” section. After 6 hours’ incubation, the supernatant was aspirated and the cells were washed three times with PBS to remove unbound crystals. The samples were then transferred to a 25 mL beaker and mixed with 4.0 mL concentrated HNO3 and 1.0 mL HClO4 solution for digestion. A separate HClO4 solution was heated until smoke appeared; the remaining heat was used to dry the solution. After cooling, 3 mL of 2% HNO3 was added. An inductively coupled plasma atomic emission spectrometer was used to measure the concentration of Ca2+ ions, which was then converted to determine the amount of crystal adhesion. The control group was treated using the same method to determine the interference of intracellular Ca2+ in Vero cells.
Statistical analysis
Experimental data were expressed as the mean ± standard deviation. The experimental results were analyzed statistically using SPSS 13.0 software (SPSS Inc., Chicago, IL, USA).
Results
Characterization of nano-COM and COD
The COM and COD crystals of approximately 100 nm were prepared in accordance with our previous research.21 The morphological characteristics, crystal size, and crystal phase were detected through SEM and X-ray powder diffraction; all of the prepared crystals were confirmed as target products (Figure 1). The prepared crystals presented a nearly spherical morphology with some irregularities. The crystal phase was detected through X-ray powder diffraction. The prepared samples were pure-phase COM or COD crystals, and no other impure diffraction peaks were observed.
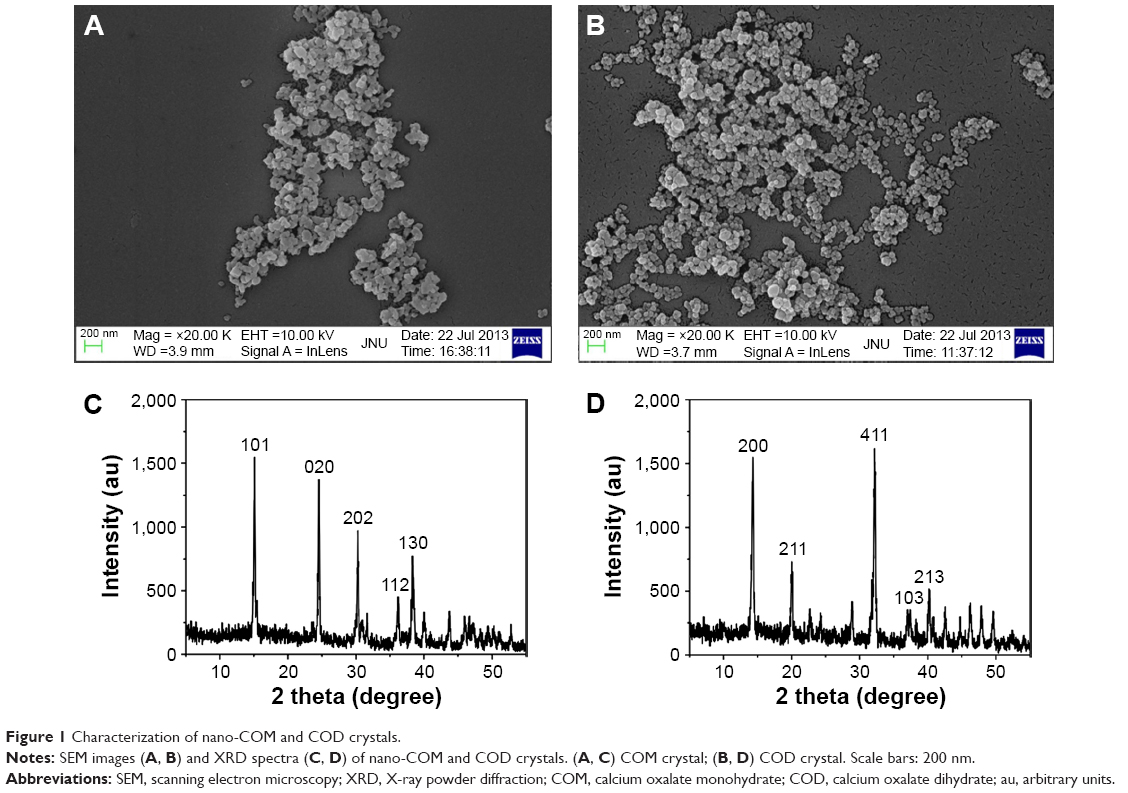 | Figure 1 Characterization of nano-COM and COD crystals. |
Changes in cell viability, SOD activity, and MDA content
The extent of oxidative stress in Vero cells after treatment with H2O2 and further treatment with nano-COM and COD crystals is indicated in Figure 2. The decreased cell viability (Figure 2A) and antioxidant activity (SOD; Figure 2B), as well as the increased lipid peroxidation products (MDA content; Figure 2C), reflect oxidative stress and cell injury. When Vero cells were treated with H2O2, the cell viability and SOD activity were decreased, whereas the MDA content was increased. Moreover, the c(H2O2) range of 0–1.0 mmol/L exhibited a concentration-dependent effect on all parameters. Nano-COM or COD crystals aggravated cell injury, which further decreased cell viability and SOD activity while increasing the MDA content. The reinjury effect of nano-COM was stronger than that of nano-COD on cells under the same conditions.
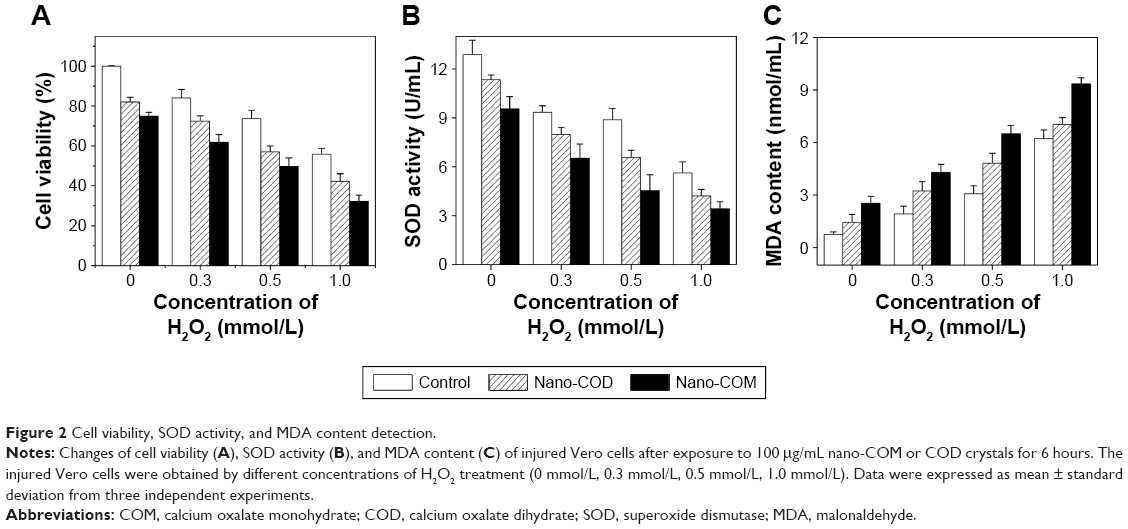 | Figure 2 Cell viability, SOD activity, and MDA content detection. |
Cell death detection by PI staining
The results of PI staining in Vero cells at different injury levels and after interaction with nano-COM and COD for 6 hours are shown in Figure 3A and B. When c(H2O2) was increased from 0.3 mmol/L to 0.5 mmol/L and 1.0 mmol/L, the number of PI-stained nuclei and the relative fluorescence intensity (Figure 3B) in the control group, nano-COM, and nano-COD groups were all gradually increased, thereby indicating that the overall cell death rate was gradually increased.29 Nano-COM and COD crystals can reinjure the injured Vero cells, which further increases the number of PI-stained nuclei. More nuclei were stained by PI, and the relative fluorescence intensity was stronger in the nano-COM group than in the nano-COD group (Figure 3B), thereby indicating that the nano-COM crystals induced higher cell death than the nano-COD crystals.
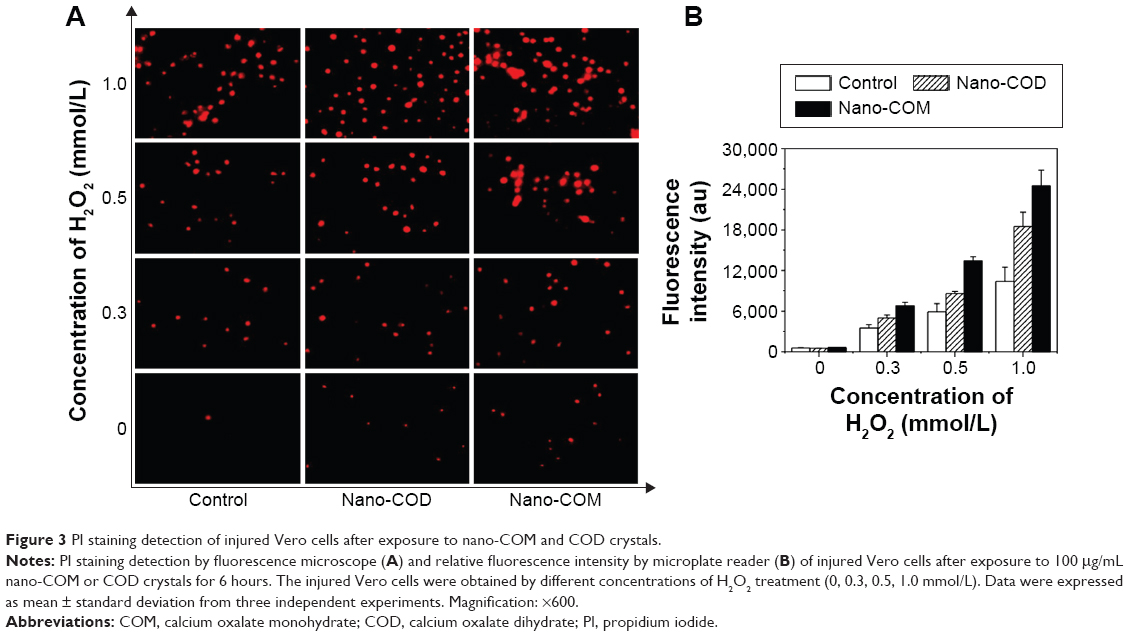 | Figure 3 PI staining detection of injured Vero cells after exposure to nano-COM and COD crystals. |
Cell morphological observation by H&E staining
To observe the injury in Vero cells, the cells were stained with H&E, which demonstrates the overall morphology of cells. Hematoxylin is an alkaline dye that stains chromatin in the nucleus with blue–purple. While eosin is an acidic dye which stains cytoplasm red or pink.30,31
With the increasing H2O2 concentration, the degree of injury of cells increases, which is mainly manifested in the reduced cell number and disordered cell morphology (Figure 4). The number of cells in the nano-COM- and COD-treated group was less than the cells in the control group, which was only treated with H2O2. The cell nuclei of the crystal-treated group were shrunk and stained blue–black. Simultaneously, the cells were loosely arranged, and the intercellular connections were further destroyed. After treatment with 0.5 mmol/L and 1.0 mmol/L of H2O2, the morphological disorder of cells in the nano-COM treatment group was exceptionally obvious.
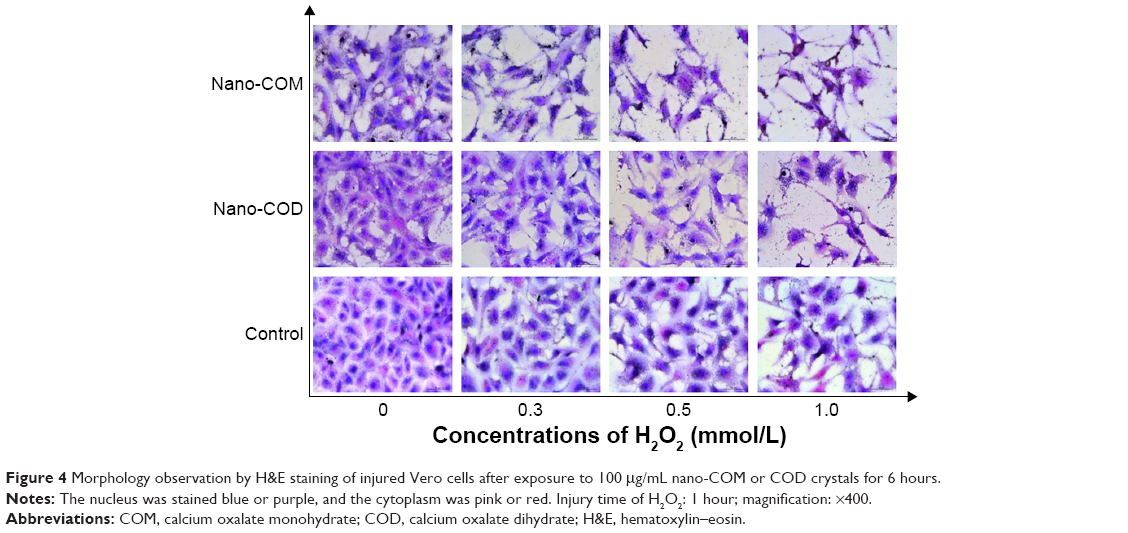 | Figure 4 Morphology observation by H&E staining of injured Vero cells after exposure to 100 μg/mL nano-COM or COD crystals for 6 hours. |
AFM detection of cell morphology and cell membrane surface structure
The cell membrane is a barrier that prevents extracellular substances from freely entering cells. After cell injury, the composition and properties of the cell membrane are changed. Consequently, we investigated the changes in the surface structure of normal and injured Vero cells treated with 0.3 mmol/L and 1.0 mmol/L H2O2 by AFM (Figure 5). This approach determines the surface roughness, mean height of cell, particle size on the cell surface (Table 1), and the ultrastructure of the cell surface (Figure 5).
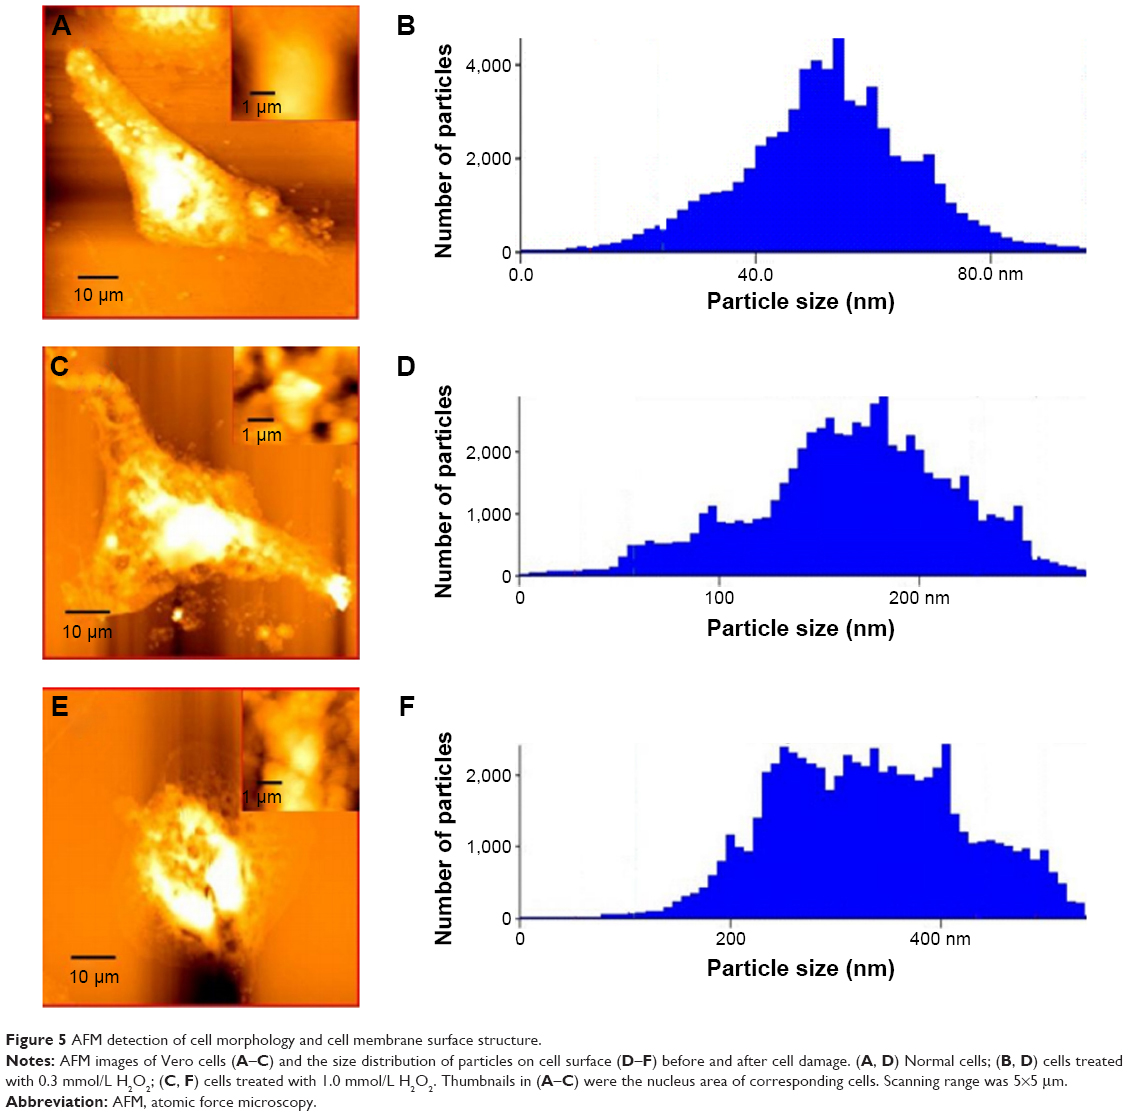 | Figure 5 AFM detection of cell morphology and cell membrane surface structure. |
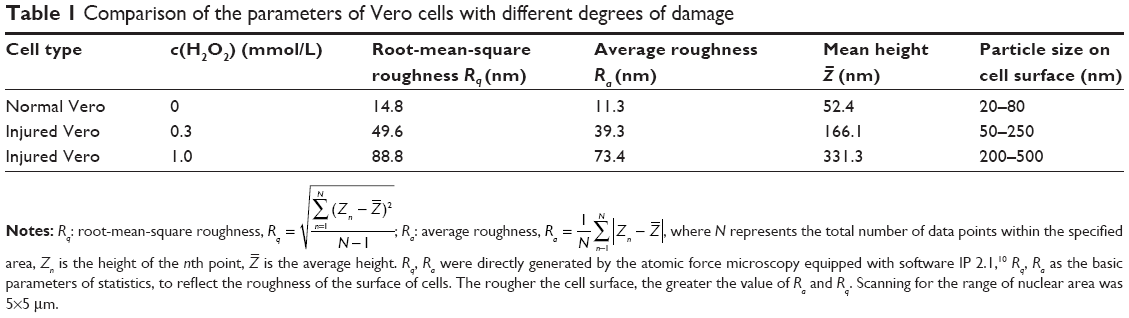 | Table 1 Comparison of the parameters of Vero cells with different degrees of damage |
 ; Ra: average roughness,
  , where N represents the total number of data points within the specified area, Zn is the height of the nth point,
 The surface of normal Vero cells was smooth (Figure 5A), with less roughness (11.3 nm); the cell periphery had no protrusions, and the particle size of the cell surface was ~20–80 nm (Figure 5B). When the cells were treated with 0.3 mmol/L H2O2, the cell surface roughness increased to 39.3 nm and became more complex (Figure 5C); the particle size was distributed at 50–250 nm. Therefore, the cell surface secreted more proteins, fats, sugars, and other substances, and particulate matter covered the surface.32 In addition, the cells began to shrink; the cell edges appeared fragmented in Figure 5C, and the average height of the cells increased to 166.1 nm (Figure 5D). When Vero cells were treated with 1.0 mmol/L H2O2, the cell shrinkage was increased (Figure 5E). Likewise, the cell surface roughness was increased to 73.36 nm, and the particle diameter was increased to ~200–500 nm (Figure 5F). Therefore, the amount of cell surface protein, fat, sugar, and other substances increased on the cell surface when Vero cells have been seriously injured.
Intracellular ROS generation after cell injury
ROS can rapidly react with cellular macromolecules, thereby damaging normal cell function and eventually causing cell death; the oxidation during cell injury can promote the deposition of CaOx crystals in kidneys.33 The ROS produced by COD and COM crystals were measured with a 2′,7′-dichlorofluorescein diacetate fluorescence probe. Compared with the control group, H2O2 and COM or COD nanocrystals could stimulate cells to produce ROS (Figure 6A and B). The higher c(H2O2) produced a stronger green fluorescence intensity from the intracellular ROS. After nano-COD and COM crystals were added, the fluorescence intensity of intracellular ROS was further enhanced. The fluorescence intensity of the COM-treated group was slightly higher than that of the COD-treated group (Figure 6B), which indicated that COM produced higher cytotoxicity and generated more ROS.
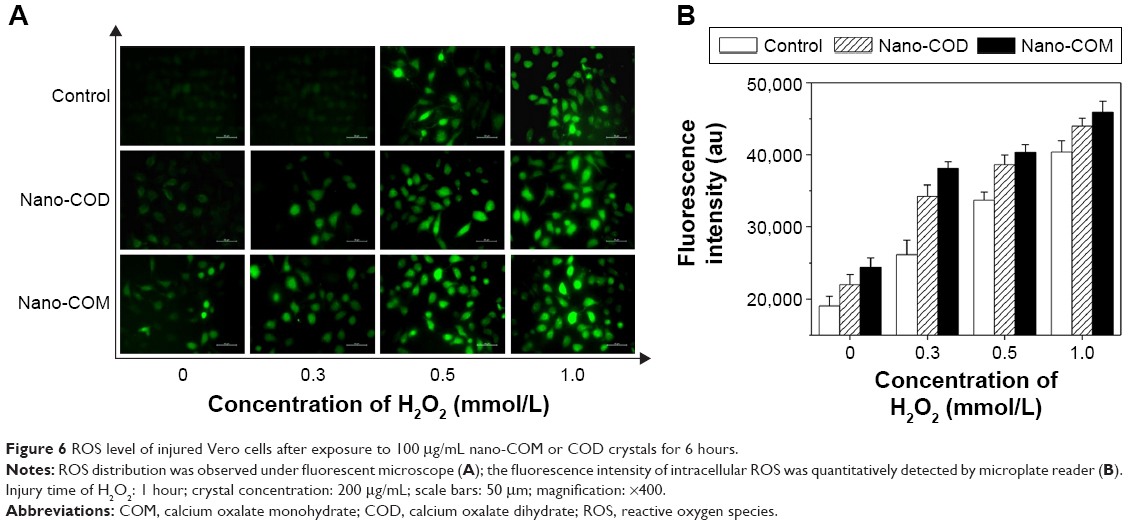 | Figure 6 ROS level of injured Vero cells after exposure to 100 μg/mL nano-COM or COD crystals for 6 hours. |
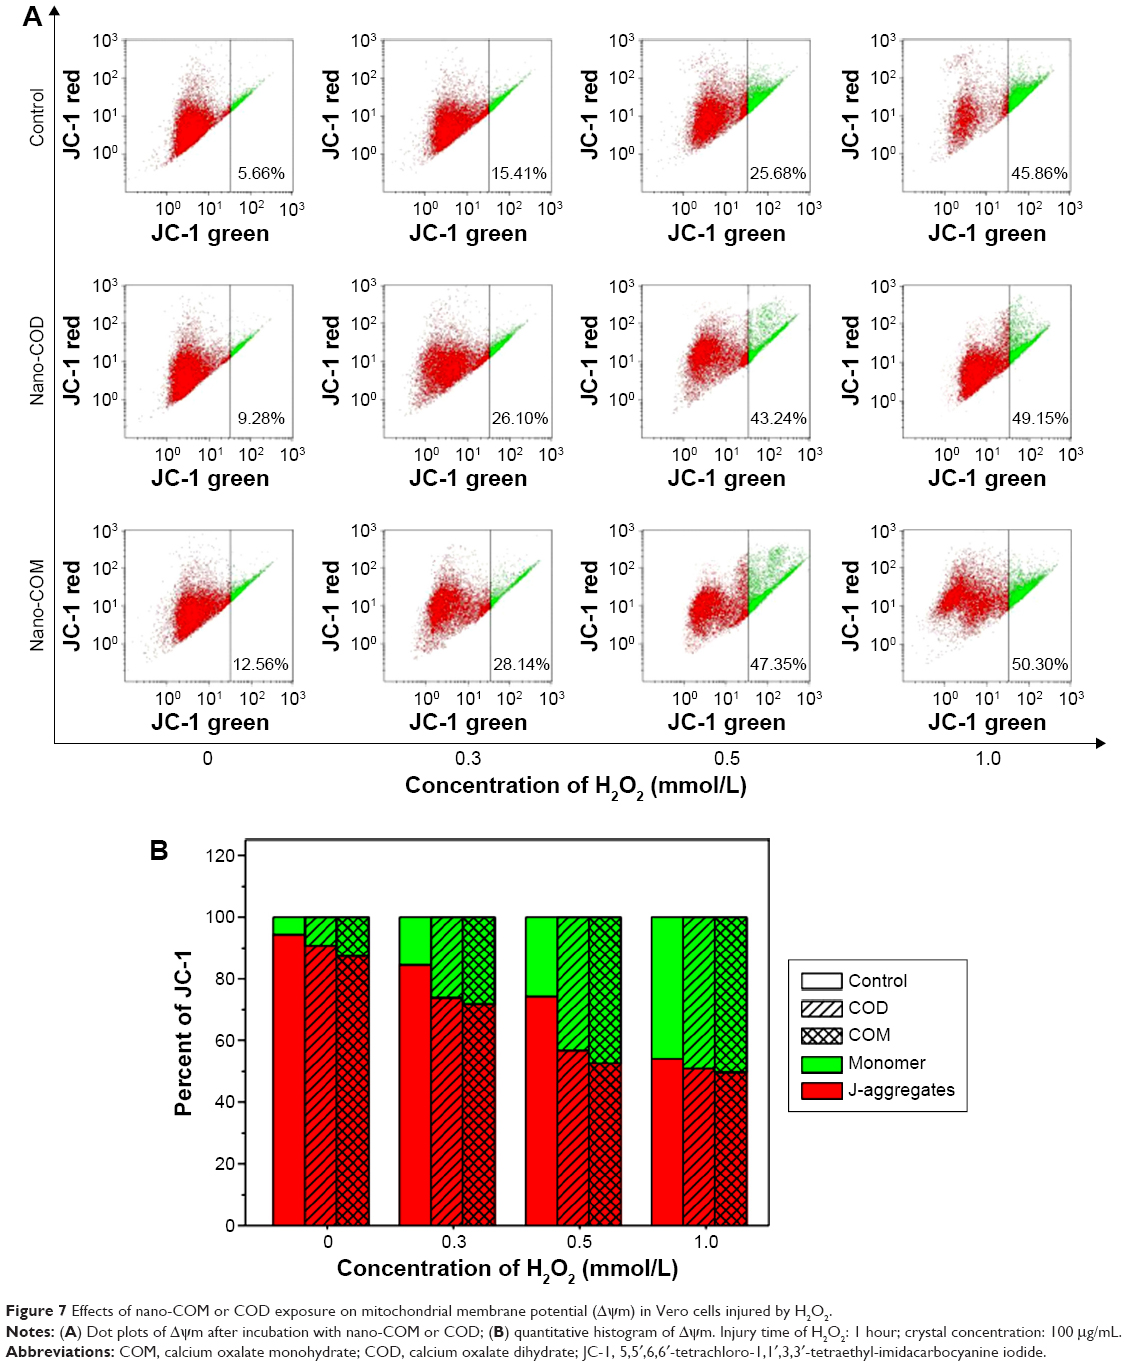
Decreased mitochondrial membrane potential caused by nano-COM and COD
Apoptosis and necrosis are often preceded by mitochondrial dysfunction, specifically the loss of mitochondrial membrane potential (Δψm). 5,5′,6,6′-Tetrachloro-1,1′,3,3′-tetraethyl-imidacarbocyanine iodide differentially labels mitochondria with high and low Δψm by forming J-aggregates or monomers that emit orange–red or green light, respectively.34
We analyzed the changes in Δψm of injured cells treated with nano-COM and COD crystals with a mitochondrial membrane potential assay kit (Figure 7). Compared with the control group, H2O2 and nano-COM or COD crystals caused Δψm to decrease. The higher H2O2 concentration caused a greater Δψm decrease in Vero cells. After adding nano-COD and COM crystals, the degree of Δψm decrease was further enhanced. The decrease of Δψm in the COM-treated group was slightly higher than in the COD-treated group, thereby indicating that COM produced higher cytotoxicity and caused more mitochondrial dysfunction.
 | Figure 7 Effects of nano-COM or COD exposure on mitochondrial membrane potential (Δψm) in Vero cells injured by H2O2. |
Hyaluronic acid (HA) expression on the injured cell surface
HA acts as a crystal adhesion molecule that is expressed after cell injury. Thus, the HA expression can indirectly reflect the condition of injured cells.35 Accordingly, we investigated the crystal adhesion mediated by the altered HA expression after cell injury.
As shown in Figure 8, treatment with nano-COM and COD for 6 hours at different damage levels increased the HA expression (green color) on the cell surface in a concentration-dependent manner, as seen under a confocal microscope. With the increasing c(H2O2), the green fluorescence was gradually enhanced, thereby indicating that the HA expression was gradually increased. The green fluorescence intensity caused by nano-COM crystals was obviously stronger compared with that of the nano-COD crystals. Consequently, higher HA expression was induced by nano-COM, and the degree of cell injury was higher.
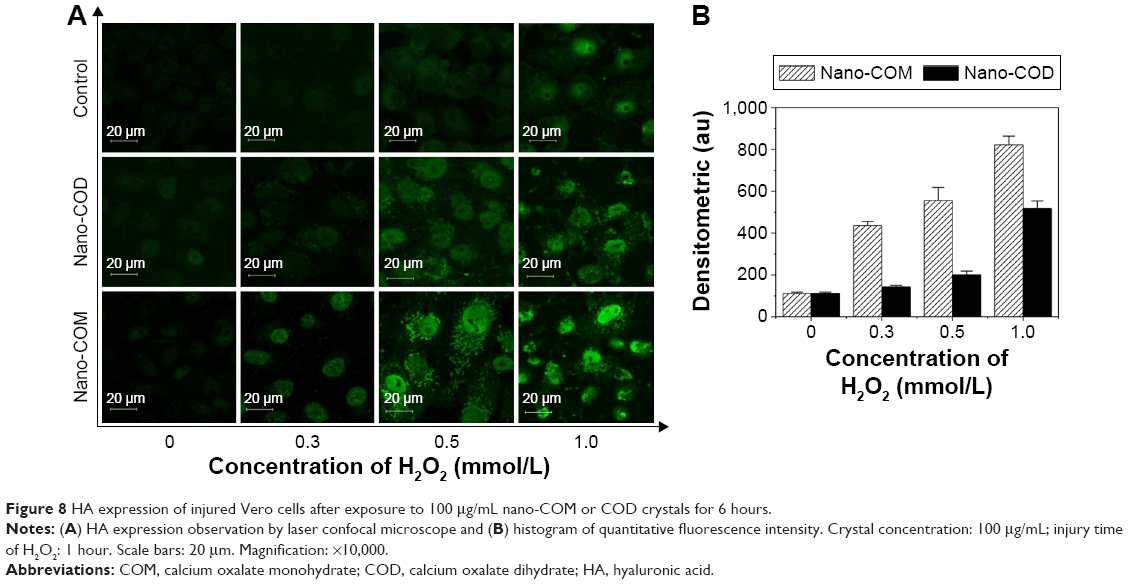 | Figure 8 HA expression of injured Vero cells after exposure to 100 μg/mL nano-COM or COD crystals for 6 hours. |
SEM of crystal binding
The SEM micrographs in Figures 9 and 10 show the different degrees of Vero cell injury after incubation for 6 hours with nano-COM and COD crystals, respectively. Results demonstrated that the crystal binding was gradually increased on the cell surface with the increasing degree of Vero injury. When the cells were injured by 0.5 mmol/L and 1.0 mmol/L H2O2, the entire cell surface was almost covered by crystals. After 6 hours of exposure to nano-crystals, the nano-COM crystals could bind to the Vero cells much more readily than nano-COD under the same conditions. Our results also revealed that the injured cells have the ability to promote the crystal aggregation. As the degree of cell injury increased, the aggregation of adhered crystals also increased, especially the nano-COM crystals.
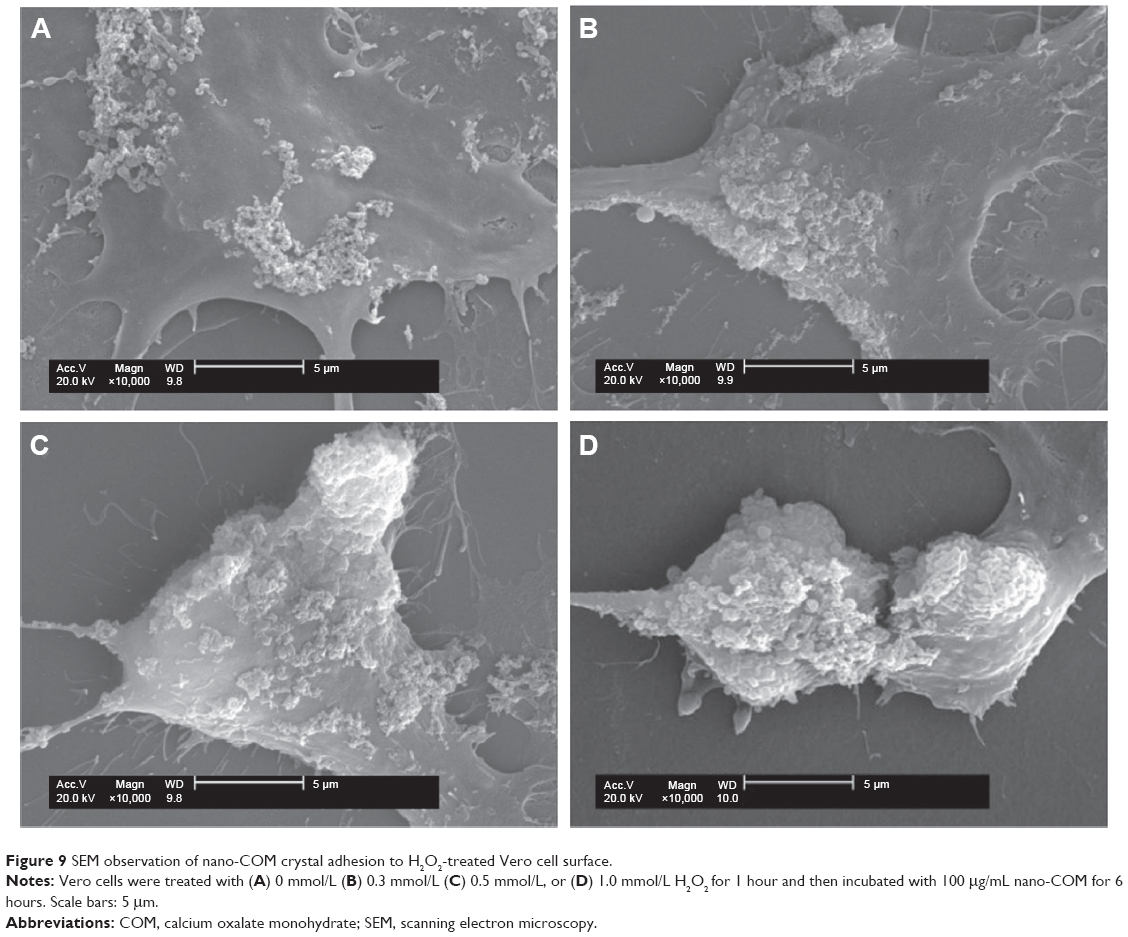 | Figure 9 SEM observation of nano-COM crystal adhesion to H2O2-treated Vero cell surface. |
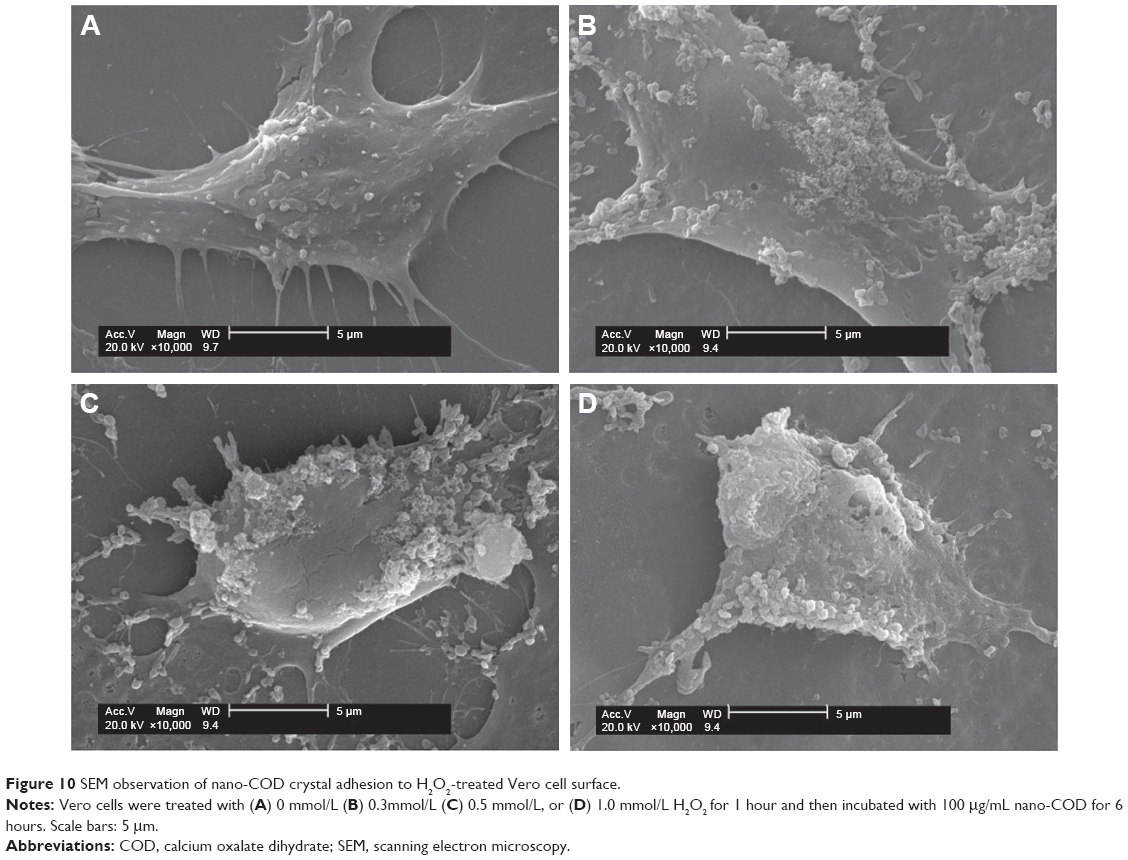 | Figure 10 SEM observation of nano-COD crystal adhesion to H2O2-treated Vero cell surface. |
Quantitative determination of crystal binding by inductively coupled plasma emission spectrometry
The quantitative determination of the amount of crystal adhesion on each set of cell surface conditions by inductively coupled plasma emission spectrometry is shown in Figure 11. Treatment with different concentrations of H2O2 increased the degree of Vero cell injury, which enhanced the amount of nano-COM and COD crystals that adhered to the cell surface. The adhesion amount was positively related to the degree of injury caused by H2O2. Under the same conditions, the amount of crystal adhesion was greater in nano-COM crystals than in nano-COD.
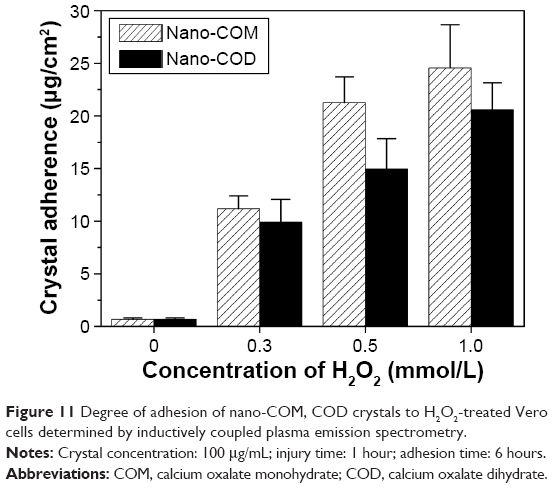 | Figure 11 Degree of adhesion of nano-COM, COD crystals to H2O2-treated Vero cells determined by inductively coupled plasma emission spectrometry. |
Discussion
The present study demonstrated that nano-CaOx crystals induce oxidative injury in renal epithelial cells. This injury could contribute to CaOx crystal adhesion and the development of kidney stones. In this study, we used the H2O2-induced oxidative injury model of Vero cells.
H2O2 is an important ROS because it is produced in abundant amounts in several tissues; a high level of oxidants have been detected at inflammatory sites.36 H2O2 causes various changes in renal epithelial cells, such as the increased free radical generation, increased lipid peroxidation, and the decreased cellular antioxidant status, which induces cell injury and eventual cell death.37,38 H2O2 could cause oxidative stress by reacting with transition metals, thereby damaging cell components, such as proteins, lipids, and DNA, and leading to cell death.39 The toxic effect of H2O2 has been suggested to occur via hydroxyl radicals, which are generated by the Fenton or Haber–Weiss reactions. These free radicals seem to induce changes in the cell membrane integrity and function via the peroxidation reaction.40,41
When Vero cells were treated with different concentrations of H2O2 in this study, the cell viability (Figures 2A and 3), SOD activity (Figure 2B), and intracellular Δψm were decreased while the MDA content was simultaneously increased (Figure 2C) with the concentration of H2O2, thereby indicating that the H2O2 decreased antioxidant capacity, increased lipid peroxidation, and damaged the cells. Lipid peroxidation represents oxidative damage by free radicals resulting in structural alteration to cell membrane (Table 1),40 which has been proven by the results of AFM analysis (Figure 5). H2O2 can cause membrane lesions through lipid peroxidation, promote alterations in several amino acids, and lead to the inactivation of enzymes.42 Several antioxidant enzymes such as SOD, GPx, and catalase limit the extent of cell damage; however, exposure to a high concentration of H2O2 can give rise to the generation of ROS (Figure 6), which decreases the antioxidant enzyme activity resulting in the cellular injury.
COM is the major crystalline component that is most frequently observed in the majority of CaOx renal stones; its crystals have been shown to exert toxic effects on renal tubular epithelial cells as a result of oxidative stress. Previous studies reported the cytotoxic effects of COM in proximal tubule cells,14 human renal epithelial HK-2 cells,43,44 canine distal renal tubular MDCK cells,45,46 and LLC-PK1 cells.8 COM crystals could modify the membrane structure and function, activate ROS, cause oxidant/antioxidant imbalance, lead to mitochondrial dysfunction, and increase lipid peroxidation,19 which induces apoptotic or necrotic cell death in renal epithelial cells.9,47–49 COD is the second most common component of CaOx renal stones, although existing studies on the toxic effect of COD crystals on renal epithelial cells are inadequate. Our previous study reported that nano-COD induced higher toxicity on Vero cells compared with the micro-sized crystals. The nano-COD crystals also increased the LDH release, ROS level, apoptosis rate, and the expression of adhesion molecules.28 Consequently, renal epithelial cell injury occurs during the adhesion of CaOx crystals.9
The cell viability (Figure 2A), SOD activity (Figure 2B), MDA content (Figure 2C), PI staining (Figure 3A and B), and intracellular Δψm (Figure 7) demonstrated that the nano-COM and COD crystals injured the Vero cells by producing oxidative stress. The generation of free radicals during the interaction between crystals and Vero cells has been evidenced by ROS production (Figure 6A and B). ROS generation was higher when the cells were exposed to higher amounts of nano-COM and COD crystals. The nano-sized crystals have a larger specific surface area and more active sites than larger crystals;21 these active sites could capture oxygen molecules and produce superoxide radicals, which disrupted the antioxidant system and enhanced the lipid peroxidation in Vero cells.50 H&E staining demonstrated that when cells were treated with nano-CaOx crystals, the cell-to-cell contacts appeared stretched and the intercellular spaces widened, whereas the number of cells was decreased compared with the normal control group (Figure 4). Therefore, nano-CaOx crystals can injure renal epithelial cells. Nano-COM and COD could be internalized by Vero cells because of their small size. The internalized nano-crystals can directly affect mitochondria, thereby disturbing the metabolic balance and leading to mitochondrial membrane depolarization and Δψm decrease (Figure 7). In addition, HA expression increased with the concentration of nano-COM and COD crystals (Figure 8). HA expression on the cell surface during wound healing also indirectly reflected the extent of cell damage.35 The cell injury and cell death induced by nano-COM crystals was higher than that of nano-COD crystals because nano-COM caused the higher production of ROS compared with nano-COD.
Several researchers have reported that renal tubular cell injury is associated with the crystal–cell interaction process. CaOx crystals can cause cell injury and alter the cell composition, which can affect crystal adhesion. On the other hand, another study suggested that when renal epithelial cells are damaged by any other form of injury, the adhesion of crystals is increased.51
Our results identified two distinct reasons for nano-crystal attachment to Vero cells after cell injury. First, the expression of adhesion molecules on the cell surface, as a result of cell injury, facilitates crystal attachment. When Vero cells were injured by different concentrations of H2O2, cells secreted HA (Figure 8) to repair the epithelial wound.52 The expression of HA by the injured tubular epithelial cells was most likely aimed at restoring renal function; however, HA contains a carboxyl group and a large number of negative charges, thereby turning the non-crystal-binding epithelium into a crystal-binding site.47 These trends may be attributed to the fact that the degree of injury increased with the increasing c(H2O2), thereby resulting in the adhesion of COM and COD crystals on the cell surface (Figures 9 and 10). Additionally, the adhered crystals continuously increased the active sites to which the crystals were subsequently attached. Therefore, the number of crystals that adhered to the cell surface gradually increased (Figure 10). This trend significantly increased the risk of forming kidney stones. The adherence of crystals to the Vero cell surface is illustrated in the SEM micrographs (Figures 9 and 10). A previous study also showed that the mechanism of injury increased the adherence of crystals after injury and during wound repair.51 Another experiment suggested that the crystal binding sites are exposed on the cell surface when cells are injured and/or during regeneration after injury.53
Second, AFM observation revealed that Vero cell injury by H2O2 led to cell membrane rupture and released intracellular organic substances (Figure 5), thereby increasing the crystal binding sites on the cell surface. These sites can form ionic bonds, hydrogen bonds, or electrostatic forces with the CaOx crystals, thereby promoting crystal adhesion. The attached crystals caused further membrane damage, which increased CaOx crystal binding. The AFM results provide the surface roughness, mean height, and particle size of the cell surface; these parameters can explain structural changes in the cell membrane after H2O2 treatment (Table 1). The cell surface of normal cells was relatively smooth, with low adhesion force. By contrast, in Vero cells treated with H2O2, the cell surface was disrupted as visualized by the cell membrane ultrastructure (Figure 5B and C). In addition, the secreted intracellular organic substances increased the particle size on the cell surface (Figure 5E and F). Simultaneously, these secreted molecules increased the adhesion force and allowed for crystal–cell adhesion. Previous investigations with AFM have confirmed that the renal cell surface mediated the adhesion force in specific faces of COM crystals.54 The SEM observation of COD crystals’ adhesion also produced similar results.55 The adherent crystals on the apical cell surface could serve as sites for the aggregation of more crystals.56
Furthermore, the cell injury induced by H2O2 and CaOx crystals can destroy the tight junctions and polarity of the cell membrane, which translocates the basolateral or tight junction region components to the apical surface of the cell.53,57 These components, such as phosphatidylserine,53 and Na+/K+-ATPase-α1 protein,57 contain acidic groups with a high affinity for CaOx crystals, especially for COM. Consequently, the exposure of these molecules on the membrane surface facilitates crystal adhesion to injured cells. A previous study suggested that injured cells induced the loss of membrane lipid asymmetry, which also led to phosphatidylserine exposure on the cell surface, thereby promoting crystal attachment.58
Our results recognized that the degree of attachment to the cell surface was greater for nano-COM than for nano-COD (Figure 11). The COM crystal surface has a higher positive charge density than COD;59 thus, the negatively charged molecules of the injured cell surface showed stronger interaction with COM than COD. Therefore, the electrical charge could mediate the elevated adhesion of COM crystals to cells. A previous study also suggested that the COM may have a higher affinity for the renal tubular cell surface than COD.60 Furthermore, toxicity results confirmed that the nano-COM crystals induced higher injury effects on Vero cells compared with COD, which increased the adhesion and aggregation of nano-COM (Figure 9). A study by Wesson et al supported our results;61 their group confirmed that the adhesion to renal tubular cells in culture was higher for COM compared with COD.
Conclusion
Our study demonstrated that Vero cell injury enhanced the cell surface expression of the crystal binding molecule HA and altered the structure and function of the cell membrane. These mechanisms facilitated the attachment of nano-CaOx crystals to the cell surface. The attached nano-COM and COD crystals elicited toxic effects on epithelial cells. Simultaneously, the attached crystals further damaged the injured Vero cells. Thus, crystal adhesion and aggregation were exacerbated. This study compared the different levels of nano-crystal adhesion with various degrees of injury in renal epithelial cells to reveal the different morbidity rates of kidney stones in healthy subjects and in patients suffering from renal trauma.
Acknowledgments
We thank Jinan University analytical and testing center for technical assistance. This work was supported by the National Natural Science Foundation of China (grant no 21371077).
Disclosure
The authors report no conflicts of interest in this work.
References
Finlayson B, Reid F. The expectation of free and fixed particles in urinary stone disease. Invest Urol. 1978;15(6):442–448. | ||
Asselman M, Verkoelen CF. Crystal-cell interaction in the pathogenesis of kidney stone disease. Curr Opin Urol. 2002;12(4):271–276. | ||
Thamilselvan V, Menon M, Thamilselvan S. Oxalate at physiological urine concentrations induces oxidative injury in renal epithelial cells: effect of alpha-tocopherol and ascorbic acid. BJU Int. 2014;114(1):140–150. | ||
Khan SR, Cockrell CA, Finlayson B, Hackett RL. Crystal retention by injured urothelium of the rat urinary bladder. J Urol. 1984;132(1):153–157. | ||
Gill WB, Ruggiero K, Straus FH 2nd. Crystallization studies in a urothelial-lined living test tube (the catheterized female rat bladder). I. Calcium oxalate crystal adhesion to the chemically injured rat bladder. Invest Urol. 1979;17(3):257–261. | ||
Wiessner JH, Hung LY, Mandel NS. Crystal attachment to injured renal collecting duct cells: influence of urine proteins and pH. Kidney Int. 2003;63(4):1313–1320. | ||
Farell G, Huang E, Kim SY, Horstkorte R, Lieske JC. Modulation of proliferating renal epithelial cell affinity for calcium oxalate monohydrate crystals. J Am Soc Nephrol. 2004;15(12):3052–3062. | ||
Thamilselvan S, Khan SR, Menon M. Oxalate and calcium oxalate mediated free radical toxicity in renal epithelial cells: effect of antioxidants. Urol Res. 2003;31(1):3–9. | ||
Khan SR. Crystal-induced inflammation of the kidneys: results from human studies, animal models, and tissue-culture studies. Clin Exp Nephrol. 2004;8(2):75–88. | ||
Jonassen JA, Cao LC, Honeyman T, Scheid CR. Intracellular events in the initiation of calcium oxalate stones. Nephron Exp Nephrol. 2004;98(2):e61–e64. | ||
Moe OW. Kidney stones: pathophysiology and medical management. Lancet. 2006;367(9507):333–344. | ||
Mandel NS, Mandel GS. Urinary tract stone disease in the United States veteran population. II. Geographical analysis of variations in composition. J Urol. 1989;142(6):1516–1521. | ||
Conti C, Casati M, Colombo C, Realini M, Brambilla L, Zerbi G. Phase transformation of calcium oxalate dihydrate–monohydrate: effects of relative humidity and new spectroscopic data. Spectrochim Acta A Mol Biomol Spectrosc. 2014;128:413–419. | ||
Guo CG, McMartin KE. The cytotoxicity of oxalate, metabolite of ethylene glycol, is due to calcium oxalate monohydrate formation. Toxicology. 2005;208(3):347–355. | ||
Shapur NK, Uvarov V, Popov I, et al. crystallite size-is it a new predictor for renal stone burden? Urology. 2012;80(5):980–985. | ||
He JY, Deng SP, Ouyang JM. Morphology, particle size distribution, aggregation, and crystal phase of nanocrystallites in the urine of healthy persons and lithogenic patients. IEEE Trans Nanobioscience. 2010;9(2):156–163. | ||
Khaskhali MH, Byer KJ, Khan SR. The effect of calcium on calcium oxalate monohydrate crystal-induced renal epithelial injury. Urol Res. 2009;37(1):1–6. | ||
Wang T, Thurgood LA, Grover PK, Ryall RL. A comparison of the binding of urinary calcium oxalate monohydrate and dihydrate crystals to human kidney cells in urine. BJU Int. 2010;106(11):1768–1774. | ||
Peng H, Ouyang JM, Yao XQ, Yang RE. Interaction between submicron COD crystals and renal epithelial cells. Int J Nanomed. 2012;7:4727–4737. | ||
Sun XY, Ouyang JM, Li YB, Wen XL. Mechanism of cytotoxicity of micron/nano calcium oxalate monohydrate and dihydrate crystals on renal epithelial cells. RSC Advances. 2015;5(56):45393–45406. | ||
Sun XY, Ouyang JM, Liu AJ, Ding YM, Gan QZ. Preparation, characterization, and in vitro cytotoxicity of COM and COD crystals with various sizes. Mater Sci Eng C Mater Biol Appl. 2015;57:147–156. | ||
Schepers MS, Duim RA, Asselman M, Romijn JC, Schröder FH, Verkoelen CF. Internalization of calcium oxalate crystals by renal tubular cells: a nephron segment-specific process? Kidney Int. 2003;64(2):493–500. | ||
Hovda KE, Guo C, Austin R, McMartin KE. Renal toxicity of ethylene glycol results from internalization of calcium oxalate crystals by proximal tubule cells. Toxicol Lett. 2010;192(3):365–372. | ||
Wang F, Liu Q, Wang W, Li X, Zhang J. A polysaccharide isolated from Cynomorium songaricum Rupr. protects PC12 cells against H2O2-induced injury. Int J Biol Macromol. 2016;87:222–228. | ||
Duan ZZ, Li YH, Li YY, et al. Danhong injection protects cardiomyocytes against hypoxia/reoxygenation- and H2O2-induced injury by inhibiting mitochondrial permeability transition pore opening. J Ethnopharmacol. 2015;175:617–625. | ||
Mulay SR, Kulkarni OP, Rupanagudi KV, et al. Calcium oxalate crystals induce renal inflammation by NLRP3-mediated IL-1β secretion. J Clin Invest. 2013;123(1):236–246. | ||
Tsujihata M, Miyake O, Yoshimura K, Kakimoto K, Takahara S, Okuyama A. Fibronectin as a potent inhibitor of calcium oxalate urolithiasis. J Urol. 2000;164(5):1718–1723. | ||
Sun XY, Ouyang JM, Zhu WY, Li YB, Gan QZ. Size-dependent toxicity and interactions of calcium oxalate dihydrate crystals on Vero renal epithelial cells. J Mater Chem B. 2015;3(9):1864–1878. | ||
Hezel M, Ebrahimi F, Koch M, Dehghani F. Propidium iodide staining: a new application in fluorescence microscopy for analysis of cytoarchitecture in adult and developing rodent brain. Micron. 2012;43(10):1031–1038. | ||
Li Y, Sun L, Jin M, et al. Size-dependent cytotoxicity of amorphous silica nanoparticles in human hepatoma HepG2 cells. Toxicol In Vitro. 2011;25(7):1343–1352. | ||
Kong WH, Park K, Lee MY, Lee H, Sung DK, Hahn SK. Cationic solid lipid nanoparticles derived from apolipoprotein-free LDLs for target specific systemic treatment of liver fibrosis. Biomaterials. 2013;34(2):542–551. | ||
Rotsch C, Radmacher M. Drug-induced changes of cytoskeletal structure and mechanics in fibroblasts: an atomic force microscopy study. Biophys J. 2000;78(1):520–535. | ||
Sanpui P, Chattopadhyay A, Ghosh SS. Induction of apoptosis in cancer cells at low silver nanoparticle concentrations using chitosan nanocarrier. ACS Appl Mater Interfaces. 2011;3(2):218–228. | ||
Salvioli S, Ardizzoni A, Franceschi C, Cossarizza A. JC-1, but not DiOC6(3) or rhodamine 123, is a reliable fluorescent probe to assess delta psi changes in intact cells: implications for studies on mitochondrial functionality during apoptosis. FEBS Lett. 1997;411(1):77–82. | ||
Hong SH, Lee HJ, Sohn EJ, et al. Anti-nephrolithic potential of resveratrol via inhibition of ROS, MCP-1, hyaluronan and osteopontin in vitro and in vivo. Pharmacol Rep. 2013;65(4):970–979. | ||
Fantone JC, Ward PA. Role of oxygen-derived free radicals and metabolites in leukocyte-dependent inflammatory reactions. Am J Pathol. 1982;107(3):395–418. | ||
Ouyang JM, Yao XQ, Tan J, Wang FX. Renal epithelial cell injury and its promoting role in formation of calcium oxalate monohydrate. J Biol Inorg Chem. 2011;16(3):405–416. | ||
Whittemore ER, Loo DT, Watt JA, Cotman CW. A detailed analysis of hydrogen peroxide-induced cell death in primary neuronal culture. Neuroscience. 1995;67(4):921–932. | ||
Menghini R. Genotoxicity of active oxygen species in mammalian cells. Mutat Res. 1988;195(3):215–230. | ||
Comporti M. Lipid peroxidation and cellular damage in toxic liver injury. Lab Invest. 1985;53(6):599–623. | ||
Burton KP, Morris AC, Massey KD, Buja LM, Hagler HK. Free radicals alter ionic calcium levels and membrane phospholipids in cultured rat ventricular myocytes. J Mol Cell Cardiol. 1990;22(9):1035–1047. | ||
Farr SB, Kogoma T. Oxidative stress responses in Escherichia coli and Salmonella typhimurium. Microbiol Rev. 1991;55(4):561–585. | ||
Khan SR. Hyperoxaluria-induced oxidative stress and antioxidants for renal protection. Urol Res. 2005;33(5):349–357. | ||
Wang B, Wu B, Liu J, et al. Analysis of altered microRNA expression profiles in proximal renal tubular cells in response to calcium oxalate monohydrate crystal adhesion: implications for kidney stone disease. PLoS One. 2014;9(7):e101306. | ||
Hackett RL, Shevock PN, Khan SR. Madin-Darby canine kidney cells are injured by exposure to oxalate and to calcium oxalate crystals. Urol Res. 1994;22(4):197–203. | ||
Thongboonkerd V, Semangoen T, Sinchaikul S, Chen ST. Proteomic analysis of calcium oxalate monohydrate crystal-induced cytotoxicity in distal renal tubular cells. J Proteome Res. 2008;7(11):4689–4700. | ||
Asselman M, Verhulst A, De Broe ME, Verkoelen CF. Calcium oxalate crystal adherence to hyaluronan-, osteopontin-, and CD44-expressing injured/regenerating tubular epithelial cells in rat kidneys. J Am Soc Nephrol. 2003;14(12):3155–3166. | ||
Schepers MS, van Ballegooijen ES, Bangma CH, Verkoelen CF. Oxalate is toxic to renal tubular cells only at supraphysiologic concentrations. Kidney Int. 2005;68(4):1660–1669. | ||
Schepers MS, van Ballegooijen ES, Bangma CH, Verkoelen CF. Crystals cause acute necrotic cell death in renal proximal tubule cells, but not in collecting tubule cells. Kidney Int. 2005;68(4):1543–1553. | ||
Nel A, Xia T, Madler L, Li N. Toxic potential of materials at the nanolevel. Science. 2006;311(5761):622–627. | ||
Verkoelen CF, van der Boom BG, Houtsmuller AB, Schroder FH, Romijn JC. Increased calcium oxalate monohydrate crystal binding to injured renal tubular epithelial cells in culture. Am J Physiol. 1998;274(5 Pt 2):F958–F965. | ||
Asselman M, Verhulst A, Van Ballegooijen ES, Bangma CH, Verkoelen CF, De Broe ME. Hyaluronan is apically secreted and expressed by proliferating or regenerating renal tubular cells. Kidney Int. 2005;68(1):71–83. | ||
Riese RJ, Mandel NS, Wiessner JH, Mandel GS, Becker CG, Kleinman JG. Cell polarity and calcium oxalate crystal adherence to cultured collecting duct cells. Am J Physiol. 1992;262(2 Pt 2):F177–F184. | ||
Sheng X, Ward MD, Wesson JA. Adhesion between molecules and calcium oxalate crystals: Critical interactions in kidney stone formation. J Am Chem Soc. 2003;125(10):2854–2855. | ||
Lieske JC, Toback FG, Deganello S. Face-selective adhesion of calcium oxalate dihydrate crystals to renal epithelial cells. Calcif Tissue Int. 1996;58(3):195–200. | ||
Lieske JC, Norris R, Swift H, Toback FG. Adhesion, internalization and metabolism of calcium oxalate monohydrate crystals by renal epithelial cells. Kidney Int. 1997;52(5):1291–1301. | ||
Peerapen P, Thongboonkerd V. Effects of calcium oxalate monohydrate crystals on expression and function of tight junction of renal tubular epithelial cells. Lab Invest. 2011;91(1):97–105. | ||
Bigelow MW, Wiessner JH, Kleinman JG, Mandel NS. Surface exposure of phosphatidylserine increases calcium oxalate crystal attachment to IMCD cells. Am J Physiol. 1997;272(1 Pt 2):F55–F62. | ||
Tunik L, Füredi-Milhofer H, Garti N. Adsorption of sodium diisooctyl sulfosuccinate onto calcium oxalate crystals. Langmuir. 1998;14(12):3351–3355. | ||
Mandel N. Crystal-membrane interaction in kidney stone disease. J Am Soc Nephrol. 1994;5(5 Suppl 1):S37–S45. | ||
Wesson JA, Worcester EM, Wiessner JH, Mandel NS, Kleinman JG. Control of calcium oxalate crystal structure and cell adherence by urinary macromolecules. Kidney Int. 1998;53(4):952–957. |
 © 2016 The Author(s). This work is published and licensed by Dove Medical Press Limited. The full terms of this license are available at https://www.dovepress.com/terms.php and incorporate the Creative Commons Attribution - Non Commercial (unported, v3.0) License.
By accessing the work you hereby accept the Terms. Non-commercial uses of the work are permitted without any further permission from Dove Medical Press Limited, provided the work is properly attributed. For permission for commercial use of this work, please see paragraphs 4.2 and 5 of our Terms.
© 2016 The Author(s). This work is published and licensed by Dove Medical Press Limited. The full terms of this license are available at https://www.dovepress.com/terms.php and incorporate the Creative Commons Attribution - Non Commercial (unported, v3.0) License.
By accessing the work you hereby accept the Terms. Non-commercial uses of the work are permitted without any further permission from Dove Medical Press Limited, provided the work is properly attributed. For permission for commercial use of this work, please see paragraphs 4.2 and 5 of our Terms.