")
Back to Journals » International Journal of Nephrology and Renovascular Disease » Volume 9
Regulation of platelet count by erythropoiesis-stimulating agents – iron axis in hemodialysis patients
Authors Koike K, Fukami K, Kawaguchi A, Shimamatsu K , Yamagishi S, Okuda S
Received 13 October 2015
Accepted for publication 3 December 2015
Published 31 March 2016 Volume 2016:9 Pages 73—80
DOI https://doi.org/10.2147/IJNRD.S98196
Checked for plagiarism Yes
Review by Single anonymous peer review
Peer reviewer comments 2
Editor who approved publication: Professor Pravin Singhal
Kiyomi Koike,1,2 Kei Fukami,1 Atsushi Kawaguchi,2 Kazumasa Shimamatsu,3 Sho-ichi Yamagishi,4 Seiya Okuda1
1Division of Nephrology, Department of Medicine, Kurume University School of Medicine, Kurume, 2The Biostatistics Center, Kurume University, Kurume, 3Shimamatsu Naika Iin (Clinic), Shiseikai Medical Corporation, Chikushino, 4Department of Pathophysiology and Therapeutics of Diabetic Vascular Complications, Kurume University School of Medicine, Kurume, Fukuoka, Japan
Abstract: Higher doses of erythropoiesis-stimulating agents (ESAs) contribute to atherothrombotic cardiovascular disease in hemodialysis (HD) patients. Thrombocytosis is associated with increased mortality in ESA-treated HD patients. We investigated variables affecting platelet count and its variability (platelet count increment [Δplatelet count]) in HD patients. This retrospective longitudinal and observational study of HD outpatients was carried out over 3 years. The outcome was independent determinants of platelet count and platelet count, which were associated with iron indices, ESA dose, and C-reactive protein. In univariate regression analysis, V-shaped relationship was observed between platelet count and transferrin saturation (TSAT), ferritin, serum iron, and hemoglobin (Hb) with the bottom of 0.21, 330 ng/mL, 49 µg/dL, and 10.3 g/dL, respectively. Mixed-effect multivariate regression analysis revealed that TSAT (inversely), Hb ≤10.3 g/dL (inversely), C-reactive protein, and ESA dose were independently associated with platelet count. Δplatelet count was independently and inversely correlated with ΔTSAT and directly correlated with Δferritin. TSAT was independently and inversely associated with ESA dose. ESA dose was directly correlated with iron dose and inversely correlated with TSAT, ferritin ≤330 ng/mL, and Hb ≤10.3 g/dL. ESA dose and TSAT were correlated in determining platelet count and Δplatelet count. Targets of iron indices that reflect iron supply sufficient to avoid platelet count increment and variability may be >21% of TSAT and 300 ng/mL of serum ferritin for appropriate ESA therapy in HD patients.
Keywords: hemodialysis, platelet count, erythropoiesis-stimulating agents, iron deficiency
Introduction
Increased inflammation, decreased life span of red blood cells, anemia of chronic disease, and others are important causes of anemia in chronic kidney disease (CKD). In particular, iron-deficiency anemia is the most common type of anemia in patients with end-stage renal disease who undergo hemodialysis (HD); it can be caused by blood loss during dialysis, restriction of iron-containing foods, or malnutrition.1 Therefore, combining iron supplementation with erythropoiesis-stimulating agents (ESAs) is necessary to prevent iron-deficiency anemia in these patients.2
The current guidelines published by Kidney Disease: Improving Global Outcomes (KDIGO) recommend target hemoglobin (Hb) levels of 10–11.5 g/dL for anemic HD patients because high Hb levels are associated with increased risk of cardiovascular disease (CVD) in end-stage renal disease patients.3,4 However, irrespective of Hb levels, a higher dose of ESA treatment itself can increase the risk of cardiovascular events in this population.5,6 Indeed, a retrospective cohort study suggested that higher ESA doses were associated with increased risk of relative iron depletion, relative thrombocytosis, and increased all-cause mortality in 40,787 long-term HD patients.7 Even in the general population, iron-deficiency anemia and subsequent thrombocytosis are correlated with thrombotic events such as stroke.8,9 Furthermore, exogenous administration of ESA increased platelet reactivity and platelet count in both healthy volunteers and patients with liver cirrhosis.10–12 In addition, since most of the HD patients are resistant to ESA therapy due to iron deficiency, inflammation, and systemic illnesses (which are also major confounders to CVD risk), they frequently receive a higher dose of ESA therapy.13,14 These findings suggest that ESA-induced thrombocytosis may play a role in the development and progression of CVD in HD subjects with iron-deficiency anemia. However, it is still unclear which clinical factors, including markers of iron status, ESA dose, and inflammatory variables, affect platelet count and its variability (platelet count increment [Δplatelet count]).
Therefore, we investigated clinical factors affecting platelet count and Δplatelet count in HD subjects.
Patients and methods
Patients
We conducted a retrospective longitudinal and observational study from 2002 to 2005 at our clinic in Fukuoka, Japan. All the patients in the clinic were enrolled in this study with a consideration for selection bias. Outpatients who were receiving maintenance HD (n=117; mean age, 61.0±14.3 years old; median duration of HD, 4.5 [0.7–8.8] years) underwent a complete history taking, physical examination, and blood chemistry examination, including platelet count, Hb, transferrin saturation (TSAT), ferritin, and C-reactive protein (CRP). All patients were dialyzed for 5 hours with high-flux dialyzers three times a week.
Informed consent was obtained from all human subjects. The study protocol was approved by the Institutional Ethics Committees of Kurume University School of Medicine, Kurume, Fukuoka, Japan, and the work was conducted in accordance with the Declaration of Helsinki. This trial was registered with the University Hospital Medical Information Network Center’s clinical trials database (UMIN 000012572; https://upload.umin.ac.jp/cgi-open-bin/ctr/regist).
Study design
Baseline clinical information, medical history, comorbid conditions,15 hospitalization events, and doses of monthly intravenous iron and weekly ESAs were collected from medical records. Blood samples were drawn from the arteriovenous fistula before each patient’s second dialysis session of the week. Complete blood counts were obtained every 2 weeks, and blood chemistry parameters such as serum albumin and CRP levels were measured monthly. Markers of iron status, including serum iron, serum ferritin (radioimmunoassay), and TSAT (serum iron concentration/total iron-binding capacity) levels, were evaluated quarterly as described previously.16 Hb and ferritin levels were maintained by the administration of ESA and iron (target Hb and ferritin levels, 11.0 g/dL and 100–200 ng/mL, respectively). ESAs (epoetin beta; Epogen®; Chugai Pharmaceutical Co, Ltd, Tokyo, Japan) were administered intravenously at the end of the HD session. Iron (40 mg; chondroitin sulfate iron colloid; Blutal®; Chugai Pharmaceutical Co, Ltd) was injected once a week when serum ferritin levels were ≤100 ng/mL. Once serum ferritin levels were >100 ng/mL, iron was administered intravenously twice a month and adjusted quarterly according to serum ferritin levels. When serum ferritin values exceeded 300 ng/mL, the frequency of iron administration was reduced. When serum ferritin values reached 500 ng/mL, iron supplementation was discontinued.17 TSAT was used as a reference of iron status. This protocol of iron supplementation had been tightly controlled during the observational period by a physician. All blood chemistry parameters were measured at a single laboratory (CRC Co, Ltd, Fukuoka, Japan), and the laboratory data were obtained directly from there by a researcher.16 Patients who had undergone HD for longer than a year were included in this study. Patients who made excursions for >4 months were excluded. The variability of platelet count, TSAT, ferritin, and Hb (Δplatelet count, ΔTSAT, Δferritin, and ΔHb, respectively) was assessed according to the changes every 3 months (Figure 1). For example, data were collected at the time (reference time; t0) and next 3 months (t1). Variability of the data (Δplatelet count, ΔTSAT, Δferritin, and ΔHb) were calculated by the changes of every 3 months, [data at (tn+1) − data at (tn)].
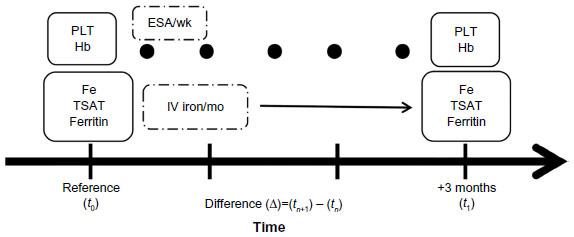 | Figure 1 Variability between PLT and iron indices. |
Physician, researcher, and statistician were completely independent of each other to eliminate the information bias in this study.
Statistical methods
Baseline data were expressed as mean ± standard deviation or median plus range (25th to 75th percentile). Statistical significance was accepted at P<0.05. The results were described using parameter estimates (beta value), 95% confidence intervals (CIs), and P-values. Statistical analyses were performed using SAS software version 9.2 (SAS Institute Inc., Cary, NC, USA) by a statistician. We used a mixed-effect model with a first-order autoregressive correlation matrix with residual error to analyze the relationship between platelet count and TSAT, serum iron, and serum ferritin, adjusting for time, age, and sex. The number and location of inflection points (knots) were objectively determined using the minimum Akaike’s information criterion among their prespecified candidates, which were the 25th, 50th, and 75th percentiles of TSAT, serum iron, and serum ferritin. We allowed the intercept and slope for TSAT, serum iron, and serum ferritin to vary in higher and lower values than the inflection points. In univariate and multiple regression analyses, nonlinearities in TSAT, serum ferritin, serum iron, and Hb were accommodated by introducing a linear spline model that has inflection points.18 In multivariate regression analysis, we used a nonlinear spline model when there was a significant correlation with different effects for values higher and lower than the inflection points, while a linear spline model was used when there was no significant correlation.
Results
Participants and demographic data at baseline
One hundred seventeen outpatients (79 males and 38 females; mean age 61.0±14.3 years) receiving maintenance HD were observed for 5.0±2.9 years. Demographic data of the patients at baseline are listed in Table 1. At baseline, the mean platelet count was 191±54×109/L, Hb 10.8±1.0 g/dL, serum iron 66.8±26.8 μg/dL, TSAT 0.26±0.11, serum ferritin 245±185 ng/mL, serum albumin 3.83±0.38 g/dL, CRP 0.10 (0.10–0.30) mg/dL, ESA dose 3,000 (2,250–6,000) units/week, and intravenous iron dose 80 (20–80) mg/month. None of the patients had vascular access by the catheter.
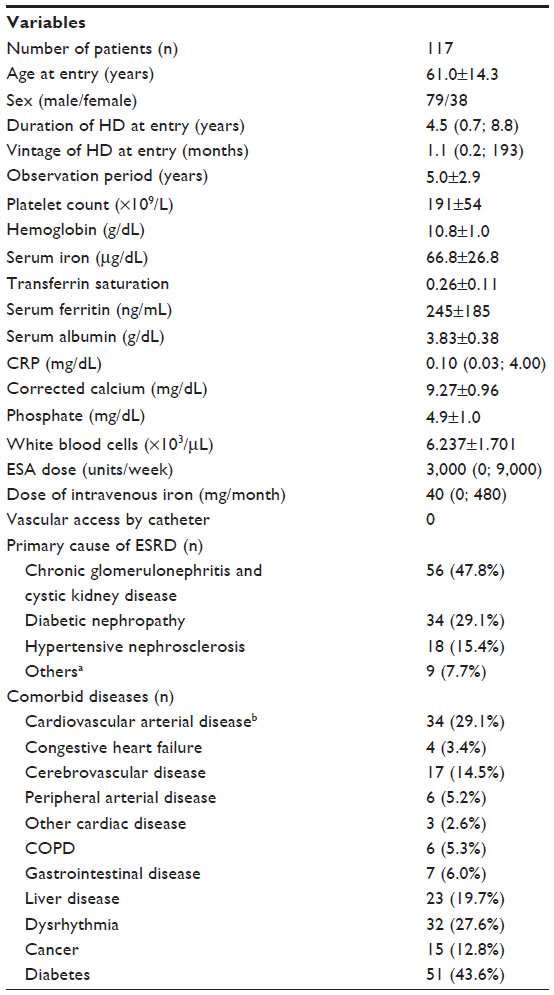 | Table 1 Demographic data at baseline |
During the observational period, three patients died and six patients were transferred to other clinics. There were 69 incidents of vascular occlusions, 14 from acute coronary syndrome, nine from cerebral infarction, one from peripheral arterial occlusion, one from retinal vein occlusion, and the rest from vascular access occlusion for maintenance HD.
Correlates of platelet count and other clinical variables
The overall cross-sectional laboratory data were plotted (~2,000 points) with the platelet count on the y-axis and TSAT, ferritin, serum iron, and Hb on the x-axis (Figure 2A–D). In univariate regression analysis, V-shaped relationship was observed between platelet count and TSAT, ferritin, serum iron, and Hb with the bottom of 0.21, 330 ng/mL, 49 μg/dL, and 10.3 g/dL, respectively. The values of 0.21 for TSAT, 49 μg/dL for serum iron, and 10.3 g/dL for Hb were at the 25th percentile and 330 ng/mL for serum ferritin was at the 75th percentile (Figure 2).
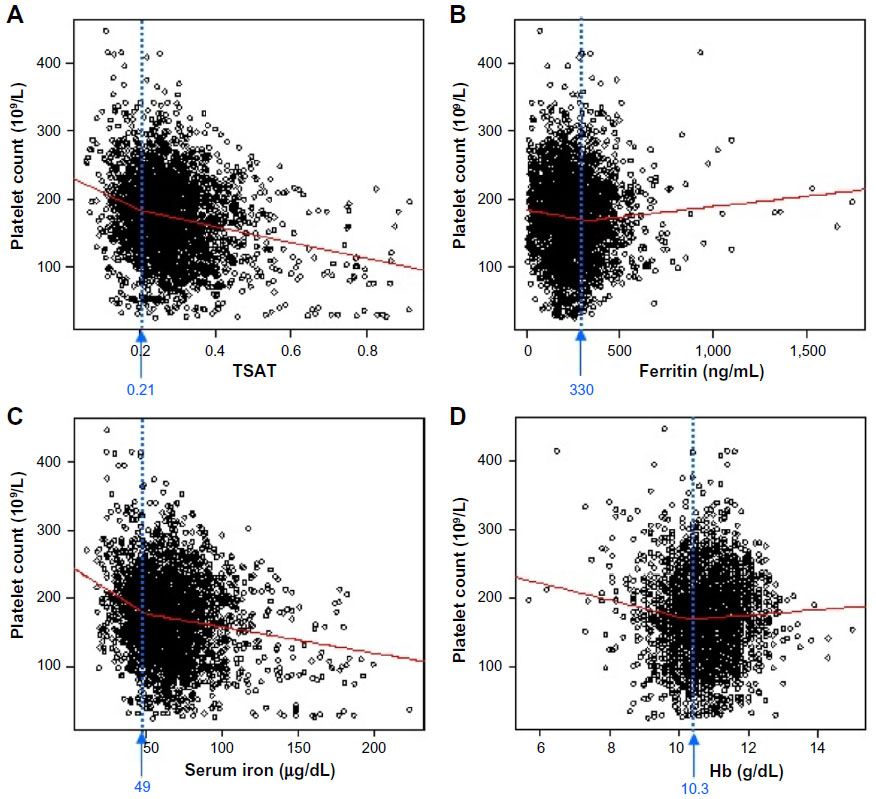 | Figure 2 Scatter plots of platelet count versus indices of iron and anemia in whole data sets. |
Time-adjusted univariate regression analysis was performed to examine the correlation between platelet count and other variables such as age and sex. Platelet count was significantly associated with TSAT ≤0.21 (CI −17.455, −7.937, P<0.001), TSAT >0.21 (CI −6.031, −3.531, P<0.001), serum iron ≤49 μg/dL (CI −0.081, −0.040, P<0.001), serum iron >49 μg/dL (CI −0.024, −0.013, P<0.001), ferritin >330 ng/mL (CI 0.001, 0.004, P<0.001), Hb ≤10.3 g/dL (CI −1.097, −0.550, P<0.001), CRP (CI 0.483, 0.667, P<0.001), ESA dose (CI 0.0002, 0.0003, P<0.001), and dose of iron (CI 0.002, 0.008, P<0.005). There were significant differences in the estimated slopes between TSAT ≤0.21 and TSAT >0.21 (7.9, P<0.01), serum iron ≤49 g/dL and serum iron >49 g/dL (0.042, P=0.01), ferritin ≤330 ng/mL and ferritin >330 ng/mL (0.004, P<0.01), and Hb ≤10.3 g/dL and Hb >10.3 g/dL (0.78, P<0.001).
Next, a binary choice was performed for TSAT rather than for serum iron by statistical comparisons in multivariate regression analysis. TSAT (CI −4.844, −1.705, P<0.001), Hb ≤10.3 g/dL (CI −1.002, −0.296, P<0.001), ferritin ≤330 ng/mL (CI −0.005, −0.001, P<0.05), ferritin >330 ng/mL (CI 0.001, 0.004, P<0.01), CRP (CI 0.23, 0.48, P<0.001), and ESA dose (CI 0.034, 0.224, P<0.01) were independent determinants of platelet count (Table 2).
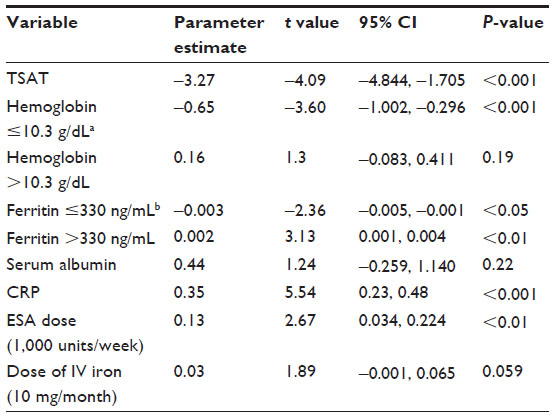 | Table 2 Mixed-effect multivariate analysis for the correlates of platelet count |
Independent correlation between Δplatelet count and Δiron indices
Multivariate regression analysis showed that Δplatelet count was independently associated with ΔTSAT (CI −4.92, −1.75, P<0.001) and Δferritin (CI 0.0007, 0.0037, P<0.005) after adjustment for CRP, ESA dose, and iron dose. There was no correlation between Δplatelet count and ESA dose (CI −0.04, 0.06, P=0.690; Table 3).
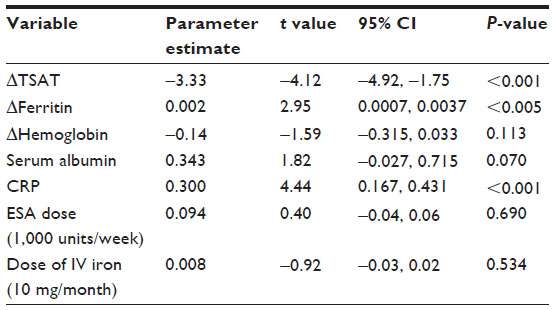 | Table 3 Mixed-effect multivariate regression analysis for the determinants of Δplatelet count (trend and variability) |
Independent correlation between TSAT and ESA dose
TSAT was independently associated with Hb (CI 0.0047, 0.0162, P<0.001), CRP (CI −0.0170, −0.0086, P<0.001), ferritin (CI 0.00020, 0.00027, P<0.001), and ESA dose (CI −0.0160, −0.0103, P<0.001; Table 4).
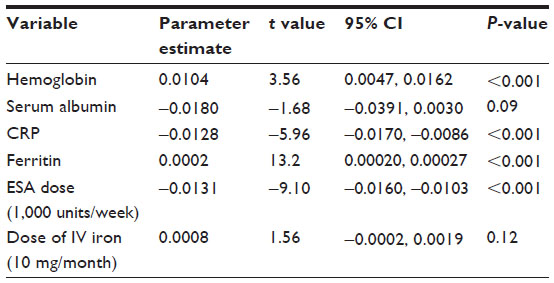 | Table 4 Mixed-effect multivariate regression analysis for the correlates of TSAT |
ESA dose was significantly and independently associated with TSAT ≤0.21 (CI −17,394, −9,994, P<0.001), TSAT >0.21 (CI −3,895, −2,077, P<0.001), ferritin ≤330 ng/mL (CI −4.83, −2.19, P<0.001), Hb ≤10.3 g/dL (CI −783.6, −403.7, P<0.001), CRP (CI −167, −30.6, P<0.005), and iron dose (CI 42.6, 79.6, P<0.001) after adjustment for age, sex, and time (Table 5).
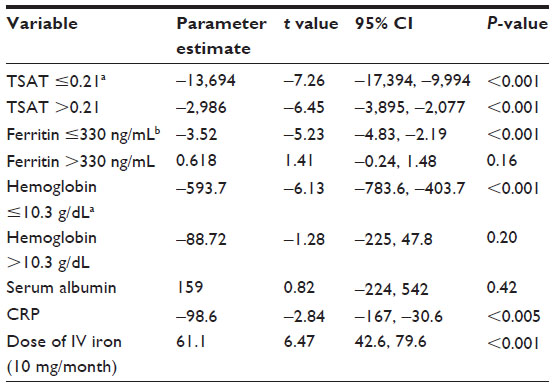 | Table 5 Mixed-effect multivariate regression analysis for the correlates of erythropoiesis-stimulating agent dose |
Discussion
In this study, we found for the first time that 1) platelet count was independently and inversely determined by TSAT, Hb ≤10.3 g/dL, and ferritin ≤330 ng/mL and independently and directly determined by ferritin >330 ng/mL, CRP, and ESA dose; 2) Δplatelet count was independently and inversely correlated with ΔTSAT and directly correlated with Δferritin and CRP values; 3) CRP and ESA dose were independently and inversely associated with TSAT, while Hb and ferritin were directly associated with TST; and 4) TSAT, ferritin ≤330 ng/mL, Hb ≤10.3 g/dL, and CRP were inversely and independently correlated with ESA dose, while it was directly associated with iron dose in mixed-effect multivariate regression analysis.
Treatment with a higher ESA dose has recently been associated with a poor clinical outcome in HD patients, irrespective of Hb levels.5,6,19 However, precise mechanisms underlying the association between higher ESA dose and cardiovascular events have not been elucidated. In our study, ESA dose was an independent correlate of platelet count in iron-supplemented HD patients with mild anemia. As the association of ESA dose with platelet count was independent of Hb levels, a high ESA dose might be directly involved in the observed platelet count increase (Figure 3). Indeed, thrombopoietin levels are significantly higher in HD patients receiving ESAs, which could stimulate megakaryopoiesis and subsequently increase the platelet count.20
 | Figure 3 Scheme of the relationships among iron deficiency, ESA dose, and platelet count. |
In this study, TSAT was inversely and independently associated with the platelet count. Several studies have suggested a link between iron deficiency and thrombocytosis in non-CKD patients.9,21,22 Furthermore, ESA dose was one of the independent determinants of TSAT, and vice versa.23 Also, ESA-associated venous thromboembolism could be caused by iron-restricted erythropoiesis and would be countered by iron supplementation in non-CKD patients.24 As higher ESA dose is associated with iron deficiency, thrombocytosis, and increased all-cause mortality in long-term HD patients,7 our present findings suggest that higher ESA dose and iron deficiency are correlated with each other in HD patients. This therefore may influence the development and progression of CVD, partly via the increase in the platelet count (Figure 3). Hence, appropriate ESA therapy with sufficient iron supplementation may reduce cardiovascular events in HD patients. It might be valuable to analyze the association between ESA dose, anemia, and thrombocytosis and CVD events or thrombotic events and see whether CVD events or thrombotic events correlated independently with thrombocytosis. However, we could not find the significant correlation of thrombotic or CVD events and ESA dose, anemia, and platelet count in our subjects (data not shown). A small number of subjects may influence the analysis in this study.
TSAT (functional iron) declining (ΔTSAT) was independently associated with Δplatelet count, regardless of ESA dose in longitudinal analysis. These findings suggest that ESA treatment might be indirectly associated with platelet count variability via the inflammation-induced iron depletion. Short-term variability of platelet count might be more influenced by inflammation than ESA dose. Inflammation diverts iron from erythropoiesis to storage sites within the reticuloendothelial system in a short time period, which could lead to functional iron deficiency and subsequently progress the ESA-resistant anemia.25 It might be a possible reason why ΔTSAT (inversely) and Δferritin, but not ESA dose, were associated with Δplatelet count.
In the present study, CRP was strongly associated with platelet count and Δplatelet count and inversely associated with TSAT and ESA dose. Inflammatory cytokines produce thrombopoietic factors, while proinflammatory cytokines such as interleukin-6 and interleukin-11 induce megakaryocyte maturation.26 Thus, inflammation status may increase the platelet count in HD patients independent of iron deficiency.
TSAT and ferritin are the commonly used biomarkers for the diagnosis and treatment of iron-deficiency anemia in HD patients.3,27 Although TSAT was inversely associated with platelet count, the relationship between ferritin and platelet count differed depending on ferritin levels; ferritin ≤330 ng/mL was inversely correlated with platelet count, whereas ferritin >330 ng/mL was positively associated with platelet count. Ferritin levels are affected by noniron-related factors such as inflammation, malnutrition, and malignancy, as well as stored iron.28 Therefore, other factors, besides iron status and inflammation, as reflected by CRP could influence ferritin levels and might have affected the relationship of ferritin with platelet count in our subjects. Furthermore, with regard to fluctuation of iron indices, there was a significant inverse correlation between ΔTSAT and Δplatelet count, which was independent of Δferritin, ΔHb, CRP, ESA dose, and iron dose. These observations suggest that compared with ferritin, TSAT as a functional iron might more accurately reflect the platelet count in HD subjects.
Recommendations for iron supplementation during dialysis differ between societies. The Kidney Disease Outcomes Quality Initiative (KDOQI, 2006) recommended that ferritin and TSAT levels should be maintained at >200 ng/mL and 0.2, respectively,3 while KDIGO (2012) stated that iron supplementation for HD patients should be started when ferritin and TSAT levels are <500 ng/mL and <0.3, respectively. Our iron supplementation protocol meets the recommendations of both the KDOQI (2006) and KDIGO (2012).16,17 In contrast, the Japanese Society for Dialysis Therapy (JSDT, 2008) suggested that iron should be given when ferritin and TSAT levels are <100 ng/mL and <0.2, respectively, under ESA therapy.27 The Japan Dialysis Outcomes and Practice Patterns Study (2007) suggested that the mean ferritin and TSAT levels were ~220 ng/mL and ~0.27, respectively, in 1,622 Japanese HD patients.29 The ESA dose in our study was lower than that of the JSDT, and iron depletion, TSAT <0.21, and ferritin ≤330 ng/mL led to an increase in platelet count in HD patients. This indicates that actual targets of iron indices that reflect sufficient iron supply required so as not to increase platelet count may be >21% of TSAT with ~300 ng/mL of serum ferritin. Our result would support iron supplementation as in KDIGO guidelines to prevent the progression of CVD from the viewpoint of platelet count in iron-deficient anemic HD subjects receiving ESA therapy.
There were several limitations in this study. First, the present study was an observational one with a relatively small sample size and was therefore not designed to elucidate the causal relationships among iron status, ESA dose, inflammation, and platelet count. Furthermore, this study was not strong enough to support a recommendation about new cutoffs. Second, we did not investigate the relationship between CVD events and the investigated parameters. Third, we did not assess the platelet function and unmeasured parameters of ESA resistance in this study. Fourth, indication bias was not completely excluded in this study. Further randomized, prospective, controlled trials, as well as detailed mechanistic studies are required to clarify the link among these variables.
Conclusion
ESA dose and TSAT were correlated with each other and associated with platelet count and its variability in HD patients. Actual targets of iron indices that reflect the sufficient iron supply required so as not to increase platelet count may be >21% of TSAT with ~300 ng/mL of serum ferritin. Appropriate ESA therapy with sufficient iron supplementation may reduce the risk of CVD in HD patients.
Acknowledgment
This work was presented in part at the European Renal Association – European Dialysis and Transplant Association, Istanbul, May 18–21, 2013. This work was not supported by any grant and foundation.
Disclosure
The authors report no conflicts of interest in this work.
References
Nissenson AR, Strobos J. Iron deficiency in patients with renal failure. Kidney Int Suppl. 1999;69:S18–S21. | |
Fishbane S. Erythropoiesis-stimulating agent treatment with full anemia correction: a new perspective. Kidney Int. 2009;75(4):358–365. | |
Clinical II. Practice guidelines and clinical practice recommendations for anemia in chronic kidney disease in adults. Am J Kidney Dis. 2006; 47(5 Suppl 3):S16–S85. | |
Group KDIGOKAW. KDIGO clinical practice guideline for anemia in chronic kidney. Kidney Int Suppl. 2012;2(Suppl 3):S279–S335. (Disease Chapter 2: Use of iron to treat anemia in CKD). | |
Fukuma S, Yamaguchi T, Hashimoto S, et al. Erythropoiesis-stimulating agent responsiveness and mortality in hemodialysis patients: results from a cohort study from the dialysis registry in Japan. Am J Kidney Dis. 2012;59(1):108–116. | |
Koulouridis I, Alfayez M, Trikalinos TA, et al. Dose of erythropoiesis-stimulating agents and adverse outcomes in CKD: a metaregression analysis. Am J Kidney Dis. 2013;61(1):44–56. | |
Streja E, Kovesdy CP, Greenland S, et al. Erythropoietin, iron depletion, and relative thrombocytosis: a possible explanation for hemoglobin-survival paradox in hemodialysis. Am J Kidney Dis. 2008;52(4):727–736. | |
Akins PT, Glenn S, Nemeth PM, et al. Carotid artery thrombus associated with severe iron-deficiency anemia and thrombocytosis. Stroke. 1996;27(5):1002–1005. | |
Azab SF, Abdelsalam SM, Saleh SH, et al. Iron deficiency anemia as a risk factor for cerebrovascular events in early childhood: a case-control study. Ann Hematol. 2014;93(4):571–576. | |
Smith KJ, Bleyer AJ, Little WC, et al. The cardiovascular effects of erythropoietin. Cardiovasc Res. 2003;59(3):538–548. | |
Stohlawetz PJ, Dzirlo L, Hergovich N, et al. Effects of erythropoietin on platelet reactivity and thrombopoiesis in humans. Blood. 2000;95(9):2983–2989. | |
Homoncik M, Jilma-Stohlawetz P, Schmid M, et al. Erythropoietin increases platelet reactivity and platelet counts in patients with alcoholic liver cirrhosis: a randomized, double-blind, placebo-controlled study. Aliment Pharmacol Ther. 2004;20(4):437–443. | |
Drueke TB, Parfrey PS. Summary of the KDIGO guideline on anemia and comment: reading between the (guide)line(s). Kidney Int. 2012;82(9):952–960. | |
Stancu S, Bârsan L, Stanciu A, et al. Can the response to iron therapy be predicted in anemic nondialysis patients with chronic kidney disease? Clin J Am Soc Nephrol. 2010;5(3):409–416. | |
Liu J, Huang Z, Gilbertson DT, et al. An improved comorbidity index for outcome analyses among dialysis patients. Kidney Int. 2010;77(2):141–151. | |
Shimamatsu K, Inamasu H. A safe and easy introduction of darbepoetin-alpha in patients receiving maintenance hemodialysis and epoetin monotherapy: a “half-and-half” combination therapy. Curr Ther Res Clin Exp. 2013;74:5–8. | |
Shimamatsu K. Experience with iv iron chondroitin-sulphate colloid in Japanese haemodialysis patients. Nephrol Dial Transplant. 1998;13(4):1053. | |
Tonan T, Fujimoto K, Qayyum A, et al. Quantification of hepatic iron concentration in chronic viral hepatitis: usefulness of T2-weighted single-shot spin-echo echo-planar MR imaging. PLoS One. 2012;7(3):e33868. | |
Pfeffer MA, Burdmann EA, Chen CY, et al. A trial of darbepoetin alfa in type 2 diabetes and chronic kidney disease. N Engl J Med. 2009;361(21):2019–2032. | |
Asanuma M, Seino K, Mizuno T, et al. Plasma thrombopoietin level and platelet indices in hemodialysis patients receiving recombinant human erythropoietin. Int J Lab Hematol. 2010;32(3):312–319. | |
Park MJ, Park PW, Seo YH, et al. The relationship between iron parameters and platelet parameters in women with iron deficiency anemia and thrombocytosis. Platelets. 2013;24(5):348–351. | |
Iqbal T, Stein J, Sharma N, et al. Clinical significance of C-reactive protein levels in predicting responsiveness to iron therapy in patients with inflammatory bowel disease and iron deficiency anemia. Dig Dis Sci. 2015;60(5):1375–1381. | |
Hamano T, Fujii N, Hayashi T, et al. Thresholds of iron markers for iron deficiency erythropoiesis-finding of the Japanese nationwide dialysis registry. Kidney Int Suppl (2011). 2015;5(1):23–32. | |
Henry DH, Dahl NV, Auerbach MA. Thrombocytosis and venous thromboembolism in cancer patients with chemotherapy induced anemia may be related to ESA induced iron restricted erythropoiesis and reversed by administration of IV iron. Am J Hematol. 2012;87(3):308–310. | |
Balla J, Jeney V, Varga Z, et al. Iron homeostasis in chronic inflammation. Acta Physiol Hung. 2007;94(1–2):95–106. | |
Debili N, Massé JM, Katz A, et al. Effects of the recombinant hematopoietic growth factors interleukin-3, interleukin-6, stem cell factor, and leukemia inhibitory factor on the megakaryocytic differentiation of CD34+ cells. Blood. 1993;82(1):84–95. | |
Tsubakihara Y, Nishi S, Akiba T, et al. 2008 Japanese society for dialysis therapy: guidelines for renal anemia in chronic kidney disease. Ther Apher Dial. 2010;14(3):240–275. | |
Kalantar-Zadeh K, Lee GH. The fascinating but deceptive ferritin: to measure it or not to measure it in chronic kidney disease? Clin J Am Soc Nephrol. 2006;1(Suppl 1):S9–S18. | |
Hasegawa T, Bragg-Gresham JL, Pisoni RL, et al. Changes in anemia management and hemoglobin levels following revision of a bundling policy to incorporate recombinant human erythropoietin. Kidney Int. 2011;79(3):340–346. |
 © 2016 The Author(s). This work is published and licensed by Dove Medical Press Limited. The full terms of this license are available at https://www.dovepress.com/terms.php and incorporate the Creative Commons Attribution - Non Commercial (unported, v3.0) License.
By accessing the work you hereby accept the Terms. Non-commercial uses of the work are permitted without any further permission from Dove Medical Press Limited, provided the work is properly attributed. For permission for commercial use of this work, please see paragraphs 4.2 and 5 of our Terms.
© 2016 The Author(s). This work is published and licensed by Dove Medical Press Limited. The full terms of this license are available at https://www.dovepress.com/terms.php and incorporate the Creative Commons Attribution - Non Commercial (unported, v3.0) License.
By accessing the work you hereby accept the Terms. Non-commercial uses of the work are permitted without any further permission from Dove Medical Press Limited, provided the work is properly attributed. For permission for commercial use of this work, please see paragraphs 4.2 and 5 of our Terms.