")
Back to Journals » Diabetes, Metabolic Syndrome and Obesity » Volume 7
Regulation of dipeptidyl peptidase 4 production in adipocytes by glucose
Authors Das S, Hayashi H, Sato T, Yamada R, Hiratsuka M, Hirasawa N
Received 17 February 2014
Accepted for publication 24 March 2014
Published 24 May 2014 Volume 2014:7 Pages 185—194
DOI https://doi.org/10.2147/DMSO.S62610
Checked for plagiarism Yes
Review by Single anonymous peer review
Peer reviewer comments 3
Siddhartha Shankar Das, Hiroto Hayashi, Taiki Sato, Ren Yamada, Masahiro Hiratsuka, Noriyasu Hirasawa
Laboratory of Pharmacotherapy of Life-Style Related Diseases, Graduate School of Pharmaceutical Sciences, Tohoku University, Sendai, Miyagi, Japan
Objective: Type 1 and 2 diabetes are characterized by elevated blood glucose levels and increased dipeptidyl peptidase 4 (DPP4) activity levels in the serum. However, previous studies reported a negative correlation between glucose concentrations and DPP4 levels. The purpose of this study was to elucidate the connection between glucose and DPP4 in adipocytes under physiological and diabetic conditions, because DPP4 is an adipokine.
Methods: Blood glucose and serum DPP4 levels were measured, and adipocytes were collected from mice under normal, high-fat diet fed, and diabetic conditions. The adipocytes obtained were incubated for 24 hours in medium containing 5.5 or 25 mM glucose, and 3T3-L1 preadipocytes were differentiated under 5.5 or 25 mM glucose. Adipocytes from mice and 3T3-L1 were stimulated by tumor necrosis factor-α (TNF-α) for 24 hours. The levels of released and intracellular DPP4 were determined by enzyme-linked immunosorbent assay.
Results: Mice fed high-fat diet had lower serum DPP4 levels in the first and second week than controls. However, this difference gradually disappeared over 6 weeks. The differentiation of 3T3-L1 adipocytes under 25 mM glucose produced lower DPP4 levels than those differentiated under 5.5 mM; this was also observed in isolated adipocytes from mice. However, these effects of glucose were lost in adipocytes from diabetic mice, and an increase in total DPP4 levels was observed. The stimulation of adipocytes with TNF-α increased the release of DPP4 irrespective of glucose concentration.
Conclusion: The production of DPP4 in adipocytes was negatively regulated by 25 mM glucose under physiological conditions, but not in diabetic mice. Our results suggest that the observed increase in serum DPP4 levels may be attributed to increased production of DPP4 in adipocytes and an enhancement in TNF-α-induced release.
Keywords: DPP4, 3T3-L1, diabetes, TNF-α
Introduction
Dipeptidyl peptidase 4 (DPP4) exists as an intracellular, surface-expressed, and serum-soluble form.1,2 It inactivates the insulinotropic activity of glucagon-like peptide-1 (GLP-1) and gastric inhibitory polypeptide soon after its secretion.3,4 Tumor necrosis factor-α (TNF-α), interferons, retinoic acid, high insulin levels, glucose, and hypoxia are some of the factors that influence the production and release of DPP4; however, the mechanisms of action involved remain unknown.5–8 DPP4 activity levels in the serum have been shown to increase under conditions such as nonalcoholic fatty liver disease, rheumatoid arthritis, and inflammatory bowel disease.9
Previous studies have reported elevated serum DPP4 activity levels in patients and mice with type 1 and type 2 diabetes.9–12 Glucose and serum DPP4 activities are known to be elevated in both type of diabetes; therefore, we hypothesized that a relationship may exist between glucose levels and the production of DPP4. A previous study on intestinal cell lines revealed a negative correlation between glucose concentrations and DPP4.7 Therefore, the increase observed in serum DPP4 levels in type 1 and type 2 diabetes cannot not be explained solely by intestinal cell-derived DPP4. Serum DPP4 levels were also shown to be increased under certain metabolic syndromes such as obesity, and impaired glucose tolerance and adipocyte size were positively correlated with these conditions. Recent studies have shown that DPP4 is an adipokine produced by adipocytes and acts in autocrine and paracrine manners to cause insulin resistance.5 However, the connection between glucose and DPP4 has not yet been clarified. In the present study, we examined the effects of glucose on the production and release of DPP4 in adipocytes under physiological and diabetic conditions.
Materials and methods
Animals and the experimental model
Eight-week-old male C57BL/6 mice were obtained from SLC (Shizuoka, Japan) and housed in standard polyacrylamide cages in a SPF animal house maintained at 22°C±2°C with a 12-hour light/dark cycle. All animal-related ethics were followed and were approved by the Tohoku University Animal Ethics Committee. Mice were administered 150 mg/kg streptozotocin (Sigma-Aldrich Co, St Louis, MO, USA) to induce type 1 diabetes. Blood glucose levels were determined at 0, 2, and 7 days, and diabetic mice were sacrificed to obtain adipose tissue, the pancreas, kidney, liver, spleen, skeletal muscle, and intestines. Insulin resistance and early type 2 diabetes were induced by feeding mice a high-fat diet consisting of 60% fat (Research Diets, New Brunswick, NJ, USA) for 6 weeks and obtaining serum samples at the end of Weeks 1, 2, 4, and 6.
Cell culture
3T3-L1 cells were obtained from the Health Science Research Resources Bank, Japanese Collection of Research Bioresources Cell Bank (JCRB9014), Osaka, Japan. 3T3-L1 preadipocytes were maintained in Dulbecco’s Modified Eagle Medium (DMEM, 5.5 mM glucose; Nissui Seiyaku, Tokyo, Japan) and supplemented with 1.5 g/L NaHCO3 (Wako, Osaka, Japan), 4.0 mM L-glutamine (Wako), 18 μg/mL penicillin G potassium (Meiji Seika, Tokyo, Japan), and 50 μg/mL streptomycin sulfate (Meiji Seika) in heat-inactivated 10% fetal bovine serum (FBS; Biowest, Miami, FL, USA) at 37°C in a humidified atmosphere containing 5% volume-percent (v/v) CO2. Cells were grown in 150 cm2 canted neck polystyrene flasks and were passaged at 80% confluency. When grown under the 25 mM glucose condition, DMEM high glucose (Sigma-Aldrich) was used and was supplemented with 1.7 g/L NaHCO3, 75 μg/mL penicillin G potassium, 50 μg/mL streptomycin sulfate, and 5 μL/L β-mercaptoethanol (Wako) in heat-inactivated 10% FBS.
Differentiation of 3T3-L1 preadipocytes to adipocytes
3T3-L1 preadipocytes were seeded in 24-well plates at 1×10⁵ cells/mL in 10% FBS-DMEM (5.5 or 25 mM). After 2 days of confluency, media was replaced with differentiation cocktail: DMEM (5.5 or 25 mM glucose), 0.5 mM 3-isobutyl-1-methylxanthine (Sigma-Aldrich), 0.25 μM dexamethasone (Sigma-Aldrich), and 1 μg/mL insulin (from the bovine pancreas, Sigma-Aldrich) for 3 days. Media was then changed to 10% FBS-DMEM (5.5 or 25 mM glucose) containing 1 μg/mL insulin only. Thereafter, media was changed every 2 days until Day 14. Unless otherwise stated, all experiments were carried out using adipocytes at Day 10.
Isolation of mouse adipocytes
The isolation of adipocytes was performed according to the method described by Thompson et al with minor modifications.13 Mice were sacrificed under deep anesthesia and death was confirmed before proceeding to any surgical procedure. Mice were opened from the abdomen and epididymal fat pads were dissected out into 0.2% collagenase solution (Type II collagenase, Sigma-Aldrich) in 2% BSA-Hanks buffer solution. Fat pads were shaken in a rocker shaker at 120 shakes per minute for 45 minutes. All contents were filtered through a 70-μm pore size filter to remove undigested tissue and then centrifuged at 175× g for 5 minutes. At the end of centrifugation, preadipocytes and other blood cells settled while floating adipocytes were separated using wide bore pipette tips. Adipocytes were washed in glucose-free DMEM once and inoculated in 10% FBS-DMEM media.
Determination of intracellular and released DPP4 levels
In the intracellular DPP4 content analysis, 3T3-L1 cells were collected in 500 μL of 10 mM Tris-HCl buffer (pH 7.0) on ice. Cells were ultracentrifuged at 130,000× g for 30 minutes at 4°C, and 400 μL of the supernatant was collected for the DPP4 content analysis. In the released content analysis of Day 10 adipocytes, cells were washed with phosphate buffered saline (PBS) and incubated in serum-free DMEM (5.5 or 25 mM glucose) for 24 hours. Supernatant was stored at −20°C for further analysis. We chose serum-free DMEM for the incubation as FBS itself contains a small amount of DPP4, and thus may have interfered with our results. In the case of adipocytes obtained from mice, 20 μL of packed adipocytes were incubated in serum-free DMEM (5.5 or 25 mM glucose) for 24 hours. After that period, the supernatant was collected and cells were washed carefully in PBS once. Adipocytes were then ultracentrifuged in 10 mM Tris-HCl buffer (pH 7.0, 500 μL) at 249,000× g for 30 minutes at 4°C, and 400 μL of the supernatant was collected for further assays. In all cases, the protein content in the supernatant was determined using the Bio-Rad Protein Assay kit (Bio-Rad Laboratories, Hercules, CA, USA). Cell viability was determined by the MTT assay. Released and intracellular DPP4 levels were assessed by the Duo-set Mouse DPP4/CD26 enzyme-linked immunosorbent assay kit, obtained from R&D Systems (Minneapolis, MN, USA). DPP4 levels were adjusted by the intracellular protein content as described above.
Oil Red O staining
Oil Red O staining of lipid droplets in adipocytes was performed as described previously.14 Day 10 3T3-L1 adipocytes were washed twice with cold PBS and then fixed in 10% formalin for 10 minutes at room temperature. Cells were washed again with PBS and incubated in 60% 2-propanol for 1 minute. Fixed cells were then incubated in 0.18% Oil Red O solution for 15 minutes at room temperature. After 15 minutes, cells were washed with 60% 2-propanol and then with PBS once. Images were then taken at a 40× optical zoom. Regarding lipid quantification, Oil Red O in the cells was extracted by 100% isopropanol for 15 minutes at room temperature and absorbance was measured at 540 nm.
RNA isolation, reverse transcription, and real-time PCR
Total RNA was isolated from 3T3-L1 cells and mice adipose tissue, the kidney, liver, spleen, intestines, skeletal muscle, and pancreas using RNAiso Plus (Takara Bio Inc., Shiga, Japan). Cells were collected on Day 0 and Day 6 of the differentiation of 3T3-L1. Total RNA was extracted using RNAiso Plus, according to the manufacturer’s protocol. The purity of total RNA was quantified by measuring optical densities at 260/280 and 260/230 nm. First strand complementary DNA was synthesized from 2 μg of total RNA using RT Prime Script Master Mix (Takara Bio). Real-time PCR was performed with primers specific for mouse DPP4: Forward: 5′-TTG TGG ATA GCA AGC GAG TTG-3′, Reverse: 5′-CAC AGC TAT TCC GCA CTT GAA-3′; DPP8: Forward: 5′-ATG ATT ACC ACC CAG GAA GCG-3′, Reverse: 5′-ATC TCC GAC ATC TTG AAA GTG ACC-3′; DPP9: Forward: 5′-CAC GGC CTC TTG GGA AGG CTC-3′, Reverse: 5′-GCG GGG GAG GGC ACA TGA AT-3′; and the housekeeping gene as mouse peptidylprolyl isomerase A: Forward: 5′-ACC GTG TTC TTC GAC ATC ACG-3′, Reverse: 5′-CTG GCA CAT GAA TCC TGG AATA-3′. Reactions were carried out as follows: 1 cycle of 30 seconds at 95°C, 40 cycle at 95°C for 15 seconds, 60°C for 1 minute, and 1 cycle of dissociation at 95°C for 15 seconds, 60°C for 30 seconds, and 95°C for 15 seconds. Melting point curves were checked to define the identity of the final product. All genes were normalized to the housekeeping gene peptidylprolyl isomerase A.
TNF-α stimulation of adipocytes
3T3-L1 adipocytes, grown under 5.5 or 25 mM glucose conditions, and isolated adipocytes, incubated under 5.5 or 25 mM glucose conditions, were stimulated with 10 ng/mL of recombinant mice TNF-α for 24 hours under serum-free conditions. Intracellular and released DPP4 levels were isolated as described earlier. Furthermore, 3T3-L1 adipocytes were collected in RNAiso Plus for total RNA isolation and the evaluation of DPP4 mRNA expression.
Statistical analysis
Data were expressed as the mean ± standard error. Significance was determined by either an unpaired t-test or one-way ANOVA followed by Dunnet’s test, where applicable. Significance levels were determined when P<0.05 was found.
Results
High-fat diet decreased serum DPP4 levels at Weeks 1 and 2
We first examined the effects of the high-fat diet, which induced an increase in body weight (Figure 1A) and serum glucose levels (Figure 1B), on serum DPP4 levels. Mice fed the high-fat diet for 1 week had lower serum DPP4 levels than those in mice fed the normal chow diet; however, these differences in serum DPP4 levels gradually disappeared with continuous feeding of the high-fat diet (Figure 1C). A plot of blood glucose levels and serum DPP4 revealed a negative correlation at Weeks 1 and 2, which gradually became positive after 4 weeks of feeding with the high-fat diet (Figure 1D). To determine whether DPP4 levels varied under the fasting and fed conditions, we performed an oral glucose tolerance test in overnight-fasted mice. The oral administration of glucose (1.5 g/kg) had no effect on serum DPP4 levels (Figure 1E), although blood glucose levels increased as expected from the oral glucose tolerance test of normal chow-fed mice (Figure 1F). These results suggested that the decrease observed in serum DPP4 levels in high-fat diet-fed mice in 1 week was not a short-term process.
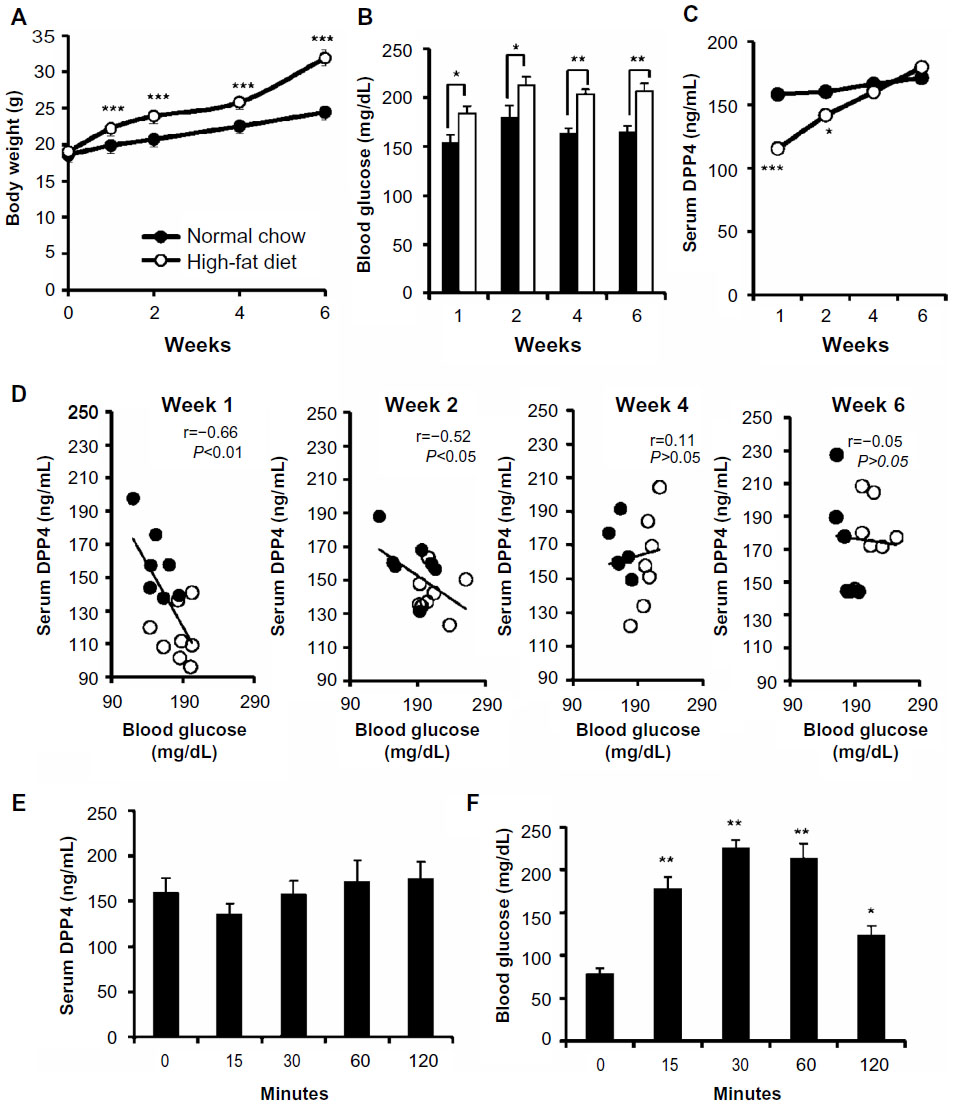 | Figure 1 The high-fat diet induced a reduction in serum DPP4 levels. |
Glucose negatively regulated DPP4 mRNA and protein expression
We investigated whether glucose affected differentiation and DPP4 expression in adipocytes. We cultured 3T3-L1 cells under 5.5 (Figure 2A) and 25 mM (Figure 2B) glucose conditions for 10 days and stained with Oil Red O. No significant difference was observed between the lipid levels in adipocytes grown under the 5.5 or 25 mM glucose condition, as quantified by Oil Red O (Figure 2C).
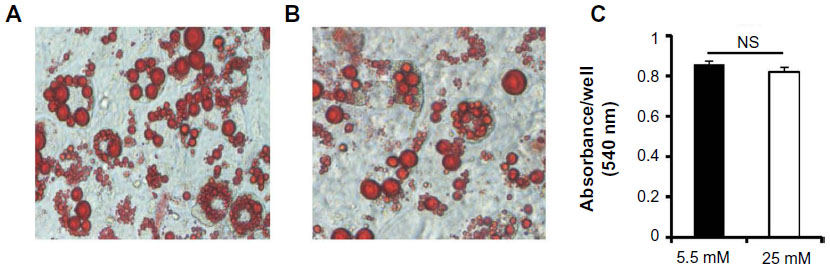 | Figure 2 Oil Red O staining of 3T3-L1 adipocytes. |
We then assessed intracellular DPP4 levels in differentiating 3T3-L1 cells for 14 days, and found that DPP4 levels increased with differentiation. Adipocytes cultured under the 25 mM glucose condition produced less intracellular DPP4 than adipocytes cultured under the 5.5 mM glucose condition, as determined by enzyme-linked immunosorbent assay (Figure 3A). The release of DPP4 from Day 10 3T3-L1 adipocytes incubated under the serum-free 25 mM glucose condition was also less than that from adipocytes incubated under the 5.5 mM glucose condition (Figure 3B). These results indicated that the difference observed in intracellular DPP4 levels was not due to the enhanced release of DPP4.
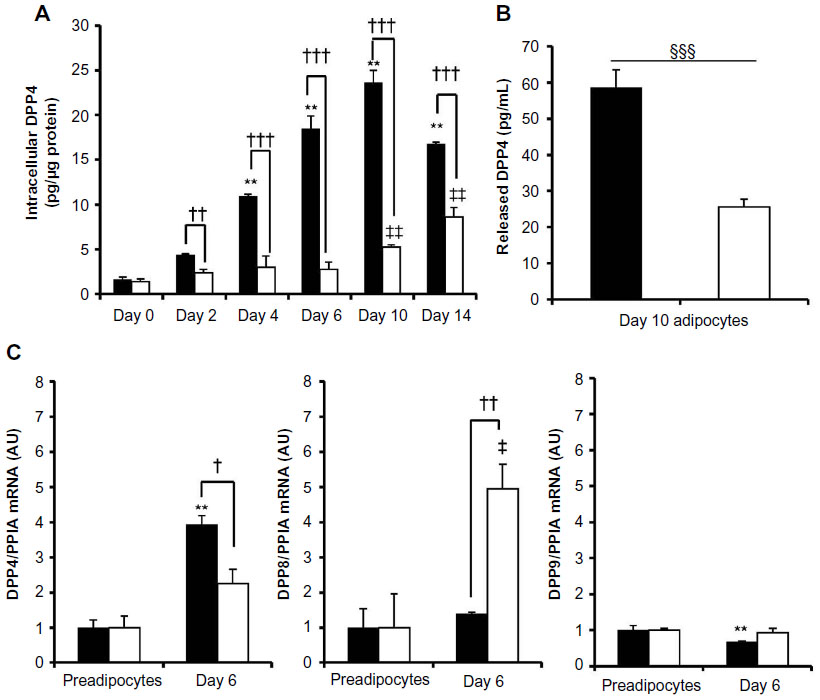 | Figure 3 Intracellular, released, and mRNA expression of DPP4. |
We also compared DPP4, DPP8, and DPP9 mRNA levels in 3T3-L1 preadipocytes with those in Day 6 adipocytes. The differentiation of preadipocytes into adipocytes increased the expression of DPP4 mRNA, which was negatively regulated by glucose. These results suggested that glucose may have regulated the expression of DPP4 at the transcriptional level. Adipocyte differentiation under the 5.5 or 25 mM glucose condition did not increase the expression of DPP8 or DPP9, although 25 mM glucose increased the expression of DPP8 mRNA (Figure 3C).
Loss of glucose regulation under diabetic conditions
To clarify why the negative regulation of DPP4 expression by the higher glucose concentration was lost in high-fat diet-fed mice at 4 and 6 weeks, mice were administered streptozotocin, which caused an increase in serum glucose levels within 1 week without an increase in body weight (Figure 4A). In this model, serum DPP4 levels and blood glucose levels significantly increased 2 and 7 days after the streptozotocin injection (Figure 4B and C). Adipocytes prepared from normal and streptozotocin-treated mice (2 days after the streptozotocin injection) were incubated under the serum-free 5.5 or 25 mM glucose condition for 24 hours. Consistent with in vitro results, adipocytes from normal mice incubated under the 25 mM glucose condition also had decreased intracellular and released DPP4 levels (Figure 4D). The levels of both intracellular and released DPP4 in adipocytes from streptozotocin-treated mice (2 days after the streptozotocin injection) were higher than those from normal mice. Furthermore, the negative regulation of DPP4 by 25 mM glucose was absent (Figure 4E). The increased levels of intracellular and released DPP4 and lack of glucose regulation were also observed in adipocytes prepared from high-fat diet-fed mice (Figure 4F). An increase in the expression of DPP4 mRNA was observed in the adipose tissues of mice treated with streptozotocin for 48 hours (Figure 4G). The determination of DPP4 mRNA levels in various tissues indicated that an increase in the expression of DPP4 mRNA was only observed in the adipose tissue of streptozotocin-treated mice. The expression of DPP4 mRNA expression remained high in adipose tissue, even after the administration of streptozotocin for 4 weeks (Figure 4H).
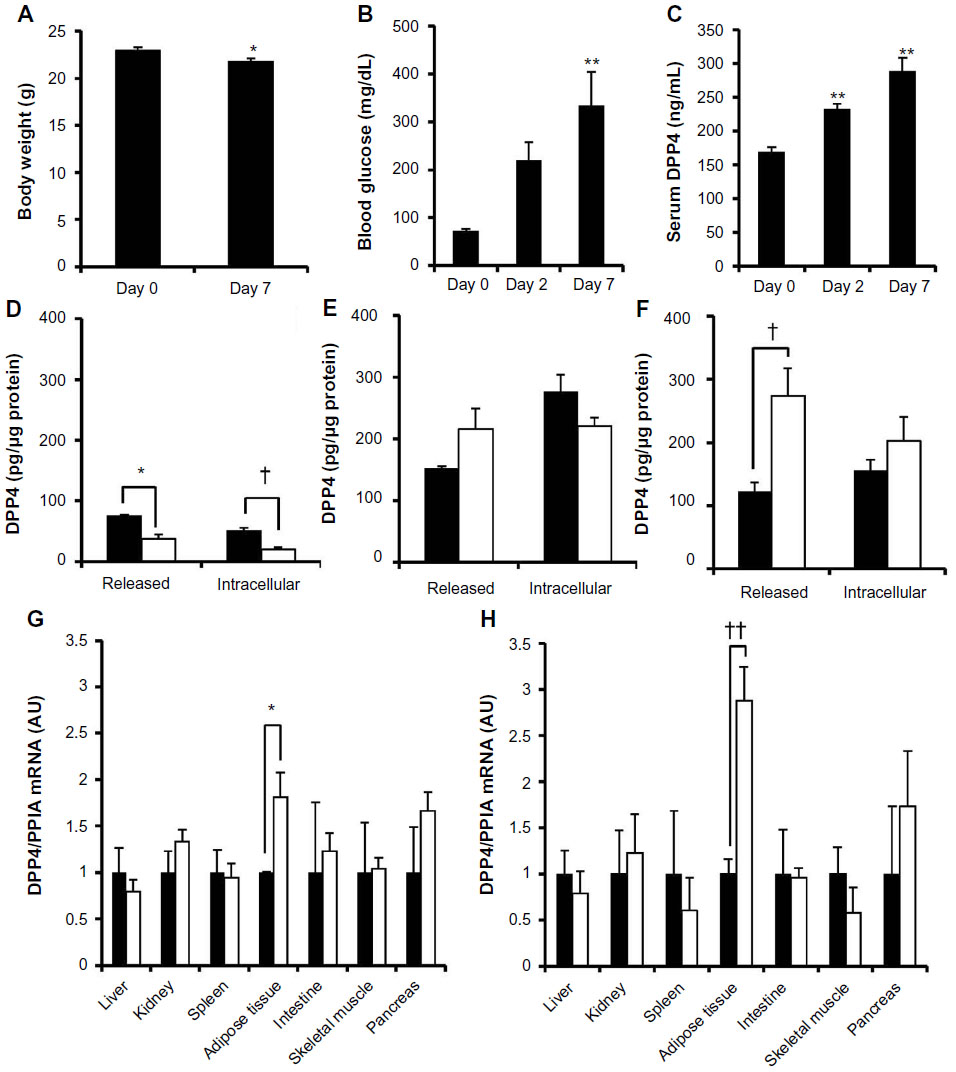 | Figure 4 Increased release of DPP4 in streptozotocin-induced diabetic mice. |
TNF-α markedly induced the release of DPP4 under the 25 mM glucose condition
Previous studies demonstrated that TNF-α levels were increased in both types of diabetes.22,23 Therefore, we stimulated Day 10 mature 3T3-L1 cells, grown under the 5.5 or 25 mM glucose condition, with 10 ng/mL recombinant TNF-α for 24 hours and determined the released and intracellular levels. The treatment with TNF-α induced the release of DPP4, which was more apparent under the 25 mM glucose condition (Figure 5B); however, the intracellular level of DPP4 was less than that under the 5.5 mM glucose condition (Figure 5A). Similar results were obtained when isolated adipocytes from mice incubated under the 5.5 and 25 mM glucose conditions were stimulated with 10 ng/mL TNF-α. TNF-α markedly increased the release of DPP4 under the 25 mM glucose condition than under the 5.5 mM glucose condition (Figure 5D), while intracellular levels remained unaffected (Figure 5C). No significant change was observed in the expression of DPP4 mRNA when adipocytes were stimulated with recombinant TNF-α (Figure 5E).
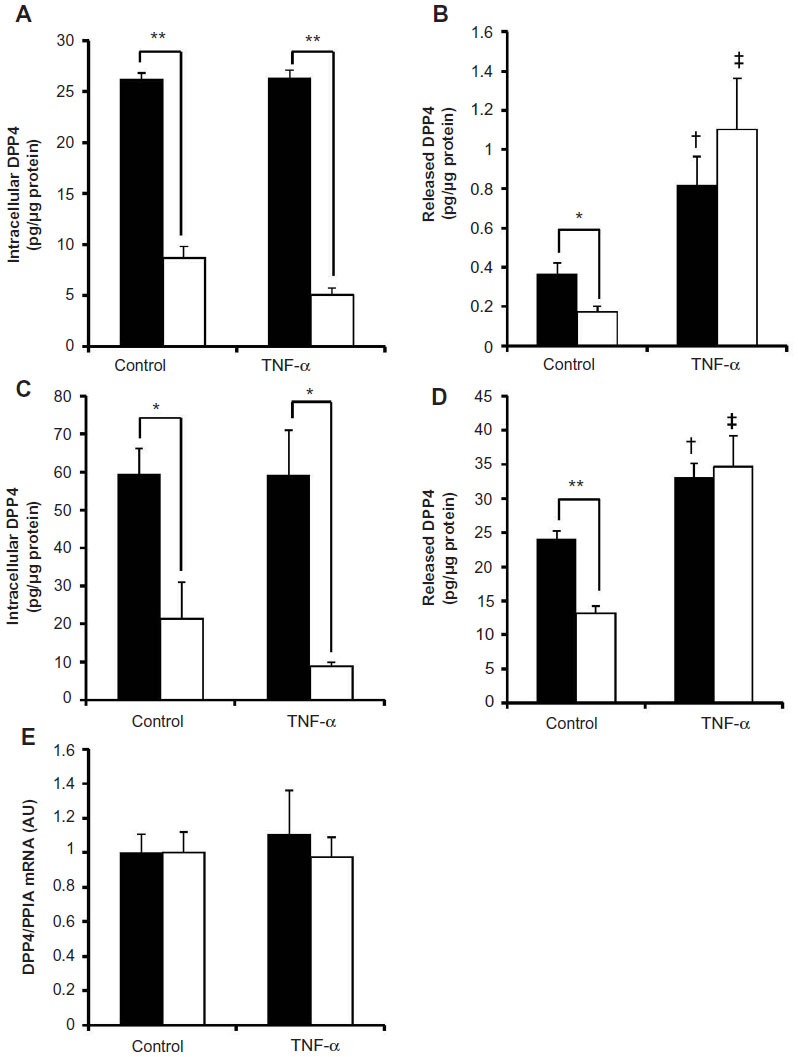 | Figure 5 Stimulation with TNF-α increased DPP4 release irrespective of the glucose concentration. |
Discussion
DPP4, which quickly degrades GLP-1, is an important target of antidiabetic treatments. Previous studies demonstrated that serum DPP4 activity levels were increased in patients and mice with type 1 and type 2 diabetes. We also showed in the present study that serum DPP4 levels were increased in both streptozotocin-induced and high-fat diet-induced insulin resistance models. We have demonstrated for the first time that, although DPP4 was negatively regulated by glucose in adipocytes under physiological conditions, such regulation was lost under diabetic conditions.
Mice fed a high-fat diet to maintain high blood glucose levels had lower serum DPP4 levels in the first and second weeks than those of the controls, and this difference gradually disappeared over 6 weeks. This result led to the hypothesis that DPP4 may be negatively regulated by high concentrations of glucose, but also that such a regulation may be lost as mice are likely to become diabetic. Furthermore, an oral glucose treatment administered to overnight fasted mice did not affect serum DPP4 levels, which is consistent with previous findings from a patient study, in which DPP4 activity levels remained unchanged under physiological conditions,15,16 indicating that the negative regulation of DPP4 by high glucose concentrations may be a long-term process. A more recent study by Sell et al17 suggested that a negative correlation existed between adipocyte DPP4 mRNA expression and glucose concentrations in healthy volunteers with normal glucose tolerance, but not in diabetic patients, which supports our concept.
Previous reports indicated that an increase in the weight of adipose tissue may cause an increase in serum DPP4 levels.5 Therefore, we focused on adipocytes because DPP4 is an adipokine. We chose a 3T3-L1 cell line, an embryonic fibroblast cell line that has the ability to differentiate into adipocytes, and compared the results obtained with isolated adipocytes from mice. Although the origin of these adipocytes differed, we still found close similarities between the results obtained. Using 3T3-L1 cells, we showed that the differentiation-dependent increase in intracellular DPP4 levels was negatively regulated by glucose concentrations, without affecting adipocyte differentiation. The 25 mM glucose concentration also decreased intracellular and released DPP4 levels in mature adipocytes obtained from normal mice following 24-hour incubation. These results suggested that the production of DPP4 was negatively regulated by glucose, which is consistent with the finding that the high-fat diet induced a reduction in serum DPP4 levels in Weeks 1 and 2.
Although the roles of DPP8 and DPP9 remain unknown in diabetes, recent studies have suggested that DPP8 and DPP9 may be abundantly present in the macrophage-rich regions of plaques in atherosclerosis. The expression of DPP9 was shown to be upregulated in M1 macrophages, and the silencing DPP9 reduced the secretion of IL-6 and TNF-α.18 Among DPP4, DPP8, and DPP9, only DPP4 was negatively regulated by 25 mM glucose. The negative regulation of DPP4 by glucose has already been reported in the intestinal cell line Caco-2. Glucose concentrations negatively regulated the expression of the transcriptional factor hepatocyte nuclear factor-1α (HNF-1α) and this, in turn, regulated DPP4. The expression of dominant negative HNF-1α reduced the production of DPP4 in Caco-2 cells.7 However, the expression of HNF-1α mRNA in adipocytes was very low (data not shown), which indicated that another regulation mechanism may exist in adipocytes.
Whether glucose still negatively regulated DPP4 production under diabetic conditions was a matter of interest. Previous studies reported that an increase in the weight of adipose tissue together with body weight increased DPP4 levels.5 However, DPP4 levels also increased in the streptozotocin-induced diabetes model, while body weight decreased. Thus, we cannot deny that an increase in adipocytes caused a concomitant increase in DPP4 levels in high-fat diet-fed mice; the diabetic condition also affected the production of DPP4 independent of the size of the adipocytes. The determination of DPP4 mRNA levels in the tissues of streptozotocin-treated mice revealed an increase in the expression in adipose tissue. In addition, intracellular DPP4 levels of adipocytes collected from both streptozotocin- and high-fat diet-treated mice appeared to be higher than those from normal mice, which indicated that the negative regulation of DPP4 production by glucose in adipocytes was lost under the diabetic condition. The result that DPP4 activity levels in adipocytes were increased under the diabetic condition was supported by Kirino et al.19 One of the reasons for this may be an insulin deficiency in the type 1 diabetic condition or an insulin-resistant condition in the type 2 diabetic condition reducing glucose uptake in adipocytes,20,21 thereby producing a similar condition to that in adipocytes exposed to the 5.5 mM glucose condition, resulting in an increase in the production of DPP4.
Previous studies reported that TNF-α levels were increased in both streptozotocin-induced diabetes and high-fat diet-induced insulin resistance models.22,23 The stimulation of human umbilical vein endothelial cells with TNF-α also increased DPP4 activity.24 We confirmed that TNF-α induced the release of DPP4 from 3T3-L1 adipocytes and isolated mice adipocytes. The TNF-α-induced release was not reduced in 25 mM glucose concentrations but rather increased as compared to 5.5 mM glucose concentrations. A possible explanation may be the shedding of surface DPP4 induced by TNF-α irrespective of glucose concentrations.
The regulation of DPP4 by glucose under physiological conditions is reasonable because high glucose concentrations induce a decrease in DPP4 levels, which, in turn, increase GLP-1 levels, resulting in enhancement in insulin release and responses to lower serum glucose levels. The loss of the glucose regulation of DPP4 under the diabetic condition may represent a vicious circle of events in intractable diabetes.
Many DPP4 inhibitors are currently available on the market, and these mainly inhibit the activity of DPP4, thereby prolonging the activity of incretin hormones. However, to inhibit the increased production of DPP4 from adipocytes may represent a more reasonable strategy. We are currently focusing on mechanisms that increase the production of DPP4 from adipocytes, which may lead to a more specific design for DPP4 inhibitors.
Conclusion
The results of the present study suggest that DPP4 levels are negatively regulated by glucose concentrations in adipocytes under physiological conditions, and this regulation is lost under diabetic conditions, possibly due to the low availability of glucose. The increased production of DPP4 from adipocytes and TNF-α-induced release of DPP4 from adipocytes may be attributed to the elevated serum DPP4 levels observed in both type 1 and 2 diabetes.
Acknowledgments
The authors would like to thank the Ministry of Education, Culture, Sports, Science, and Technology, Japan (MEXT) for their support through the Monbukagakusho Scholarship to recipient no 102032.
Disclosure
The authors declare no conflict of interest in this work.
References
Nicolas F, Tiveron MC, Davoust J, Reggio H. GPI membrane anchor is determinant in intracellular accumulation of apical plasma membrane proteins in the non-polarized human colon cancer cell line HT-29 18. J Cell Sci. 1994;107(Pt 10):2679–2689. | |
Duke-Cohan JS, Morimoto C, Rocker JA, Schlossman SF. A novel form of dipeptidylpeptidase IV found in human serum. Isolation, characterization, and comparison with T lymphocyte membrane dipeptidylpeptidase IV (CD26). J Biol Chem. 1995;270(23):14107–14114. | |
Yazbeck R, Howarth GS, Abbott CA. Dipeptidyl peptidase inhibitors, an emerging drug class for inflammatory disease? Trends Pharmacol Sci. 2009;30(11):600–607. | |
Drucker DJ, Nauck MA. The incretin system: glucagon-like peptide-1 receptor agonists and dipeptidyl peptidase-4 inhibitors in type 2 diabetes. Lancet. 2006;368(9548):1696–1705. | |
Lamers D, Famulla S, Wronkowitz N, et al. Dipeptidyl peptidase 4 is a novel adipokine potentially linking obesity to the metabolic syndrome. Diabetes. 2011;60(7):1917–1925. | |
Famulla S, Schlich R, Sell H, Eckel J. Differentiation of human adipocytes at physiological oxygen levels results in increased adiponectin secretion and isoproterenol-stimulated lipolysis. Adipocyte. 2012;1(3):132–181. | |
Gu N, Tsuda M, Matsunaga T, et al. Glucose regulation of dipeptidyl peptidase IV gene expression is mediated by hepatocyte nuclear factor-1alpha in epithelial intestinal cells. Clin Exp Pharmacol Physiol. 2008;35(12):1433–1439. | |
Bauvois B, Djavaheri-Mergny M, Rouillard D, Dumont J, Wietzerbin J. Regulation of CD26/DPPIV gene expression by interferons and retinoic acid in tumor B cells. Oncogene. 2000;19(2):265–272. | |
Mannucci E, Pala L, Ciani S, et al. Hyperglycaemia increases dipeptidyl peptidase IV activity in diabetes mellitus. Diabetologia. 2005;48(6):1168–1172. | |
Varga T, Somogyi A, Barna G, et al. Higher serum DPP-4 enzyme activity and decreased lymphocyte CD26 expression in type 1 diabetes. Pathol Oncol Res. 2011;17(4):925–930. | |
Kim SJ, Nian C, Doudet DJ, McIntosh CH. Inhibition of dipeptidyl peptidase IV with sitagliptin (MK0431) prolongs islet graft survival in streptozotocin-induced diabetic mice. Diabetes. 2008;57(5):1331–1339. | |
Nagakura T, Yasuda N, Yamazaki K, Ikuta H, Tanaka I. Enteroinsular axis of db/db mice and efficacy of dipeptidyl peptidase IV inhibition. Metabolism. 2003;52(1):81–86. | |
Thompson AC, Nuñez M, Davidson R, et al. Mitigation of isolation-associated adipocyte interleukin-6 secretion following rapid dissociation of adipose tissue. J Lipid Res. 2012;53(12):2797–2805. | |
Sato T, Kotake D, Hiratsuka M, Hirasawa N. Enhancement of inflammatory protein expression and nuclear factor Κb (NF-Κb) activity by trichostatin A (TSA) in OP9 preadipocytes. PLoS One. 2013;8(3):e59702. | |
Pala L, Ciani S, Dicembrini I, et al. Relationship between GLP-1 levels and dipeptidyl peptidase-4 activity in different glucose tolerance conditions. Diabet Med. 2010;27(6):691–695. | |
Ryskjaer J, Deacon CF, Carr RD, et al. Plasma dipeptidyl peptidase-IV activity in patients with type-2 diabetes mellitus correlates positively with HbAlc levels, but is not acutely affected by food intake. Eur J Endocrinol. 2006;155(3):485–493. | |
Sell H, Blüher M, Klöting N, et al. Adipose dipeptidyl peptidase-4 and obesity: correlation with insulin resistance and depot-specific release from adipose tissue in vivo and in vitro. Diabetes Care. 2013;36(12):4083–4090. | |
Matheeussen V, Waumans Y, Martinet W, et al. Dipeptidyl peptidases in atherosclerosis: expression and role in macrophage differentiation, activation and apoptosis. Basic Res Cardiol. 2013;108(3):350. | |
Kirino Y, Sato Y, Kamimoto T, Kawazoe K, Minakuchi K, Nakahori Y. Interrelationship of dipeptidyl peptidase IV (DPP4) with the development of diabetes, dyslipidaemia and nephropathy: a streptozotocin-induced model using wild-type and DPP4-deficient rats. J Endocrinol. 2009;200(1):53–61. | |
Li J, Houseknecht KL, Stenbit AE, Katz EB, Charron MJ. Reduced glucose uptake precedes insulin signaling defects in adipocytes from heterozygous GLUT4 knockout mice. FASEB J. 2000;14(9):1117–1125. | |
Wang Y, Nishina PM, Naggert JK. Degradation of IRS1 leads to impaired glucose uptake in adipose tissue of the type 2 diabetes mouse model TALLYHO/Jng. J Endocrinol. 2009;203(1):65–74. | |
Nacci C, Tarquinio M, De Benedictis L, et al. Endothelial dysfunction in mice with streptozotocin-induced type 1 diabetes is opposed by compensatory overexpression of cyclooxygenase-2 in the vasculature. Endocrinology. 2009;150(2):849–861. | |
Margoni A, Perrea DN, Vlachos I, et al. Serum leptin, adiponectin and tumor necrosis factor-α in hyperlipidemic rats with/without concomitant diabetes mellitus. Mol Med. 2011;17(1–2):36–40. | |
Silva AP, Cavadas C, Baïsse-Agushi B, Spertini O, Brunner HR, Grouzmann E. NPY, NPY receptors, and DPP IV activity are modulated by LPS, TNF-alpha and IFN-gamma in HUVEC. Regul Pept. 2003;116(1–3):71–79. |
 © 2014 The Author(s). This work is published and licensed by Dove Medical Press Limited. The full terms of this license are available at https://www.dovepress.com/terms.php and incorporate the Creative Commons Attribution - Non Commercial (unported, v3.0) License.
By accessing the work you hereby accept the Terms. Non-commercial uses of the work are permitted without any further permission from Dove Medical Press Limited, provided the work is properly attributed. For permission for commercial use of this work, please see paragraphs 4.2 and 5 of our Terms.
© 2014 The Author(s). This work is published and licensed by Dove Medical Press Limited. The full terms of this license are available at https://www.dovepress.com/terms.php and incorporate the Creative Commons Attribution - Non Commercial (unported, v3.0) License.
By accessing the work you hereby accept the Terms. Non-commercial uses of the work are permitted without any further permission from Dove Medical Press Limited, provided the work is properly attributed. For permission for commercial use of this work, please see paragraphs 4.2 and 5 of our Terms.