")
Back to Journals » Journal of Hepatocellular Carcinoma » Volume 8
Regulation Network and Prognostic Significance of Aldo-Keto Reductase (AKR) Superfamily Genes in Hepatocellular Carcinoma
Authors Dai T , Ye L , Yu H, Li K , Li J, Liu R , Lu X, Deng M, Li R, Liu W , Yang Y, Wang G
Received 7 June 2021
Accepted for publication 21 August 2021
Published 30 August 2021 Volume 2021:8 Pages 997—1021
DOI https://doi.org/10.2147/JHC.S323743
Checked for plagiarism Yes
Review by Single anonymous peer review
Peer reviewer comments 3
Editor who approved publication: Prof. Dr. Imam Waked
Tianxing Dai,1,2 Linsen Ye,1,2 Haoyuan Yu,1,2 Kun Li,1,2 Jing Li,3 Rongqiang Liu,4 Xu Lu,1,2 Mingbin Deng,1,2 Rong Li,1,2 Wei Liu,2 Yang Yang,1 Guoying Wang4
1Department of Hepatic Surgery and Liver Transplant Program, The Third Affiliated Hospital of Sun Yat-Sen University, Guangzhou, 510630, People’s Republic of China; 2Guangdong Key Laboratory of Liver Disease Research, The Third Affiliated Hospital of Sun Yat-Sen University, Guangzhou, 510630, People’s Republic of China; 3Department of Infectious Diseases and Hepatology Unit, Nanfang Hospital, Southern Medical University, Guangzhou, 510515, People’s Republic of China; 4Department of Hepatobiliary Surgery, The First Affiliated Hospital of Guangzhou Medical University, Guangzhou, 510120, People’s Republic of China
Correspondence: Yang Yang
Department of Hepatic Surgery and Liver Transplant Program, The Third Affiliated Hospital of Sun Yat-Sen University, Guangzhou, 510630, People’s Republic of China
Tel +86-020-85252177
Fax +86-020-85252276
Email [email protected]
Guoying Wang
Department of Hepatobiliary Surgery, The First Affiliated Hospital of Guangzhou Medical University, Guangzhou, 510120, People’s Republic of China
Tel +86-020-83062703
Fax +86-020-83395651
Email [email protected]
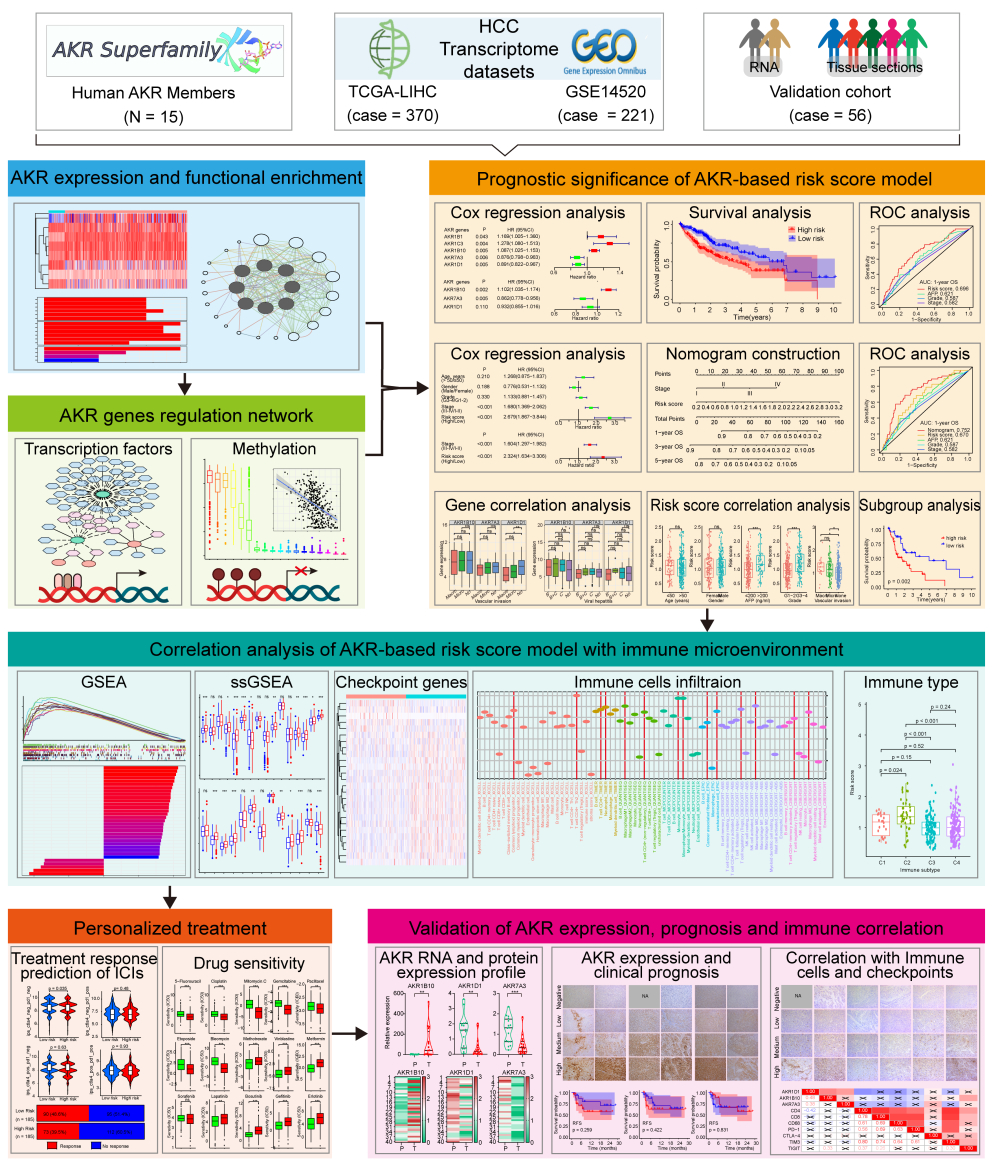
Purpose: The aldo-keto reductase (AKR) superfamily members have been proposed with multiple roles in various tumors. Here, a comprehensive analysis on the integral role of AKR genes was conducted to evaluate the expression profile, regulation network, and prognostic significance in hepatocellular carcinoma (HCC).
Materials and Methods: Transcriptome datasets of HCC were obtained from the Cancer Genome Atlas (TCGA) and Gene Expression Omnibus. Univariate and multivariate Cox regression analyses were used to build a novel risk score model, and then were further used to identify independent prognostic factors for overall survival (OS) of HCC. A prognostic nomogram was developed and validated. The expression of these critical AKR members was also evaluated by quantitative real-time polymerase chain reaction and immunohistochemistry in HCC specimens.
Results: Eight differentially expressed AKR genes were identified in HCC. The dysregulation of most AKR genes was negatively correlated with DNA methylation, and a regulation network with transcription factors (TFs) was also established. Then, three critical AKR genes (AKR1B10, AKR1D1, and AKR7A3) were screened out to build a novel risk score model. Worse OS was observed in high-risk patients. Besides, a prognostic nomogram based on the model was further established and validated in both the TCGA and GSE14520 cohorts, which showed superior performance in predicting the OS of HCC patients. Notably, close correlations were identified between the risk score and tumor immune microenvironment, somatic mutation profiles, and drug susceptibilities of HCC. Finally, the upregulated AKR1B10 and downregulated AKR1D1 and AKR7A3 were further verified in HCC tumor and adjacent tissues from our institution.
Conclusion: The dysregulated AKR genes could be mediated by DNA methylation and TFs in HCC. The risk model established with superior prognostic performance further suggested the significant role of AKR genes involved in the progression of HCC.
Keywords: hepatocellular carcinoma, aldo-keto reductase, AKR, risk score model, nomogram, prognosis
Graphical Abstract:
Introduction
The latest epidemiological data reveal that liver cancer is still one of the most common malignancies in the world, with more than 800,000 new cases annually.1 Due to its high aggressiveness, liver cancer also occupies one of the leading causes of cancer-related death.1 As the major form of liver cancer, hepatocellular carcinoma (HCC) accounts for almost 90% of total cases.1,2 Viral infection, including hepatitis B and C, is an important risk factor for HCC, and cirrhosis induced by various etiologies provides a supportive background for the development and progression of hepatoma.3 Diet-related factors, including alcohol consumption and aflatoxins, are also important risk factors for HCC.3 Standardized surveillance for the high-risk population would contribute to early detection of HCC and thus improve the chances of getting a radical treatment, such as surgical resection, liver transplantation, and local ablation.2,4 However, there are still a large proportion of patients who have lost the curative chance at the time of diagnosis and receive other treatment options with locoregional and/or systematic therapies.5 Although the improvement in prognosis was limited, targeted therapy with sorafenib opened a new era for advanced HCC.5,6 Recently, immunotherapy with immune checkpoint inhibitors (ICIs) provides new hope for HCC patients, and the emergence of novel combination strategies further improved the prognosis.7 Therefore, it is extraordinarily important to enhance the understanding of the pathogenesis of HCC and explore the critical factors affecting the prognosis of patients, which will help to create new opportunities for the current treatment predicament.
The aldo-keto reductase (AKR) is a superfamily consisting of more than 190 members, which mainly belong to monomeric oxidoreductases involved in the preliminary oxidation-reduction reactions of carbonyl substrates.8,9 The enzymatic activity of AKR is dependent on nicotinamide adenine dinucleotide phosphate (NADPH) and has several catalytic and structural features. To date, the superfamily has been clustered into 16 families (AKR1-16) and multiple subfamilies based on their homologous sequences and functions.8,10 In human sapiens, a total of 15 AKR enzymes, belonging to the AKR1A (AKR1A1), AKR1B (AKR1B1, AKR1B10, and AKR1B15), AKR1C (AKR1C1-4), AKR1D (AKR1D1), AKR1E (AKR1E2), AKR6A (AKR6A3, AKR6A5, and AKR6A9), and AKR7A (AKR7A2 and AKR7A3) subfamily, have been recognized with critical roles in the synthetic and metabolic processes of steroids.11
AKR1 is the largest family of AKR superfamily and includes more than half of the human AKR members. AKR1C enzymes are mainly responsible for regulating the oxidoreduction reactions of 3-keto-, 17-keto-, and 20-ketosteroids.12 The dysregulation of AKR1C subfamily has been proposed with significant roles in various cancers, as well as with potentials for antitumor drug development.13,14 As for AKR1B subfamily, AKR1B1 has been identified with participation in multiple pathophysiological processes including glycometabolism, inflammatory response, and prostaglandin synthesis, while AKR1B10 has been implicated in regulating the metabolic processes of cytotoxic carbonyls, synthesis of retinol and fatty acid, and lipid metabolism. Both members have been proposed with dysregulation in many tumors.15,16 AKR1D1 acts as the only human steroid 5β-reductase and plays a role in the synthesis of bile acid.17,18 Besides, AKR7A members have been mainly regarded as reductases involved in the detoxification of aflatoxin aldehydes, and its reduction may play an important role in aflatoxin-induced liver cancer.19,20 Therefore, the AKR members perform critical functions in various pathophysiological processes, including cancers. However, the comprehensive analysis on the integral role of AKR superfamily in HCC is still insufficient.
In the present study, we conducted an extensive analysis on the overall profiles (expression, correlation, function, and regulation network) of the human AKR superfamily in HCC using the transcriptome data from the Cancer Genome Atlas (TCGA) and Gene Expression Omnibus (GEO). Besides, we also comprehensively analyzed the AKR members involved in the occurrence, progression, and prognosis of HCC with the clinical information. A novel risk score model based on the AKR genes and a prognostic nomogram for HCC was established and validated with superior performance, respectively. Notably, the critical AKR gene signature was found with a significant correlation with the tumor immune microenvironment, somatic mutation profile, ICIs treatment response, and drug sensitivity of HCC. Finally, the RNA and protein expression of these AKR members were further validated in HCC specimens from our institution. These results provided a more instructive overview of the AKR superfamily and potential targets for the diagnosis and treatment of HCC.
Materials and Methods
Data Collection
The transcriptome data of HCC was downloaded from TCGA with gene expression matrix from 374 liver tumors and 50 normal controls (TCGA-LIHC, https://portal.gdc.cancer.gov/). Another independent HCC microarray dataset of GSE14520 with 225 tumor samples and 220 normal controls was retrieved from the GEO (https://www.ncbi.nlm.nih.gov/geo/). Besides, the corresponding clinicopathologic data of HCC patients in the above datasets were also obtained. Besides, the prognostic data with disease-specific survival (DSS), disease-free interval (DFI), progression-free interval (PFI), and progression-free survival (PFS) for the TCGA cohort was retrieved from a previous report.21 All analyses involving only gene expression profiles were performed using data from all samples, while analyses related to clinical outcomes included only patients with complete clinicopathologic information. Finally, 370 and 221 HCC patients from TCGA and GSE14520 were enrolled in the correlation and prognostic analyses. The clinical characteristics of HCC patients from these two cohorts were shown in Table S1.
The TCGA and GEO databases are open to the public and the data from all cases have been consented to use for analyses and obtained ethical approval. This study was based on open-source data, and strictly followed the publication guidelines and access policies of the database, so the study protocol was exempted from additional ethical approval.
In addition, paired tumor and adjacent samples from 56 HCC patients receiving surgical resection in the Third Affiliated Hospital of Sun Yat-Sen University were collected as the local validation cohort (January to December 2019). Written informed consent was obtained from each patient. The study was also approved by the Ethics Committee of the Third Affiliated Hospital of Sun Yat-Sen University and conducted in accordance with the Declaration of Helsinki.
Differentially Expressed AKR Superfamily Genes and Functional Enrichment in HCC
The AKR superfamily genes in humans were acquired from the AKR Superfamily database (https://hosting.med.upenn.edu/akr/). A total of 15 human AKR members were obtained and listed in Table S2. Then, the expression profiles of these AKR genes were extracted from TCGA and GSE14520 gene matrixes. By cross-comparison, only 10 AKR genes (AKR1A1, AKR1B1/10, AKR1C1/2/3/4, AKR1D1, AKR7A2/3) were present in both TCGA and GSE14520 datasets. Differentially expressed AKR genes between HCC tumors and normal controls were identified by Wilcoxon test using R package “limma” with the criteria of false discovery rate (FDR) < 0.05.
The correlations between these differentially expressed AKR genes were calculated and showed using the R package “corrplot”. The protein–protein interaction analysis was conducted using the GeneMANIA plugin (http://apps.cytoscape.org/apps/genemania, dataset updated on 13 July 2017) in Cytoscape software (Version 3.8.0). Gene Ontology (GO) and Kyoto Encyclopedia of Genes and Genomes (KEGG) pathway enrichment analyses for AKR genes were performed using the R package “clusterProfiler”.
Methylation Analyses of AKR Superfamily Genes in HCC
The DNA methylation data with the platform of Illumina Human Methylation 450 for TCGA HCC patients were downloaded from the UCSC Xena (https://xenabrowser.net/datapages/). The CpG sites in the promoter regions (from the upstream 2 kb to the downstream 500 bp) of AKR genes and the corresponding methylation levels were extracted. Then, the correlation between gene expression and methylation was conducted by Pearson’s correlation analysis.
Transcriptional Regulation Network Analysis for AKR Genes in HCC
The cancer-related transcriptional factors (TFs) were retrieved from the Cancer Transcription Factor Targets in Cistrome Cancer (http://cistrome.org/CistromeCancer/CancerTarget/). A total of 318 TFs were obtained. Then, the TF expression profile in HCC was extracted from the TCGA dataset and compared between tumor and normal samples. Differentially expressed TFs were screened based on |log2fold-change (log2FC)| > 1 and FDR < 0.05 (listed in Table S3). The correlations between TFs and AKR genes were evaluated using Pearson’s correlation analyses in the TCGA dataset. TFs with |correlation index| > 0.3 and p < 0.001 were identified to build the transcriptional regulation network.
Establishment of the Prognostic AKR Gene Model for HCC Patients
First, differentially expressed AKR genes were screened by the univariate COX regression analyses using R package “survival”. Then, genes with p < 0.05 were selected for multivariate COX analysis to construct the prognostic gene model. A stepwise selection strategy with “both” direction was adopted to optimize the model, and variables left in the formula were used to establish the novel risk score model:
All HCC patients in the TCGA cohort obtained risk scores based on the above model and the median risk score was set as the cutoff point to classified patients into high- and low-risk groups. The scoring model was also adopted to calculate the risk scores of HCC patients in the GSE14520 cohort and divide them into two groups. Afterward, Kaplan–Meier analyses with the Log rank test were performed for OS evaluation of HCC patients with different risk scores using the R package “survival”. The 1-, 3-, and 5-year receiver operating characteristic (ROC) curves analyses using R package “timeROC” were adopted to evaluate the prognostic performance of the model by comparing the area under the ROC curves (AUCs). Besides, the potential value of this risk score model for application in predicting the DSS, DFI, PFI, PFS, and the recurrence-free survival (RFS) was also evaluated in the TCGA and GSE14520 cohorts.
Prognostic Nomogram Construction and Evaluation
Univariate and multivariate Cox regression analyses were conducted to evaluate the independent prognostic significance of this risk model and other clinicopathological factors in the TCGA and GSE14520 cohorts. And the nomogram for OS prediction was established using the R package “rms”. The prediction performance was evaluated by the concordance index (C index), calibration curves, and time-dependent ROCs. In addition, the efficiency of the nomogram in predicting DSS, DFI, PFI, PFS, and RFS in HCC patients was also evaluated accordingly.
Correlations of the AKR Genes and Risk Score Model with the Clinicopathological Factors and Corresponding Subgroup Analyses
The expression of AKR genes in different subgroups classified by various clinical factors was evaluated by the Wilcoxon or Kruskal–Wallis test. The distribution of risk scores in different subgroups was also compared by the Wilcoxon or Kruskal–Wallis test. The subgroup survival analyses were conducted using the R package “survival” with Kaplan–Meier method for OS prediction.
Gene Set Enrichment Analysis (GSEA)
GSEA was conducted to evaluate the enriched pathways and hallmark gene signatures in different risk groups, which was conducted within the GSEA software (http://www.gsea-msigdb.org/gsea/index.jsp) with the KEGG (C2.cp.kegg.v7.4.symbols.gmt) and the hallmark (h.all.v7.4.symbols.gmt) gene sets. An FDR q value < 0.05 were considered statistically significant.
Correlations Between the Risk Score Model and Immune-Related Genes, Cells, and Immunotherapy Response
The immune-related genes with negative regulation functions were acquired from the Tracking Tumor Immunophenotype database (TIP, http://biocc.hrbmu.edu.cn/TIP/index.jsp). The correlations between risk scores and immune-related gene expressions were assessed by Pearson’s correlation analyses within the TCGA dataset. The infiltration estimations of different immune cells in TCGA HCC samples were downloaded from the TIMER 2.0 (http://timer.cistrome.org/). Single-sample gene set enrichment analysis (ssGSEA) was also conducted to evaluate the infiltration of multiple immune cells and immune-related functions among the high- and low-risk groups. The ESTIMATE algorithm was further applied to assess the overall immune cell infiltration in different subgroups. In addition, the immune subtype classification of HCC for the TCGA cohort was retrieved from the UCSC Xena (https://xenabrowser.net/datapages/) to evaluate its correlation with the risk score model. The associations between risk scores and infiltration intensities of different immune cells were assessed by Spearman analyses. The difference of these genes’ expression and immune cells’ infiltration were compared by the Wilcoxon or Kruskal–Wallis test between the high- and low-risk groups.
Notably, we further evaluated the relationship between risk score and the ICIs treatment response of HCC patients using two prediction algorithms: Immunophenoscore (IPS)22 and Tumor Immune Dysfunction and Exclusion (TIDE).23 These guidelines provide a reference for assessing the benefit of immunotherapy for patients receiving anti-PD-1 and anti-CTLA-4 antibodies.
Correlations Between the Risk Score Model and Tumor Mutation Burden and Drug Susceptibility
Somatic mutation data generated by the VarScan software in the “Masked Somatic Mutation” category were downloaded from TCGA. The R package “maftools” was used to summarize, analyze, annotate and visualize mutation annotation format (MAF) files of different risk groups. The Oncoplot waterfall plots were generated for the most frequently mutated genes in each group.
The drug susceptibility analyses were conducted using the R package “pRRophetic” with data from the Genomics of Drug Sensitivity in Cancer (GDSC) database to compare the half-maximum inhibitory concentration IC50 of the samples between high- and low-risk groups.
Quantitative Real-Time PCR (qRT-PCR)
Total RNA was extracted with TRIzol (Invitrogen, Carlsbad, CA) from sixteen paired HCC tumors and adjacent tissue samples stored at −80°C. The reverse transcription was performed using Transcription First Strand cDNA Synthesis Kit (Roche, Switzerland). The PCR was conducted by a LightCycler 480 Real-Time PCR System (Roche, Switzerland) using the SYBR GREEN I PCR MASTER MIX (Roche, Switzerland). β-actin was used as an internal control. The relative expression levels were calculated with the 2^−ΔΔCt method. The primer sequences were listed in Table S4.
Immunohistochemical (IHC) Assay, and Correlation and Survival Analyses
A total of 40 paired HCC tumor and adjacent tissue samples fixed by formalin and embedded in paraffin were used for IHC evaluation of AKR protein expression. The slides were dewaxed, rehydrated, blocked for endogenous peroxidase, underwent high-pressure antigen repairing, and incubated with anti-AKR1B10 (sc-365689, Santa Cruz, USA), anti-AKR1D1 (sc-373970, Santa Cruz, USA), anti-AKR7A3 (ab227231, Abcam, USA), anti-CD4 (A19018, Abclonal, China), anti-CD8 (ab199016, Abcam, USA), anti-CD68 (#76437, CST, USA), anti-PD-1 (#84651, CST, USA), anti-CTLA-4 (NB100-64849, Novus, USA), anti-TIM3 (#45208, CST, USA), and anti-TIGIT (ab243903, Abcam, USA) antibodies overnight at 4°C. Then, the slides were further incubated with a secondary antibody for 1 h at 37°C and treated with diaminobenzidine using the Dako REAL EnVision Detection System (K5007, DAKO, Denmark). Finally, the slides were counterstained with hematoxylin and observed under a light microscope (Leica, Germany). All indicators were assessed using the IHC score to quantify the expression levels. High, medium, low and negative expressions were assigned scores of 3, 2, 1, and 0, respectively. The IHC score for each tissue was derived from the mean scores of five random fields.
In addition, the clinicopathological information of these 40 HCC patients was retrospectively collected and summarized in Table S5. Based on the IHC score of the corresponding index in tumor tissue, all patients were divided into two groups of high and low expression. A cut-off value of 1.5 was used for most indicators, while 1.0 was used as a cut-off value for indicators with overall low expression levels including AKR7A3, PD-1, and CTLA-4. The correlation of AKR expression with multiple clinical factors was assessed by the chi-square test. Given that there were only 2 patients with death events during the follow-up period, the analytical efficacy of OS would be very limited. Hence, the impact of AKR protein expression levels on recurrence-free survival (RFS) was mainly analyzed by the Kaplan–Meier analyses. The correlation between AKR members and immune markers (CD4, CD8, CD68, PD-1, CTLA-4, TIM3, and TIGIT) were assessed by the Spearman analyses with IHC scores. The overall correlations among the clinicopathological factors, AKR expression, and immune-related markers were shown in a Sankey diagram plotted by the R package “ggalluvial”.
Statistical Analysis
The R software version 4.0.3 (https://www.r-project.org/) and SPSS software version 22 (IBM Corporation) were used to perform the statistical analyses. A p-value <0.05 (two-sided) was considered statistically significant.
Results
Identification of the Differential Expressed AKR Superfamily Genes in HCC
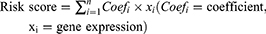
Of the 15 human AKR superfamily genes, only 10 AKR members were found with valid expressions both in the TCGA-LIHC and GSE14520 datasets. The differential expression analyses showed that eight AKR genes (AKR1B10, AKR1C1/2/3/4, AKR1D1, AKR7A2/3) were significantly dysregulated between HCC tumors and normal controls in the TCGA-LIHC cohort (Figure 1A and B). AKR1B10, AKR1C1/2/3, and AKR7A2 were upregulated (all p < 0.001), while AKR1C4 (p < 0.05), AKR1D1 (p < 0.001), and AKR7A3 (p < 0.001) were downregulated in HCC. No significant difference was found for AKR1A1 and AKR1B1 (all p > 0.05).
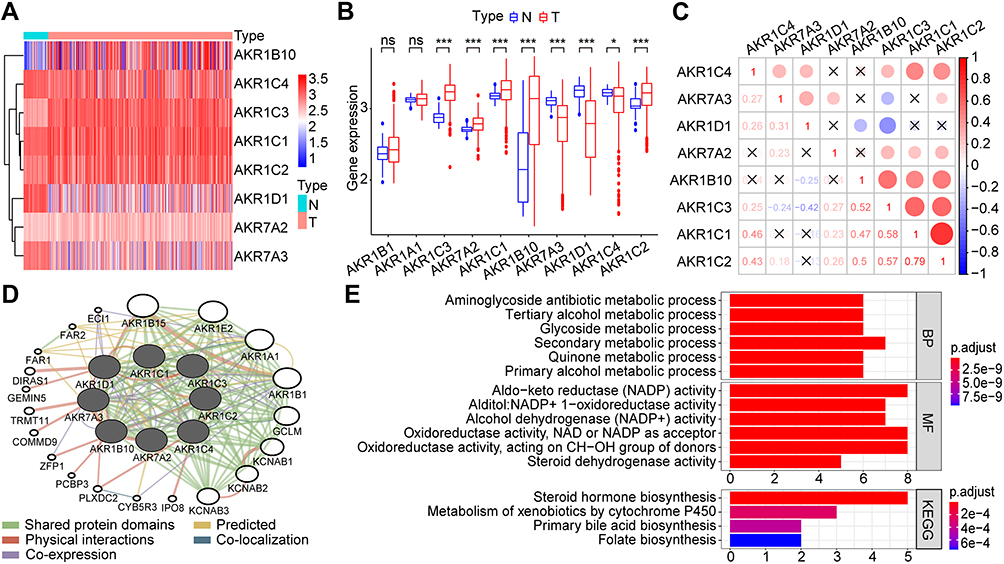 |
Figure 1 Identification of the differentially expressed AKR genes and functional analyses in HCC. (A and B) The expression profiles of differentially expressed AKR genes in the TCGA dataset with Heatmap (A) and bar plot (B). (C) The correlation network of differentially expressed AKR genes in HCC. (D) PPI network of differentially expressed AKR genes. (E) GO and KEGG analyses for the differentially expressed AKR genes. ns p > 0.05 *p < 0.05, ***p < 0.001. Abbreviations: AKR, aldo-keto reductase; HCC, hepatocellular carcinoma; TCGA, the Cancer Genome Atlas; PPI, protein–protein interaction; GO, Gene Ontology; BP, biological process; MF, molecular function; KEGG, Kyoto Encyclopedia of Genes and Genomes. |
The expression correlations between these differential AKR genes in HCC tumor samples were shown in Figure 1C. Significant correlations were found among most AKR genes. The positive correlation with the highest coefficient of 0.79 was identified between AKR1C1 and AKR1C2 (p < 0.05), while the negative correlation with the highest coefficient of −0.42 was identified between AKR1C3 and AKR1D1 (p < 0.05). There were three distinct AKR genes without significant correlation to AKR1B10 (AKR1C4, and AKR7A2/3), AKR1D1 (AKR1C1/2, and AKR7A2), or AKR7A2 (AKR1C4, AKR1D1, and AKR1B10), respectively (all p > 0.05). The PPI network analyses showed extensive physical interactions among these AKR members and with other proteins such as DIRAS1, GEMIN5, TRMT11, COMMD9, ZFP1, PCBP3, PLXDC2, and IPO8 (Figure 1D).
The functional analyses of these differential AKR genes in HCC were conducted with GO and KEGG enrichment (Figure 1E). The GO results indicated that the AKR genes might participate in several biological processes (BP) with metabolisms, such as aminoglycoside antibiotic, tertiary alcohol, primary alcohol, glycoside, and quinone metabolic process. The potential involved molecular functions (MF) of AKR genes were enriched to aldo-keto reductase (NADP) activity, alditol: NADP+ 1-oxidoreductase activity, alcohol dehydrogenase (NADP+) activity, oxidoreductase activity, and steroid dehydrogenase activity. The KEGG pathway analyses indicated the possible involvement of AKR genes in steroid hormone biosynthesis, metabolism of xenobiotics by cytochrome P450, primary bile acid biosynthesis, and folate biosynthesis.
Regulation Network Analyses of AKR Genes with DNA Methylation and Transcription Factors in HCC
To investigate the potential regulatory mechanisms of differential AKR gene expression in HCC, DNA methylation levels with CPG sites in the promoters of AKR genes were summarized and analyzed (Figure 2A). Only one CPG site was found in AKR1C1, AKR1C3, and AKR1C4 promoter, and the mean methylation level was relatively low (beta value < 0.5). There were two and three CPG sites found in AKR1C2 and AKR1B10 promoter, respectively. The mean methylation levels at cg00863716 for AKR1C2, cg06133921 and cg11693019 for AKR1B10 were all >0.5. More than 10 CPG sites were found in AKR1D1, AKR7A2, and AKR7A3. The mean methylation levels at cg00784105 for AKR7A2, cg09277575, cg17257469, and cg20518096 for AKR1D1 were all >0.75, whereas the methylation levels of all CPG sites in AKR7A3 were lower than 0.2. Then, the correlation between AKR gene expression and methylation level of each HCC sample was evaluated (Figure 2B). Results showed negative correlations were found in seven differential AKR genes (except for AKR1C4, all p < 0.05). Significant correlation was identified in AKR1D1, AKR1B10, and AKR1C2 with high coefficient of −0.45, −0.51, and −0.62, respectively. Hence, DNA methylation might play an important role in regulating the aberrant expression of AKR genes in HCC.
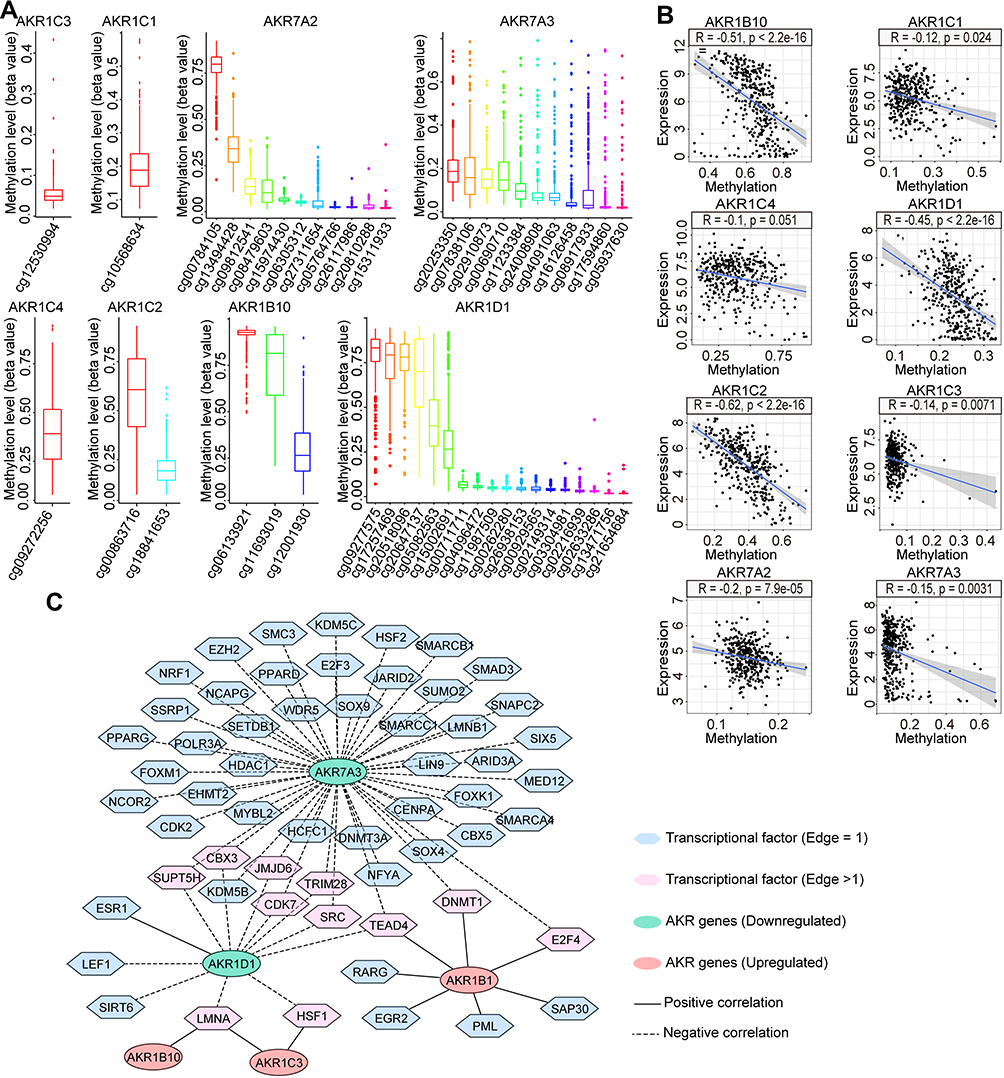 |
Figure 2 Regulation networks with DNA methylation and transcription factors for the differentially expressed AKR genes in HCC. (A) Methylation levels with different CPG sites of AKR genes in HCC from the TCGA dataset. (B) Correlations between the methylation levels and expressions of AKR genes in HCC. (C) Regulation network between tumor-related transcription factors and AKR genes in HCC. Abbreviations: AKR, aldo-keto reductase; HCC, hepatocellular carcinoma; TCGA, the Cancer Genome Atlas. |
In addition, we also analyzed the potential regulation network between TFs and AKR genes in HCC. After differential expression analyses in the TCGA-LIHC dataset, 120 out of 318 tumor-related TFs were screened out for correlation analyses with differentially expressed AKR genes. With the criteria of coefficient >0.3 and p < 0.001, a regulation network with 58 TFs and 5 AKR genes was established (Figure 2C). A total of 49, 12, and 7 TFs were correlated to AKR7A3, AKR1D1, and AKR1B1, respectively. Only one TF was found for AKR1B10, and two TFs for AKR1C3 were found. Among them, 11 TFs were identified with significant correlations with more than two AKR genes. LMNA showed correlation with AKR1B10, AKR1C3, and AKR1D1, while TEAD4 showed correlation with AKR1B1, AKR1D1, and AKR7A3. These findings indicated the complex regulation relationships between TFs and AKR genes in HCC.
Development and Validation of the Novel Risk Score Model Based on AKR Genes for OS of HCC Patients
The prognostic AKR genes were identified by univariate COX analyses, and five genes (AKR1B1, AKR1B10, AKR1C3, AKR1D1, and AKR7A3) with p < 0.05 were further enrolled into the multivariate COX analysis (Figure 3A). Finally, only three AKR genes were screened out to build the risk score model: AKR1B10 (hazard ratio (HR): 1.102, 95% confidence interval (CI): 1.035–1.174, p = 0.002), AKR7A3 (HR: 0.862, 95% CI: 0.778–0.956, p = 0.006), and AKR1D1 (HR: 0.932, 95% CI: 0.558–1.016, p = 0.110) (Figure 3B). The coefficient of AKR1B10, AKR7A3, and AKR1D1 was 0.097, −0.148, and −0.071, respectively. Based on the risk model, the risk score of each HCC patient both in the TCGA-LIHC (training) and GSE14520 (validation) cohorts was calculated. All patients were divided into high- and low-risk groups according to the median risk score. Survival analyses indicated that patients with high risk scores owned worse OS rates both in the training (p < 0.001, Figure 3C) and validation (p < 0.001, Figure 3D) cohorts. AUC of the risk model in predicting the 1-, 3-, and 5-year OS in the training cohort was 0.696, 0.641, and 0.631, respectively (Figure 3E). In the validation cohort, AUC for 1-, 3-, and 5-year OS was 0.633, 0.602, and 0.633, respectively (Figure 3F). In the TCGA cohort, the AUCs of risk score model for 1-, 3-, and 5-year OS were all higher than other indexes of AFP, pathological grade, and clinical stage. In the GSE14520 cohort, the AUCs of risk score model for 1-, 3-, and 5-year OS were higher than AFP, tumor diameter, and tumor number, while were less than the AUCs of clinical stage.
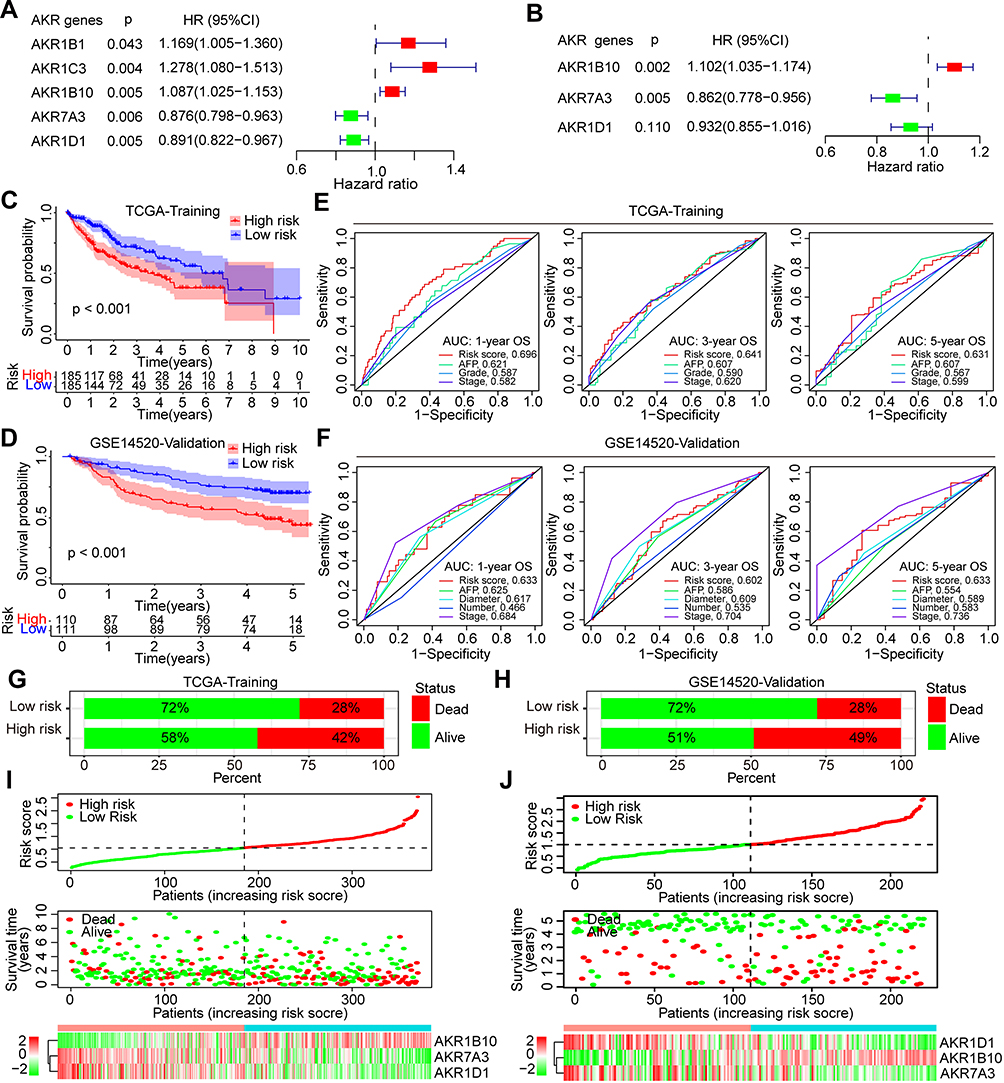 |
Figure 3 Development and validation of the novel risk score model based on AKR genes for HCC. (A) Univariate and (B) multivariate COX analyses for identification of the critical AKR genes with the TCGA dataset. Kaplan–Meier curves for the overall survival of HCC patients with different risk scores in the (C) TCGA (training) and (D) GSE14520 (validation) cohort. ROC curves of the risk model for prediction of the 1-, 3-, and 5-year overall survival in (E) TCGA and (F) GSE14520 cohort. Proportions of death events in different risk groups of the (G) TCGA and (H) GSE14520 cohort. Risk plots of the risk score, survival time, and AKR gene expression in the (I) TCGA and (J) GSE14520 cohort. Abbreviations: AKR, aldo-keto reductase; HCC, hepatocellular carcinoma; TCGA, the Cancer Genome Atlas; ROC, receiver operating characteristic; AUC, area under the curve. |
Besides, the proportions of death events in different risk groups were also analyzed both for the training and validation cohorts. In the TCGA-LIHC cohort, 42% (78/185) of HCC patients in the high-risk group died, while 28% (52/185) of patients died in the low-risk group during the follow-up period (Figure 3G). In the GSE14520 cohort, 49% (54/110) and 28% (31/111) HCC patients died in the high- and low-risk group, respectively (Figure 3H). The risk plots of both the training and validation groups showed clearly the risk score distribution, survival status, and expression of the three critical AKR genes of each HCC patient (Figure 3I and J). In both the TCGA and GSE14520 cohorts, AKR1B10 expression levels were higher in the high-risk group of HCC patients, whereas AKR1D1 and AKR7A3 were lower. Besides, more patients in the high-risk group experienced death events. These findings indicated that the risk score model based on AKR genes had a good capacity in discriminating and predicting the OS of HCC patients.
Furthermore, the prognostic significance of the risk score model was comprehensively analyzed in predicting DSS, DFI, PFI, PFS, and RFS in HCC patients. In the TCGA cohort, worse DFI was observed in high-risk patients (p = 0.032, Figure S1A), and the AUC for 1-, 3-, and 5-year DFI was 0.592, 0.569, and 0.635, respectively (Figure S1B). Worse DSS was also observed in high-risk patients (p = 0.014, Figure S1C), and the AUC for 1-, 3-, and 5-year DSS was 0.689, 0.660, and 0.607, respectively (Figure S1D). High-risk patients owned worse PFI (p = 0.017, Figure S1E), and the AUC for 1-, 3-, and 5-year PFI was 0.614, 0.578, and 0.606, respectively (Figure S1F). As for the PFS, worse survival was also found in high-risk patients (p < 0.001, Figure S1G), and the AUC for 1-, 3-, and 5-year PFS was 0.635, 0.590, and 0.622, respectively (Figure S1H). In the GSE14520 cohort, the prognostic value of the risk score model for RFS was assessed and worse survival was identified in high-risk group (p < 0.001, Figure S1I). The AUC for 1-, 3-, and 5-year RFS was 0.626, 0.597, and 0.602, respectively (Figure S1J).
Development and Validation of Prognostic Nomogram Based on Risk Score Model for OS of HCC Patients
First, univariate and multivariate Cox analyses were conducted to evaluate the independent prognostic values of the risk score model and other clinicopathological factors. In the TCGA-LIHC cohort, only the tumor stage (III–IV/I–II, HR: 1.680, 95% CI: 1.369–2.062, p < 0.001) and risk score (high/low, HR: 2.679, 95% CI: 1.867–3.844, p < 0.001) were identified by the univariate COX analyses (Figure 4A). These two factors (tumor stage: HR 1.604, 95% CI 1.297–1.982, p < 0.001; risk score: HR 2.324, 95% CI 1.634–3.306, p < 0.001) were also identified as significant prognostic indexes by the multivariate COX analysis (Figure 4B). In the GSE14520 cohort, tumor size (> 5/≤ 5cm, HR: 2.002, 95% CI: 1.300–3.083, p = 0.002), stage (III–IV/I–II, HR: 2.294, 95% CI: 1.730–3.042, p < 0.001), and risk score (high/low, HR: 1.628, 95% CI: 1.157–2.290, p = 0.005) were identified by the univariate COX analyses (Figure 4C), while only tumor stage (HR: 2.083, 95% CI: 1.513–2.866, p < 0.001) and risk score (HR: 1.492, 95% CI: 1.029–2.164, p = 0.035) were further identified as independent prognostic factors for OS of HCC by the multivariate COX analysis (Figure 4D). Hence, tumor stage and risk score model were selected to construct the prognostic nomogram for OS prediction of HCC patients.
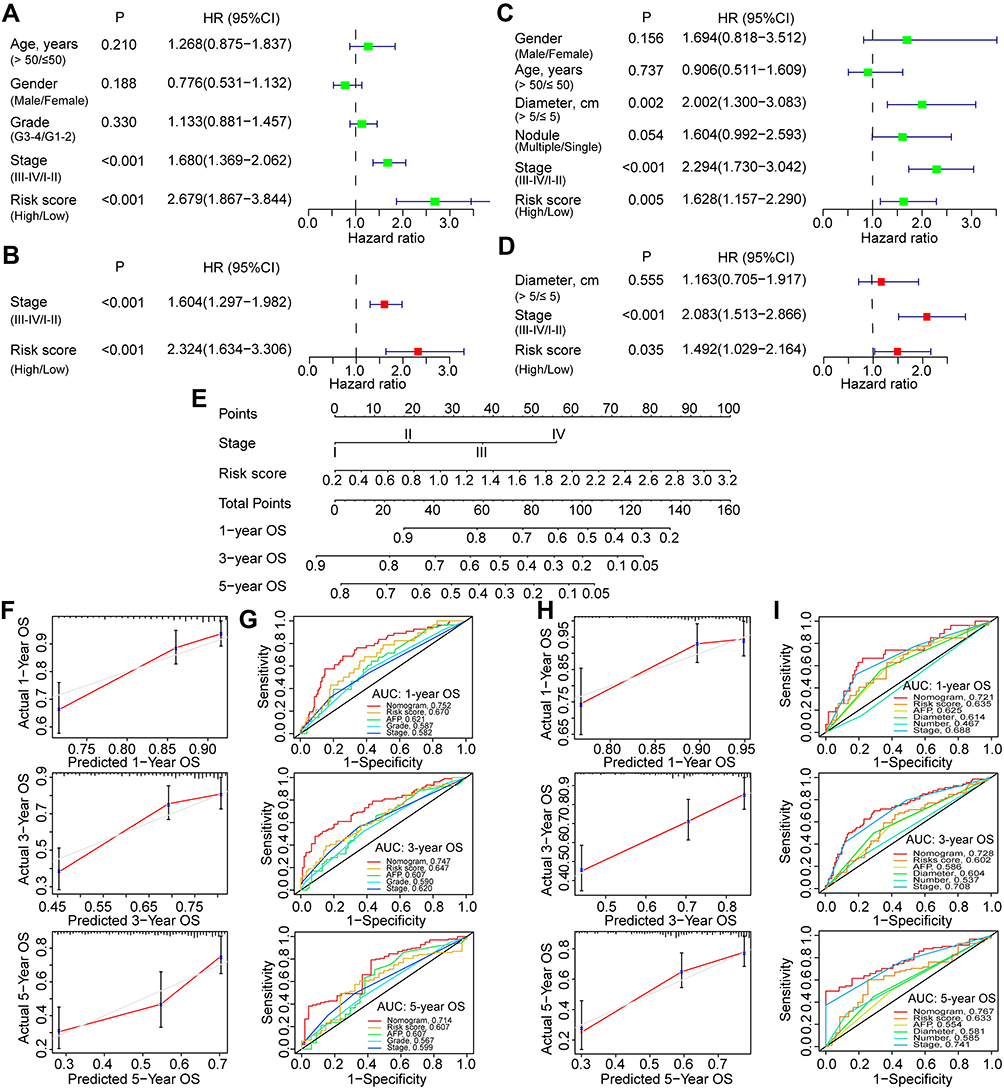 |
Figure 4 Construction and evaluation of a prognostic nomogram based on the risk model for HCC. (A) Univariate and (B) multivariate COX analyses for evaluation of the independent prognostic factors for overall survival of HCC in the TCGA cohort. (C) Univariate and (D) multivariate COX analyses for independent prognostic factors identification in the GSE14520 cohort. (E) Nomogram with risk score and clinical stage for prognostic prediction of HCC. Calibration and (G) time-dependent ROC curves for evaluation of the prognostic accuracy of the nomogram for the TCGA cohort. (H) Calibration and (I) time-dependent ROC curves for evaluation of the prognostic accuracy of the nomogram for the GSE14520 cohort. Abbreviations: HCC, hepatocellular carcinoma; TCGA, the Cancer Genome Atlas; ROC, receiver operating characteristic; AUC, area under the curve. |
Next, the prognostic nomogram was developed with tumor stage and risk score model (Figure 4E), which showed good efficacy in estimating the OS in the TCGA-LIHC with a high C-index of 0.679. The calibration curves for 1-, 3- and 5-year OS rates were also largely overlapped with the standard lines in the TCGA-LIHC (Figure 4F). The AUCs for predicting 1-, 3- and 5-year OS with nomogram in the TCGA-LIHC were 0.752, 0.744, and 0.701, respectively (Figure 4G). In the validation cohort with GSE14520, the C-index was 0.697, and the calibration curves were also well overlapped with the reference lines for 1-, 3- and 5-year OS estimation (Figure 4H). The AUCs for predicting 1-, 3- and 5-year OS with nomogram were 0.720, 0.741, and 0.778, respectively (Figure 4I). In both the TCGA and GSE14520 cohorts, the risk score-based nomogram showed superiority over single indicators in predicting 1-, 3-, and 5-year OS accompanied by the largest AUC values.
In addition, the ROC curve analyses were also utilized to evaluate the efficiency of this nomogram in predicting other endpoint events such as DFI (Figure S2A), DSS (Figure S2B), PFI (Figure S2C), PFS (Figure S2D), and RFS (Figure S2E) in HCC patients. Results showed that the nomogram also had superior predictive power and its performance was higher than other single indicators.
Correlation of AKR Genes and the Risk Score Model with Various Clinicopathological Factors in HCC
To further clarify the correlation between AKR genes and corresponding risk scores and clinicopathological factors in HCC patients, the correlation analyses were performed. In the TCGA dataset, the expressions of AKR1B10, AKR1D1, and AKR7A3 were all higher in patients with age >50 years and AFP ≤ 200ng/mL (all p < 0.05, Figure 5A). Higher expressions of AKR1B10 and AKR7A3 were observed in male patients (all p < 0.05, Figure 5A). Lower expressions of AKR1D1 and AKR7A3 were observed in patients with higher pathological grades (G3-4), and patients with advanced clinical stages (III–IV) also showed lower expression of AKR1B10, AKR1D1, and AKR7A3 (all p < 0.05, Figure 5A). Only AKR1D1 showed lower expression in patients with either microvascular or macrovascular invasion (all p < 0.05), while no significant difference was observed for AKR1B10 or AKR7A3 (all p > 0.05). For AKR genes expression in HCC with different viral hepatitis backgrounds, only AKR1B10 was found to be more expressed in the hepatitis C background than in patients without viral hepatitis (p < 0.05, Figure 5A). In the GSE14520 cohort, no significant difference was observed for AKR1B10, AKR1D1, and AKR7A3 in different subgroups of age (≤50/>50 years), gender (female/male), and tumor number (single/multiple) (all p > 0.05, Figure S3A). Lower expressions of AKR1B10 and AKR7A3 were observed in patients with AFP > 300ng/mL (all p < 0.05, Figure S3A). Lower expression of AKR1D1 was also found in patients with tumor diameter >5 cm (p < 0.05, Figure S3A). Lower expressions of AKR1D1 and AKR7A3 were also found in patients with advanced stages (III–IV) (all p < 0.05).
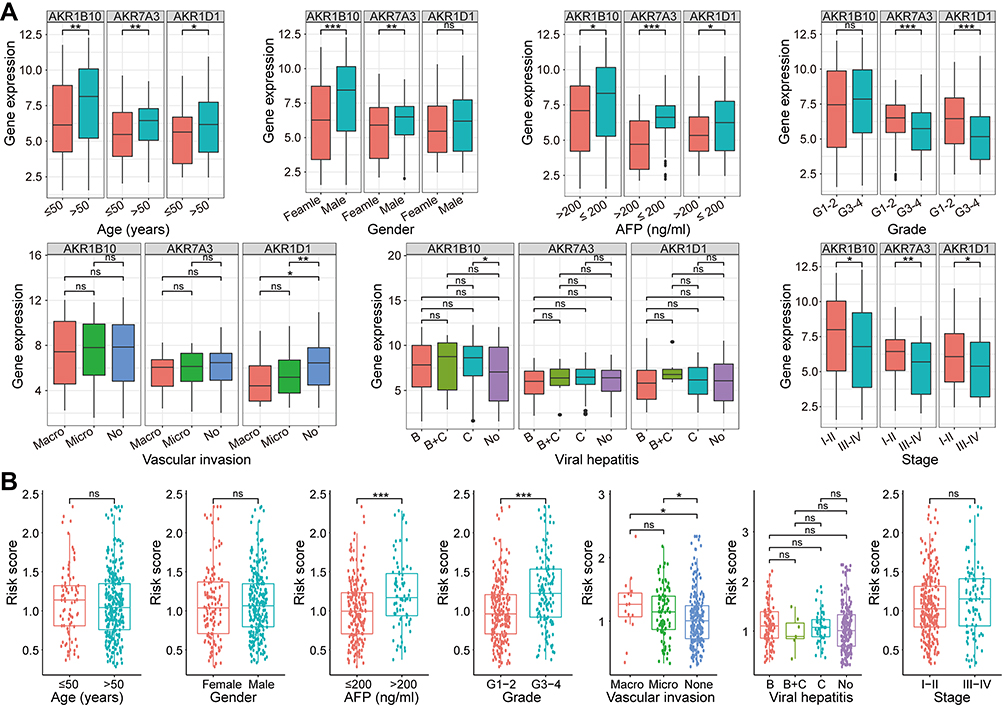 |
Figure 5 Correlations of AKR genes expression and risk scores and various clinicopathological factors of HCC in the TCGA cohort. (A) Correlations of the expression levels of AKR genes (AKR1B10, AKR1D1, and AKR7A3) and clinicopathological factors in HCC. (B) Correlations of the risk scores and clinicopathological factors in HCC. ns p > 0.05, *p < 0.05, ** p < 0.01, ***p < 0.001. Abbreviations: AKR, aldo-keto reductase; HCC, hepatocellular carcinoma; TCGA, the Cancer Genome Atlas. |
As for the AKR-based risk score model, higher risk scores were observed in patients from the TCGA cohort with higher AFP (>200 ng/mL), higher pathological grade (G3-4), and vascular invasion (micro or macro) (all p < 0.05, Figure 5B). No significant difference was found in different subgroups classified by age, gender, viral hepatitis, and clinical stage (all p > 0.05, Figure 5B). In the GSE14520 cohort, higher risk scores were only observed in patients with higher AFP (>300 ng/mL) and advanced stage (III–IV) (all p < 0.05, Figure S3B).
Subgroup Survival Analyses for HCC Patients with Various Clinicopathological Factors
To evaluate the significance of the risk score model in predicting the prognosis of HCC patients, we further performed subgroup survival analyses both in the training and validation cohorts. In the TCGA cohort, worse OS was observed in subgroup of patients with age ≤50 years (p = 0.027, Figure 6A), age >50 years (p = 0.004, Figure 6A), male (p < 0.001, Figure 6B), grade 1–2 (p = 0.007, Figure 6D), grade 3–4 (p = 0.023, Figure 6D), hepatitis B (p = 0.017, Figure 6E), no viral hepatitis (p < 0.001, Figure 6E), without vascular invasion (p = 0.028, Figure 6F), stage I–II (p = 0.023 Figure 6G), and stage III–IV (p = 0.002, Figure 6G), respectively. No significant difference of OS was observed in subgroup of patients with female (Figure 6B), AFP ≤ 200 ng/mL (Figure 6C), AFP > 200 ng/mL (Figure 6C), hepatitis C (Figure 6E), hepatitis B+C (Figure 6E), microvascular invasion (Figure 6F), or macrovascular invasion (Figure 6F) (all p > 0.05). In the GSE14520 cohort, worse OS was observed in subgroup of patients with age ≤50 years (p = 0.019, Figure S4A), age >50 years (p = 0.008, Figure S4A), male (p < 0.001, Figure S4B), AFP > 300 ng/mL (p = 0.004, Figure S4C), diameter ≤ 5 cm (p = 0.010, Figure S4D), diameter > 5 cm (p = 0.034, Figure S4D), single nodule (p < 0.001, Figure S4E), and stage I–II (p = 0.007, Figure S4F), respectively. No significant difference of OS was observed in subgroup of patients with female (Figure S4B), AFP ≤ 300 ng/mL (Figure S4C), multiple nodules (Figure S4E), or stage III–IV (Figure S4F) (all p > 0.05).
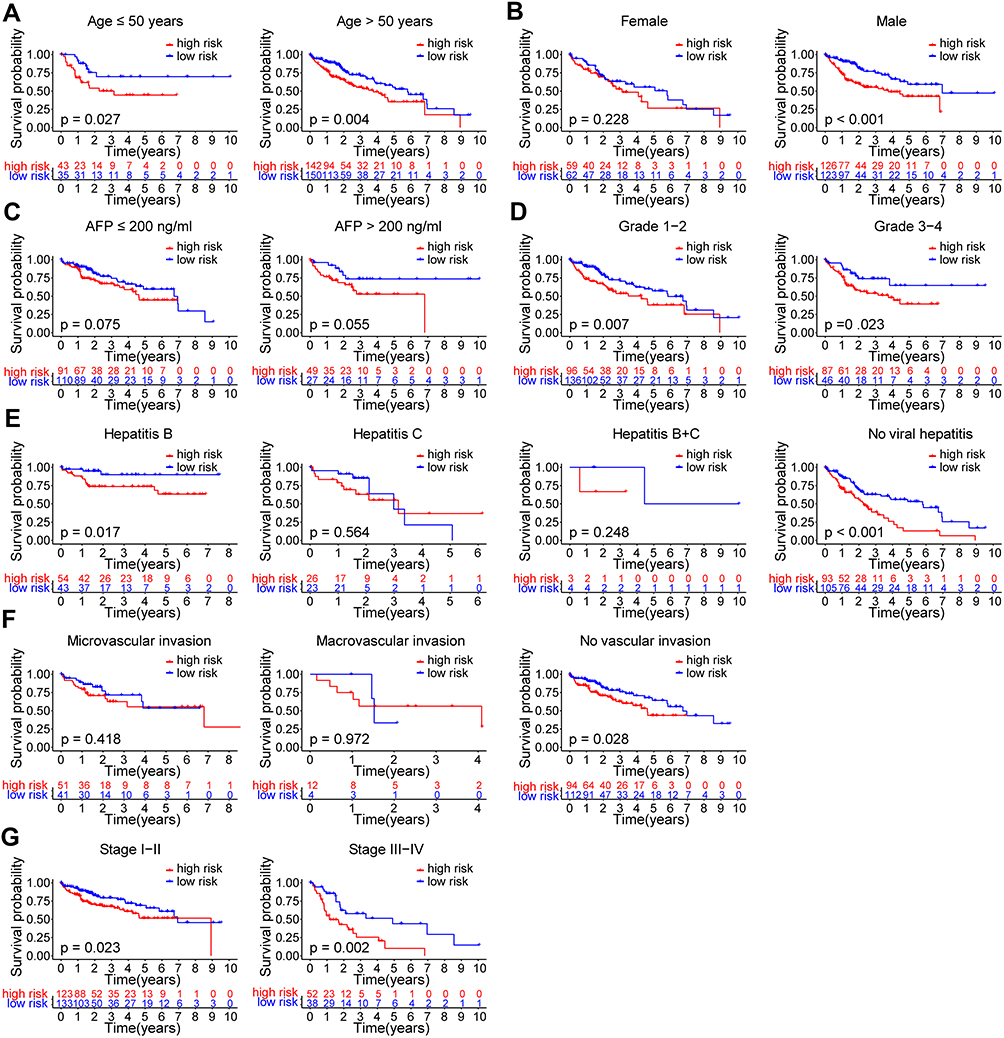 |
Figure 6 Subgroup survival analyses for OS of HCC patients in the TCGA cohort. Kaplan–Meier curves for OS of HCC patients in different subgroups divided by (A) age (≤ 50/> 50 years), (B) gender (female/male), (C) AFP (≤ 200/> 200 ng/mL), (D) pathological grade (G1-2/G3-4), (E) viral hepatitis (hepatitis B/hepatitis C/ hepatitis B+C/ no), (F) vascular invasion (micro/macro/no), (G) clinical stage (I–II/III–IV). Abbreviations: HCC, hepatocellular carcinoma; TCGA, the Cancer Genome Atlas; OS, overall survival; AFP, alpha-fetoprotein. |
GSEA for Different Risk Groups of HCC
GSEA could provide a reference for dysregulated pathways and hallmark signatures associated with AKR-based risk score model in HCC. With the KEGG analysis, specific pathways were found enriched in high-risk groups, such as aminoacyl tRNA biosynthesis, antigen processing and presentation, cytosolic DNA sensing, endocytosis, and FC-gamma R-mediated phagocytosis (Figure 7A). In low-risk group, multiple metabolism-related pathways were enriched, such as alanine aspartate and glutamate metabolism, drug metabolism, fatty acid metabolism, and primary bile acid biosynthesis (Figure 7B). As for the hallmark gene signatures in different risk groups, multiple hallmarks were found enriched in high-risk group with MYC target, MTORC1 signaling, PI3K/AKT/MTOR signaling, reactive oxygen species, apoptosis, hypoxia, glycolysis, p53, and G2/M checkpoint, while the gene sets of bile acid metabolism, xenobiotic metabolism, and fatty acid metabolism were enriched in low-risk group (Figure 7C).
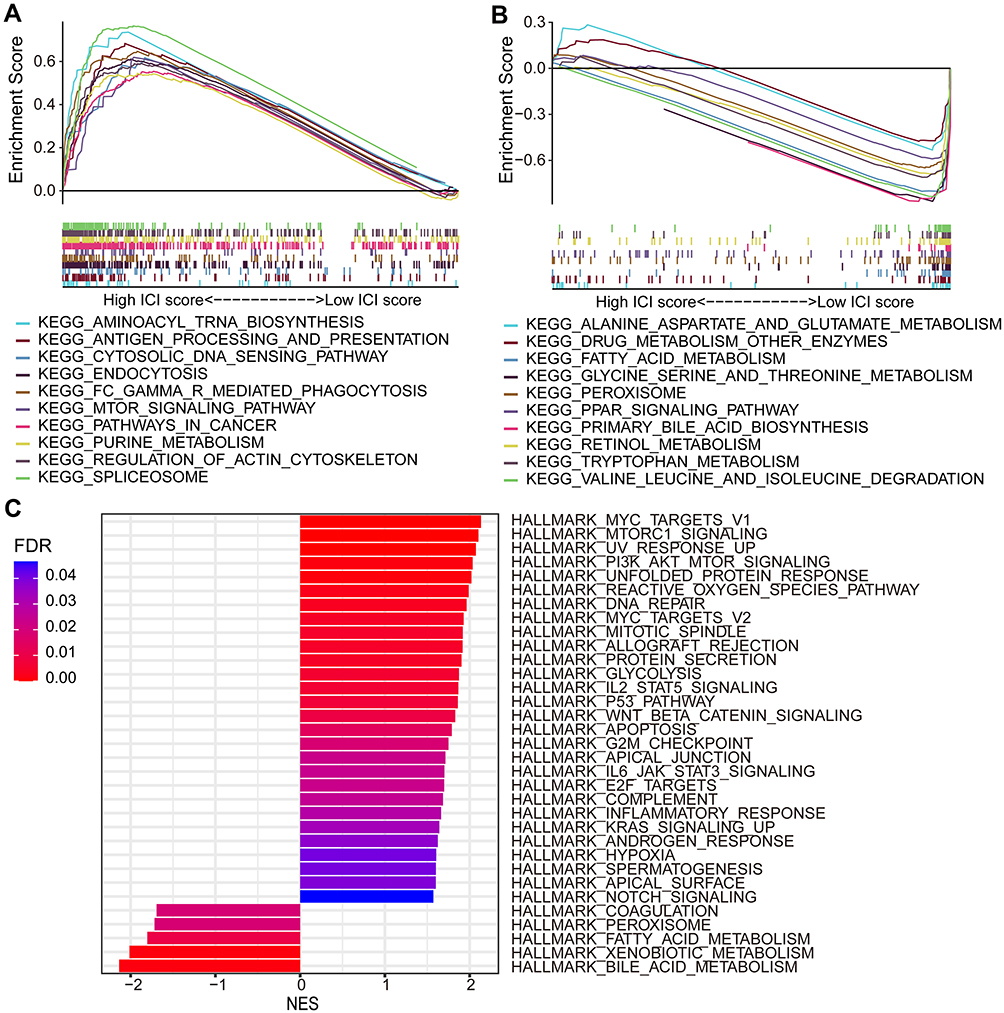 |
Figure 7 KEGG and hallmark gene sets enrichment analyses for high- and low- risk groups of HCC patients by GSEA. Enriched KEGG pathways in (A) high-risk group and (B) low-risk group. (C) Enriched hallmark gene signatures in high- and low-risk groups. Abbreviations: HCC, hepatocellular carcinoma; KEGG, Kyoto Encyclopedia of Genes and Genomes; GSEA, gene set enrichment analysis. |
Correlation Between Risk Score Model and Immune Genes Expression and Immune Cells Infiltration in HCC
To investigate the potential correlation between our risk score model with the tumor immune microenvironment, the immune-related genes with negative regulation of immune response were obtained and their expression profiles were extracted from the TCGA-LIHC dataset. The differentially expressed immune-related genes were compared and identified between high- and low-risk groups. Finally, 26 of 54 immune-related genes were found with significant differences and showed in a heatmap (all p < 0.05, Figure 8A). Some of the differential genes were immune checkpoint genes, such as PDCD1, CTLA4, HAVCR2, and TIGIT. Then, the correlations between risk scores and the expressions of above immune checkpoint genes were analyzed (Figure 8B). Positive correlations were found between risk scores and PDCD1 (R = 0.26, p = 2.9e-07), CTLA4 (R = 0.34, p = 1.7e-11), HAVCR2 (R = 0.29, p = 1.7e-08), and TIGIT (R = 0.21, p = 7.0e-05), and higher expression levels of these genes were all observed in high-risk groups (all p < 0.001).
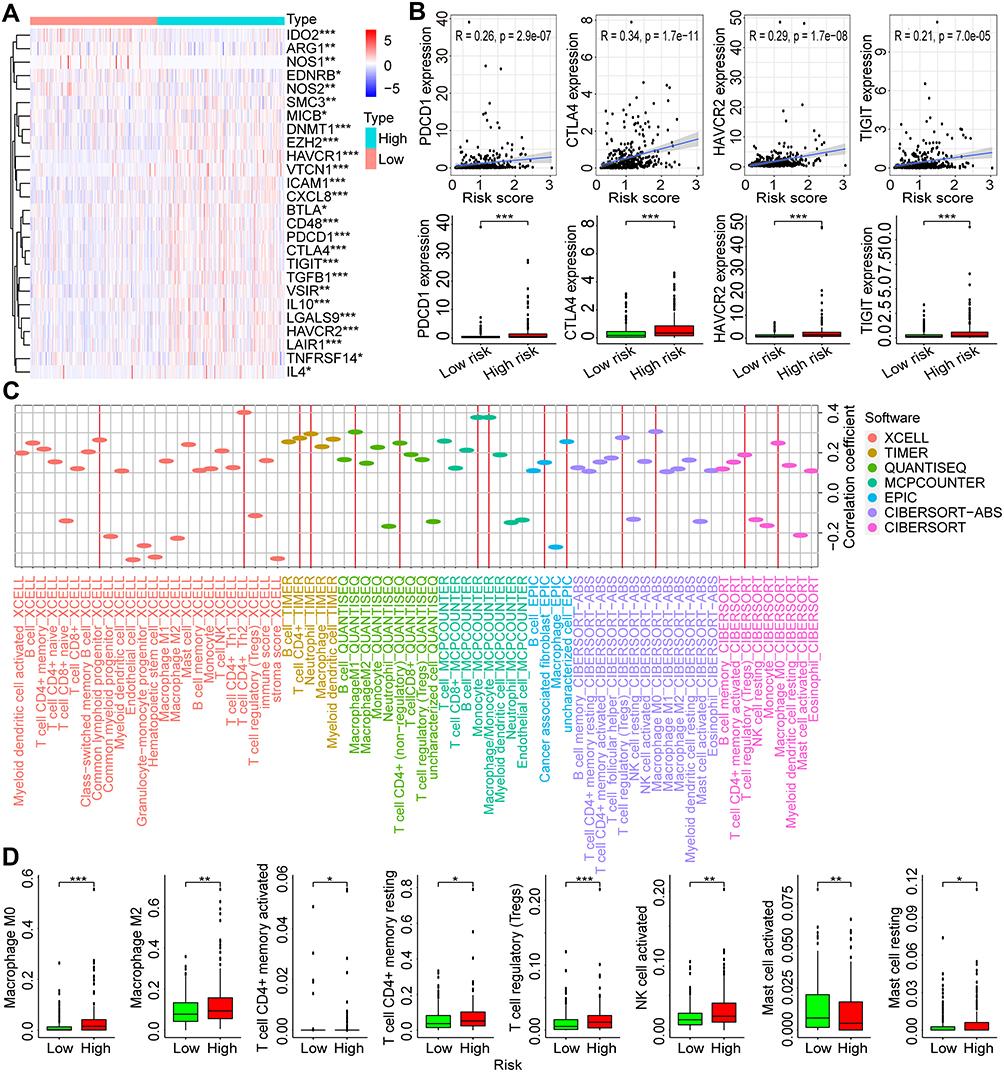 |
Figure 8 Correlations between the risk score and tumor immune microenvironment in HCC. (A) The differentially expressed negative-regulation immune genes in high- and low-risk groups of HCC in the TCGA dataset. (B) Correlations between the risk scores and the expression of PDCD1, CTLA4, HAVCR2, and TIGIT. (C) Correlations between risk scores and immune cells infiltration in HCC. (D) Infiltration levels of different immune cells estimated by the CIBERSORT-ABS software in high- and low-risk groups of HCC. *p < 0.05, **p < 0.01, ***p < 0.001. Abbreviations: HCC, hepatocellular carcinoma; TCGA, the Cancer Genome Atlas. |
The correlations between risk scores and immune cells in HCC were analyzed using the infiltration estimation data for TCGA from TIMER 2.0. The estimation data was calculated by seven software with XCELL, TIMER, QUANTISEQ, MCPCOUNTER, EPIC, CIBERSORT-ABS, and CIBERSORT. Positive correlations were observed between most types of immune cells and risk scores (Figure 8C). With the estimation strategy of CIBERSORT-ABS, higher infiltration frequency was observed in high-risk patients with M0 and M2 Macrophages, CD4+ memory resting and activated T cells, regulatory T cells, activated NK cells, and resting mast cells (all p < 0.05), whereas higher infiltration frequency was observed in low-risk patients with activated mast cells (p < 0.01) (Figure 8D). Hence, the dysregulated AKR genes might also participate in the regulation of tumor immune microenvironment in HCC.
To further assess the correlation between risk scores and immune cells and immune function in HCC, ssGSEA was subsequently performed in the TCGA dataset. Results showed that higher infiltration scores of multiple types of dendritic cells (DCs), macrophages, helper T cells (Th cells), tumor infiltrating lymphocytes (TILs), and regulatory T cells (Tregs) were found in high-risk group (all p < 0.05, Figure 9A). A variety of immune function scores were also higher in high-risk group, such as check-point, human leukocyte antigen (HLA), CC chemokine receptor (CCR), antigen-presenting cell (APC) co-stimulation, T-cell co-stimulation and co-inhibition (all p < 0.05, Figure 9B). The immune score and the ESTIMATE score were also higher in high-risk group (all p < 0.05, Figure 9C). HCC patients in the C2 (IFN-gamma dominant) immune subtype showed the highest risk score than other types (C1, wound healing; C2, inflammatory; and C3, lymphocyte depleted) (all p < 0.05, Figure 9D).
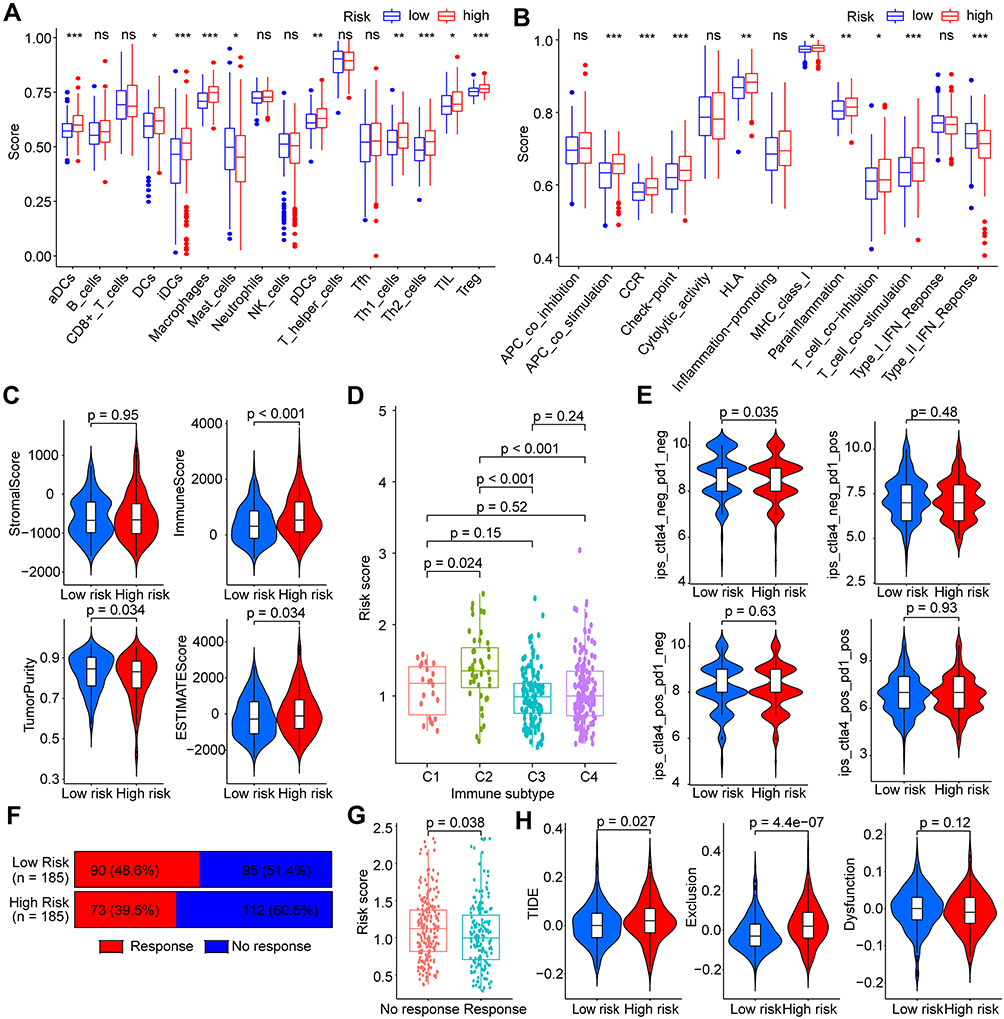 |
Figure 9 Correlations of risk score with immune characteristics and treatment response of ICIs in HCC. (A) Immune cell infiltration scores and (B) immune function scores in different risk groups estimated by ssGSEA. (C) Immune infiltration scores estimated by ESTIMATE algorithm. (D) Risk scores in different immune types of HCC. (E) IPS for prediction of potential benefits from anti-PD-1 and/or anti-CTLA-4 immunotherapy in different risk groups of HCC. (F) Proportions of potential responders estimated by TIDE algorithm in different risk groups. (G) risk scores in predicted potential responders and non-responders. (H) Scores of TIDE, Exclusion, and Dysfunction estimation by TIDE algorithm in different risk groups. ns p > 0.05, *p < 0.05, **p < 0.01, ***p < 0.001. Abbreviations: HCC, hepatocellular carcinoma; ICIs, immune checkpoint inhibitors; ssGSEA, single-sample gene set enrichment analysis; IPS, immunophenoscore; TIDE, Tumor Immune Dysfunction and Exclusion. |
Based on the close association between risk score and immunity, we further explored the potential relationship between risk score and immunotherapy response in HCC patients. Using the prediction algorithm of IPS, no significant differences were found in the effects of patients in the high- and low-risk groups receiving anti-PD-1 or anti-CTLA-4 alone or in combination (Figure 9E). When using the TIDE prediction rule for treatment response assessment, we found a higher proportion of potential responders in the low-risk group (48.6%) than in the high-risk group (39.5%) (Figure 9F). Risk scores for potential responders were significantly lower than for non-responders (p = 0.038, Figure 9G). Higher TIDE and Exclusion scores were found in patients of high-risk group (all p < 0.05), whereas no significant difference was found for Dysfunction score (p = 0.12) (Figure 9H). Therefore, AKR-based risk score model may be used to predict the possible benefit of treatment with ICIs in HCC patients.
Correlation Between Risk Score Model and Tumor Mutation Burden and Chemotherapeutic Susceptibility in HCC
To compare the mutation profile of different risk groups in the TCGA-LIHC cohort, Somatic mutation data of the top 20 genes with high mutation frequency was analyzed (Figure 10A and B). Results indicated that mutations were found in 79.78% (142/178) and 89.27% (158/177) of HCC samples in low- and high-risk groups. The mutation frequency of TP53 in high-risk group was higher than low-risk group (34% vs 21%), while the mutation frequency of CTNNB1 was lower in high-risk group (22% vs 29%). Other genes with mutation frequency higher than 5% in high-risk group were also found with MUC16 (17% vs 12%), CSMD3 (10% vs 4%), and ARID1A (10% vs 3%).
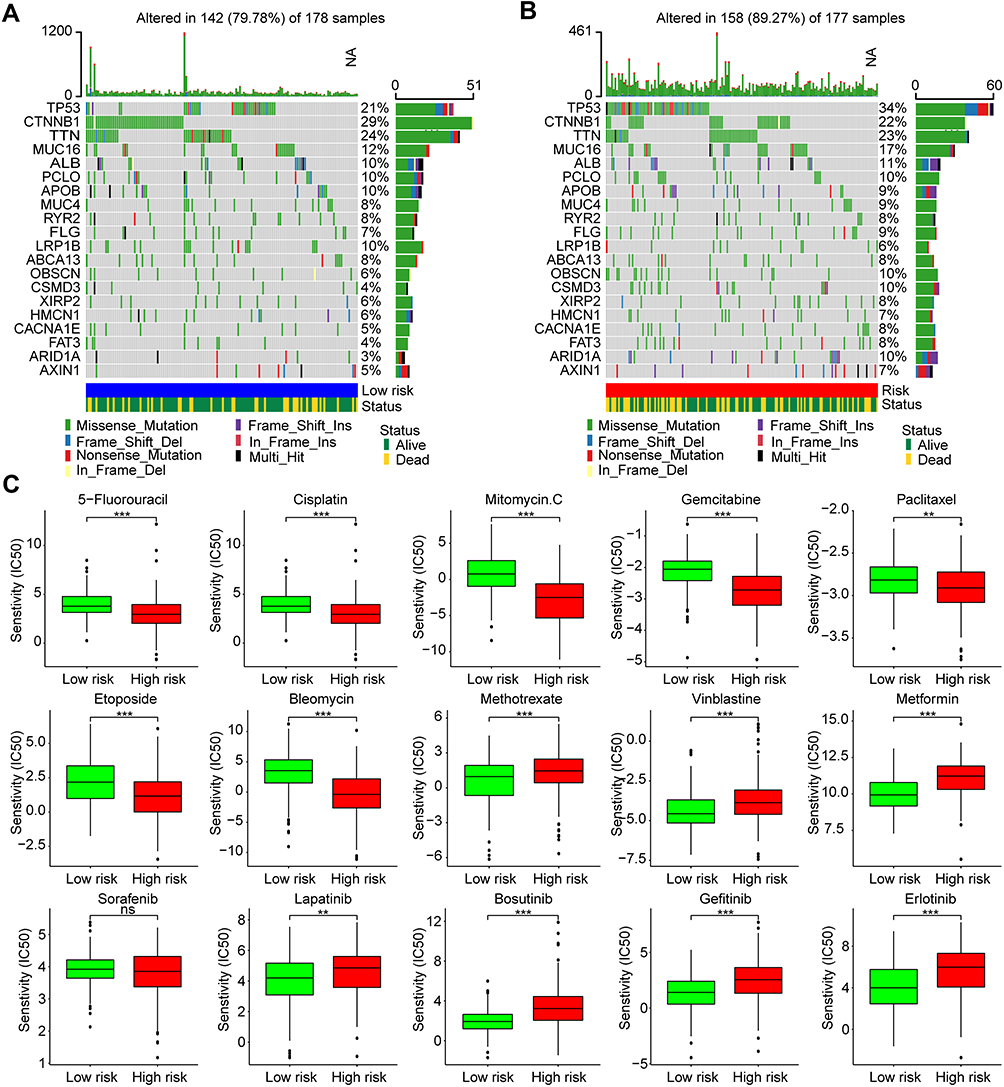 |
Figure 10 Somatic mutation profiles and drug susceptibilities of HCC in different risk groups. Oncoplots of the top 20 genes with high frequency of somatic mutations in the (A) low- and (B) high-risk groups of HCC from the TCGA dataset. (C) Susceptibilities to antitumor agents with IC50s between high- and low-risk groups of HCC. ns p > 0.05, **p < 0.01, ***p < 0.001. Abbreviations: HCC, hepatocellular carcinoma; TCGA, the Cancer Genome Atlas. |
In addition, we also analyzed the susceptibilities of several popular chemotherapeutics and multi-kinase inhibitors in the GDSC database to HCC in different risk groups to discriminate those who are sensitive to chemotherapy or targeted therapy. IC50s of multiple drugs between high- and low-risk groups were compared (Figure 10C). Results showed that patients in the high-risk group had lower IC50s of 5-fluorouracil, cisplatin, mitomycin C, gemcitabine, paclitaxel, etoposide, and bleomycin than those in the low-risk group (all p < 0.01), which suggested that patients with high risk may benefit more from chemotherapy. Besides, higher IC50s of methotrexate, vinblastine, metformin and multiple multi-kinase inhibitors (lapatinib, bosutinib, gefitinib, and erlotinib) were also found in the high-risk group (all p < 0.01). No significant difference was found for sorafenib between high- and low-risk groups (p > 0.05). These findings indicated the potential application of the AKR gene risk model in instruction for personalized HCC treatments.
Expression Validation of Critical AKR Members with Local HCC Samples
To further validate the expression profile of critical AKR members in HCC, paired tumor and adjacent tissue samples from our hospital were collected for experimental verification. The increased RNA expression of AKR1B10 (p < 0.01), and decreased expression of AKR1D1 (p < 0.01) and AKR7A3 (p < 0.001) in HCC tumors were verified by qRT-PCR in 16 patients (Figure 11A). Then, the protein expressions of these three AKR genes were validated by IHC with 40 paired tissue samples, and results also showed a higher level of AKR1B10, and lower levels of AKR1D1 and AKR7A3 in HCC tumors (all p < 0.001, Figure 11B). Representative immunohistochemical staining of AKR1B10, AKR1D1, and AKR7A3 with negative, low, medium, and high expression patterns were exhibited in Figure 11C. Due to the constitutive expression of AKR1D1 in liver, no adjacent sample staining with negative expression was found in our validation cohort. Then, all patients were divided into high and low expression groups based on the IHC scores of these AKR proteins, respectively. Correlation analyses between AKR proteins expression and clinicopathological factors showed that only AKR1D1 was strongly correlated with clinical stage (p = 0.037), while there were no significant correlations between AKR1B10 and AKR7A3 and various clinical factors (all p > 0.05) (Table S5). Kaplan–Meier analysis showed no significant difference in RFS between high and low expression groups of AKR1B10 (p = 0.259), AKR1D1 (p = 0.422) and AKR7A3 (p = 0.831) (Figure 11D). However, patients with high expression of AKR1B10 showed a tendency to have worse RFS.
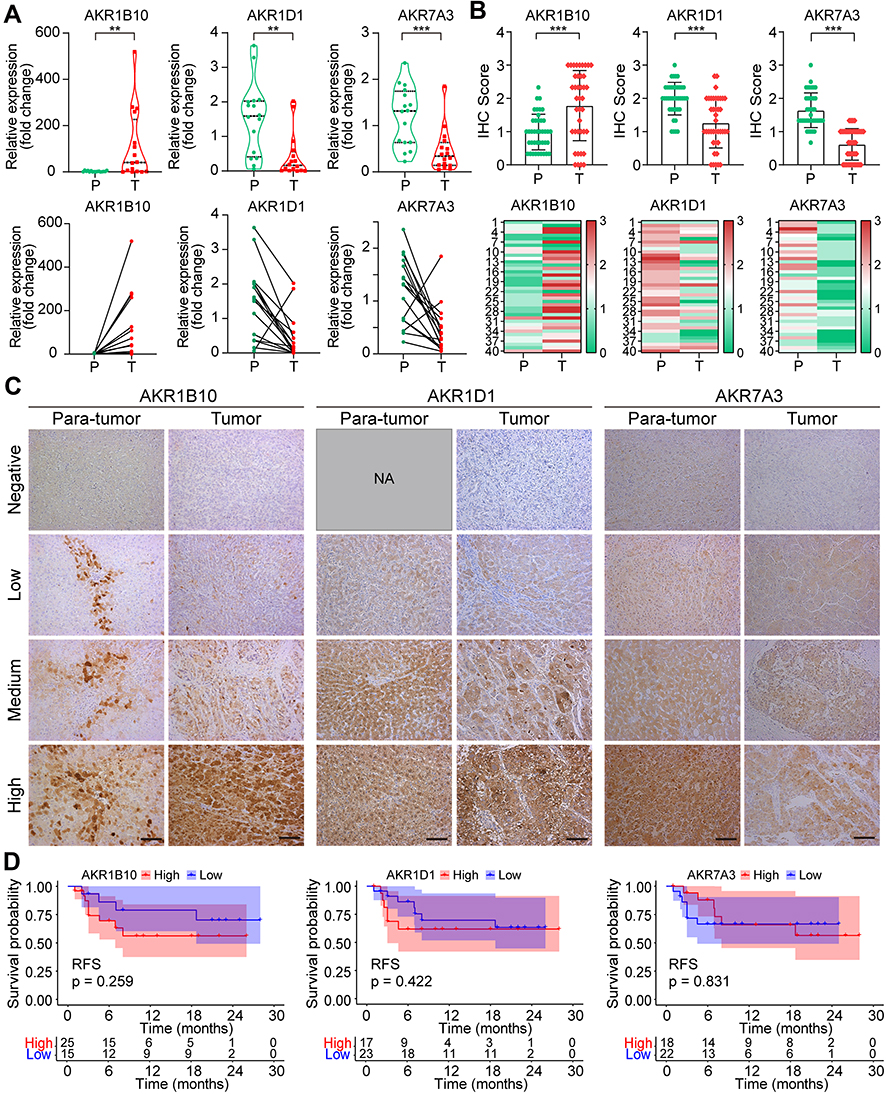 |
Figure 11 Validation of the expression profile and prognostic significance of critical AKR members in HCC tissues by qRT-PCR and IHC. (A) RNA expression profiles of three critical AKR genes in paired tumors and para-tumor tissues from 16 HCC patients. (B) Protein expression profiles of three critical AKR members in paraffin-embedded tissues from 40 HCC patients. (C) Representative IHC staining of AKR members in HCC tumor and para-tumor tissues. (D) Kaplan–Meier curves of high- and low-expression of AKR members for RFS of HCC patients. **p < 0.01, ***p < 0.001. Abbreviations: AKR, aldo-keto reductase; HCC, hepatocellular carcinoma; qRT-PCR, quantitative real-time polymerase chain reaction; IHC, immunohistochemistry; RFS, recurrence-free survival; NA, not available. |
In addition, we further examined the expression of immunomarkers (CD4, CD8, CD68, PD-1, CTLA-4, TIM3, and TIGIT) in HCC tumors using IHC and quantified their expression levels using IHC scores. Representative images of different expression levels (high, medium, low, and negative) of each index are shown in Figure 12A. The expression correlation between AKR protein and immune markers in HCC is shown in Figure 12B. The expression of AKR1D1 in tumors showed a significant positive correlation with both AKR7A3 (R = 0.38, p = 0.024) and AKR1B10 (R = 0.48, p = 0.0011), and a negative correlation with CD4 (R = −0.42, p = 0.012) (Figure 12C). On the other hand, AKR1B10 showed a significant positive correlation with TIGIT (R = 0.33, p = 0.043) (Figure 12C). When converted to two classifications with high and low expression, correlation analyses between AKR proteins and immunomarkers are summarized in Table S6. Low expression of AKR7A3 was found to be significantly associated with high expression of CD68 in HCC (p = 0.013). Finally, the overall correlations between clinical factors, AKR members and immune markers in this validation cohort are presented in Figure S5.
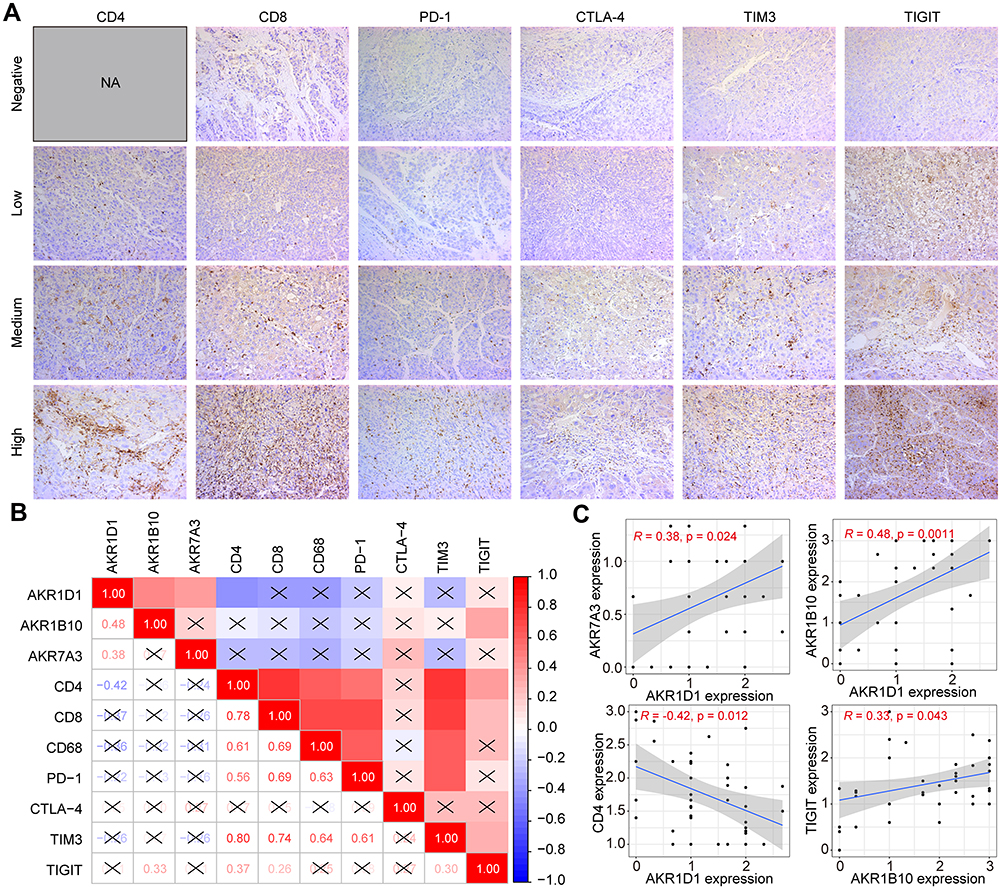 |
Figure 12 Expression profiles of immune markers and their correlation with AKR members in HCC. (A) Representative IHC staining of immune markers in HCC tumors. (B and C) Correlations of immune markers with AKR members in HCC with IHC scores. Abbreviations: AKR, aldo-keto reductase; HCC, hepatocellular carcinoma; IHC, immunohistochemistry; NA, not available. |
Discussion
As a malignant tumor with poor prognosis, it is still of great significance to investigate the pathogenesis and prognostic factors of HCC.2 The AKR superfamily members are mainly involved in the preliminary oxidation-reduction reactions of carbonyl substrates, which have been proposed with significant roles in multiple pathophysiological processes, as well as in various tumors including HCC.8 However, investigation on the expression, regulation, and prognostic significance of AKR members in HCC from the perspective of the whole superfamily is still lacking. In the present study, the expression profile of AKR superfamily genes in HCC was comprehensively evaluated with potential regulation networks of DNA methylation and TFs. The functional enrichment analyses were also employed to explore the role of dysregulated AKR genes in hepatoma. Based on these mechanical findings, the prognostic significance of AKR members in HCC was further investigated and three critical AKR genes (AKR1B10, AKR1D1, and AKR7A3) were identified to build a novel risk score model. In combination with the clinical stage of HCC, a prognostic nomogram based on the AKR risk score was constructed and validated with superior performance in predicting the prognosis of HCC patients. Notably, the risk score model was revealed significant correlations with negative-regulation immune gene expression, immune cell infiltration, immune types, ICIs treatment response, somatic mutation, and drug susceptibilities of HCC. These findings provide a comprehensive overview to reveal the potential mechanisms and clinical significance of AKR superfamily members in the development and progression of HCC.
AKR, as a superfamily containing multiple enzymes, has a broad substrate spectrum and are involved various redox processes such as biosynthesis, intermediary metabolism and detoxification.9 A variety of factors have been found to affect the expression of AKR genes and the maintenance of their enzymatic activities. Substantial amounts of exogenous substrates such as drugs and food and environmental pollutants can enter the body through the dietary route, most of which contain reactive carbonyl compounds and aldehydes. Considering that multiple stimuli from diet such as alcohol consumption and aflatoxin intake have been identified as risk factors for the development of HCC, AKR alterations induced by dietary influences may play an important role in the development of HCC. Besides, preliminary analysis of AKR genomic promoter sequences also revealed the presence of multiple cis-regulatory elements, such as osmotic response elements (ORE), antioxidant response elements (ARE), phorbol ester response element (TRE), steroid response elements (SRE), and xenobiotic response elements (XRE).24 Binding of NFAT5 to ORE in the AKR1B1 promoter regulates its expression.25 Activating-protein 1 transcription factors (c-Jun and c-fos) could interact with the TRE in AKR1B1 and AKR1C1 genes.26 The ARE located in AKR1C1-AKR1C3 promoters could be trans-activated by NRF2.27 In the present study, we identified multiple TFs associated with aberrantly expressed AKRs in HCC using co-expression networks. The corresponding genes of these transcription factors are all aberrantly expressed in HCC, so their regulation roles on AKR may be tumor specific and need to be further explored. Moreover, we also found that the modification of methylation had an important role in the aberrant expression of AKR genes in HCC. The expression of multiple AKR genes (AKR1B10, AKR1D1, and AKR1C2) showed a significant negative correlation with the hypermethylation level of their genes. This provides a new potential mechanism for the regulation of AKR expression. On the other hand, the PPI network further revealed proteins that had potential interactions with AKR members, such as TRMT11, GEMIN5, DIRAS1, and COMMD9, which provided a possible interaction mechanism of AKR in HCC.
As one critical AKR member identified in our study, AKR1D1, also named as steroid 5β-reductase, is the only enzyme of the AKR1D subfamily found in humans.28 It is expressed mainly in liver and catalyzes the reduction of Δ4-3-ketosteroids and produces dihydrosteroids, which involves the inactivation of steroid hormones and the biosynthesis of bile acids.18,29 The mutation of AKR1D1 will suppress the transformation of 7α-hydroxycholestenone to bile acid precursors and lead to bile acid deficiency.30,31 Knockdown of AKR1D1 in human liver cells could also cause reduced primary bile acid biosynthesis and steroid hormone elimination.32 Recently, AKR1D1 was found to be involved in regulating the metabolic phenotype of hepatocytes by inducing de novo lipogenesis and inhibiting β-oxidation in non-alcoholic fatty liver disease.32 Besides, decreased expression of AKR1D1 was also identified in diabetic patients.33 However, the investigation on the role of AKR1D1 in cancer is still limited. Zhu et al revealed a decreased AKR1D1 expression in HCC using the RNA-sequencing data from TCGA and the tissue samples from their hospital, which was consistent with our findings. In the present study, the downregulated expression of AKR1D1 was tested and validated in independent transcriptome datasets of HCC. Besides, a new cohort from our institution was also obtained for further validating the RNA and protein expression of AKR1D1 in HCC, which revealed the crucial role of AKR1D1 in hepatoma.
AKR1B10 has been implicated in regulating the metabolic processes of cytotoxic carbonyls, synthesis of retinol and fatty acid, and lipid metabolism. Previous studies have revealed the significant role of AKR1B10 in various tumors, such as nasopharyngeal carcinoma, non-small cell lung carcinomas, breast cancer, colon cancer, and pancreatic cancer.34–38 For HCC, plenty of evidence has characterized the dysregulation of AKR1B10 in HCC.39–45 In a large-scale proteome quantification of HCC, AKR1B10 was identified as a significantly dysregulated protein involved in HCC pathology.46 Besides, as a secretory protein, AKR1B10 was also proposed and validated as a significant serum marker for HCC diagnosis in a large-scale multicenter study from China, which showed a better performance than traditional alpha-fetoprotein.47 However, the expression of AKR1B10 in HCC seems to have a dynamic alteration, which refers to a significantly up-regulated pattern in early HCC, whereas a decreased level in advanced HCC.43 Besides, its expression might also be related to the tumor pathological differentiation, liver cirrhosis, HBV status, and age48 which was summarized in a recent systemic review.49 In the present study, AKR1B10 was identified as a significant prognostic gene for HCC by the transcriptome data from the public database. Besides, its RNA and protein expression levels were further validated in HCC samples from our institution by PCR and IHC, and the results proved the elevated expression of AKR1B10 in HCC, which indicated its critical role in tumor development and progression.
AKR7A3, as one of the AKR7A subfamily members, is a crucial reductase responsible for detoxification of aflatoxin aldehydes, which protects against aflatoxin B1-induced cytotoxicity and tumorigenesis.8,20 Besides, AKR7A3 was suggested in participation with protection from acetaminophen-induced oxidative stress and hepatotoxicity, and could be induced by NRF2 in the presence of antioxidants.50 The role of AKR7A3 in tumors has also been investigated in several previous studies. Hlavac et al found that AKR7A3 was upregulated in breast tumor and higher AKR7A3 protein level was also identified in estrogen receptor-positive breast cancer.51,52 Chow et al found that AKR7A3 was down-regulated in HCC, which was consistent with our results.53 In their study, lower RNA and protein level of AKR7A3 was tested in HCC than in the normal liver, and was related to worse OS and pathological tumor differentiation. The cellular assays further validated its suppressive functions in hepatoma cell migration and invasion. Besides, they found that AKR7A3 was also involved in regulating the tumor apoptosis induced by cisplatin. In the present study, the AKR7A3 RNA level was further validated downregulated both in the HCC transcriptome data and the specimens from our institution by PCR, and its suppressed protein expression in HCC was also proven in our samples by IHC. Besides, AKR7A3 was further identified as a significant prognostic factor for OS of HCC patients both in the training and validation cohorts. These findings indicated that AKR7A3 might act as a tumor suppressor gene and play a significant role in HCC, and the potential mechanisms worth further investigation.
Nevertheless, there are some limitations to our study. First, the data used for analysis and the model established for prognosis prediction were based on the transcriptome data from TCGA. Though the results were validated with another independent dataset, more cohorts are needed. Second, the number of HCC samples used for local validation is relatively small, and more cases need to be added for more accurate verification. Third, the specific role of three critical AKR family members in HCC need further investigation with functional and molecular experiments in vitro and in vivo.
Conclusion
In summary, multiple dysregulated AKR superfamily genes and the potential regulation networks with DNA methylation and TFs were identified in HCC. A novel risk score model based on three critical AKR genes was further developed and validated with superior performance in predicting prognosis of HCC patients. Besides, significant correlations of tumor immune microenvironment, somatic mutations, and chemotherapeutic susceptibilities were also found with the risk model.
Data Sharing Statement
All data used in this study were acquired from The Cancer Genome Atlas (TCGA) and the Gene Expression Omnibus (GEO) portal.
Acknowledgments
The authors are truly grateful to the TCGA and GEO databases for the data sharing policy.
Funding
This work was supported by the Science and Technology Program of Guangdong Province (No. 2019B020236003), national (No. 81770648, 81972286), and Guangdong Natural Science Foundation (No. 2015A030313038, 2015A030312013).
Disclosure
The authors report no conflicts of interest in this work.
References
1. Llovet JM, Kelley RK, Villanueva A, et al. Hepatocellular carcinoma. Nat Rev Dis Primers. 2021;7(1):6. doi:10.1038/s41572-020-00240-3
2. Yang JD, Heimbach JK. New advances in the diagnosis and management of hepatocellular carcinoma. BMJ. 2020;371:m3544. doi:10.1136/bmj.m3544
3. Akinyemiju T, Abera S; Global Burden of Disease Liver Cancer C. The burden of primary liver cancer and underlying etiologies from 1990 to 2015 at the global, regional, and national level: results from the global burden of disease study 2015. JAMA Oncol. 2017;3(12):1683–1691. doi:10.1001/jamaoncol.2017.3055.
4. Llovet JM, Montal R, Sia D, Finn RS. Molecular therapies and precision medicine for hepatocellular carcinoma. Nat Rev Clin Oncol. 2018;15(10):599–616. doi:10.1038/s41571-018-0073-4
5. Gordan JD, Kennedy EB, Abou-Alfa GK, et al. Systemic Therapy for Advanced Hepatocellular Carcinoma: ASCO Guideline. J Clin Oncol. 2020;38(36):4317–4345. doi:10.1200/JCO.20.02672
6. Llovet JM, De Baere T, Kulik L, et al. Locoregional therapies in the era of molecular and immune treatments for hepatocellular carcinoma. Nat Rev Gastroenterol Hepatol. 2021;18(5):293–313. doi:10.1038/s41575-020-00395-0
7. Pinter M, Jain RK, Duda DG. The Current Landscape of Immune Checkpoint Blockade in Hepatocellular Carcinoma: a Review. JAMA Oncol. 2021;7(1):113–123. doi:10.1001/jamaoncol.2020.3381
8. Penning TM. The aldo-keto reductases (AKRs): overview. Chem Biol Interact. 2015;234:236–246. doi:10.1016/j.cbi.2014.09.024
9. Mindnich RD, Penning TM. Aldo-keto reductase (AKR) superfamily: genomics and annotation. Hum Genomics. 2009;3(4):362–370. doi:10.1186/1479-7364-3-4-362
10. Sanli G, Dudley JI, Blaber M. Structural biology of the aldo-keto reductase family of enzymes: catalysis and cofactor binding. Cell Biochem Biophys. 2003;38(1):79–101. doi:10.1385/CBB:38:1:79
11. Penning TM, Wangtrakuldee P, Auchus RJ. Structural and Functional Biology of Aldo-Keto Reductase Steroid-Transforming Enzymes. Endocr Rev. 2019;40(2):447–475. doi:10.1210/er.2018-00089
12. Rizner TL, Penning TM. Role of aldo-keto reductase family 1 (AKR1) enzymes in human steroid metabolism. Steroids. 2014;79:49–63. doi:10.1016/j.steroids.2013.10.012
13. Alshogran OY. Pharmacogenetics of aldo-keto reductase 1C (AKR1C) enzymes. Expert Opin Drug Metab Toxicol. 2017;13(10):1063–1073. doi:10.1080/17425255.2017.1376648
14. Zeng CM, Chang LL, Ying MD, et al. Aldo-Keto Reductase AKR1C1-AKR1C4: functions, Regulation, and Intervention for Anti-cancer Therapy. Front Pharmacol. 2017;8:119. doi:10.3389/fphar.2017.00119
15. Khayami R, Hashemi SR, Kerachian MA. Role of aldo-keto reductase family 1 member B1 (AKR1B1) in the cancer process and its therapeutic potential. J Cell Mol Med. 2020;24(16):8890–8902. doi:10.1111/jcmm.15581
16. Huang L, He R, Luo W, et al. Aldo-Keto Reductase Family 1 Member B10 Inhibitors: potential Drugs for Cancer Treatment. Recent Pat Anticancer Drug Discov. 2016;11(2):184–196. doi:10.2174/1574892811888160304113346
17. Chen M, Drury JE, Penning TM. Substrate specificity and inhibitor analyses of human steroid 5beta-reductase (AKR1D1). Steroids. 2011;76(5):484–490. doi:10.1016/j.steroids.2011.01.003
18. Di Costanzo L, Drury JE, Penning TM, Christianson DW. Crystal structure of human liver Delta4-3-ketosteroid 5beta-reductase (AKR1D1) and implications for substrate binding and catalysis. J Biol Chem. 2008;283(24):16830–16839. doi:10.1074/jbc.M801778200
19. Zhou R, Liu M, Liang X, Su M, Li R. Clinical features of aflatoxin B1-exposed patients with liver cancer and the molecular mechanism of aflatoxin B1 on liver cancer cells. Environ Toxicol Pharmacol. 2019;71:103225. doi:10.1016/j.etap.2019.103225
20. Bodreddigari S, Jones LK, Egner PA, et al. Protection against aflatoxin B1-induced cytotoxicity by expression of the cloned aflatoxin B1-aldehyde reductases rat AKR7A1 and human AKR7A3. Chem Res Toxicol. 2008;21(5):1134–1142. doi:10.1021/tx7004458
21. Liu J, Lichtenberg T, Hoadley KA, et al. An Integrated TCGA Pan-Cancer Clinical Data Resource to Drive High-Quality Survival Outcome Analytics. Cell. 2018;173(2):400–416 e411. doi:10.1016/j.cell.2018.02.052
22. Charoentong P, Finotello F, Angelova M, et al. Pan-cancer Immunogenomic Analyses Reveal Genotype-Immunophenotype Relationships and Predictors of Response to Checkpoint Blockade. Cell Rep. 2017;18(1):248–262. doi:10.1016/j.celrep.2016.12.019
23. Fu J, Li K, Zhang W, et al. Large-scale public data reuse to model immunotherapy response and resistance. Genome Med. 2020;12(1):21. doi:10.1186/s13073-020-0721-z
24. Penning TM, Drury JE. Human aldo-keto reductases: function, gene regulation, and single nucleotide polymorphisms. Arch Biochem Biophys. 2007;464(2):241–250. doi:10.1016/j.abb.2007.04.024
25. Ko BC, Ruepp B, Bohren KM, Gabbay KH, Chung SS. Identification and characterization of multiple osmotic response sequences in the human aldose reductase gene. J Biol Chem. 1997;272(26):16431–16437. doi:10.1074/jbc.272.26.16431
26. Abate C, Luk D, Gagne E, Roeder RG, Curran T. Fos and Jun cooperate in transcriptional regulation via heterologous activation domains. Mol Cell Biol. 1990;10(10):5532–5535. doi:10.1128/mcb.10.10.5532-5535.1990
27. Penning TM. Aldo-Keto Reductase Regulation by the Nrf2 System: implications for Stress Response, Chemotherapy Drug Resistance, and Carcinogenesis. Chem Res Toxicol. 2017;30(1):162–176. doi:10.1021/acs.chemrestox.6b00319
28. Chen M, Wangtrakuldee P, Zang T, et al. Human and murine steroid 5β-reductases (AKR1D1 and AKR1D4): insights into the role of the catalytic glutamic acid. Chem Biol Interact. 2019;305:163–170. doi:10.1016/j.cbi.2019.03.025
29. Jin Y, Chen M, Penning TM. Rate of steroid double-bond reduction catalysed by the human steroid 5beta-reductase (AKR1D1) is sensitive to steroid structure: implications for steroid metabolism and bile acid synthesis. Biochem J. 2014;462(1):163–171. doi:10.1042/BJ20140220
30. Wang HH, Wen FQ, Dai DL, et al. Infant cholestasis patient with a novel missense mutation in the AKR1D1 gene successfully treated by early adequate supplementation with chenodeoxycholic acid: a case report and review of the literature. World J Gastroenterol. 2018;24(35):4086–4092. doi:10.3748/wjg.v24.i35.4086
31. Gonzales E, Cresteil D, Baussan C, Dabadie A, Gerhardt M-F, Jacquemin E. SRD5B1 (AKR1D1) gene analysis in Δ4-3-oxosteroid 5β-reductase deficiency: evidence for primary genetic defect. J Hepatol. 2004;40(4):241–250. doi:10.1016/j.abb.2007.04.024
32. Nikolaou N, Gathercole LL, Marchand L, et al. AKR1D1 is a novel regulator of metabolic phenotype in human hepatocytes and is dysregulated in non-alcoholic fatty liver disease. Metabolism. 2019;99:67–80. doi:10.1016/j.metabol.2019.153947
33. Valanejad L, Ghareeb M, Shiffka S, et al. Dysregulation of Delta(4)-3-oxosteroid 5beta-reductase in diabetic patients: implications and mechanisms. Mol Cell Endocrinol. 2018;470:127–141. doi:10.1016/j.mce.2017.10.005
34. He YC, Shen Y, Cao Y, et al. Overexpression of AKR1B10 in nasopharyngeal carcinoma as a potential biomarker. Cancer Biomark. 2016;16(1):127–135. doi:10.3233/CBM-150548
35. Fukumoto S, Yamauchi N, Moriguchi H, et al. Overexpression of the aldo-keto reductase family protein AKR1B10 is highly correlated with smokers’ non-small cell lung carcinomas. Clin Cancer Res. 2005;11(5):1776–1785. doi:10.1158/1078-0432.CCR-04-1238
36. van Weverwijk A, Koundouros N, Iravani M, et al. Metabolic adaptability in metastatic breast cancer by AKR1B10-dependent balancing of glycolysis and fatty acid oxidation. Nat Commun. 2019;10(1):2698. doi:10.1038/s41467-019-10592-4
37. Li W, Liu C, Huang Z, et al. AKR1B10 negatively regulates autophagy through reducing GAPDH upon glucose starvation in colon cancer. J Cell Sci. 2021;134(8). doi:10.1242/jcs.255273
38. Zhang W, Li H, Yang Y, Liao J, Yang GY. Knockdown or inhibition of aldo-keto reductase 1B10 inhibits pancreatic carcinoma growth via modulating Kras-E-cadherin pathway. Cancer Lett. 2014;355(2):273–280. doi:10.1016/j.canlet.2014.09.031
39. Heringlake S, Hofdmann M, Fiebeler A, Manns MP, Schmiegel W, Tannapfel A. Identification and expression analysis of the aldo-ketoreductase1-B10 gene in primary malignant liver tumours. J Hepatol. 2010;52(2):220–227. doi:10.1016/j.jhep.2009.11.005
40. Geng N, Jin Y, Li Y, Zhu S, Bai H. AKR1B10 Inhibitor Epalrestat Facilitates Sorafenib-Induced Apoptosis and Autophagy Via Targeting the mTOR Pathway in Hepatocellular Carcinoma. Int J Med Sci. 2020;17(9):1246–1256. doi:10.7150/ijms.42956
41. Shi J, Chen L, Chen Y, Lu Y, Chen X, Yang Z. Aldo-Keto Reductase Family 1 Member B10 (AKR1B10) overexpression in tumors predicts worse overall survival in hepatocellular carcinoma. J Cancer. 2019;10(20):4892–4901. doi:10.7150/jca.32768
42. Liu Y, Zhang J, Liu H, et al. Compensatory upregulation of aldo-keto reductase 1B10 to protect hepatocytes against oxidative stress during hepatocarcinogenesis. Am J Cancer Res. 2019;9(12):2730–2748.
43. Han C, Gao L, Zhao L, et al. Immunohistochemistry Detects Increased Expression of Aldo-Keto Reductase Family 1 Member B10 (AKR1B10) in Early-Stage Hepatocellular Carcinoma. Med Sci Monit. 2018;24:7414–7423. doi:10.12659/MSM.910738
44. Wang YY, Qi LN, Zhong JH, et al. High expression of AKR1B10 predicts low risk of early tumor recurrence in patients with hepatitis B virus-related hepatocellular carcinoma. Sci Rep. 2017;7:42199. doi:10.1038/srep42199
45. Mori M, Genda T, Ichida T, et al. Aldo-keto reductase family 1 member B10 is associated with hepatitis B virus-related hepatocellular carcinoma risk. Hepatol Res. 2017;47(3):E85–E93. doi:10.1111/hepr.12725
46. Xu B, Wang F, Song C, et al. Large-scale proteome quantification of hepatocellular carcinoma tissues by a three-dimensional liquid chromatography strategy integrated with sample preparation. J Proteome Res. 2014;13(8):3645–3654. doi:10.1021/pr500200s
47. Ye X, Li C, Zu X, et al. A Large-Scale Multicenter Study Validates Aldo-Keto Reductase Family 1 Member B10 as a Prevalent Serum Marker for Detection of Hepatocellular Carcinoma. Hepatology. 2019;69(6):2489–2501. doi:10.1002/hep.30519
48. Schmitz KJ, Sotiropoulos GC, Baba HA, et al. AKR1B10 expression is associated with less aggressive hepatocellular carcinoma: a clinicopathological study of 168 cases. Liver Int. 2011;31(6):810–816. doi:10.1111/j.1478-3231.2011.02511.x
49. DiStefano JK, Davis B. Diagnostic and Prognostic Potential of AKR1B10 in Human Hepatocellular Carcinoma. Cancers (Basel). 2019;11(4):486. doi:10.3390/cancers11040486
50. Ahmed MM, Wang T, Luo Y, et al. Aldo-keto reductase-7A protects liver cells and tissues from acetaminophen-induced oxidative stress and hepatotoxicity. Hepatology. 2011;54(4):1322–1332. doi:10.1002/hep.24493
51. Hlavac V, Brynychova V, Vaclavikova R, et al. The role of cytochromes p450 and aldo-keto reductases in prognosis of breast carcinoma patients. Medicine (Baltimore). 2014;93(28):e255. doi:10.1097/MD.0000000000000255
52. Rezaul K, Thumar JK, Lundgren DH, et al. Differential protein expression profiles in estrogen receptor-positive and -negative breast cancer tissues using label-free quantitative proteomics. Genes Cancer. 2010;1(3):251–271. doi:10.1177/1947601910365896
53. Chow RKK, Tsz-Kwan Sin S, Liu M, et al. AKR7A3 suppresses tumorigenicity and chemoresistance in hepatocellular carcinoma through attenuation of ERK, c-Jun and NF-kappaB signaling pathways. Oncotarget. 2017;8(48):83469–83479. doi:10.18632/oncotarget.12726
 © 2021 The Author(s). This work is published and licensed by Dove Medical Press Limited. The full terms of this license are available at https://www.dovepress.com/terms.php and incorporate the Creative Commons Attribution - Non Commercial (unported, v3.0) License.
By accessing the work you hereby accept the Terms. Non-commercial uses of the work are permitted without any further permission from Dove Medical Press Limited, provided the work is properly attributed. For permission for commercial use of this work, please see paragraphs 4.2 and 5 of our Terms.
© 2021 The Author(s). This work is published and licensed by Dove Medical Press Limited. The full terms of this license are available at https://www.dovepress.com/terms.php and incorporate the Creative Commons Attribution - Non Commercial (unported, v3.0) License.
By accessing the work you hereby accept the Terms. Non-commercial uses of the work are permitted without any further permission from Dove Medical Press Limited, provided the work is properly attributed. For permission for commercial use of this work, please see paragraphs 4.2 and 5 of our Terms.