")
Back to Journals » International Journal of Nanomedicine » Volume 14
Regulating intracellular ROS signal by a dual pH/reducing-responsive nanogels system promotes tumor cell apoptosis
Authors Dong K, Lei Q, Guo R, Wu X , Zhang Y, Cui N, Shi JY, Lu T
Received 9 March 2019
Accepted for publication 1 July 2019
Published 23 July 2019 Volume 2019:14 Pages 5713—5728
DOI https://doi.org/10.2147/IJN.S208089
Checked for plagiarism Yes
Review by Single anonymous peer review
Peer reviewer comments 3
Editor who approved publication: Dr Mian Wang
Kai Dong,* Qiuya Lei,* Runhao Guo, Xianglong Wu, Yanni Zhang, Ning Cui, Jian-Yu Shi, Tingli Lu
Key Laboratory for Space Bioscience and Biotechnology, School of Life Sciences, Northwestern Polytechnical University, Xi’an, Shaanxi, People’s Republic of China
*These authors contributed equally to this work
Purpose: The levels of reactive oxygen species (ROS) in tumor cells are much higher than that in normal cells, and rise rapidly under the influence of exogenous or endogenous inducing factors, eventually leading to the apoptosis of tumor cells. Therefore, this study prepared a dual pH/reducing-responsive poly (N-isopropylacrylamide-co-Cinnamaldehyde-co-D-α-tocopheryl polyethylene glycol 1000 succinate, PssNCT) nanogels, which employed two exogenous ROS inducers, cinnamaldehyde (CA) and D-α-tocopheryl polyethylene glycol 1000 succinate (TPGS), to selectively induce apoptosis by regulating ROS levels in tumor cells.
Methods: The PssNCT nanogels were prepared by the free radical precipitation polymerization under the crosslink between pH-sensitive hydrazone and reducing-sensitive disulfide bonds, followed by the physicochemical and morphological characteristics investigations. Plasma stability, dual pH/reducing responsive degradation and in vitro release were also assessed. In cell experiments, cytotoxicity in different cells were first detected. The intracellular ROS levels and mitochondrial functions of tumor cells were then evaluated. Moreover, the apoptosis and western-blot assays were employed to verify the association between ROS levels elevation and apoptosis in tumor cells.
Results: The nanogels exhibited a round-like hollow structure with the diameter smaller than 200nm. The nanogels were stable in plasma, while showed rapid degradation in acidic and reducing environments, thus achieving significant release of CA and TPGS in these media. Furthermore, the sufficient amplification of ROS signals was induced by the synergistically function of CA and TPGS on mitochondria, which resulted in the opening of the mitochondrial apoptotic pathway and enhanced cytotoxicity on MCF-7 cells. However, nanogels barely affected L929 cells owing to their lower intracellular ROS basal levels.
Conclusion: The specific ROS regulation method achieved by these nanogels could be explored to selectively kill tumor cells according to the difference of ROS signals in different kinds of cells.
Keywords: reactive oxygen species, oxidative stress, cinnamaldehyde, TPGS, nanogels
Introduction
As one of the most challenging and complex diseases, cancer seriously threatens human health. Finding the best way to conquer cancer with little side-effects has always been the research hotspot in the field of cancer therapy. The current anticancer therapies employed in the clinic, such as surgery, radiotherapy, and chemotherapy, still arouse a series of problems during the treatment, such as the postoperative metastasis, poor tolerance to radiotherapy, and the multidrug-resistance or toxicity generated during chemotherapy,1–4 which are mostly related with the complexity of tumor pathogenesis.5 Therefore, it is necessary to develop novel treatment mechanisms according to the special microenvironment of tumor cells.
Reactive oxygen species (ROS) play important roles in the growth, proliferation and signaling processes of cells, such as hydrogen peroxide (H2O2), superoxide (·O), and hydroxyl radicals (·OH).6 ROS usually maintain a harmless low intracellular level due to the timely elimination by antioxidants, such as glutathione, superoxide dismutase, and peroxidase.7–9 However, the metabolism of ROS presents a completely different situation in tumor cells, which manifests as the much higher level due to the overproduction of ROS, resulting in the mutual antagonism between ROS and antioxidant system, thus leading to the oxidative stress. Moreover, the oxidative stress would be aggravated by the continuous generated ROS stimulated by exogenous and endogenous factors, which will induce apoptosis and necrosis once the ROS levels exceed the tolerance of tumor cells. However, due to the relatively lower ROS basic level, such situation usually does not appear in normal cells.10–12 Therefore, regulating intracellular ROS signal to selectively kill tumor cells without affecting normal cells can be an effective strategy for tumor therapy.13 Many exogenous ROS inducers or antioxidant system antagonists have been used to achieve this goal by rising ROS levels beyond the tolerance of tumor cells or weaken their antioxidant defense.14–18
Cinnamaldehyde (CA) is the major component of cinnamon, which exerts anticancer activity through elevating ROS levels mainly in the mitochondria and inducing apoptosis.19 Cabello et al, found that low-micromolar concentrations (IC50<10 μM) of CA suppressed the proliferation of human metastatic melanoma A375 cell lines with elevated intracellular ROS.20 Noh et al, reported a dual stimuli-responsive hybrid anticancer drug, QCA, which could be activated by H2O2 and acidic pH to release glutathione-scavenging quinone methide and ROS-generating CA, respectively, thus amplifying oxidative stress and leading to the killing of cancer cells.21 However, the poor bioavailability of CA (short half-life in blood) caused by the rapid oxidation of the aldehyde group and lower drug efficacy than common chemotherapeutic drugs limits its clinical application.22,23
To overcome these drawbacks, we developed a dual pH/reducing-responsive nanogels system, poly (N-isopropylacrylamide-co-Cinnamaldehyde-co-D-α-tocopheryl polyethylene glycol 1000 succinate, PssNCT), to encapsulate CA, which was assembled by the itaconic acid (IA) linked with CA through hydrazone bond, N-isopropylacrylamide (NIPAm) and D-α-tocopheryl polyethylene glycol 1000 succinate (TPGS) under the crosslink by N, N’-bis (acryloyl) cystamine (BAC). TPGS was employed as the other ROS inducer in this system, which was a derivative of vitamin E and composed of polyethylene glycol and α-tocopheryl succinate (α-TOS).24 α-TOS is the major function group of TPGS, which increases the intracellular ROS level through interfering with the function of the mitochondrial electron transport chain, thereby inducing apoptosis.25,26 Youk et al, found that TPGS generated more ROS to induce apoptosis, and effectively inhibited the growth of human lung carcinoma cells implanted in nude mice compared with TOS.27 Su et al, reported a unique ROS triggered nanosystem, TBH, based on TPGS and hyaluronic acid, which could achieve active targeting and ROS regeneration in MCF-7/ADR cells and tumor tissues xenografted with MCF-7/ADR cells, thereby inhibiting the function of P-gp protein and reverse tumor’s multidrug-resistance.28
Therefore, the PssNCT nanogels can be rapidly degraded to release CA and TPGS through the acid-responsive cleavage of hydrazone bonds and reducing-responsive cleavage of disulfide bonds in the structure of BAC, thereby preventing the oxidation of CA before endocytosis.29,30 Furthermore, CA and TPGS could cooperate with each other to induce apoptosis through intracellular ROS level elevating and ultimately kill tumor cells (Scheme 1), which effectively improve the selectivity toward tumor cells and the therapeutic effects of the dual pH/reducing-sensitive PssNCT nanogels.
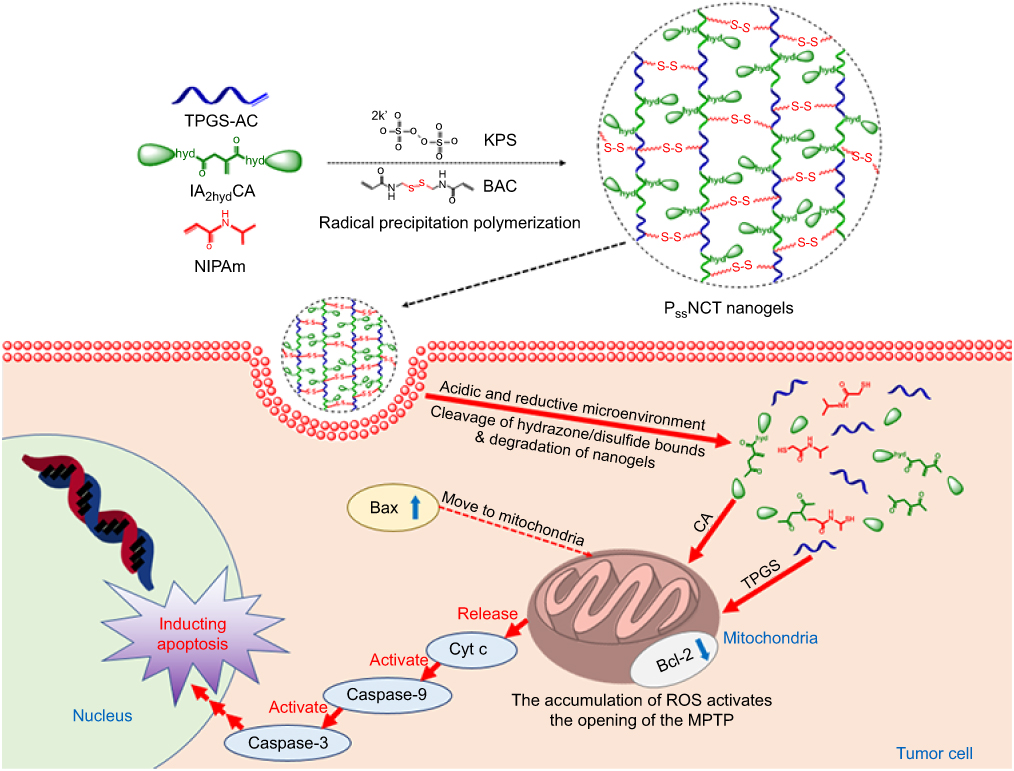 |
Scheme 1 Illustration of the preparation, dual pH/reducing-responsive intracellular degradation, ROS signal amplification, and induced apoptosis of PssNCT nanogels. |
Materials and methods
Materials
CA, TPGS, IA , and 3-(4,5-dimethyl-thiazol-2-yl)-2,5-diphenyl-tetrazolium bromide (MTT) were purchased from Sigma-Aldrich Co. (St Louis, MO, USA). NIPAm, acryloyl chloride (AC), N, N’-BAC, potassium persulfate (KPS), hydroquinone, hydrazine hydrate (N2H4·H2O), triethylamine (TEA), sodium dodecyl sulfate (SDS), and dithiothreitol (DTT) were purchased from Aladdin Chemistry (Shanghai, People’s Republic of China). Hoechst 33342, ROS assay kit (DCFH-DA), mitochondrial membrane potential assay kit, ATP assay kit, and Annexin V-FITC apoptosis detection kit were purchased from Beyotime Biotechnology Co. Ltd (Nantong, People’s Republic of China).
The MCF-7 human breast cancer cell line and L929 mouse fibroblast cell line were purchased from the Cell Bank, Shanghai Institutes for Biological Sciences, Chinese Academy of Sciences (Shanghai, People’s Republic of China). Cells were cultured in the RPMI 1640 medium, supplemented with 10% fetal bovine serum (FBS), 100 IU/mL penicillin and 100 mg/mL streptomycin sulfate, incubated at 37ºC with 5%CO2 (fully humidified conditions). All experiments were performed when cells were in the logarithmic phase of growth.
Synthesis of PssNCT nanogels
Synthesis of polymers
Acryloyl chloride modified D-α-tocopheryl polyethylene glycol 1000 succinate (TPGS-AC) was obtained from the reaction of TPGS (0.38 g, 0.25 mmol) and AC (103 μL,1.25 mmol) with TEA (140 μL, 1.00 mmol) as the catalyst in dichloromethane with ice bath for 10 hrs. The product was purified by precipitation in cold diethylether, filtration, and drying in vacuum at 30ºC. The synthesis of double cinnamaldehyde itaconic acylhydrazone (IA2hydCA) was divided into three steps: synthesis of dimethyl itaconate (IA2OMe), dihydrazide itaconate (IA2hyd), and IA2hydCA. Specifically, IA (7.80 g, 0.06 mol) was dissolved in the methanol (15 mL, 0.36 mol) with the addition of polymerization inhibitors, hydroquinone (0.08 g, 0.72 mmol), and concentrated sulfuric acid (42 μL, 0.80 mmol). The mixture was refluxed at 125ºC for 10 hrs. The IA2OMe was obtained by collecting the oil layer after washed by saturated Na2CO3/NaHCO3 solution. IA2OMe (2.37 g, 0.015 mol) and N2H4·H2O (2.02 g, about 0.04 mol) were dissolved in absolute ethanol and refluxed at 125ºC for 3 hrs, then quickly recrystallized and filtered in ice bath. The IA2hyd was obtained through repeated washing (by ethanol), recrystallizing and filtering. IA2hyd (2.28 g, 0.012 mol) and CA (3.17 g, about 0.024 mol) were dissolved in absolute ethanol and refluxed at 80ºC for 2 hrs, then quickly recrystallized in ice bath and got the crude product through vacuum filtering. The IA2hydCA was obtained through washing (by ethanol), recrystallizing and filtering.
Synthesis of PssNCT nanogels
PssNCT nanogels were prepared by the free radical precipitation polymerization.31 Specifically, IA2hydCA (0.053 g, 0.013 mmol), NIPAm (0.57 g, 5.00 mmol), and TPGS-AC (0.019 g, 0.013 mmol) were dissolved in the dimethyl sulfoxide (DMSO) solution, followed by the addition of SDS (0.036 g, 0.20 mmol) and BAC (0.30 g, 2.00 mmol). The solution was purged with nitrogen for 0.5 hrs to remove oxygen, then heated up to 70ºC with stirring. KPS (0.027 g, 0.50 mmol) was added as the initiator for polymerization, and the reaction was under N2 atmosphere at 70ºC for 5 hrs. The obtained PssNCT nanogels dispersion was dialyzed (molecular weight cutoff: 8000–14,000 Da) against water for 7 days to remove unreacted monomers and other small molecules. The water was refreshed twice every day during this period. Dialyzed PssNCT nanogels were lyophilized and stored in a vacuum desiccator at room temperature.
Characterization of polymers and nanogels
Polymers were characterized by the 1H nuclear magnetic resonance spectra (600 MHz, Bruker, Karlsruhe, Germany), which employed DMSO-d6 as the solvent and tetramethylsilane as the internal standard to measure the chemical shifts (δ) in ppm downfield. Nanogels were characterized by the Malvern Zetasizer Naso ZS (Malvern, UK) and observed by a transmission electron microscopy (TEM, Hitachi H 600, Tokyo, Japan). The loading capacity of CA and TPGS in nanogels was detected as follows: weighted lyophilized nanogels were immersed in pH5.0 phosphate buffer saline (PBS, containing 10 mM DTT) with stirring for 24 hrs. Then, the release media were collected to detect the concentration of CA by reverse phase high-performance liquid chromatography (RP-HPLC), which used a C18 BDS column (5 μm, 250×4.6 mm, Thermo Fisher Scientific, Massachusetts, USA). The composition of mobile phase is acetonitrile and water (40:60, v/v, flow rate 1.0 mL/min). The linearity of CA concentration was assessed by a calibration that was obtained by plotting the peak area of each analyte versus CA concentrations (5×10⁻²–10 μg/mL). Samples were monitored at 290 nm and quantified by comparing the peak areas with the standard curve. The concentration of TPGS was detected by a UV spectrophotometer through the chromogenic reaction of PEG part of TPGS with iodine.32,33 The linearity of TPGS concentration was assessed by a calibration that was obtained by plotting the UV absorbance (the wavelength was 500 nm) of each analyte vs TPGS concentrations (2–40 μg/mL). The loading content (LC%) and encapsulation efficiency (EE%) of CA and TPGS were calculated as follows:


Wt was the weights of CA or TPGS in nanogels. Ws was the weights of nanogels after lyophilization. W0 was the weights of the feeding CA or TPGS.
Plasma stability, dual pH/reducing-responsive degradation, and in vitro release of PssNCT nanogels
The plasma stability and dual pH/reducing-responsive degradation of PssNCT nanogels were detected by the dynamic light scattering (DLS). Briefly, 5 mL PssNCT nanogels solutions were immersed in 50 mL deionized water containing fFBS (50%, v/v), pH7.4 PBS with 10 mM DTT, pH5.0 PBS with or without 10 mM DTT, respectively, and incubated for 0, 0.5, 2, 4, 8, 12, and 24 hrs. At predetermined time intervals, solution (1 mL) was withdrawn and monitored with DLS (Malvern Zetasizer Naso ZS, Malvern, UK) to determine the particle size changes of nanogels in different media. The release of CA and TPGS from PssNCT nanogels was investigated at 37ºC in different media, ie pH7.4 PBS with or without 10 mM DTT and pH5.0 PBS with or without 10 mM DTT. The molecular weight cutoff of dialysis tubes for CA or TPGS release experiments was 1000 and 3500, respectively. At predetermined time intervals, release media (1 mL) were taken out and replenished with an equal volume of fresh media. The detection methods of CA and TPGS were the same as those in section 2.2.3. All samples in release experiments were tested in triplicate and the results at each time point were the relative value, which was the ratio of the tested value to the initial value.
Cytotoxicity study
L929 and MCF-7 cells were used to evaluate the cytotoxicity of free CA, Pss(NIPAm-TPGS) nanogels (PssNT, without CA) and PssNCT nanogels through MTT assay. Cells were first seeded and incubated in 96-well plates (5×10³ cells per well) for 24 hrs. Then, the culture medium was replaced by various amounts of free CA, PssNT or PssNCT nanogels growth medium solution and continue the incubation for another 24 hrs. Wells replaced with MTT solution after rinsed with ice-cold PBS at the predetermined time. Plates were further incubated for 4 hrs at 37ºC to allow viable cells to reduce the MTT (yellow) into formazan crystals (purple), which were then dissolved in 150 μL of DMSO. After 10 mins of incubation, the absorbance at the wavelength of 570 nm was measured by a multifunctional microplate reader (Bio-Rad), and the cell viability was determined by the comparison of absorbance between tested cells and untreated cells.
Intracellular ROS detection
ROS in different cells were detected by the DCFH-DA Reactive Oxygen Species Assay Kit. Specifically, L929 and MCF-7 cells were seeded and incubated in 96-well plates (1×10⁵ cells per well) for 24 hrs. Then, the ROS detection process was divided into two parts: the detection of concentration-dependent ROS generation and the detection of time-dependent ROS generation. In the concentration-dependent ROS generation detection, the medium was replaced with free CA, PssNT or PssNCT nanogels growth medium solution (25, 50, 75, and 100 μg/mL calculated by CA) and incubated for 8 hrs at 37ºC. In the time-dependent ROS generation detection, the medium was replaced with 1 mL of CA, PssNT or PssNCT nanogels growth medium solution (100 μg/mL calculated by CA) and incubated for 0.5, 1, 2, 4, and 8 hrs at 37ºC. The supernatant was removed and wells were washed three times with ice-cold PBS after incubation. Then, cells were treated with DCFH-DA (30 mins), washed, harvested, and resuspended in ice-cold PBS. The fluorescence was detected by a flow cytometry (FACSCalibur, BD, New Jersey, USA).
Effects of ROS on mitochondrial function in tumor cells
In order to further investigate the correlation between ROS increase and mitochondrial membrane potential (MP) changes in tumor cells, the qualitative detection of ROS and the measurement of mitochondrial (MP) were performed simultaneously in MCF-7 cells. Briefly, the same batch of cultured cells were seeded in 24-well plates with or without glass coverslips at the same time and incubated for 24 hrs, respectively. For the ROS qualitative detection, the supernatant was replaced with free CA, PssNT, or PssNCT nanogels growth medium solution (100 μg/mL calculated by CA) for the further incubation (8 hrs). At the predetermined time, coverslips with cells were taken off, washed with ice-cold PBS and treated with 4% paraformaldehyde (1 mL, 15 mins). Then, cells were washed and counterstained by Hoechst 33342 (5 mins). The final samples were analyzed by an inverted fluorescence microscope (Leica DMIL, Frankfurt, Germany). For the mitochondrial MP detection, cells were also treated with free CA, PssNT, or PssNCT nanogels growth medium solution (100 μg/mL calculated by CA) for 8 hrs. At the predetermined time, cells were washed with ice-cold PBS and suspended in diluted JC-1 staining solution (500 μL) for 20 mins. After rinsed with physiological saline, cells were suspended in JC-1 staining buffer (500 μL) to measure the fluorescence intensity immediately by a flow cytometry (FACSCalibur, BD, New Jersey, USA). The obtained values were expressed as the average signal intensity ratio of the FL1 channel (green fluorescence) to the FL2 channel (red fluorescence).
Moreover, due to the ATP synthesis was directly affected by the change of mitochondrial function, we also detected the effect of different preparations on the ATP content in MCF-7 cells. The selected cells were the same batch as those used for the ROS qualitative detection and mitochondrial MP detection. The confluent cells were treated with free CA, PssNT, or PssNCT nanogels growth medium solution (100 μg/mL calculated by CA) for 2 hrs. Then, cells were washed twice with ice-cold PBS and solubilized in cell lysates, followed by immediate centrifugation (12,000 g) at 4ºC for 10 mins. The supernatant was collected for ATP quantification by the luciferin/luciferase assay. The light emission of each sample was measured with an Ultra-Weak luminescence analyzer (Model BPCL, Guangzhou, China). Raw data were converted to ATP concentration according to the standard calibration curve. ATP contents were normalized by the protein content in each sample, using a BCA kit. The blank medium was used as control.
Apoptosis assay
The apoptosis of MCF-7 cells induced by CA or nanogels was detected by the annexin V-FITC/PI apoptosis detection kit. Cells were seeded and incubated in six-well plates (5×10⁵ per well) for 24 hrs. Then, the confluent cells were treated with free CA, PssNT, or PssNCT nanogels growth medium solution (100 μg/mL calculated by CA) at 37ºC for another 24 hrs incubation. At the predetermined time, the supernatant was replaced with fresh medium to wash cells, followed by collecting cells (the density was 1×10⁵) in 1×binding buffer solution. Each 10 μL of Annexin V-FITC and propidium iodide (PI) was added to the cell suspension, followed by the incubation (15 mins) and the treatment with × binding buffer solution (400 μL). A flow cytometer (FACSCalibur, BD, New Jersey, USA) was employed to analyze the stained cells (1×10⁴ cells per sample).
Western-blot assay
MCF-7 cells were seeded and incubated in the six-well plates (1.5×10⁶ per well) at 37ºC for 24 hrs, Following the incubation for 8 hrs with free CA, PssNT, or PssNCT nanogels growth medium solution (100 μg/mL calculated by CA). Then, cells were washed with ice-cold PBS and lysed in RIPA buffer to measure the protein concentration using the BCA method (Beyotime, Nantong, People’s Republic of China). Proteins were separated by electrophoresis and transferred onto a PVDF membrane (Millipore, Billerica, US). An equal amount of cell lysate on a 10% polyacrylamide gel was used to perform electrophoresis and proteins were transferred to PVDF membranes. The primary antibodies were Bcl-2, Bax, and Caspase-3 (Santa Cruz Biotechnology, Dallas, US). The secondary antibody was HRP-conjugated goat anti-mouse IgG (Servicebio, Wuhan, China) and the β-actin was set as the loading control for normalization. The immunoblot signals were developed by the Super Signal Ultra chemiluminescent reagent (Pierce, Rockford, US).
Statistical analysis
Results were presented as Mean±SD. SPSS Statistical Software (v.22; IBM, Chicago, IL, USA) was used to analyze all data. One-way ANOVA and LSD test were used to compare among groups. P<0.05 was considered as the statistical significance.
Results
Characterization of polymers and PssNCT nanogels
In this study, we first modified the terminal hydroxyl group of TPGS with a carbon–carbon double bond through the reaction with acryl chloride, then connected CA to the terminal carboxyl groups of IA by hydrazone bonds to obtain IA2hydCA (Figure 1A and B). As shown in Figure 2A, peaks appeared at 5.84–5.89 and 6.11–6.20 were belonged to the terminal carbon–carbon double bond (–CH=CH2) of TPGS-AC. The characteristic peaks representing the methyl groups in the IA2OMe structure appear at 2.50–2.52 (Figure 2B). However, these peaks disappeared in IA2hyd due to the substitution of hydrazine hydrate for methyl groups (Figure 2C). Moreover, peaks belonged to the carbon–carbon double bond and benzene ring appeared at 6.95–7.89, indicating that CA had been connected in the structure of IA2hydCA through the hydrazone bond (Figure 2D).
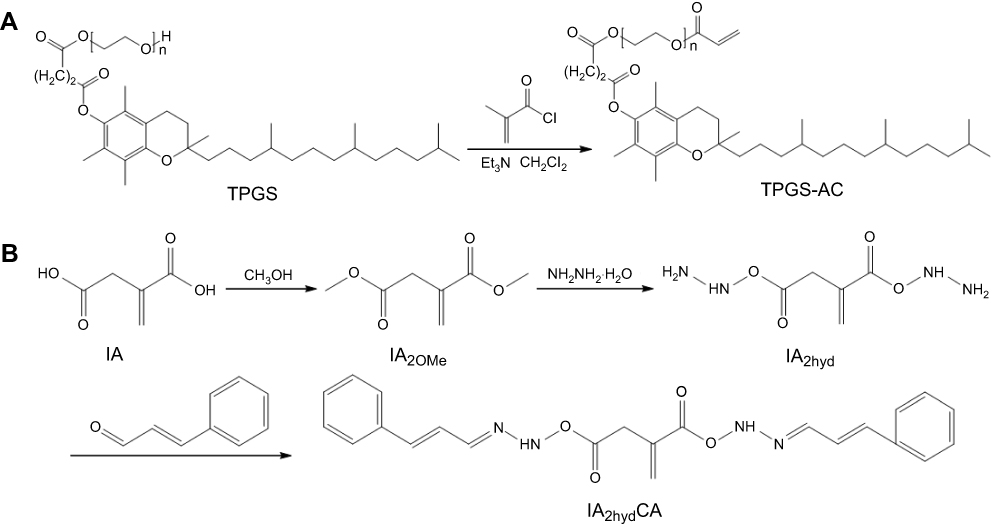 |
Figure 1 Synthesis of TPGS-AC (A) and IA2hydCA (B). |
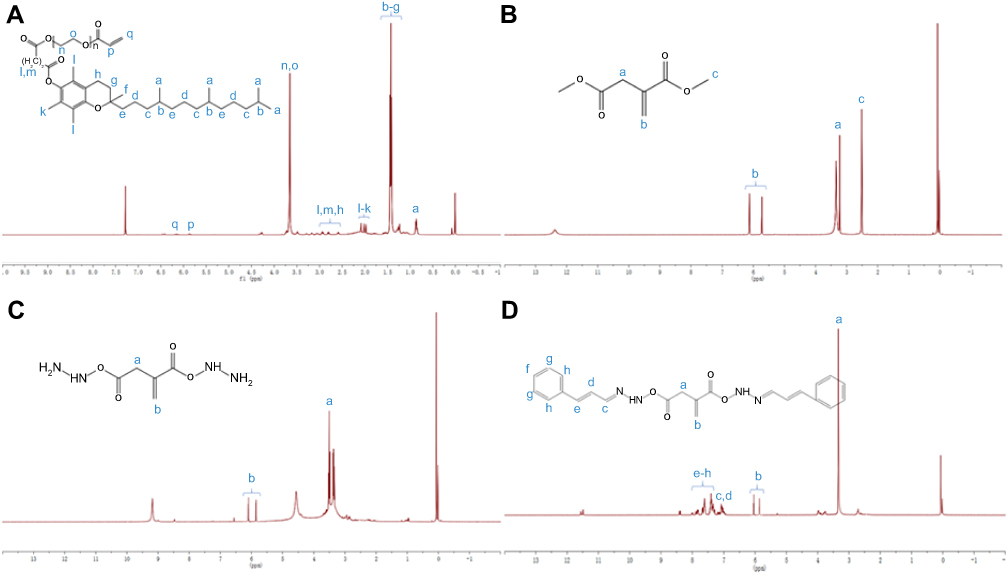 |
Figure 2 Characterization of polymers. (A) 1H-NMR spectrum of TPGS-CA recorded in DMSO-d6. (B) 1H-NMR spectrum of IA2OMe recorded in DMSO-d6. (C) 1H-NMR spectrum of IA2hyd recorded in DMSO-d6. (D) 1H-NMR spectrum of IA2hydCA recorded in DMSO-d6. |
The PssNCT nanogels were developed by the free radical precipitation polymerization of NIPAm, IA2hydCA, and TPGS-AC as monomers in the presence of reducing-sensitive BAC as the crosslinking agent (Figure 3A). The ROS inducer, CA, was conjugated into the network of nanogels through the pH-sensitive hydrazone bond. These chemical bonding allowed nanogels to load more CA and TPGS (the CL%/EE% of CA and TPGS were 7.2%/86.3% and 2.4%/82.5%, respectively). As shown in Figure 3B, the sizes of PssNCT nanogels were about 200 nm with relatively low polydispersity indexes (PDI=0.155±0.016). The zeta potential for all nanogels was negatively charged on the surface, which ensured the stability of nanogels in the blood circulation and enhanced the cellular uptake via endocytosis.34–36 The TEM observations results were shown in Figure 3C, which indicated that the PssNCT nanogels were a round-like hollow structure, which was similar to the vesicle, and the sizes were correlated well with the results of laser diffraction particle sizes. This structure could protect CA from the renal clearance by increasing its circulatory half-life after intravenous injection, thus facilitating CA delivery through the leaky vasculature in solid tumors by the enhanced permeability and retention (EPR) effect.37
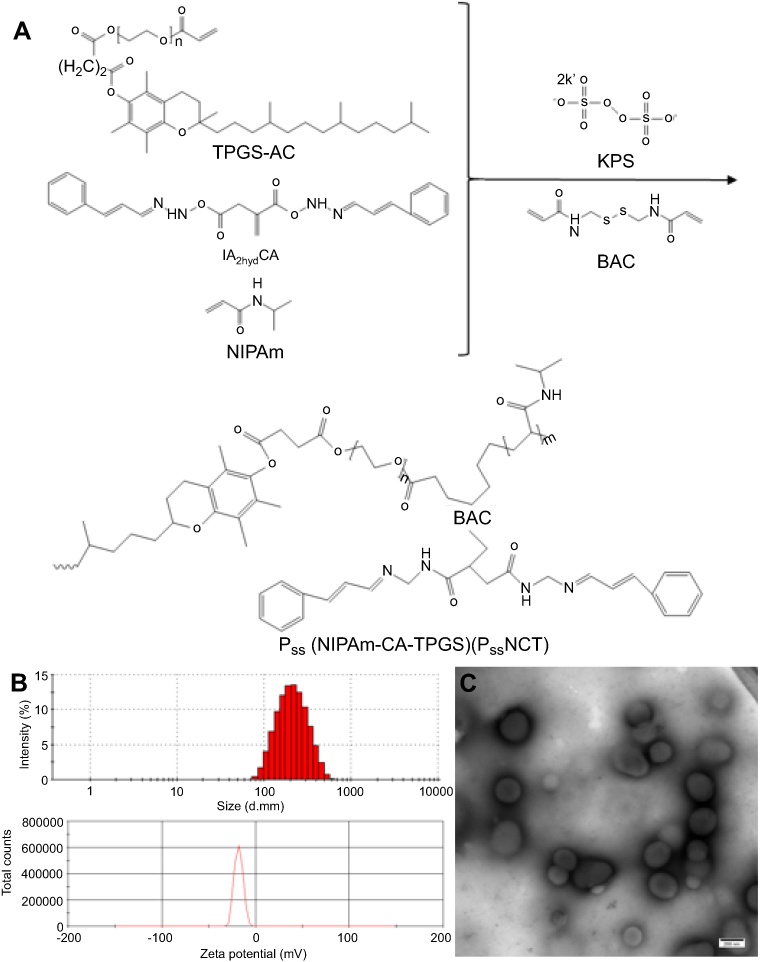 |
Figure 3 Synthesis and characterization of PssNCT nanogels. (A) Schematic synthesis of PssNCT nanogels. (B) Size distribution and Zeta potential of PssNCT nanogels determined by DLS. (C) TEM micrograph of PssNCT nanogels. |
Plasma stability, dual pH/reducing-responsive degradation, and in vitro release of PssNCT nanogels
Figure 4A and B shows the results of plasma stability and dual pH/reducing-responsive degradation tests. The particle sizes of nanogels first decreased slightly, then gradually increased in FBS, manifesting as a slight fluctuation, which was consistent with the variation of PDI. However, the changes of particle size and PDI of nanogel all varied greatly in different PBS solutions than in FBS. Among them, the decrease of particle sizes and the increase of PDI of nanogels were the most significant in pH5.0 PBS with DTT, then followed by the PBS only containing DTT, and the minimal changes were observed in pH7.4 PBS.
 |
Figure 4 Plasma stability, dual pH/reducing-responsive degradation and in vitro release of PssNCT nanogels. (A) The particle size changes of PssNCT nanogels incubated with different media (mean±SD, n=3). *P<0.05, **P<0.01: significantly different from FBS. (B) The polydispersity index (PDI) changes of PssNCT nanogels incubated with different media (mean±SD, n=3). **P<0.01: significantly different from FBS. (C) In vitro release of CA from PssNCT nanogels in different media (mean±SD, n=3). **P<0.01: significantly different from pH 7.4 release media. (D) In vitro release of TPGS from PssNCT nanogels in different media (mean±SD, n=3). **P<0.01: significantly different from pH 7.4 release media. |
These results demonstrated that there was a continuous adsorption–desorption process between the nanogels and the plasma protein in the FBS solution, which led to the frequent fluctuations in particle sizes and PDI in the initial stage of incubation, and the adsorption process reached the equilibrium as the incubation time increased, resulting in unchanged particle size and slight increase of PDI.38 However, compared with other incubation media, FBS exerted less influence on nanogels and kept the relative stability of their structure. Moreover, the nanogels could be only degraded through the cleavage of disulfide or hydrazone bond in DTT or in pH5.0 PBS, which led to relatively small changes in particle sizes and PDI. In the pH5.0 PBS with DTT, the degradation of nanogel was significantly accelerated due to the successive cleavage of hydrazone and disulfide bonds, leading to dramatic changes in the particle sizes and PDI. These results indicated that nanogels could be degraded responsively in acidic and reductive intracellular environment to release CA and TPGS rapidly in tumor cells, which was also demonstrated by the in vitro release experiments (Figure 4C and D). In the CA release experiment (Figure 4C), the nanogels achieved the maximum cumulative release of CA in the pH5.0 PBS with DTT (95.9%, 48 hrs), then followed the pH7.4 PBS with DTT (88.9%, 48 hrs) and pH5.0 PBS (81.2%, 48 hrs). The minimum cumulative release was obtained in pH7.4 PBS (35.3%, 48 hrs) due to the absence of any responsive degradation mechanism. Moreover, in the TPGS release experiment (Figure 4D), TPGS was quickly released in the release medium containing DTT (88.8% in the pH5.0 PBS with DTT and 82.7% in the pH7.4 PBS with DTT), which was induced by the rapid degradation of disulfide bonds in nanogels under reductive conditions. However, less TPGS was released in the non-reductive environments (44.1% in the pH5.0 PBS and 38.4% in the pH7.4 PBS) due to the absence of the reductive agent DTT.
Cytotoxicity
The results of cytotoxicity induced by free CA, PssNT, and PssNCT nanogels in different cells are shown in Figure 5. The PssNCT nanogels exhibited the most significant cytotoxicity on MCF-7 cells (IC50: 28.39±2.32 μg/mL), then followed the PssNT nanogels (IC50: 63.88±4.85 μg/mL), and the free CA showed the least cytotoxicity on MCF-7 cells among them (IC50: 362.65±38.33 μg/mL). However, these preparations showed no obvious cytotoxicity to L929 cells, which manifested as the cell viabilities higher than 70% in 24 hrs when the concentration of CA in different preparations was 100 μg/mL, and the IC50 values of the three media were all great than 10,000 μg/mL.
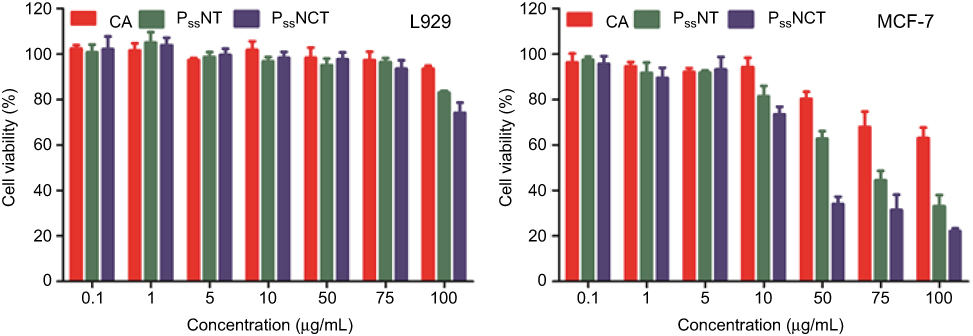 |
Figure 5 In vitro cytotoxicity of free CA, PssNT, or PssNCT nanogels on L929 and MCF-7 cells in 24 hrs (mean±SD, n=3). |
ROS generation assay in different cells
The results of ROS detection in different cells are shown in Figure 6. The non-fluorescent DCFH-DA could be hydrolyzed to DCF when reacted with ROS, manifesting as the generation of the green fluorescence signal. Therefore, the fluorescence intensity was proportional to the ROS amount generated intracellularly.39 In the test of the concentration-dependent ROS generation, the free CA, PssNT, or PssNCT all increased the ROS level at each concentration in both cells, and the increase was more obvious in MCF-7 cells, which were proportional to the incubation concentrations (Figure 6A). In the test of the time-dependent ROS generation, although the free CA, PssNT, and PssNCT nanogels all increased intracellular ROS levels in both cells after the incubation for 8 hrs, their effects on the ROS levels in MCF-7 cells were much higher than those in L929 cells (Figure 6B). Moreover, both tests all showed that tumor cells with higher ROS basal values are more susceptible to ROS inducers when compared to normal cells, and thus producing cytotoxicity. We also found that nanogels significantly increase the ROS levels in MCF-7 cells compared with free CA, and the ROS level increased by PssNCT nanogels was higher than by PssNT nanogels in each concentration or time point, which meant that although CA and PssNCT nanogels had the same content of CA, difference between them in ROS generation might be due to the intracellular internalization amount of TPGS. Similarly, the intracellular internalization amount of CA might induce the difference between PssNT and PssNCT nanogels in ROS generation, indicating that CA and TPGS could act synergistically as ROS inducers to induce apoptosis by increasing ROS levels in tumor cells.
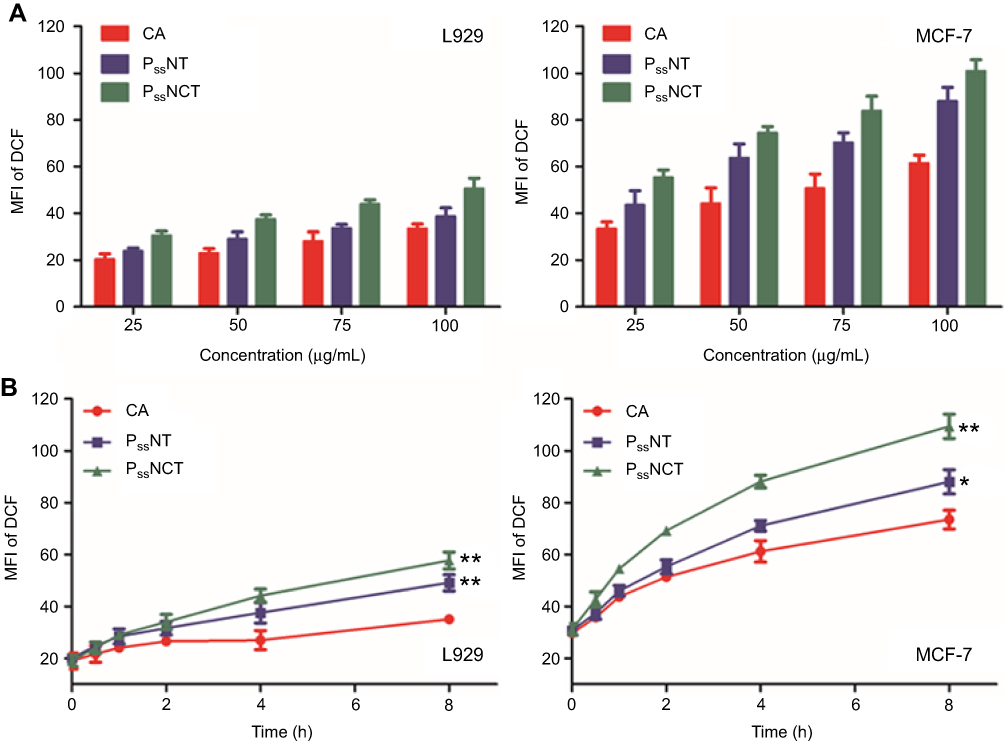 |
Figure 6 Changes of ROS levels in L929 and MCF-7 cells after incubating with free CA, PssNT, or PssNCT nanogels in different concentrations (A) or for different periods of time (B) (mean±SD, n=3). The concentrations of PssNT and PssNCT were fixed according to the concentration of CA. *P<0.05, **P<0.01: significantly different from the CA group. |
Effects of ROS on mitochondrial function of tumor cells
The results of qualitative analysis of ROS generation induced by free CA, PssNT, and PssNCT nanogels in MCF-7 cells are shown in Figure 7A, strong fluorescence was observed in cells incubated with PssNCT nanogels solution, then followed the PssNT nanogels, and CA only showed weak fluorescence after 8 hrs, which was consistent with the results of time-dependent ROS generation. Moreover, JC-1 was used to detect the mitochondrial MP changes, which is able to reversibly transform from the monomer form (green fluorescence) to the aggregate form (red fluorescence) when bounded with high MP, thus demonstrating the mitochondrial depolarization (non-functional mitochondria) through the increase of the green/red fluorescence intensity ratio.40 From Figure 7B, free CA, PssNT, and PssNCT nanogels all increased the green/red fluorescence intensity in MCF-7 cells, and the changing trend was consistent with the increase of ROS levels. Furthermore, the ATP content determination revealed that compared with the control group (cells treated with blank medium and the ATP level was normalized as 100%), PssNCT and PssNT nanogels significantly decreased the ATP level of MCF-7 cells (Figure 7C, 44.2% and 57.7% of the normal level, P<0.01, respectively). However, the decrease of ATP level induced by free CA was less than two nanogels (71.2%). These results indicated that the increase of ROS level induced by CA, PssNCT, and PssNT nanogels directly reduced the mitochondrial MP by disrupting the function of mitochondrial electron transport chain, thus leading to the disorder of ATP synthesis and disruption of mitochondrial membrane permeability, ultimately inducing cytotoxicity. Moreover, due to the synergistic effect of CA and TPGS in ROS level increasing, PssNCT nanogels showed the greatest influence on mitochondrial function.
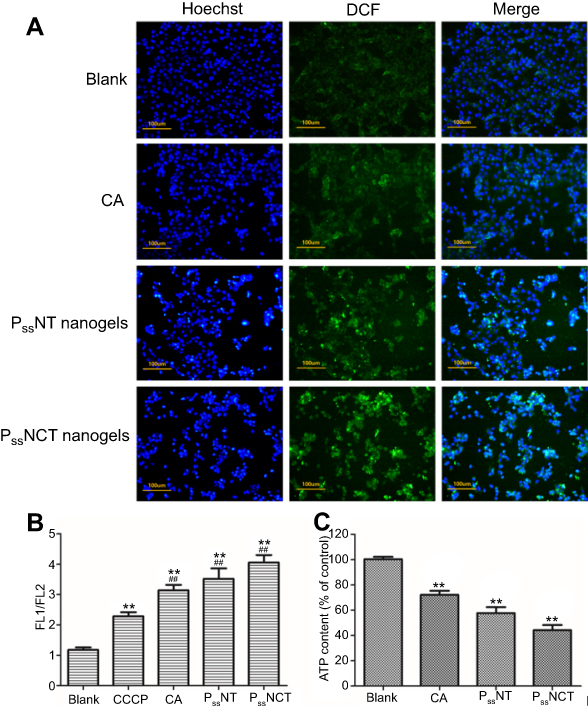 |
Figure 7 Effect of intracellular ROS signal changes on mitochondrial function. (A) Observation of the intracellular ROS production in MCF-7 cells incubated with free CA, PssNT, or PssNCT nanogels for 8 hrs, using DCFH-DA as the detection probe. (blue for Hoechst, Green for DCF and scale bar=100 μm). (B) Changes in mitochondrial membrane potential after 8 hrs of incubation with free CA, PssNT, or PssNCT nanogels (mean±SD, n=3). The mitochondrial electron transport chain inhibitor carbonyl cyanide 3-chlorophenylhydrazone (CCCP) was set as the positive control. **P<0.01: significantly different from the blank group, ##P<0.01:significantly different from the CCCP group. (C) Changes in the intracellular ATP level of MCF-7 cells after incubated with free CA, PssNT, or PssNCT nanogels (mean ± SD, n=3). **P<0.01: significantly different from the blank group. In these experiments, the concentrations of PssNT and PssNCT were fixed at 100 μg/mL calculated by CA. |
Apoptosis and western-blot assays in tumor cells
The apoptosis-inducing effect of free CA, PssNT, and PssNCT nanogels on MCF-7 cells was evaluated by the Annexin V-FITC/PI detection, which used Annexin V-FITC to stain early apoptotic cells and labeled late apoptotic cells by PI. From Figure 8A and B, PssNCT nanogels achieved the highest apoptotic ratio (71.08%, Sum of orange and blue parts of the PssNCT column in Figure 8B), then followed the PssNT nanogels (54.47%, Sum of orange and blue parts of the PssNT column in Figure 8B). Free CA got the lowest apoptotic ratio in the three groups (34.14%, Sum of orange and blue parts of the CA column in Figure 8B). It was noteworthy that PssNCT nanogels induced much more early apoptosis compared with PssNT nanogels (60.12% vs 36.80%, orange parts of PssNCT and PssNT columns in Figure 8B), which should be caused by the mitochondrial apoptosis pathway.41 Moreover, PssNCT nanogels containing CA and TPGS induced a more significant trend of apoptosis compared with CA or TPGS (PssNT nanogels) alone. Therefore, the synergistic effect of CA and TPGS as ROS inducers significantly enhanced the proportion of apoptotic cells.
 |
Figure 8 Effects of free CA, PssNT, or PssNCT nanogels on the apoptosis. (A) The apoptosis of MCF-7 cells induced by free CA, PssNT, or PssNCT nanogels for 24 hrs using the Annexin V-FITC/PI staining and analyzed by a flow cytometry. (B) The histogram of apoptosis of MCF-7 cells induced by free CA, PssNT, or PssNCT nanogels. (C) Changes in the expression of apoptosis-related proteins after incubated with free CA, PssNT, or PssNCT nanogels. (D) Changes in the Bax/Bcl-2 ratio after incubated with free CA, PssNT, or PssNCT nanogels (mean±SD, n=3). The concentrations of PssNT and PssNCT were fixed at 100 μg/mL calculated by CA. **P<0.01: significantly different from the blank group. |
The further investigation of apoptosis mechanisms induced by different preparations was depicted in Figure 8C and D, which was demonstrated by the expression levels of apoptosis-related proteins evaluated by the western-blot analysis. These results demonstrated that PssNCT nanogels significantly increased the Bax expression, whereas decreased Bcl-2 and Caspase-3 expression, leading to an upregulation in the ratio of Bax/Bcl-2 compared with the same concentration of CA or PssNT nanogels, which confirmed that PssNCT nanogels exerted superior apoptosis-inducing potential because of the combined effects of CA and TPGS in inducing oxidative stress. These results were also in good agreement with the results of MTT, ROS detecting, and mitochondrial function assay.
Discussion
Since tumor cells are usually under the assault of overproduced intracellular ROS, they have developed antioxidant capacity by upregulating antioxidant system, eventually leading to the unique oxidative stress of tumor cells.42,43 This special microenvironment drives the proliferation of tumor cells to a certain extent. Once exceeding this threshold, the excessive ROS generated by ROS inducers or antioxidant system antagonists will manifest as cytotoxicity and lead to the apoptosis. However, normal cells are less sensitive to the oxidative stress-inducing agents due to their low ROS basal levels, which make the regulation of intracellular ROS signal as an effective selectively therapeutic strategy to tumor cells.
In this work, we delivered two ROS inducers, CA and TPGS, by the nanogels systems, which are a kind of nanosystems with three-dimensional network inside and synthesized by physical or chemical crosslinking of amphiphilic polymers, thus protecting CA from the oxidation before reaching the lesion,44,45 namely enhancing the stability of CA in blood circulation and ultimately improve its bioavailability. Therefore, we linked the aldehyde groups of CA with the carboxyl groups of IA via the acidic-sensitive hydrazone bond, which has been known to be rapidly degraded specifically in acidic tumor environments, such as lysosomes and endosomes.46 Then, IA2hydCA and TPGS were incorporated in the internal network of PssNCT nanogels via the crosslinking of BAC, which contains the reducing-sensitive disulfide bond in the structure. Disulfide bond can achieve responsive breakage due to the overexpression of intracellular reductive substances and enzymes (such as glutathione, superoxide dismutase, and catalase) in tumor cells.47 Therefore, PssNCT nanogels could responsively degrade in acidic and strong reductive environment of tumors. The in vitro stability and release studies all demonstrated that the degradation of PssNCT nanogels and the release of CA could be accelerated under double stimulations (acidity and reducibility), which was attributed to the responsive cleavage of nanogels induced by the breakage of the hydrazone and disulfide bonds (Figure 4C). Moreover, the rapid release of TPGS was mostly caused by the cleavage of the disulfide bond in the reductive surroundings (Figure 4D). In the serum-containing media, the fluctuation of particle sizes and PDI was caused by the adsorption–desorption process. However, the particle sizes and PDI no longer changed when the adsorption process reached equilibrium, indicating that the nanogels could keep stable in blood circulation, thereby prolonging their circulation and enhancing the accumulation of nanogels to tumor sites through EPR effect.
The special oxidative stress state leads to the higher intracellular ROS basal levels in tumor cells and makes them more sensitive to ROS inducers than normal cells, finally leading to the apoptosis and necrosis of tumor cells, which could be illustrated by Figures 5 and 6. In our previous studies and other studies, MCF-7 cells have been used as the typical oxidative stress cell model to verify the apoptosis of tumor cells caused by the changes of ROS levels.10,26,48–50 In the cytotoxicity test (Figure 5), free CA, PssNT and PssNCT all exerted cytotoxicity on MCF-7 cells in varying degrees, but barely affect L929 cells. Specifically, MCF-7 cells treated with PssNCT showed the strongest cytotoxicity, then followed the PssNT, and the least cytotoxicity was caused by free CA, which correlated well with the results of intracellular ROS detection. From Figure 6, the mean fluorescence intensity values (MFI) of DCF were less than 20 in L929 cells, but more than 30 in MCF-7 cells. After incubated by different preparations, continuous elevation of ROS signal appeared in MCF-7 cells, and leading to significant cytotoxicity. However, gentle increase of ROS signal appeared in L929 cells, and almost generated no cytotoxicity. Moreover, due to the combined application of CA and TPGS, PssNCT nanogels exhibited the strongest ROS inducing ability, which was correlated well with the synergistic function of CA and TPGS in elevating ROS level. Furthermore, ROS elevating efficiency of CA was also dramatically enhanced by inhibiting oxidation once connected to the structure of PssNCT nanogels compared with free CA and nanogels without CA (PssNT). In addition, the ROS signal increase was proportional to the dosage and time, thus facilitating the effective dose monitoring in future clinical applications.
The electron leakage of the mitochondrial electron transport chain is one of the main sources of ROS, which are usually generated from the mitochondrial dysfunction.51,52 Mitochondrial MP is essential to maintain the normal mitochondrial function, whose decrease leads to the defects to the insufficient synthesis of adenosine triphosphate (ATP).53 ATP is produced in the mitochondrial inner membrane during the biological oxidation process. When the mitochondrial electron transport chain is damaged, a large number of electrons will leak and form ROS, which affects the oxidative phosphorylation process, leads to the decrease of mitochondrial MP and the change of mitochondrial membrane permeability, finally resulting in the obstruction of ATP synthesis.54 The test of correlation between ROS level and mitochondrial MP revealed that the significant increase of ROS signal can lead to the mitochondrial dysfunction, manifesting as the decreased MP and ATP synthesis disorder (Figure 7). Moreover, the combination of CA and TPGS significantly reduced the MP and ATP content in tumor cells, which is superior to free CA or TPGS alone.
Furthermore, the destruction of mitochondrial MP and ATP synthesis disorder induced by the continuous accumulation of ROS signal further activates the opening of the mitochondrial permeability transition pore (MPTP), thus promoting the release of cytochrome C (Cyt C). Through forming a multimer with apoptosis protease activating factor 1, CytC continues to activate Caspase-9, which in turn activates Caspase-3.55 Once activated, Caspase-3 destroys the structure and function of downstream proteins, ultimately leading to apoptosis.56 In the process of apoptosis, the ratio of Bax to Bcl-2 is an important parameter to reflect the apoptotic trend, which is mainly because that Bcl-2 inhibits apoptosis through inhibiting the open of MPTP, but the heterodimer formed by Bax and Bcl-2 prevents the anti-apoptotic effect of Bcl-2. Therefore, changes in contents of these two proteins have significant effects on the mitochondrial apoptotic pathway.57,58 The investigation of different preparations on the mitochondrial apoptosis pathway by monitoring the expression of Caspase-3, Bcl-2 and Bax proteins showed that under the same condition of CA content, PssNCT nanogels significantly up-regulated the expression of Bax, but down-regulated the expression of Bcl-2 and Caspase-3 compared with free CA and PssNT nanogels, which suggested that both CA and TPGS can induce intrinsic apoptosis pathway by affecting ROS levels in mitochondria (Figure 8).
Conclusion
To sum up, we prepared a novel pH/reducing dual-responsive nanogels, PssNCT, which could rapidly degrade to release CA and TPGS in the acidic and reductive environments of tumor cells via the responsive cleavage of hydrazone and disulfide bonds, thus preventing the oxidation of CA induced by the advance release in the circulation. The combination of CA and TPGS could greatly elevate the ROS levels, thus inducing the apoptosis of tumor cells, which was achieved through the intrinsic apoptosis pathway. We anticipate that the combination of multiple inducers to amplify ROS signals could effectively improve the treatment of tumors through the application of the PssNCT nanogels.
Acknowledgments
This work was supported financially by the National Natural Science Foundation of China (No. 81803491), the China Postdoctoral Science Foundation (No. 2018M633584), the Natural Science Foundation of Shaanxi Province (No. 2019JQ-320), the Postdoctoral Science Foundation of Shaanxi Province (No. 2018BSHQYXMZZ43) and the Fundamental Research Funds for the Central Universities (No. 3102019smxy002).
Disclosure
The authors report no conflicts of interest in this work.
References
1. Zhang Y, Shi ZL, Yang X, Yin ZF. Targeting of circulating hepatocellular carcinoma cells to prevent postoperative recurrence and metastasis. World J Gastroenterol. 2014;20(1):142–147. doi:10.3748/wjg.v20.i1.142
2. Shrieve DC, Klish M, Wendland MM, Watson GA. Basic principles of radiobiology, radiotherapy, and radiosurgery. Neurosurg Clin N Am. 2004;15(4):467. doi:10.1016/S1042-3680(03)00074-3
3. Wu CP, Hsieh CH, Wu YS. The emergence of drug transporter-mediated multidrug resistance to cancer chemotherapy. Mol Pharm. 2011;8(6):1996–2011. doi:10.1021/mp200261n
4. Malhotra V, Perry MC. Classical chemotherapy – mechanisms, toxicities and the therapeutic window. Cancer Biol Ther. 2003;2(4):S2–S4.
5. Infanger DW, Lynch ME, Fischbach C. Engineered culture models for studies of tumor-microenvironment interactions. In: Yarmush ML, editor. Annual Review of Biomedical Engineering. Vol. 15. Palo Alto: Annual Reviews; 2013:29–53.
6. Lambert AJ, Brand MD. Reactive oxygen species production by mitochondria. Methods Mol Biol. 2009;554:165–181. doi:10.1007/978-1-59745-521-3_11
7. Strzelczyk JK, Wiczkowski A. Oxidative damage and carcinogenesis. Wspolczesna Onkol. 2012;16(3):230–233. doi:10.5114/wo.2012.29290
8. Fang J, Seki T, Maeda H. Therapeutic strategies by modulating oxygen stress in cancer and inflammation. Adv Drug Deliv Rev. 2009;61(4):290–302. doi:10.1016/j.addr.2009.02.005
9. Boonstra J, Post JA. Molecular events associated with reactive oxygen species and cell cycle progression in mammalian cells. Gene. 2004;337:1–13. doi:10.1016/j.gene.2004.04.032
10. Dong K, Yang CR, Yan Y, et al. Investigation of the intracellular oxidative stress amplification, safety and anti-tumor effect of a kind of novel redox-responsive micelle. J Mat Chem B. 2018;6(7):1105–1117. doi:10.1039/C7TB02973J
11. Alexandre J, Batteux F, Nicco C, et al. Accumulation of hydrogen peroxide is an early and crucial step for paclitaxel-induced cancer cell death both in vitro and in vivo. Int J Cancer. 2006;119(1):41–48. doi:10.1002/ijc.21685
12. Hanikoglu A, Ozben H, Hanikoglu F, Ozben T. Hybrid compounds & oxidative stress induced apoptosis in cancer therapy. Curr Med Chem. 2018;25. Epub 2018 Jul 2018. doi:10.2174/0929867325666180719145819
13. Verrax J, Pedrosa RC, Beck R, Dejeans N, Taper H, Calderon PB. In situ modulation of oxidative stress: a novel and efficient strategy to kill cancer cells. Curr Med Chem. 2009;16(15):1821–1830.
14. Raj L, Ide T, Gurkar AU, et al. Selective killing of cancer cells by a small molecule targeting the stress response to ROS (vol 475, pg 231, 2011). Nature. 2015;526(7574):596. doi:10.1038/nature15370
15. Moloney JN, Cotter TG. ROS signalling in the biology of cancer. Semin Cell Dev Biol. 2018;80:50–64. doi:10.1016/j.semcdb.2017.05.023
16. Trachootham D, Zhou Y, Zhang H, et al. Selective killing of oncogenically transformed cells through a ROS-mediated mechanism by beta-phenylethyl isothiocyanate. Cancer Cell. 2006;10(3):241–252. doi:10.1016/j.ccr.2006.08.009
17. Fang J, Sawa T, Akaike T, et al. In vivo antitumor activity of pegylated zinc protoporphyrin targeted inhibition of heme oxygenase in solid tumor. Cancer Res. 2003;63(13):3567–3574.
18. Maeda H, Hori S, Ohizumi H, et al. Effective treatment of advanced solid tumors by the combination of arsenic trioxide and L-buthionine-sulfoximine. Cell Death Differ. 2004;11(7):737–746. doi:10.1038/sj.cdd.4401389
19. Ka H, Park HJ, Jung HJ, et al. Cinnamaldehyde induces apoptosis by ROS-mediated mitochondrial permeability transition in human promyelocytic leukemia HL-60 cells. Cancer Lett. 2003;196:143–152.
20. Cabello CM, Bair WB, Lamore SD, et al. The cinnamon-derived Michael acceptor cinnamic aldehyde impairs melanoma cell proliferation, invasiveness, and tumor growth. Free Radic Biol Med. 2009;46(2):220–231. doi:10.1016/j.freeradbiomed.2008.10.025
21. Noh J, Kwon B, Han E, et al. Amplification of oxidative stress by a dual stimuli-responsive hybrid drug enhances cancer cell death. Nat Commun. 2015;6:9. doi:10.1038/ncomms7907
22. Hong SH, Kim J, Kim JM, et al. Apoptosis induction of 2 ‘-hydroxycinnamaldehyde as a proteasorne inhibitor is associated with ER stress and mitochondrial perturbation in cancer cells. Biochem Pharmacol. 2007;74(4):557–565. doi:10.1016/j.bcp.2007.05.016
23. Lee K, Kwon BM, Kim K, et al. Plasma pharmacokinetics and metabolism of the antitumour drug candidate 2ʹ-benzoyloxycinnamaldehyde in rats. Xenobiotica. 2009;39(3):255–265. doi:10.1080/00498250802650069
24. Guo YY, Luo J, Tan SW, Otieno BO, Zhang ZP. The applications of Vitamin E TPGS in drug delivery. Eur J Pharm Sci. 2013;49(2):175–186. doi:10.1016/j.ejps.2013.02.006
25. Almeida J, Ball BA. Effect of alpha-tocopherol and tocopherol succinate on lipid peroxidation in equine spermatozoa. Anim Reprod Sci. 2005;87(3–4):321–337. doi:10.1016/j.anireprosci.2004.12.004
26. Dong K, Yan Y, Wang PC, et al. Biodegradable mixed MPEG-SS-2SA/TPGS micelles for triggered intracellular release of paclitaxel and reversing multidrug resistance. Int J Nanomed. 2016;11:5109–5123. doi:10.2147/IJN.S111930
27. Youk HJ, Lee E, Choi MK, et al. Enhanced anticancer efficacy of alpha-tocopheryl succinate by conjugation with polyethylene glycol. J Control Release. 2005;107:43–52. doi:10.1016/j.jconrel.2005.05.014
28. Su ZG, Chen ML, Xiao YY, et al. ROS-triggered and regenerating anticancer nanosystem: an effective strategy to subdue tumor’s multidrug resistance. J Control Release. 2014;196:370–383. doi:10.1016/j.jconrel.2014.09.020
29. Ding Y, Sun D, GL W, et al. An efficient PEGylated liposomal nanocarrier containing cell-penetrating peptide and pH-sensitive hydrazone bond for enhancing tumor-targeted drug delivery. Int J Nanomed. 2015;10:6199–6214.
30. Zhang LP, Xi L, Shi G, Zhu CP, Ni CH. Reduction-responsive zwitterionic nanogels based on carboxymethyl chitosan for enhancing cellular uptake in drug release. Colloid Polym Sci. 2016;294(3):629–637. doi:10.1007/s00396-015-3822-2
31. Su SS, Wang H, Liu XG, Wu Y, Nie GJ. iRGD-coupled responsive fluorescent nanogel for targeted drug delivery. Biomaterials. 2013;34(13):3523–3533. doi:10.1016/j.biomaterials.2013.01.083
32. Hiskey CF, Cantwell FF. Interaction of aqueous polyethylene glycol solutions with iodine. J Pharm Sci. 1966;55(2):166–168.
33. Kaneniwa N, Ikekawa A, Hayase H. Influence of molecular-weight of polyethylene-glycol on interaction between polyethylene-glycol and iodine. Chem Pharm Bull (Tokyo). 1974;22(11):2635–2641. doi:10.1248/cpb.22.2635
34. Kim KM, Kim HM, Lee WJ, et al. Surface treatment of silica nanoparticles for stable and charge-controlled colloidal silica. Int J Nanomed. 2014;9:29–40.
35. Limbach LK, Li YC, Grass RN, et al. Oxide nanoparticle uptake in human lung fibroblasts: effects of particle size, agglomeration, and diffusion at low concentrations. Environ Sci Technol. 2005;39(23):9370–9376.
36. Honary S, Zahir F. Effect of zeta potential on the properties of nano-drug delivery systems – a review (part 1). Trop J Pharm Res. 2013;12(2):255–264.
37. Maeda H, Nakamura H, Fang J. The EPR effect for macromolecular drug delivery to solid tumors: improvement of tumor uptake, lowering of systemic toxicity, and distinct tumor imaging in vivo. Adv Drug Deliv Rev. 2013;65(1):71–79. doi:10.1016/j.addr.2012.10.002
38. Gref R, Luck M, Quellec P, et al. ‘Stealth’ corona-core nanoparticles surface modified by polyethylene glycol (PEG): influences of the corona (PEG chain length and surface density) and of the core composition on phagocytic uptake and plasma protein adsorption. Colloid Surf B-Biointerfaces. 2000;18(3–4):301–313. doi:10.1016/S0927-7765(99)00156-3
39. Eruslanov E, Kusmartsev S. Identification of ROS using oxidized DCFDA and flow-cytometry. In: Armstrong D, editor. Advanced Protocols in Oxidative Stress. Vol. 594. Totowa: Humana Press Inc; 2010:57–72.
40. De Biasi S, Gibellini L, Cossarizza A. Uncompensated polychromatic analysis of mitochondrial membrane potential using JC-1 and multilaser excitation. Curr Protoc Cytom. 2015;72:
41. Iyer D, Ray RD, Pappas D. High temporal resolution fluorescence measurements of a mitochondrial dye for detection of early stage apoptosis. Analyst. 2013;138(17):4892–4897. doi:10.1039/c3an01142a
42. Scibior-Bentkowska D, Skrzycki M, Podsiad M, Czeczot H. Changes of the glutathione enzymatic redox system in human gastrointestinal tract tumours. Arch Med Sci. 2009;5(4):500–505.
43. Cook JA, Gius D, Wink DA, Krishna MC, Russo A, Mitchell JB. Oxidative stress, redox, and the tumor microenvironment. Semin Radiat Oncol. 2004;14(3):259–266. doi:10.1016/j.semradonc.2004.04.001
44. Merino S, Martin C, Kostarelos K, Prato M, Vazquez E. Nanocomposite hydrogels: 3D polymer-nanoparticle synergies for on-demand drug delivery. ACS Nano. 2015;9(5):4686–4697. doi:10.1021/acsnano.5b01433
45. Hamidi M, Azadi A, Rafiei P. Hydrogel nanoparticles in drug delivery. Adv Drug Deliv Rev. 2008;60(15):1638–1649. doi:10.1016/j.addr.2008.08.002
46. Kaplancikli ZA, Altintop MD, Ozdemir A, Turan-Zitouni G, Khan SI, Tabanca N. Synthesis and biological evaluation of some hydrazone derivatives as anti-inflammatory agents. Lett Drug Des Discov. 2012;9(3):310–315. doi:10.2174/157018012799129828
47. Wang KM, Liu N, Zhang P, et al. Synthetic methods of disulfide bonds applied in drug delivery systems. Curr Org Chem. 2016;20(14):1477–1489. doi:10.2174/1385272820666151207194002
48. Dong K, Lei QY, Qi HF, et al. Amplification of oxidative stress in MCF-7 cells by a novel pH-responsive amphiphilic micellar system enhances anticancer therapy. Mol Pharm. 2019;16(2):689–700. doi:10.1021/acs.molpharmaceut.8b00973
49. Isnaini I, Permatasari N, Mintaroem K, Prihardina B, Widodo MA. Oxidants-antioxidants profile in the breast cancer cell line MCF-7. Asian Pac J Cancer Prev. 2018;19(11):3175–3178. doi:10.31557/APJCP.2018.19.11.3175
50. Kattan Z, Minig V, Leroy P, Dauca M, Becuwe P. Role of manganese superoxide dismutase on growth and invasive properties of human estrogen-independent breast cancer cells. Breast Cancer Res Treat. 2008;108(2):203–215. doi:10.1007/s10549-007-9597-5
51. Cuperus R, Leen R, Tytgat GAM, Caron HN, van Kuilenburg ABP. Fenretinide induces mitochondrial ROS and inhibits the mitochondrial respiratory chain in neuroblastoma. Cell Mol Life Sci. 2010;67(5):807–816. doi:10.1007/s00018-009-0212-2
52. Ye JL, Jiang ZX, Chen XH, Liu MY, Li J, Liu N. Electron transport chain inhibitors induce microglia activation through enhancing mitochondrial reactive oxygen species production. Exp Cell Res. 2016;340(2):315–326. doi:10.1016/j.yexcr.2015.10.026
53. Kharroubi W, Ahmed SH, Nury T, et al. Mitochondrial dysfunction, oxidative stress and apoptotic induction in microglial BV-2 cells treated with sodium arsenate. J Environ Sci. 2017;51:44–51. doi:10.1016/j.jes.2016.08.028
54. Chen J, Mathews CE. Use of chemical probes to detect mitochondrial ROS by flow cytometry and spectrofluorometry. In: Galluzzi L, Kroemer G, editors. Conceptual Background and Bioenergetic/Mitochondrial Aspects of Oncometabolism. Vol. 542. San Diego: Elsevier Academic Press Inc; 2014:223–241.
55. Xiao D, He H, Huang W, Oo TL, Wang A, He L-F. Analysis of mitochondrial markers of programmed cell death. Methods Mol Biol. 2018;1743:65–71. doi:10.1007/978-1-4939-7668-3_6
56. Ghosh U, Bhattacharyya NP. Induction of apoptosis by the inhibitors of poly (ADP-ribose)polymerase in HeLa cells. Mol Cell Biochem. 2009;320(1–2):15–23. doi:10.1007/s11010-008-9894-2
57. Czabotar PE, Lessene G, Strasser A, Adams JM. Control of apoptosis by the BCL-2 protein family: implications for physiology and therapy. Nat Rev Mol Cell Biol. 2014;15(1):49–63. doi:10.1038/nrm3722
58. Shi L, Chen JA, Yang JA, Pan TH, Zhang SG, Wang ZM. MiR-21 protected human glioblastoma U87MG cells from chemotherapeutic drug temozolomide induced apoptosis by decreasing Bax/Bcl-2 ratio and caspase-3 activity. Brain Res. 2010;1352:255–264. doi:10.1016/j.brainres.2010.07.009
 © 2019 The Author(s). This work is published and licensed by Dove Medical Press Limited. The full terms of this license are available at https://www.dovepress.com/terms.php and incorporate the Creative Commons Attribution - Non Commercial (unported, v3.0) License.
By accessing the work you hereby accept the Terms. Non-commercial uses of the work are permitted without any further permission from Dove Medical Press Limited, provided the work is properly attributed. For permission for commercial use of this work, please see paragraphs 4.2 and 5 of our Terms.
© 2019 The Author(s). This work is published and licensed by Dove Medical Press Limited. The full terms of this license are available at https://www.dovepress.com/terms.php and incorporate the Creative Commons Attribution - Non Commercial (unported, v3.0) License.
By accessing the work you hereby accept the Terms. Non-commercial uses of the work are permitted without any further permission from Dove Medical Press Limited, provided the work is properly attributed. For permission for commercial use of this work, please see paragraphs 4.2 and 5 of our Terms.