")
Back to Journals » Therapeutics and Clinical Risk Management » Volume 11
Refractory cachexia is associated with increased plasma concentrations of fentanyl in cancer patients
Authors Suno M, Endo Y, Nishie H, Kajizono M, Sendo T, Matsuoka J
Received 16 December 2014
Accepted for publication 13 February 2015
Published 8 May 2015 Volume 2015:11 Pages 751—757
DOI https://doi.org/10.2147/TCRM.S79374
Checked for plagiarism Yes
Review by Single anonymous peer review
Peer reviewer comments 4
Editor who approved publication: Professor Garry Walsh
Manabu Suno,1,* Yuriko Endo,1,* Hiroyuki Nishie,2 Makoto Kajizono,3 Toshiaki Sendo,3 Junji Matsuoka4
1Department of Oncology Pharmaceutical Care and Science, Graduate School of Medicine, Dentistry and Pharmaceutical Sciences, 2Department of Anesthesiology and Resuscitology, Graduate School of Medicine, Dentistry and Pharmaceutical Sciences, Okayama University, 3Department of Pharmacy, Okayama University Hospital, 4Faculty of Health Sciences, Okayama University Medical School, Okayama, Japan
*These authors contributed equally to this work
Background: An appropriate plasma concentration of fentanyl is the key to achieving good pain control in cancer patients. Cachexia, a multifactorial syndrome, is known to affect drug-metabolizing enzymes. However, the fentanyl concentrations in the blood of patients with cachexia have not been analyzed. The aim of this study was to evaluate the influence of cancer cachexia on dose-adjusted plasma fentanyl concentrations in cancer patients.
Methods: Blood was collected from 21 Japanese cancer patients treated with a 24-hour transdermal fentanyl patch during the steady state of fentanyl plasma concentration. Plasma fentanyl concentrations were analyzed using liquid chromatography with tandem mass spectrometry (LC-MS/MS), and the levels were adjusted with the dose of fentanyl. Laboratory data were collected, and the cachexia stage was determined, based on study by Fearon et al. Multiple regression analysis was performed to identify the factors that affected fentanyl plasma concentrations.
Results: Eight patients were classified as precachexia, nine as cachexia, and four as refractory cachexia, and the median dose-adjusted fentanyl concentrations (ng/mL per mg/kg/day) were 27.5, 34.4, and 44.5, respectively. The dose-adjusted fentanyl concentration in patients with refractory cachexia was higher than that in patients with precachexia (Kruskal–Wallis test and post hoc Mann–Whitney U-test, P<0.01). The factors that were found to possibly affect the dose-adjusted concentration of fentanyl included aspartate aminotransferase, C-reactive protein, and estimated glomerular filtration rate, when analyzed as six independent variables (multiple regression analysis, P<0.05).
Conclusion: The dose-adjusted plasma concentrations of fentanyl increased with progression of cancer cachexia. Such an increase is associated with a multifactorial and systemic syndrome in cancer cachexia patients, including lower albumin, higher C-reactive protein, and impaired kidney function. In patients with cancer cachexia, we suggest that evaluation of cancer cachexia might help pain management when using a transdermal fentanyl patch in palliative care.
Keywords: transdermal patch, cancer pain, LC-MS/MS
Background
Fentanyl, a potent opioid, is widely used for cancer pain in step 3 of the World Health Organization (WHO) pain ladder. Unfortunately, it is ineffective for some patients. Pain is prevalent in cancer patients and has been reported in approximately 60% of patients with either metastatic, advanced stage, or terminal stage disease and in 50% of cancer patients.1 Therefore, good pain control is very important for cancer patients, to maintain their quality of life. Individual differences have been reported in analgesic effects obtained by cancer patients administered fentanyl.2,3 Individual variations, in either metabolizing enzymes or skin absorption from the fentanyl transdermal patches, may affect blood fentanyl concentrations.4,5 However, information on individual differences in pain control achieved by fentanyl is limited. A more detailed investigation is needed in order to safely and effectively administer fentanyl.
Cachexia, which occurs in 50%–80% of all cancer patients, has been defined as a multifactorial syndrome that is characterized by progressive disorders of both metabolism and physiological function.6,7 The pathophysiology is characterized by a negative protein and energy balance that is driven by both reduced food intake and abnormal metabolism.6–8 Cachexia is known to affect metabolizing enzymes, such as CYP3A4 which converts fentanyl to norfentanyl.4,9 A previous report showed that cancer cachexia raises the plasma concentrations of oxycodone, a potent opioid that is metabolized, via CYP3A, as fentanyl.10 An understanding of the effect of cachexia on fentanyl plasma concentrations may be beneficial for pain management.
We analyzed fentanyl concentrations in patient plasma. Cancer cachexia was also examined as a factor that may influence plasma fentanyl concentrations.6 Cancer cachexia was classified into three stages, using the criteria by Fearon et al.6 The aim of this study was to evaluate the influence of cancer cachexia on dose-adjusted plasma fentanyl concentrations in cancer patients.
Methods
Ethics approval
This study was designed and implemented following the guidelines dictated in the Declaration of Helsinki. Ethics approval was obtained from the Okayama University Hospital Ethics Committee. Patients in this study remained anonymous and could not be identified. Informed consent was obtained from patients registered in the study.
Patients and plasma samples
A total of 21 subjects participated in this study between January 2012 and August 2013. Pain control was managed by a palliative care team at Okayama University Hospital. Patient information, including sex, age, height, weight, cancer type, cancer stage, and daily dose of the transdermal fentanyl patch, was obtained from medical records. Exclusion criteria included use of drugs as supportive therapy, that might affect the metabolism of CYP3A4 (eg, erythromycin, diltiazem, itraconazole, and cimetidine), and antipsychotic drugs.
The patients were treated daily with a new 24-hour, transdermal fentanyl patch (Fentos® tape; Hisamitsu Pharmaceutical Co., Saga, Japan, and Kyowa Hakko Kirin Co., Ltd., Tokyo, Japan) to reduce cancer pain. Patients without a change in baseline dose for 3 days were judged to have completed the titration. Blood sampling was performed on days 4, 6, 8, 10, and 14. Blood samples were collected from the patients just before applying a fresh patch. Whole blood was collected in a tube containing heparin, and plasma was separated by centrifugation (3,000 rpm, 15 minutes) and then stored at −30°C.
Evaluation of cancer cachexia and laboratory data
Cancer cachexia was classified as precachexia, cachexia, and refractory cachexia, using diagnostic criteria described by Fearon et al.6
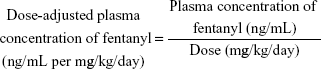
Laboratory data were collected to identify the factors that affect fentanyl plasma concentrations. Aspartate aminotransferase (AST) and alanine aminotransferase (ALT) were analyzed to determine liver function. Serum creatinine (S-Cr) and the estimated glomerular filtration rate (eGFR) were analyzed to determine kidney function. In addition, albumin (ALB) and C-reactive protein (CRP) were assessed. Fentanyl concentrations were determined using liquid chromatography (LC) with tandem mass spectrometry (MS/MS) (LC-MS/MS). Dose-adjusted plasma concentrations of fentanyl were calculated using the following equation:
|
|
Fentanyl assay
Fentanyl concentrations were determined using LC-MS/MS. Haloperidol was used as an internal standard. The LC-20AD (Shimadzu Corp, Kyoto, Japan) high-performance LC system and the API 4000TM (AB SCIEX, Framingham, MA, USA) MS/MS system were used. A Capcell Pak C18 AQ type (2.0×150 mm, 5 μm; Shiseido, Tokyo, Japan) column was used for the analytical column, and the temperature was set to 40°C. Data were acquired and processed using Analyst® version 1.4.2 (AB SCIEX) software. Assay accuracies at 0.05, 0.5, 1.0, and 10.0 ng/mL were 95.2%, 99.2%, 115.4%, and 98.5% (intra-assay) and 94.0%, 99.6%, 111.7%, and 98.9% (interassay), respectively. Assay precisions at 0.05, 0.5, 1.0, and 10.0 ng/mL were 8.85%, 4.37%, 4.11%, and 2.64% (intra-assay) and 8.29%, 4.01%, 5.64%, and 3.72% (interassay), respectively. All of these results were within the acceptable range of the US Food and Drug Administration (FDA) guidance.11
Evaluation of pain intensity and adverse events
An evaluation of the pain intensity was performed, using a visual analog scale (VAS) (0–100 mm), just before applying a fresh patch. The history of adverse events, which included malaise, somnolence, and constipation, was obtained from the medical records. The severity of adverse events was assessed according to the National Cancer Institute Common Terminology Criteria for Adverse Events (NCI-CTCAE) version 4.0.12
Statistical analysis
All statistical analyses were performed using SPSS (SPSS® Statistics 22.0; IBM Japan, Tokyo, Japan). The Kruskal–Wallis test and the post hoc Mann–Whitney U-test with a Bonferroni correction were used to compare the dose-adjusted concentration of fentanyl with the severity of cachexia and to compare each laboratory finding with the stage of cancer cachexia. Multiple regression analysis was performed to identify the factors affecting the dose-adjusted concentration of fentanyl. The dose-adjusted plasma concentration of fentanyl was defined as the dependent variable, and AST, ALT, S-Cr, eGFR, ALB, and CRP were defined as the independent variables. The β values indicated dependent variables (variations in dose-adjusted plasma fentanyl concentrations) for certain amounts of changes in each of the six independent variables. Data were expressed as the median and interquartile range unless otherwise stated. P-values below 0.05 indicated significance.
Results
Patient demographics and characteristics
Patient information obtained from the medical records is shown in Table 1. Fifteen types of cancers were identified in 21 patients. The mean VAS score of the patients in this study was 25 (range 10–35) (Table 2). The VAS scores of all patients during the study period were stable. Adverse events were observed in six patients. Malaise and somnolence were observed in three and in four patients, respectively (Table 2 ).
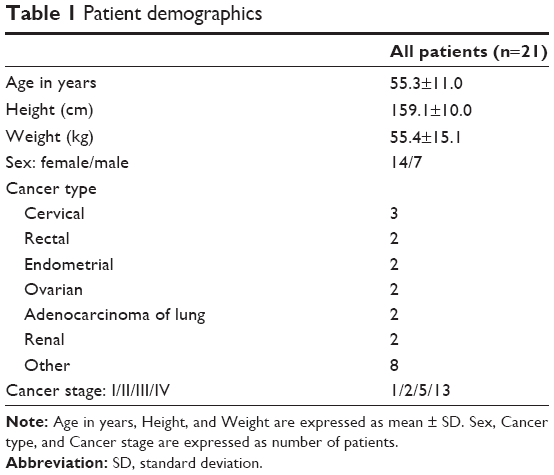 | Table 1 Patient demographics |
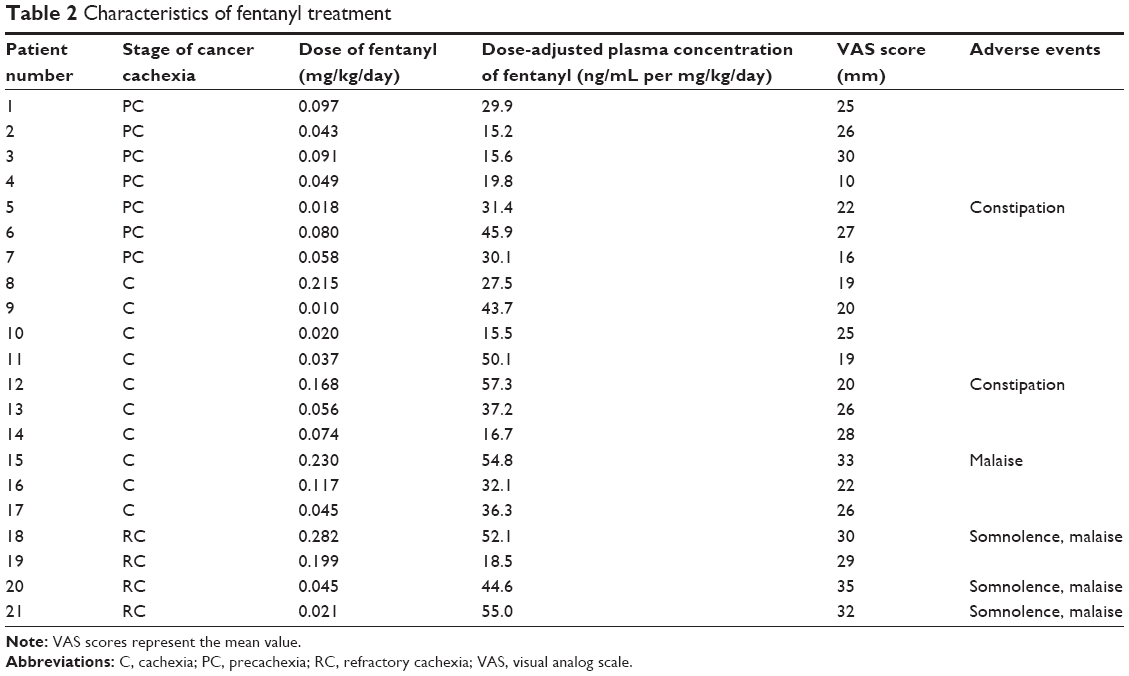 | Table 2 Characteristics of fentanyl treatment |
Influence of cancer cachexia on dose-adjusted fentanyl concentrations
The dose-adjusted concentration of fentanyl (ng/mL per mg/kg/day) (interquartile range) was 27.5 (15.6 -43.7) in patients with precachexia, 34.4 (19.7 -50.7) in those with cachexia, and 44.5 (27.3 -62.8) in those with refractory cachexia (Figure 1). Based on the results of the Kruskal–Wallis test and post hoc Mann–Whitney U-test, with a Bonferroni correction to compare the median dose-adjusted fentanyl concentrations with stages of cachexia, the dose-adjusted fentanyl concentration was significantly higher in patients with refractory cachexia than that in patients with precachexia (Figure 1) (P<0.005).
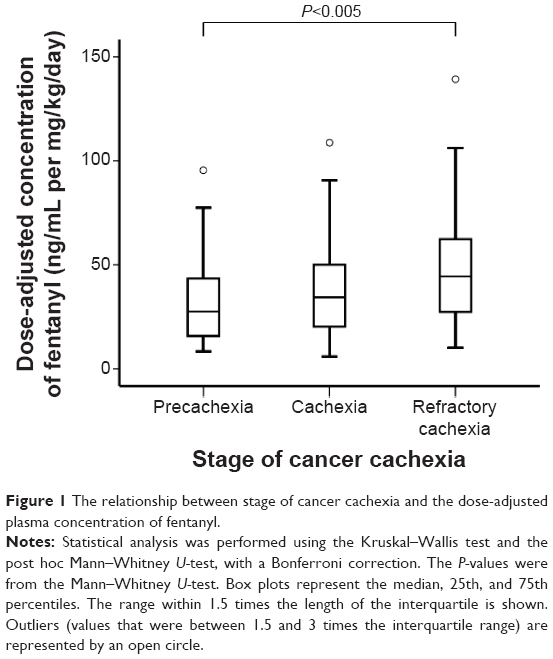 | Figure 1 The relationship between stage of cancer cachexia and the dose-adjusted plasma concentration of fentanyl. |
Patient characteristics based on stages of cancer cachexia
Body weight was significantly lower in patients with either cachexia or refractory cachexia than in patients with precachexia, and body mass index (BMI) decreased with the progression of cachexia (Table 3). ALB was significantly lower in patients with either cachexia or refractory cachexia than in patients with precachexia, and CRP was significantly higher in patients with either cachexia or refractory cachexia than in patients with precachexia. In cachexia patients, variations in both AST and ALT were within the normal range. On the other hand, although variations in S-Cr were within the normal range, eGFR in patients with cachexia and refractory cachexia was significantly lower.
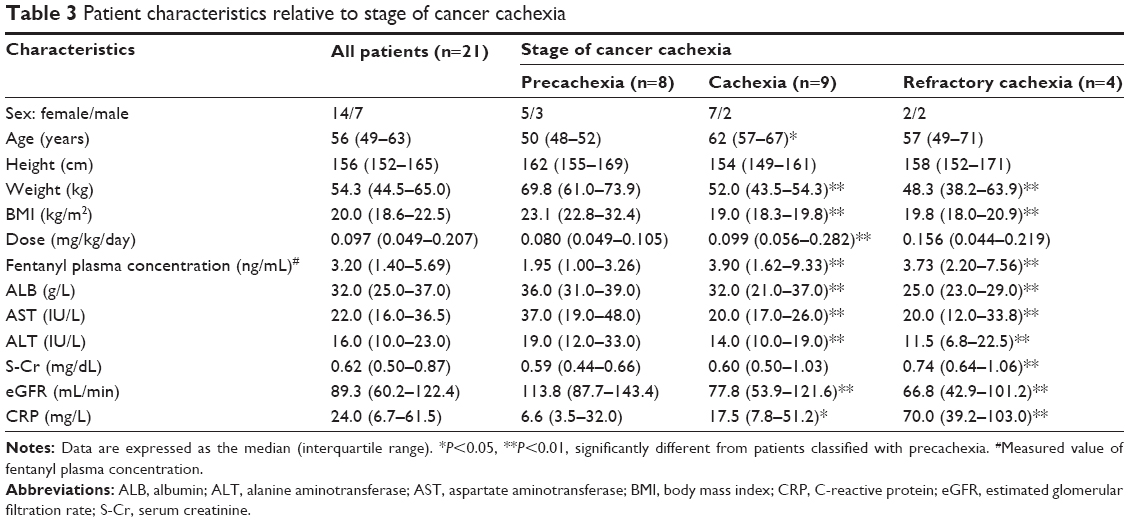 | Table 3 Patient characteristics relative to stage of cancer cachexia |
Relationship between the concentration of fentanyl and laboratory data
Multiple regression analysis, using SPSS, was performed to identify the factors affecting the dose-adjusted concentration of fentanyl. The results obtained are shown in Table 4. Three factors – AST, CRP, and eGFR – were found that might affect the dose-adjusted concentration of fentanyl (P<0.05). On the other hand, there was no significant effect of ALB, ALT, or S-Cr on the dose-adjusted concentration of fentanyl. Positive β indicated that the factor influenced the dependent variable (variations in dose-adjusted fentanyl concentrations) in a positive direction. Accordingly, the β was positive for AST, and an increase in the AST value may elevate the dose-adjusted concentration of fentanyl (β=0.198, P=0.010). Similarly, the β was positive for CRP, and the adjusted concentration of fentanyl may increase as CRP increases (β=0.216, P=0.003). On the other hand, the β was negative for eGFR, and the dose-adjusted concentration of fentanyl may increase as the eGFR decreases (β=−0.571, P<0.001).
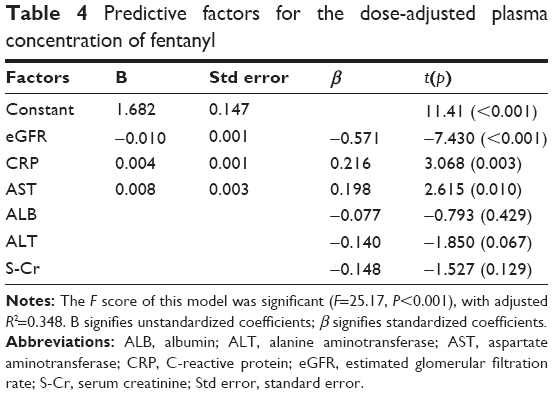 | Table 4 Predictive factors for the dose-adjusted plasma concentration of fentanyl |
Discussion
Our study showed that the dose-adjusted concentration of fentanyl was increased in patients with either cachexia or refractory cachexia. We demonstrated that such an increase was associated with a multifactorial and systemic syndrome in cancer cachexia patients, including lower ALB, higher CRP, and impaired kidney function. We presume that metabolic abnormalities in cachexia, such as inhibition of CYP3A4 and decline of renal function, might cause higher plasma concentrations of fentanyl. Therefore, evaluation of cancer cachexia might help pain management when using the transdermal fentanyl patch in palliative care.
Cancer cachexia is characterized by the ongoing loss of skeletal muscle mass, with or without the loss of fat mass; lack of a full response to conventional nutritional support; and progressive metabolic and physiological functional impairments.6,7 The pathophysiology of cachexia is characterized by a negative protein and energy balance driven by the variable combination of reduced food intake and abnormal metabolism.6,7 Cachexia is known to affect metabolizing enzymes, such as CYP3A4, which converts fentanyl to norfentanyl.4,9
In this study, dose-adjusted plasma concentrations of fentanyl increased with the progression of cancer cachexia. Although the influence of cancer cachexia on the plasma concentrations of fentanyl has been previously reported, the previously published results differ from our findings. The previous study reported that the plasma concentrations of fentanyl were lower in cachectic patients because absorption from the transdermal fentanyl patch was impaired in cachectic patients.13 We collected blood samples during the steady state of fentanyl plasma concentration, while blood sampling in the previous study was performed for 3 days after application of the first patch, before steady state was achieved. In addition, we used a 24-hour transdermal fentanyl patch, while the previous study used a 72-hour transdermal fentanyl patch. We believe that these differences in methodology explain the difference between our findings and those of the previous report.
Our results, obtained by multiple regression analysis, indicated that a reduction in the eGFR may increase fentanyl plasma concentrations. Approximately 90% of fentanyl is converted to norfentanyl in the liver by CYP3A4, and the other 10% is excreted unchanged by the kidney.4 Norfentanyl, the main metabolite of fentanyl, is inactive and has few effects as a stored metabolite; therefore, fentanyl can generally be administered to patients with kidney failure. However it was reported that clearance of fentanyl in patients with kidney failure was lower than that in patients without kidney failure.14 Although fentanyl is recommended for severe pain for patients with chronic kidney disease, reduction in dose and frequency may be advisable for these patients.15 Our results also suggested that the eGFR should be evaluated when administering fentanyl to kidney failure patients. Therefore, we suggest that a lower kidney function in patients with cancer cachexia might result in an increase in the plasma concentration of fentanyl.
Our results also indicated that an increase in both CRP and AST may elevate the plasma concentration of fentanyl. Cachexia is known to influence drug metabolism, which may affect fentanyl levels.9 Mantovani et al previously reported that the inflammatory cytokines, which induce the production of acute-phase proteins, including CRP, and inhibit the synthesis of ALB in the liver, were elevated with the progression of cachexia.16 High CRP and low ALB may be caused by the increased release of inflammatory cytokines in cancer cachexia patients. It was reported that inflammatory cytokines caused a reduction in the levels of CYP3A4 messenger (m)RNA and downregulated the expression of CYP3A4.17,18 Naito et al reported that cachexia raised the plasma concentrations of oxycodone, a potent opioid that is metabolized, via CYP3A4, as fentanyl.10 They explained that the plasma concentrations of oxycodone in cachexia patients might be increased by a reduction in CYP3A activity. We suggest that the systemic inflammation occurring with the progression of cachexia might decrease the metabolism of fentanyl by CYP3A4 in the liver and thereby increase the concentration of fentanyl in the blood. Although inflammatory cytokines may influence liver function, the relationship between inflammation and AST has yet to be elucidated in detail.
Although our sample size was limited, we demonstrated that the higher plasma concentration of fentanyl in patients with either cachexia or refractory cachexia was associated with a multifactorial and systemic syndrome, including lower ALB, higher CRP, and impaired kidney function. Therefore, the severity of cachexia should be considered when determining the dose of fentanyl, in order to prevent adverse events caused by too high plasma concentrations of fentanyl. The influence of cancer cachexia on the plasma concentrations of fentanyl should be evaluated in larger trials.
The important point in transdermal fentanyl therapy is that there is significant interpatient variability in plasma drug concentration. One of our patients with refractory cachexia received a fentanyl patch at a dose of 18 mg/day and suffered somnolence (grade 3). The patient’s plasma fentanyl concentration was 14.7 ng/mL. The dose of fentanyl was then reduced to 10 mg/day, and the plasma concentration of fentanyl decreased to 5.8 ng/mL, resulting in good pain control without somnolence. An optimal therapeutic concentration of fentanyl has not yet been established. The interview form for the transdermal fentanyl patch provided by the company contained the following information:19 Although the effective plasma concentration of fentanyl in patients with no opioid resistance is generally 0.2–1.2 ng/mL, when either pain increases or pain tolerance occurs, the effective plasma concentration also increases. In the present case, reduction in the dose of fentanyl was needed due to severe somnolence, but the plasma concentration of fentanyl in this case was higher than that range. This case indicates that evaluation of cachexia could lead to good pain control using the fentanyl patch, in hard-to-manage patients.
Conclusion
The dose-adjusted plasma concentrations of fentanyl increased with progression of cancer cachexia. Such an increase is associated with a multifactorial and systemic syndrome in cancer cachexia patients, including lower ALB, higher CRP, and impaired kidney function. In patients with cachexia, we suggest that evaluation of cachexia might help pain management using a transdermal fentanyl patch in palliative care.
Disclosure
The authors report no conflicts of interest in this work.
References
van den Beuken-van Everdingen MH, de Rijke JM, Kessels AG, Schouten HC, van Kleef M, Patijn J. Prevalence of pain in patients with cancer: a systematic review of the past 40 years. Ann Oncol. 2007;18(9):1437–1449. | ||
Menahem S, Shvartzman P. High-dose fentanyl patch for cancer pain. J Am Board Fam Pract. 2004;17(5):388–390. | ||
Radbruch L, Sabatowski R, Petzke F, Brunsch-Radbruch A, Grond S, Lehmann KA. Transdermal fentanyl for the management of cancer pain: a survey of 1005 patients. Palliat Med. 2001;15(4):309–321. | ||
Labroo RB, Paine MF, Thummel KE, Kharasch ED. Fentanyl metabolism by human hepatic and intestinal cytochrome P450 3A4: implications for interindividual variability in disposition, efficacy, and drug interactions. Drug Metab Dispos. 1997;25(9):1072–1080. | ||
Grond S, Radbruch L, Lehmann KA. Clinical pharmacokinetics of transdermal opioids: focus on transdermal fentanyl. Clin Pharmacokinet. 2000;38(1):59–89. | ||
Fearon K, Strasser F, Anker SD, et al. Definition and classification of cancer cachexia: an international consensus. Lancet Oncol. 2011;12(5):489–495. | ||
Radbruch L, Elsner F, Trottenberg P, Strasser F, Fearon K. Clinical Practice Guidelines on Cancer Cachexia in Advanced Cancer Patients with a Focus on refractory Cachexia. Aachen: Department of Palliative Medicine, European Palliative Care Research Collaborative; 2010. Available from: http://www.epcrc.org/guidelines.php?p=cachexia. Accessed February 15, 2015. | ||
Douglas E, McMillan DC. Towards a simple objective framework for the investigation and treatment of cancer cachexia: the Glasgow Prognostic Score. Cancer Treat Rev. 2014;40(6):685–691. | ||
Slaviero KA, Clarke SJ, Rivory LP. Inflammatory response: an unrecognised source of variability in the pharmacokinetics and pharmacodynamics of cancer chemotherapy. Lancet Oncol. 2003;4(4):224–232. | ||
Naito T, Tashiro M, Ishida T, Ohnishi K, Kawakami J. Cancer cachexia raises the plasma concentration of oxymorphone through the reduction of CYP3A but not CYP2D6 in oxycodone-treated patients. J Clin Pharmacol. 2013;53(8):812–818. | ||
Food and Drug Administration [homepage on the Internet]. Silver Spring: Guidance for industry analytical procedures and methods validation for drugs and biologics. [updated 2014 Feb; cited 2014 Sep 10] Available from: http://www.fda.gov/downloads/Drugs/GuidanceComplianceRegulatoryInformation/Guidances/UCM386366.pdf. Accessed September 10, 2014. | ||
National Institutes of Health [homepage on the Internet]. Bethesda: Common Terminology Criteria for Adverse Events (CTCAE) Version 4.03, vol. 2009; 2010. [updated 2010 Jun 14; cited 2014 Sep 10] Available from: http://evs.nci.nih.gov/ftp1/CTCAE/CTCAE_4.03_2010-06-14_QuickReference_8.5x11.pdf. Accessed September 10, 2014. | ||
Heiskanen T, Mätzke S, Haakana S, Gergov M, Vuori E, Kalso E. Transdermal fentanyl in cachectic cancer patients. Pain. 2009;144 (1–2):218–222. | ||
Koehntop DE, Rodman JH. Fentanyl pharmacokinetics in patients undergoing renal transplantation. Pharmacotherapy. 1997;17(4):746–752. | ||
Pham PCT, Toscano E, Pham PMT, Pham PAT, Pham SV, Pham PTT. Pain management in patients with chronic kidney disease. NDT Plus. 2009;2(2):111–118. | ||
Mantovani G, Macciò A, Madeddu C, et al. Quantitative evaluation of oxidative stress, chronic inflammatory indices and leptin in cancer patients: correlation with stage and performance status. Int J Cancer. 2002;98(1):84–91. | ||
Rivory LP, Slaviero KA, Clarke SJ. Hepatic cytochrome P450 3A drug metabolism is reduced in cancer patients who have an acute-phase response. Br J Cancer. 2002;87(3):277–280. | ||
Jover R, Bort R, Gómez-Lechón MJ, Castell JV. Down-regulation of human CYP3A4 by the inflammatory signal interleukin-6: molecular mechanism and transcription factors involved. FASEB J. 2002;16(13):1799–1801. | ||
Fentos® tape [Drug interview form]. Saga, Japan: Hisamitsu Pharmaceutical Co., Inc. and Tokyo: Kyowa Hakko Kirin Co., Ltd.; 2011. |
 © 2015 The Author(s). This work is published and licensed by Dove Medical Press Limited. The full terms of this license are available at https://www.dovepress.com/terms.php and incorporate the Creative Commons Attribution - Non Commercial (unported, v3.0) License.
By accessing the work you hereby accept the Terms. Non-commercial uses of the work are permitted without any further permission from Dove Medical Press Limited, provided the work is properly attributed. For permission for commercial use of this work, please see paragraphs 4.2 and 5 of our Terms.
© 2015 The Author(s). This work is published and licensed by Dove Medical Press Limited. The full terms of this license are available at https://www.dovepress.com/terms.php and incorporate the Creative Commons Attribution - Non Commercial (unported, v3.0) License.
By accessing the work you hereby accept the Terms. Non-commercial uses of the work are permitted without any further permission from Dove Medical Press Limited, provided the work is properly attributed. For permission for commercial use of this work, please see paragraphs 4.2 and 5 of our Terms.