")
Back to Journals » Journal of Inflammation Research » Volume 15
Reduction of Hepatic Steatosis, Oxidative Stress, Inflammation, Ballooning and Insulin Resistance After Therapy with Safranal in NAFLD Animal Model: A New Approach
Authors Sabir U , Irfan HM , Alamgeer, Ullah A , S Althobaiti Y, Asim MH
Received 19 December 2021
Accepted for publication 9 February 2022
Published 24 February 2022 Volume 2022:15 Pages 1293—1316
DOI https://doi.org/10.2147/JIR.S354878
Checked for plagiarism Yes
Review by Single anonymous peer review
Peer reviewer comments 3
Editor who approved publication: Professor Ning Quan
Usman Sabir,1 Hafiz Muhammad Irfan,1 Alamgeer,2 Aman Ullah,3 Yusuf S Althobaiti,4,5 Mulazim Hussain Asim1
1Department of Pharmacology, College of Pharmacy, University of Sargodha, Sargodha, Punjab, Pakistan; 2Punjab University College of Pharmacy, University of the Punjab, Lahore, Punjab, Pakistan; 3College of Pharmaceutical Sciences, Shifa Tameer-e-Millat University, Islamabad, Pakistan; 4Department of Pharmacology and Toxicology, College of Pharmacy, Taif University, Taif, Saudi Arabia; 5Addiction and Neuroscience Research Unit, Taif University, Taif, Saudi Arabia
Correspondence: Hafiz Muhammad Irfan, Department of Pharmacology, College of Pharmacy, University of Sargodha, Sargodha, 40100, Punjab, Pakistan, Tel +92 3334673193, Email [email protected] Yusuf S Althobaiti, Department of Pharmacology and Toxicology, College of Pharmacy, Taif University, P.O. Box 11099, Taif, 21944, Saudi Arabia, Email [email protected]
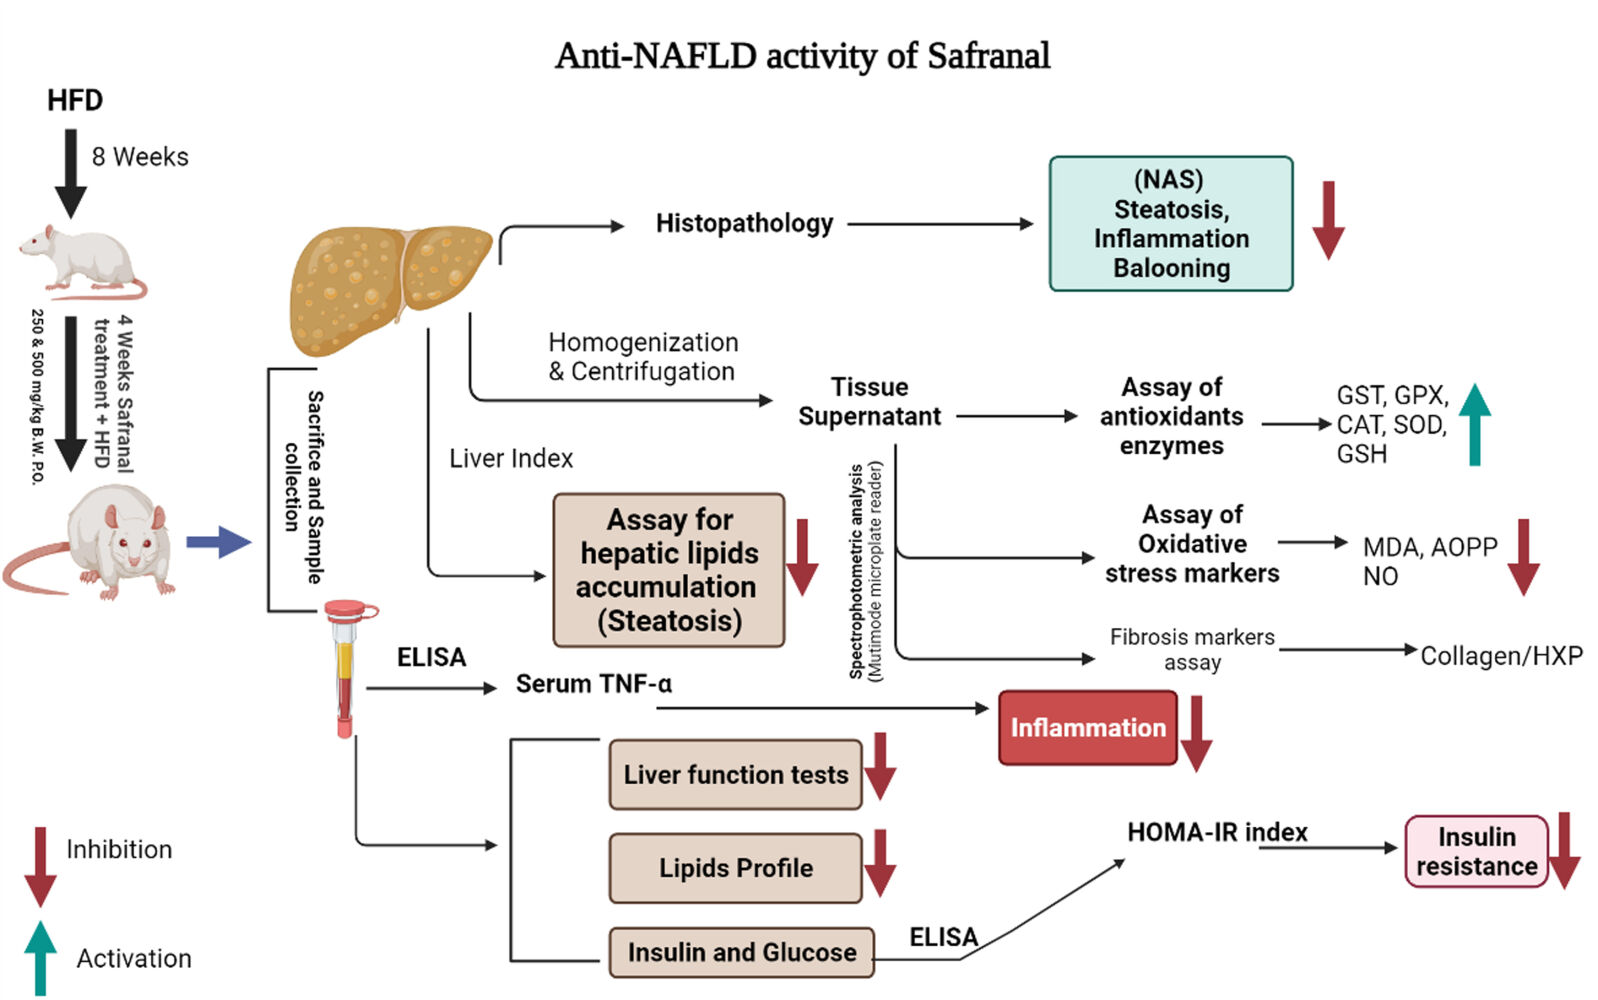
Introduction: Non-alcoholic fatty liver disease (NAFLD) is intimately linked to hepatic steatosis, inflammation, insulin resistance (IR), oxidative stress (OS), and ballooning. A high fat diet (HFD) is considered a major etiological factor that primarily covers the numerous features of NAFLD.
Methods: The present study aimed to evaluate the protective effect of safranal on hepatic steatosis, OS, liver index, IR index, liver function enzymes, plasma lipids, TNF-α, malondialdehyde (MDA), advanced oxidation protein products (AOPPs) and nitrite (NO2–) levels in a NAFLD rat model fed with a HFD for 12 weeks. The ELISA kits were used to measure TNF-α and insulin in serum and plasma, respectively.
Results: HFD significantly induced hepatic steatosis, OS, IR, liver, and oxidative enzyme elevation and inflammation in experimental animals. Rats treated with safranal in ascending order of doses 250 and 500 mg/kg orally for 4-weeks showed a reduction in hepatic lipid’s accumulation, liver index, hepatic enzymes, collagen, hepatic oxidonitrative stress markers (like AOPP, MDA and NO2–), and raised the levels of catalase (CAT) and superoxide dismutase (SOD) enzymes. Glutathione system components, namely glutathione (GSH), glutathione peroxidase (GPx), and glutathione-S-transferase (GST) levels were also restored in the safranal-treated groups. The reduction in serum TNF-α and IR provided further support to the anti-NAFLD effect of safranal. Moreover, the histopathological images indicated reverse of NAFLD activity score (NAS) through mild fatty degeneration, ballooning and inflammation in hepatocytes of treated groups.
Conclusion: Findings of blood and tissue analysis concluded that safranal can be a good choice in the management and cure of NAFLD.
Keywords: non-alcoholic fatty liver disease, inflammation, insulin resistance, glutathione, safranal
Graphical Abstract:
Introduction
Non-alcoholic fatty liver disease (NAFLD) is a multifactorial metabolic disorder defined by an abnormal accumulation of lipids in the hepatocytes that exceeds 5% of its weight.1 Currently, it affects 25–30% of the world’s population and causes 90% of the morbidity in individuals with type-2 diabetes mellitus (T2DM). The increasing prevalence of NAFLD in children and adolescents is even more alarming, with 7% in the general population and 34% among obese children.2 The exact pathophysiology is not entirely understood, and a “double-hit” hypothesis may help to elucidate the condition. The intrahepatic lipid’s deposition or simple steatosis is considered as first-hit (stage-1). If it is not resolved, it progresses to an inflammatory state’ non-alcoholic steatohepatitis (NASH, stage-2) and can lead to hepatic fibrosis, irreversible cirrhosis, and hepatocellular cancer.3 Visceral obesity and NAFLD are primarily risk factors for systemic inflammation and extra-hepatic disorders.4
The intake of a high-fat diet (HFD) has long been accepted as a major risk factor for developing NAFLD.5 Furthermore, it can be associated with other metabolic diseases such as dyslipidemia, mitochondrial dysfunction, oxidative stress (OS), insulin resistance (IR), and inflammation, add-on to the typical characteristics of NAFLD and the progressive NASH stage.6 Subsequently, the formation of reactive oxygen species (ROS) in hepatocytes might culminate in lipotoxicity and glucotoxicity.7 Oxidative damage to cellular macromolecules promotes the production of malondialdehyde (MDA) and the depletion of enzymatic and non-enzymatic antioxidant defenses, such as the glutathione (GSH) system.1 The imbalance in antioxidant mechanisms of hepatocytes causes mitochondrial and endoplasmic reticulum (ER) stress and ultimately cellular apoptosis.8
Furthermore, HFD and its associated OS promote the synthesis of inflammatory cytokines, such as tumor necrosis factor-α (TNF-α) in the liver.9 The activation of subsequent inflammatory pathways and collagen deposition eventually cause the progression of fatty liver disease into steatohepatitis and fibrosis.10 IR is considered a primary mechanism behind the development and progression of NAFLD, causing steatosis through a vicious cycle.11 The deposition of lipids, TNF-α, and OS in the liver may impair insulin signaling and the expression of the enzymes involved in glucose and lipid metabolism.12 In selective hepatic IR, the gluconeogenesis arm of the insulin signaling pathway remains responsive to hyperinsulinemia and exacerbates steatosis.13
There is currently no FDA-approved medication to treat NAFLD, and with the global prevalence of the disease constantly growing, it is imperative to develop a therapeutic alternative.4 According to the literature, lipid profile optimization, improvement in IR, and recovery in OS are all desirable therapeutic targets in patients with this disease and constitute a substantial area of research.14 Natural products are now being explored as possible therapeutic agents for the treatment of NAFLD, with various underlying mechanisms. Numerous studies have demonstrated that polyphenols, flavonoids, and alkaloids have therapeutic benefits in metabolic diseases, notably obesity, T2DM, and NAFLD.15 Furthermore, terpenoids have been identified as antioxidant, anti-inflammatory, anti-hyperglycemic, anti-cancer, and immunomodulatory chemical compounds and have been shown to exhibit anti-fatty liver activities.16,17
Safranal is the active constituent of saffron (B.O.: Crocus sativus), and it is derived from the essential oil extracted from the plant’s stigma. It is a monoterpene molecule with the systematic name 2, 6, 6-trimethylcyclohexa-3,1-din-1-carboxaldehyde. The oral LD50 value of safranal is 5.53 mL/kg in male rats.18 Saffron was reported to possess anti-NAFLD activity in animal models.19 The active compound safranal has previously been reported to possess antioxidant, anti-diabetic, anti-inflammatory, hepatoprotective, and nephroprotective20–24 activities in various drug-induced animal models. Therefore, the current investigation was primarily designed to study its potential activity in a high-fat diet-induced NAFLD animal model.
Materials and Methods
Chemicals, Kits, and Drugs
Safranal (BIDE Pharmatech Ltd. China, CAS# 116-26-7). Reduced glutathione (GSH) and N-(1-naphthyl) ethylenediamine dihydrochloride (NED) from Chem Impex Intl., USA. Chloramine-T (Uni-chem), Ellman’s reagent (BDH Chemicals Ltd. England), hydroxyproline (HXP), Ehrlich’s reagent and nicotinamide adenine dinucleotide phosphate (AmBeed USA) and sulphanilamide (MP Biomedicals Inc France). DTNB (AnalaR BDH Germany), CDNB, TBA, BSA and pyrogallol (Sigma-Aldrich Germany). Insulin ELISA kit (CAT # 4-83474-96T, Lot # 20210415) and TNF-α ELISA kit (CAT # 83646, Lot # 20218415) were purchased from Zokeyo Biotechnologies Co. Ltd. Wuhan China. ALT, AST, and ALP assay kits (LABKIT Chemilex S.A. Pol. Ind. Spain), conventional biochemical kits of triglycerides (TGs), total cholesterol (TC), and high-density lipoprotein cholesterol (HDL-C) (BIOMED MDSS GMBH Sciffgr aben. Germany) and uric acid assay kit (Randox Laboratories UK). The standard botanical mixture (LivLiv® by Hinucon Pharmaceuticals Karachi Pakistan) is a combination product of siliphos (silybin) and extracts of Cynara Cardunculus (artichoke) and Curcuma longa (turmeric).
Animal Housing
The six-week-old-male Sprague-Dawley (SD) rats of weight 150–200 g were utilized in the study. Animals were obtained from the Animal House of the College of Pharmacy, University of Sargodha, Sargodha, Pakistan. All the animals were housed and treated according to guidelines approved by the “Animal Ethics Committee, College of Pharmacy, University of Sargodha, with voucher number (SU/ORIC/2861/2021) for this research protocol.
Animals Grouping, Dosing, and Study Protocol
Initially, preliminary pilot screening for model validation with hypercaloric diet, and different dosing range for safranal was performed on some rats. The disease induction for obesity and NAFLD was confirmed by anthropometric, histopathological, and blood parameters. In a proper treatment model, 30 rats were randomly divided into five groups (n = 6) for a total period of twelve weeks (Table 1). Except for the normal control group (NC), all other rats received HFD for eight weeks, followed by four weeks of drug treatment administered daily through oral gavage, with diet pattern as given during the first eight weeks. To compute the dose of a standard botanical mixture, a formula for Human Equivalent Dose (HED) of rats was employed. Safranal and standard botanical mixture was dissolved in 2% Tween 80 before administration. The vehicle control/NC group and HFD/DC groups were only treated with 2% Tween 80 (10 mL/kg) throughout the treatment period. The body weight of each rat and blood sugar level were measured every week.
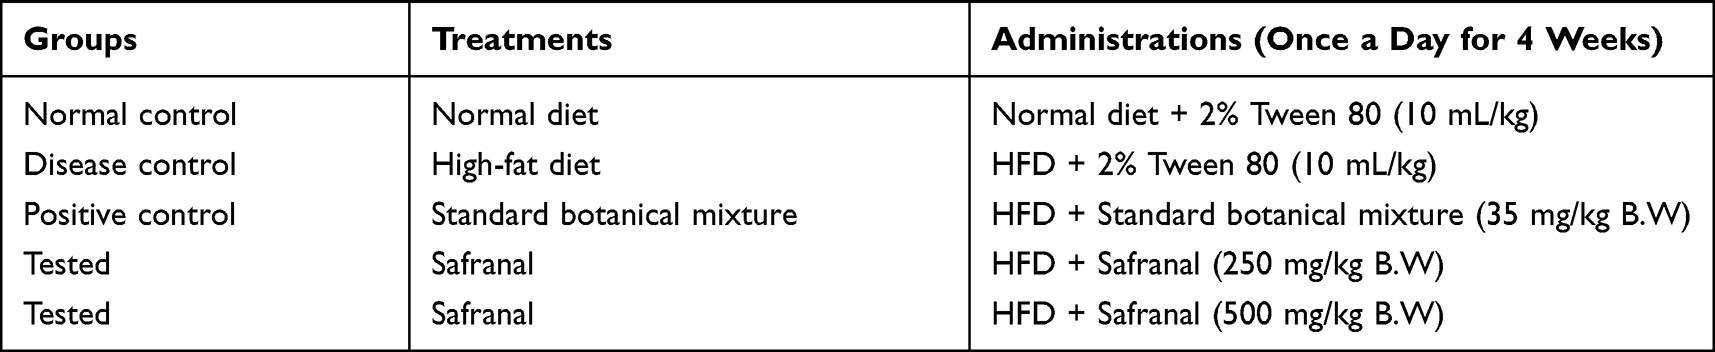 |
Table 1 Animal Grouping, Treatments, and Administrations |
Composition of HFD and Normal Diet (ND)
Table 2 shows the total calories and ingredients used in making normal and HFD diets. The diet was prepared by properly mixing all the ingredients and baking them in a 40°C oven. Finally, the food was sliced into small pellets before being fed to the rats.
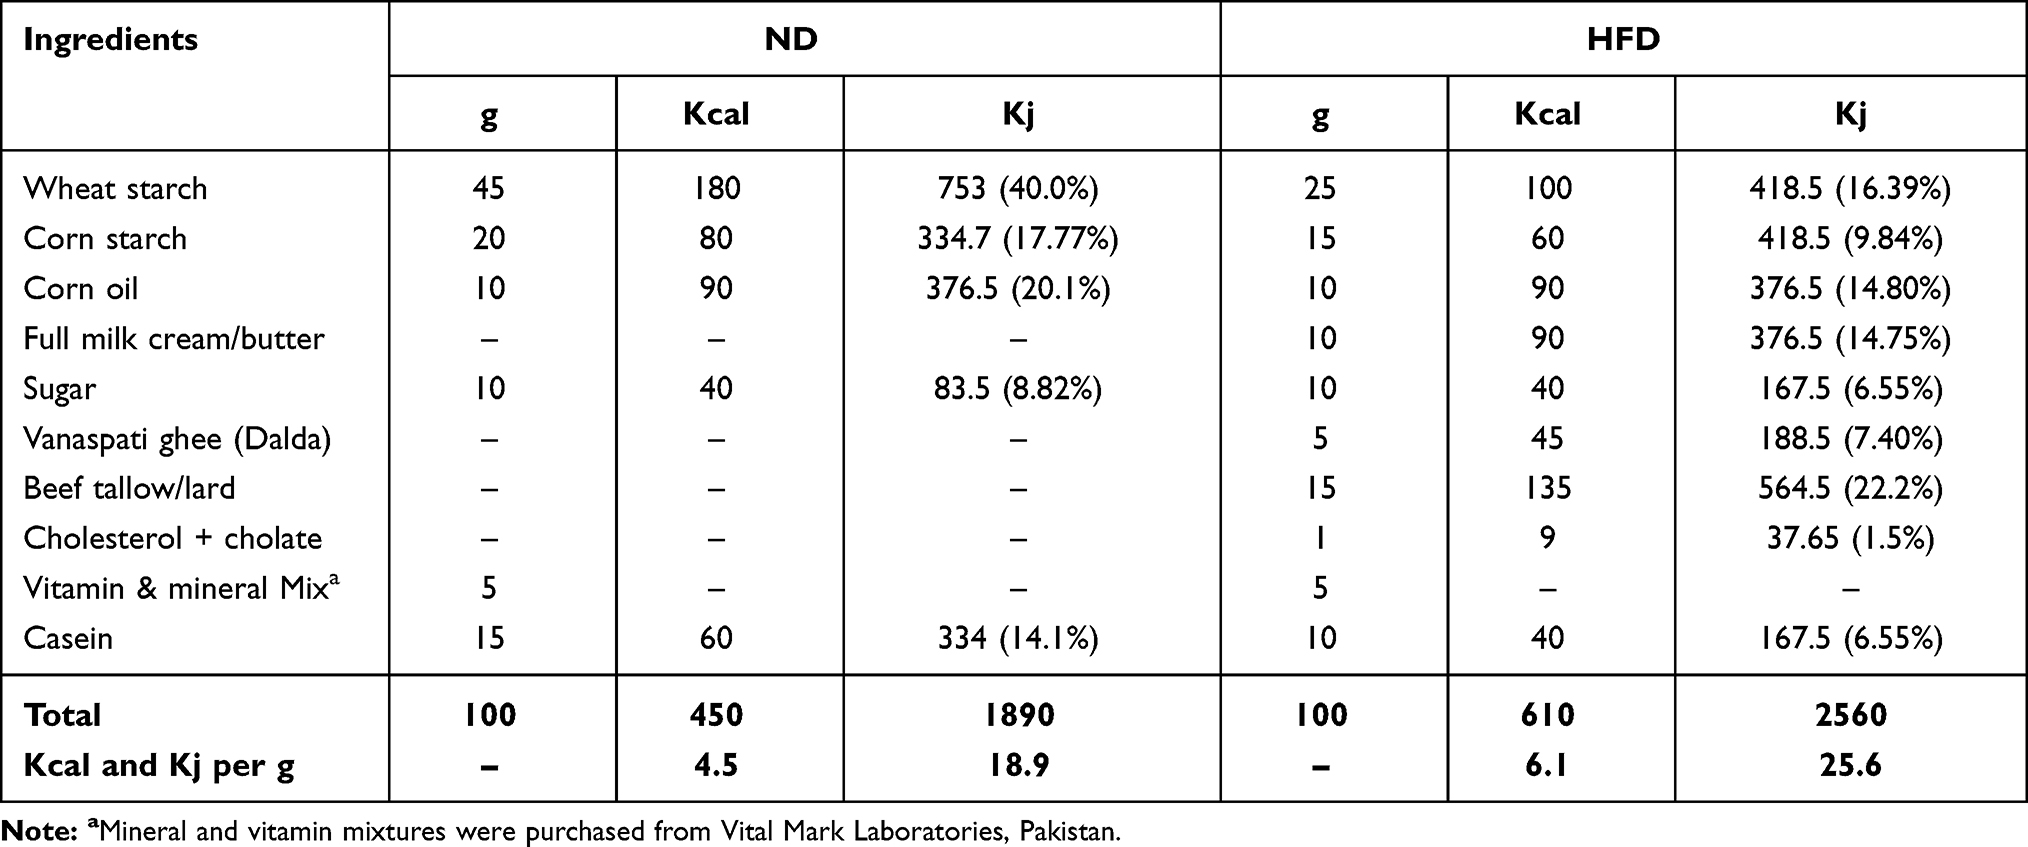 |
Table 2 Composition of Ingredients in ND and HFD Showing Calorie Content of a Normal Diet Expressed as a Percentage of Calories; 15% Protein, 65% Carbohydrates, and 20% Fat and Calorie Content of a High-Fat Diet Expressed as a Percentage of Calories; 10% Protein, 30% Carbohydrates, and 60% Fat |
Determination of Anthropometric Parameters and Oral Glucose Tolerance Test (OGTT)
The effect of safranal on the quantity of food, daily calorie intake, and water taken up by treated animals was determined by measuring the total amount of food or water remaining each day for each batch. The effect of the drugs on the weight of the treated animals was determined throughout the study period. After the study was completed, the body mass index (BMI) was computed. The formula for calculating food efficiency is as follows:

Before the last day of the study, an oral glucose tolerance test (OGTT) was conducted. The rats were fasted overnight before receiving an oral glucose load (2 g/kg). Glucose levels were tested at 0-, 30-, 60-, and at 120-minute intervals using blood collected from the tail vein. Glucose tolerance levels were estimated by drawing an x-y graph between time and blood glucose levels (mg/dL) and finally calculated the area under the curve (AUCglucose) through trapezoidal rule on Graph Pad Prism 5.0, for each animal in each group.25
Animal’s Sacrifice, Samples Collection and Relative Organ Weights
The animals were weighed at the end of treatment, the fasting blood glucose (FBG) levels were checked, and they were finally sacrificed by injecting anesthesia of ketamine and xylazine mixture (90 and 10 mg per kg, respectively) into the peritoneal region. Blood samples were collected through cardiac puncture and transferred equally in blood collecting tubes for plasma and serum. Centrifugation was done (Spectrafuge 6C-Labnet int.) for 15 minutes at 2500 rpm, and the samples were stored at −20°C in chiller until further analysis.
After the blood collection, the organs (liver and adipose tissues) were immediately taken out and weighed. The liver weight, epididymal fat pads, and fat pads deposited on the retroperitoneal and perirenal abdominal walls were recorded in each animal. The liver was washed with physiological saline solution and divided into two parts. One part was stored in a freshly prepared 10% neutral formalin buffer for histopathological examination, and the second was kept at −20°C for other assays. The Adiposity and liver index were calculated using the following formula:


Biochemical Analysis in Blood
The liver enzymes, such as AST, ALP, and ALT levels and uric acid concentration, were quantified using conventional enzymatic kits with an automatic blood bio-analyzer (Biosystems BTS 350 Spain). The ratio of serum AST and ALT (U/L) or De-Ritis ratio was calculated to estimate the progression of NAFLD as a non-invasive marker. The plasma lipid profiles, such as TC, TGs, HDL-C, VLDL-C, and LDL-C levels, were quantified utilizing conventional enzymatic kits according to manufacturer protocol with an automatic blood bio-analyzer. The atherogenic index was determined using the equation:

ELISA Assessment of Insulin (µiu/mL) and TNF-α (Pg/mL) Concentrations
According to the company’s instructions, plasma insulin and serum TNF-α concentrations were assessed by ELISA kits (size = 96 wells). The standard curve range for insulin was 1.5 mIU/L - 48 mIU/L with a sensitivity of 0.1 mIU/L. The standard curve range for TNF-α was 10 pg/mL–320 pg/mL with a 1.0 pg/mL sensitivity. By adding acidic solution, the reaction was terminated, and absorbance readings were noted at 450 nm on a multimode microplate reader (Synergy, USA). The HOMA-IR index was calculated by multiplying the fasting blood glucose (mM/L) and fasting insulin (mIU/L) levels and dividing by a constant.26
Histopathological Determination
A light microscope equipped with a camera was used to examine histological pictures of hepatic tissues. 10% neutral buffered formalin was used to fix the liver tissues, then embedded in a paraffin block. The 6-µm sections were cut and mounted on a glass slide, and applying xylene and alcohol; paraffin was removed. After staining with hematoxylin and eosin (H&E) and dehydration with alcohol, images were captured with a microscope (Olympus CX31, UK) at a resolution of (100x and 400x). All fields in each section were graded for steatosis, necrosis, inflammation, and ballooning. To determine the severity of NAFLD, the NAFLD activity scoring (NAS) system was employed. Micro- and macrovesicular steatosis were assessed using the percentage of involved hepatocytes (0 = absent; 1 indicated less than 33%; 2 = 33–66% and 3 indicated greater than 66% hepatocytes involved). Hepatic inflammation was graded on a scale of 0 to 3; 0 indicated no inflammation, 1 indicated mild inflammation, 2 indicated moderate inflammation, and 3 indicated severe focal zone hepatocyte inflammation. The presence of ballooning, which is utilized to differentiate developing NASH from NAFLD, was rated on a scale of 0 to 2; 0 showed no ballooning cells, 1 represented a few ballooning hepatocytes, and 2 represented many ballooning hepatocytes. An activity score was measured by summing the individual values; where a NAS of less than three was associated with mild NAFLD, a NAS of three to four was related to moderate NAFLD, and a NAS of five was correlated with NASH.27
Liver Lipid’s Extract for TGs and Cholesterol Measurement
The liver total lipids were extracted through Folch’s procedure,28 with slight modification. The 25 mg frozen liver tissue was taken, added into it 100 µL phosphate buffer saline (PBS) (w/v, pH 7.4), and minced with scissors in an Eppendorf tube. Then, this hepatic mixture was added to 500 µL of an extracting solvent containing chloroform and methanol in the ratio of 2:1 in test tube and homogenized with a homogenizer (Lambic TH-mini-USA, L-C119-0524). After vortexing (Heidolph, Germany), the tubes were centrifugated at 2500 rpm for 5 minutes at 4°C, and supernatant was transferred to another test tube. This mixture was then washed with 100 µL of 0.9% normal saline (NS) at room temperature (RT) and finally allowed to stand for the separation of the components into layers. The lower layer contained lipids, transferred to another test tube, and evaporated on a water bath at 70°C, and then dried. After adding 100 μL of PBS to this residue, 10 μL of the mixture was taken out to measure TGs and cholesterol content using conventional TGs and cholesterol quantitation kits on biosystems bioanalyzer and the unit was expressed as mg/g liver.
Preparation of Tissue Supernatants and Total Protein Contents Estimation (TPCE)
The frozen hepatic tissue (100 mg) of each rat was homogenized in one mL of ice-cold 50 mM phosphate buffer (pH 7.4), followed by centrifugation at 10,000 rpm for 15 minutes at 4°C. After that, the supernatant was collected from 10% prepared homogenate, and the pellet was discarded. The resultant supernatant is called post-mitochondrial supernatant (PMS) that contains microsomal plus soluble fraction of cells. The supernatants were used for the measurement of liver proteins, enzymatic and non-enzymatic antioxidants.29
Total protein content was assayed by the procedure described by Lowry et al. Waterborg30 and modified for 96-well plates, with bovine serum albumin (BSA) used as standard. Initially, 33 µL of sample aliquot was added to each well, loaded with 150 µL of reagent-1 and incubated for 10 minutes. The reagent-2 (folin-phenol chemical) was freshly prepared in distilled water (DW) (1:1), vortexed and allowed to stand for 20 minutes in a dark environment. It was added in a quantity of 17 µL in all wells and again incubated for 20 minutes. The reading for absorbance was noted at 750 nm on a microplate reader. The total protein concentration (mg/mL) in the samples was determined using the BSA curve (Cpr), in the range of 25 to 250 µg per well. The values were used in the calculations of concentrations and specific activities of enzymatic and non-enzymatic antioxidants.
Hepatic Oxidative Stress (OS) Markers
Liver Malondialdehyde (MDA) Assay
MDA levels in liver tissues were determined using the technique of Ohkawa et al31 modified for 96-well plates. Initially, frozen liver was collected from the chiller. The samples were weighed, ie, 100 mg liver tissue was thawed and homogenized in 1 mL of 1.15% potassium chloride (KCl) to make 10% homogenate. After taking 0.1 mL of 10% homogenate from each sample in eppendorf, 50 µL of (8%) sodium lauryl sulfate, 375 µL of (20%) glacial acetic acid and 375 µL (0.8%) of TBA were added to it. Blank contained 0.1 mL of 1.15% KCl instead of homogenate. This mixture was incubated for a period of 1 h at 98°C. Upon cooling, 1.25 mL of n-butanol-pyridine was added to this mixture, vortexed for 2 minutes, and finally centrifuged at 8000 rpm for 20 minutes. The supernatant (pink color layer) in the quantity of 150 µL was carefully obtained and shifted to 96-well microplate, and absorbance was measured at 532 nm. The standard curve was plotted between the values of absorbance and MDA concentrations in the range of 10 to 1 µM/mL. The sample values were subtracted from blank, and MDA (µM/mL) was directly calculated from the calibration curve and expressed as µM/mg protein.
Advanced Oxidation Protein Products (AOPPs) Assay
The AOPPs were determined by spectrophotometric analysis, as described by Tiwari et al.32 By comparing unknown samples to a predetermined chloramine-T standard curve, the AOPPs concentration was calculated. Initially, 170 µL of sample supernatant obtained from freshly prepared 10% hepatic homogenate as described above (100 mg/mL in PBS of pH 7.4) has been added to the 96 well microplate and diluted 1:5 times through PBS. After 2 min, potassium iodide (KI) (10 µL of 1.16 M) was added to each well, followed by 20 µL acetic acid. On a microplate reader, the absorbance of the reaction mixture was immediately read at 340 nm compared to a blank solution comprising 170 µL of PBS, 10 µL of KI, and 20 µL of acetic acid. The corrected absorbance of chloramine-T at 340 nm was determined and linearized for the concentration range of 0 to 100 nM/mL. Concentrations of AOPPs in unknown samples were represented as nM/mL chloramine-T equivalents and as nM/g tissue, respectively. The formula is;

Here, X: AOPP concentration (nM/mL) chloramine-T equivalents; V total: reaction total volume, 200 µL; V sample: volume of sample added to reaction, 170 µL; V sample-total: tissue homogenate volume, 1 mL; W: sample quality, 100 mg (0.1 g); df: dilution factor, 5.
Nitric Oxide (NO) Assay as Nitrite (NO2–)
The levels of liver nitric oxide (NO) as its metabolite nitrite (NO2–) were calculated by the method of Green et al.33 Initially, the deproteinization of 5% tissue supernatant was done with 5% trichloroacetic acid (TCA) (sample: TCA, 1:9, v/v), followed by centrifugation at 10,000 rpm for 20 min and at 4°C. The aliquot of the supernatant was taken for assay by using Griess reagent. Sodium nitrite (NaNO2) calibration curve (100, 50, 25, 12.5, 6.25, 3.13 and 1.56 μM) was prepared from 0.1 M stock solution. The 50 μL of each experimental sample was added to the 96-well plate. Using a multichannel pipette, 50 μL solution of the sulfanilamide (1% or 10 mg/mL in 5% phosphoric acid) was dispensed to all wells. The plate was incubated for 10 min at RT and protected from light followed by the addition of 50 μL (1 mg/mL or 0.1%) N-(1-naphthyl) ethylenediamine dihydrochloride (NED) solution to all wells. A purple/magenta color was formed immediately (azo compound) and measured for absorbance within 30 minutes at 520 nm. The sample concentration was calculated by comparison to the NO2– standard curve and expressed as µM/mg protein.29
Hepatic Antioxidant Enzymes
Glutathione System
Reduced Glutathione (GSH)
GSH content in the samples was measured by the procedure given by Sedlak and Lindsay with slight modification.34 The standard curves in terms of different concentrations of GSH, ie, 1, 0.8, 0.6, 0.4, and 0.2 µM/mL, were prepared by serial dilutions from a stock solution of (5 µM) GSH. Initially, 1 mL of freshly prepared 10% tissue homogenate was added in test tubes with 0.1 mL (25%) TCA solution to precipitate it. Then, the centrifugation was done at 8000 rpm/min on 4°C for 30 minutes. The supernatant (20 µL) was added to a 96 well microplate with 60 µL of 200 mM trisHCl buffer solution having 0.2 M EDTA (pH 7.0). Then, 4 μL of the 10 mM dithionitro-bis-benzoic acid (DTNB or Ellman’s Reagent) and 120 µL of methanol were added to each well. Blank contained 20 μL of 67 mM PBS (pH 7.0). After 30 minutes of incubation, the reaction was taken placed which gave yellow coloration and absorbance was calculated on multimode microplate reader at 412 nm. Employing the standard curve of GSH, the amount of GSH in each sample (µM/mL) was measured and expressed as µM/mg protein, calculated from the formula:

Here, X: GSH concentration (µM/mL); V sample: sample volume added to reaction, 20 µL; V sample-total: tissue homogenate volume, 1 mL; Cpr: protein concentration in sample, x mg/mL for each sample.
Glutathione Peroxidase (GPx) Assay
GPx activity of the hepatic extract was determined according to the method proposed by Paglia and Valentine with partial modification.35 The assay was associated with the reduction of peroxides at 340 nm in the presence of nicotinamide adenine dinucleotide phosphate (NADPH). One unit (U) of GPx activity was described as the quantity of enzyme required to catalyze the oxidation of 1 nM NADPH for one minute. The 200 µL test mixture contained optimal concentrations of 0.5 M K2HPO4 (pH 7.0), 2.5 mM EDTA, 0.18 U/mL glutathione reductase (GR), 100 mM reduced glutathione (rGSH), 10 mM reduced NADPH, and 10% tissue extract (0.02 mL). The reaction takes place at 37°C (±1) with the addition of 20 µL of 60 mM hydrogen peroxide (H2O2) as substrate. A change in absorbance (ΔA) was measured for both samples and blank at 340 nm, and reading was taken every 1 min for total 5 minutes. The GPx-specific activity was expressed as (nM) NADPH oxidized/min/mg protein (U.mg–1 of tissue protein). The molar extinction coefficient (ε) of NADPH is 0.00373 µM−1 in 0.6 cm path length (d) of the microplate well.
Glutathione-S-Transferase (GST) Assay
GST activity was determined using Habig’s technique36 with minor modifications. In a tube, 100 mM PBS (pH 6.5), 30 mM rGSH, and 30 mM 1-chloro-2,4-dinitrobenzene (CDNB) were combined to form the substrate master mix. In 96 wells microplate, 180 μL of the prepared mixture was poured and just before the taking absorbance, the freshly prepared 20 µL of 10% PMS was added. The sample was diluted 1:10 times to take readings in the appropriate range and blank well-contained PBS (pH 7.4) instead of sample. The ΔA was recorded by using a multimode microplate reader at 340 nm for 5 minutes (at 1 min interval) and thereafter to obtain at least 6-time points. Hence, by using Beer’s Law and assuming a well path length (d) of 0.6 cm, the specific activity of GST was determined and expressed as μM per min per mg protein. The value of ε at 340 nm for CDNB conjugate is 9.6 mM−1 cm−1.

Here, V inverse total: Vtotal/Vsample, 0.2 mL/0.02 mL = 10; V sample: 0.02 mL; Cpr: protein concentration of sample, x mg/mL; T: reaction time, 5 min; df: dilution factor, 10.
Superoxide Dismutase (SOD)
SOD assay by the pyrogallol autoxidation method was carried out by the procedure of Marklund with slight modification by Li.37 In the 96 well microplate, the 5 μL of freshly prepared PMS of liver homogenate was mixed with 190 μL, 0.05 M tris-HCl buffer (pH 7.4) having 1 mM Na2EDTA at 37°. Then, 5 μL of pyrogallol (60 mM in 1 mM HCl) was added to it and rapidly shaken by hand. The rate of increase in the absorbance at 325 nm (ΔA325 nm) for 5 minutes (at 30 s interval) was recorded against the Tris-HCl buffer as blank. One unit of SOD activity is referring to the quantity of enzyme that inhibits pyrogallol autoxidation by 50%, and the results were represented in U per mg protein.
The formula for percentage (%) inhibition is:

Here, ΔAblank is the absorbance increase (ΔA325 nm) of mixture not having the sample/SOD enzyme and ΔAsample is ΔA325 nm of mixture with the sample for the period of 5 min.

Here, A1blank is reading of blank well with pyrogallol and A2blank without pyrogallol. In the whole experiment, only three replicates of each blank (1 and 2) were put in microplate wells. Similarly,’ Ameasurement is the reading of wells with tissue supernatant samples (have SOD) with the addition of pyrogallol and Acontrol is the reading of sample wells without the addition of pyrogallol. The enzyme activity (U/mL) was calculated from formula of % inhibition and finally expressed as specific activity (U/mg protein) from the formula:

Here, V total: total volume of reaction, 200 µL; V sample: sample volume added to the reaction system, 5 µL; V sample total: homogenate volume, 1 mL; Cpr: protein sample concentration, x mg/mL for each sample; W: sample quality, 100 mg (0.1 g); df: dilution factor, 1.
Catalase (CAT) Activity
CAT activity was estimated by the assay described by Aebi,38 modified for 96-well plates. In the 96 well microplate, 20μL of liver PMS was pipetted with ethanol and incubated for 30 min on ice, to release active CAT enzyme. Then, 1 μL of Triton X-100 was added to each well, followed by 80 µL PBS (pH 7.0) at RT. Finally, 80 µL (30 mM) H2O2 was poured into each well to initiate the reaction. H2O2 decomposition was recorded by observing a decline in the absorbance (ΔA) at 240 nm (for 3 min) in a multimode microplate reader in kinetic mode. The blank sample has all reagents and containing 20 μL of dH2O instead of CAT source or samples. One unit of catalase is defined as the quantity of enzyme required to decompose 1M of H2O2 in one-minute time and into one milligram of protein, and CAT activity is expressed as U/mg tissue protein in the samples. The formula for a specific activity is:

Here, V inverse total: Vtotal /Vsample, 0.2 mL/0.02 mL = 10; ε: H2O2, 43.6 LM−1cm−1; d: 0.6 cm; V sample: 0.02 mL; Cpr: protein concentration of sample, x mg/mL; 106: Unit conversion factor, 1 M = 106 μM; T: reaction time, 3 minutes.
Hepatic Collagen and Hydroxyproline (HXP) Contents
The estimation of liver fibrosis is based on the HXP assay, which was performed using the technique reported by Reddy and coworkers with minor changes.39 HXP standard dilutions of 2, 4, 8, 12, 16 and 20 µg/well were prepared from 1 mg/mL stock solution. Initially, in Eppendorf tubes, 10 µL of each standard or 10% tissue samples were added, followed by 10 µL of 2N NaOH to start hydrolyzation. The mixture was vortexed, following incubation at 120°C for 20 min and finally centrifuged at 8000 rpm for 5 minutes to recover the supernatant. In the 96 well microplate, hydrolyzed HXP samples and standard solutions were transferred, followed by the addition of 100 µL (0.056 M) chloramine-T reagent in acetate-citrate buffer (pH 6.5) and allowed for oxidation for 25 minutes at RT. Then, 100 µL of freshly made 1M Ehrlich’s reagent (p-dimethylaminobenzaldehyde) was added and mixed gently. After 25 minutes of incubation at 65°C, the chromophore was developed, and absorbance was measured at 550 nm. The concentrations of the unknown samples were estimated through the calibration curve of HXP. One well was kept as reference blank, by adding 10 µL of PBS/dH2O and the amount of HXP was expressed as mg/g tissue. Collagen was calculated from calculated values of HXP by assuming that 12.5% of collagen is HXP.
Statistical Analysis
The data were presented as Mean ± S.E.M. A two-way analysis of variance (ANOVA) was employed, followed by a Bonferroni multiple comparison test, to determine the significance of variation in body weight, food consumption, and blood glucose levels across the time during treatments. In Graph Pad Prism 8.0, a one-way ANOVA followed by a Dunnett’s test was performed to analyze the significance of variance in lipid accumulation, cytokine, collagen, oxidative stress markers, liver enzymes, and plasma lipid profiles. The results for treatment groups and relevant percentage protections for all parameters were calculated by comparing these to HFD (DC) group of rats. A probability level of P < 0.05 was selected to be statistically significant.
Results
Effects of Safranal on Food Intake, Anthropometric Parameters, and Relative Organ Weights
During the study period, each rat’s body weight was noted once a week, and the amount of food and water consumed was recorded every day. The results of the anthropometric parameters, change in body weight, water intake and food consumption throughout the study period are summarized in Figures 1 and 2 and Table 3. The rats in the DC group had a substantial increase (p ˂ 0.001) in body weight and BMI as compared to NC group. The safranal (250 and 500 mg/kg) treated groups significantly reduced the percentage weight gain (p < 0.001) and BMI (p < 0.01) in contrast to the DC group. Safranal administration with HFD significantly (p < 0.001) blocked weight gain from 8 weeks after the beginning of treatment (Figure 1A and B). There was a statistically insignificant difference in average daily food and water intake between the different treatment groups. Although the HFD group has shown slightly less diet intake but non-significant in terms of total food intake, instead it has shown a significant (p < 0.001) increment in the average energy intake by each rat in one day (Kj/day/rat) as compared to the NC rats.
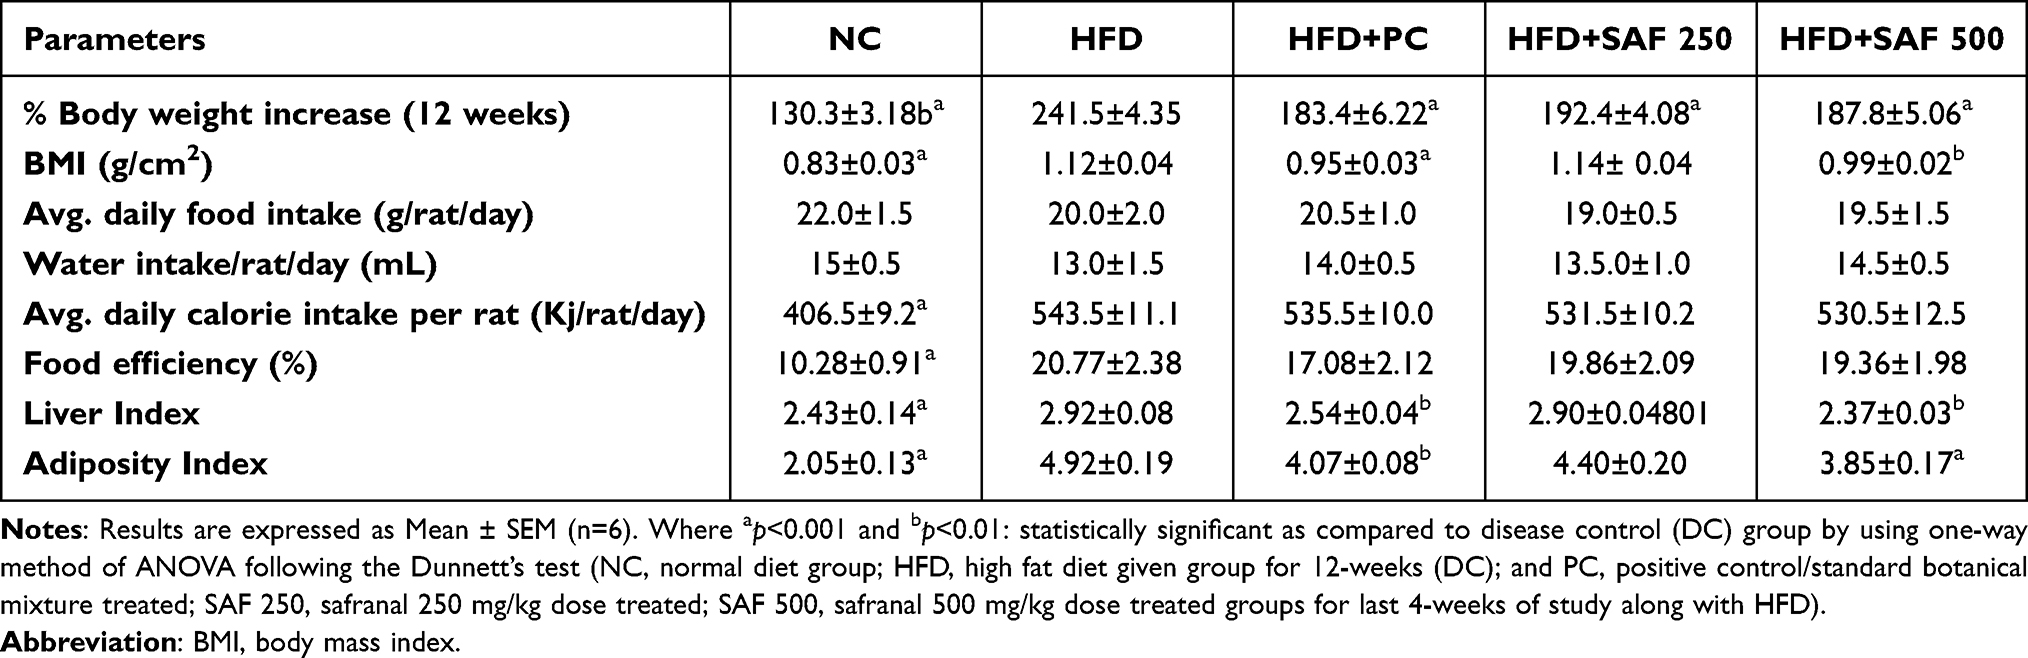 |
Table 3 Effect of Safranal on Anthropometric Parameters, Food Intake and Relative Organ Weights of the Rats in NAFLD Model |
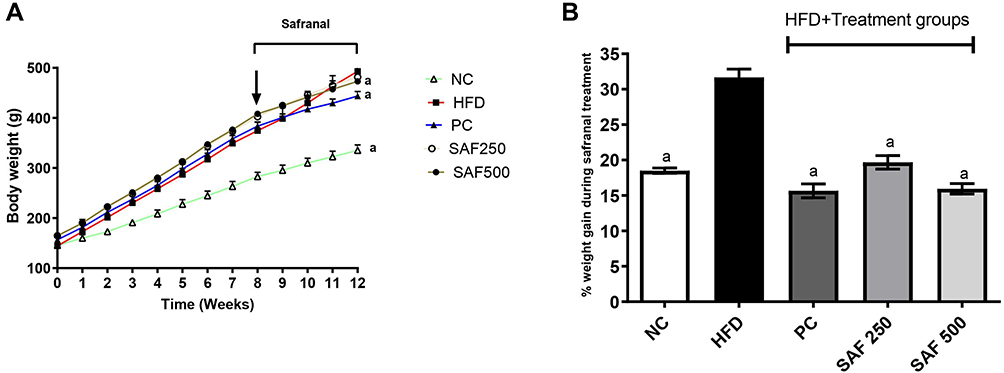 |
Figure 1 Effect of safranal on body weight of rats over 12-weeks (A) and % weight gain during treatment period (B). Results are expressed as Mean ± SEM (n=6). Where ap<0.001: statistically significant as compared to disease control (DC) group by using two-way and one-way method of ANOVA following the Bonferroni multiple comparisons and Dunnett’s tests, respectively. Abbreviations: NC, normal control diet group; HFD, high fat diet group (DC); PC, positive control/standard botanical mixture treated group; SAF 250, safranal 250 mg/kg dose treated group; SAF 500, safranal 500 mg/kg dose treated group. |
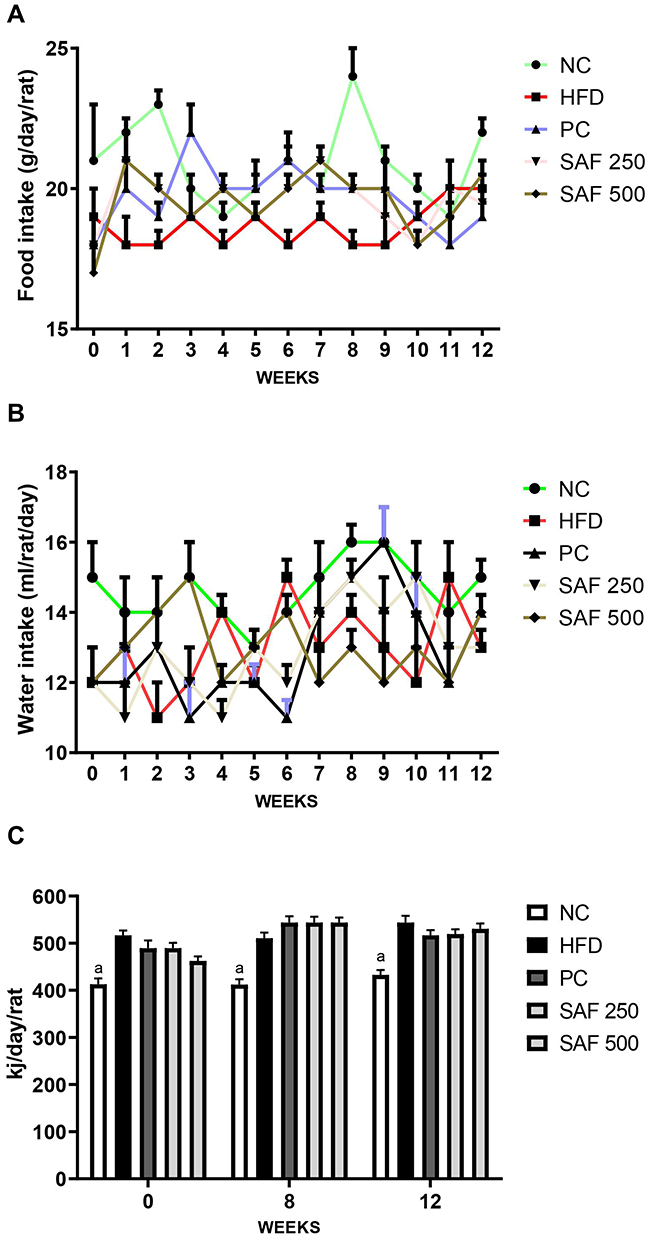 |
Figure 2 Effects of safranal on food (A) water (B) and energy intake (C). Results are expressed as mean ± SEM (n=6). Results are expressed as Mean ± SEM (n=6). Where ap<0.001: statistically significant as compared to disease control (DC) group by using two-way and one-way method of ANOVA following the Bonferroni multiple comparisons and Dunnett’s tests, respectively. Abbreviations: NC, normal control diet group; HFD, high fat diet group (DC); PC, positive control/standard botanical mixture treated group; SAF 250, safranal 250 mg/kg dose treated group; SAF 500, safranal500 mg/kg dose treated group. |
The treatment groups expressed a slight decrease but non-significant difference in the average daily calorie intake compared to the DC group. In comparison to the NC group, the food efficiency of the HFD group was raised (p < 0.001) by more than 2-fold (p < 0.001); however, the supplementation of safranal had no effect on food efficiency. The HFD markedly (p ˂ 0.001) increased the relative weights of abdominal fat (adiposity index) and liver (liver index) in rats (Table 3). In comparison to the DC group, rats treated with safranal (500 mg/kg) had a 21.80% reduction in adiposity index showed greater effect compared to the standard botanical mixture with a 17.37% reduction. Similarly, the liver index was decreased (p < 0.01) by safranal (500 mg/kg) treated group with a percentage inhibition (% inhibition) of 14.90%.
Effect of Safranal on Serum Liver Function Enzymes, Uric Acid, and Blood Lipids Profile
Serum AST, ALT, ALP, and uric acid levels were substantially (p ˂ 0.001) elevated in rats fed with an HFD in a NAFLD model, indicating that rats’ livers were affected (Table 4). Safranal treatment significantly (p˂0.001) decreased serum AST levels in increasing order of doses (250 and 500 mg/kg), with the protection of 13.87% and 29.8%, respectively. Similarly, serum ALT levels were reduced (p˂0.001) by 18.2% and 35.49%, respectively, at both doses. The blood levels of ALP were also considerably reduced (p ˂ 0.01) by safranal (500 mg/kg) treated group, with inhibition of 28.14%. Furthermore, safranal treatment has shown a notable effect (p˂0.05) on uric acid levels with an increasing trend of protection (20.27%) at the dose of 500 mg/kg.
 |
Table 4 Effect of Safranal on Plasma Lipids Profile, Serum Liver Function Enzymes and Uric Acid Concentrations of Rats in HFD-Induced NAFLD Model |
Table 4 summarizes the results for the plasma lipid profiles of all groups. Plasma TGs, TC, VLDL-C, and LDL-C levels were significantly increased (p ˂ 0.001) in rats with HFD-induced NAFLD. The safranal at 500 mg dose led to a substantial reduction (p ˂ 0.001) in blood TGs and TC levels. Similarly, the administration of safranal (500 mg/kg) resulted in a reduction (p ˂ 0.001) of VLDL-C levels, with a protection of 23.29%. Moreover, safranal (500 mg/kg) remarkably (p < 0.01) decreased LDL-C and atherogenic index with the protection of 30.28%.
Effects of Safranal on Random Blood Glucose Levels (RBG), OGTT, Fasting Blood Glucose (FBG) and Insulin Resistance (HOMA-IR Index)
The DC group had a statistically significant increase in RBG compared to the NC group after one week of consuming the HFD diet, as well as throughout the study (p < 0.001) (Figure 3A). At each measurement, safranal medication in conjunction with HFD from the 8th week onward resulted in a statistically significant decrease in RBG levels (p < 0.01).
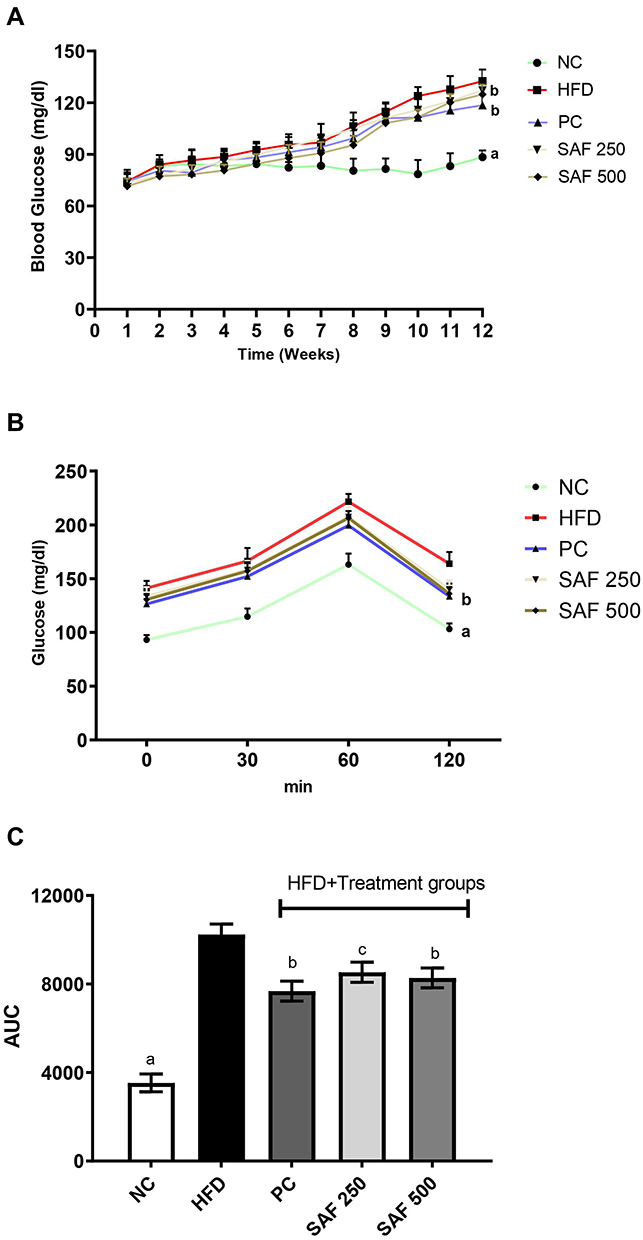 |
Figure 3 Effect of safranal on random blood glucose levels (A), oral glucose tolerance test (B) and AUC (C) in NAFLD rat model. Results are expressed as Mean ± SEM (n=6). Where ap<0.001, bp<0.01 and cp<0.05: statistically significant as compared to disease control (DC) group by using two-way and one-way method of ANOVA following the Bonferroni multiple comparisons and Dunnett’s tests, respectively. Abbreviations: NC, normal control diet group; HFD, high fat diet group (DC); PC, positive control/standard botanical mixture treated group; SAF 250, safranal 250 mg/kg dose treated group; SAF 500, safranal 500 mg/kg dose treated group; AUC, area under the curve-glucose. |
The OGTT results for the DC and experimentally obese rats given treatments are shown in Figure 3B and C. The HFD significantly reduced rats’ glucose tolerance, as demonstrated by higher blood glucose levels (BGL) in the DC group at all-time points. The peak rise in BGL was observed in NC rats 60 min after the glucose load and dropped to an approximately base level at 120 min; however, the peak rise in BGL was observed in HFD-induced rats even after 60 min and stayed high for the next 1 hour. The BGL at 60 min and beyond was substantially lesser (p˂0.01) in the rats given safranal (500 mg/kg). Using total area under the curve of glucose (AUCglucose) as the quantitative measure of the OGTT, rats treated with the safranal (500 mg/kg) had a 21.1% inhibition on impaired glucose tolerance in obese rats.
The fasting blood glucose level (FBG) was considerably (p ˂ 0.001) increased in HFD given rats in the DC group (49.7%) as measured on the last day of the study (Table 5). FBG level was decreased with a 500 mg/kg dose of safranal (p ˂ 0.01), with inhibition of 15.61%. Similarly, plasma insulin levels were enhanced (p ˂ 0.001) in the rats of DC group (93.27%) and reduced (dose-dependently) in the safranal-treated groups, with a 24.2% protection. Furthermore, safranal-treated group at increasing dose level significantly (p˂0.001) reduced the HOMA-IR index, with the protection of 31.2%. According to the findings, safranal decreased hyperinsulinemia and insulin resistance (HOMA-IR index) in rats in this HFD-induced NAFLD model.
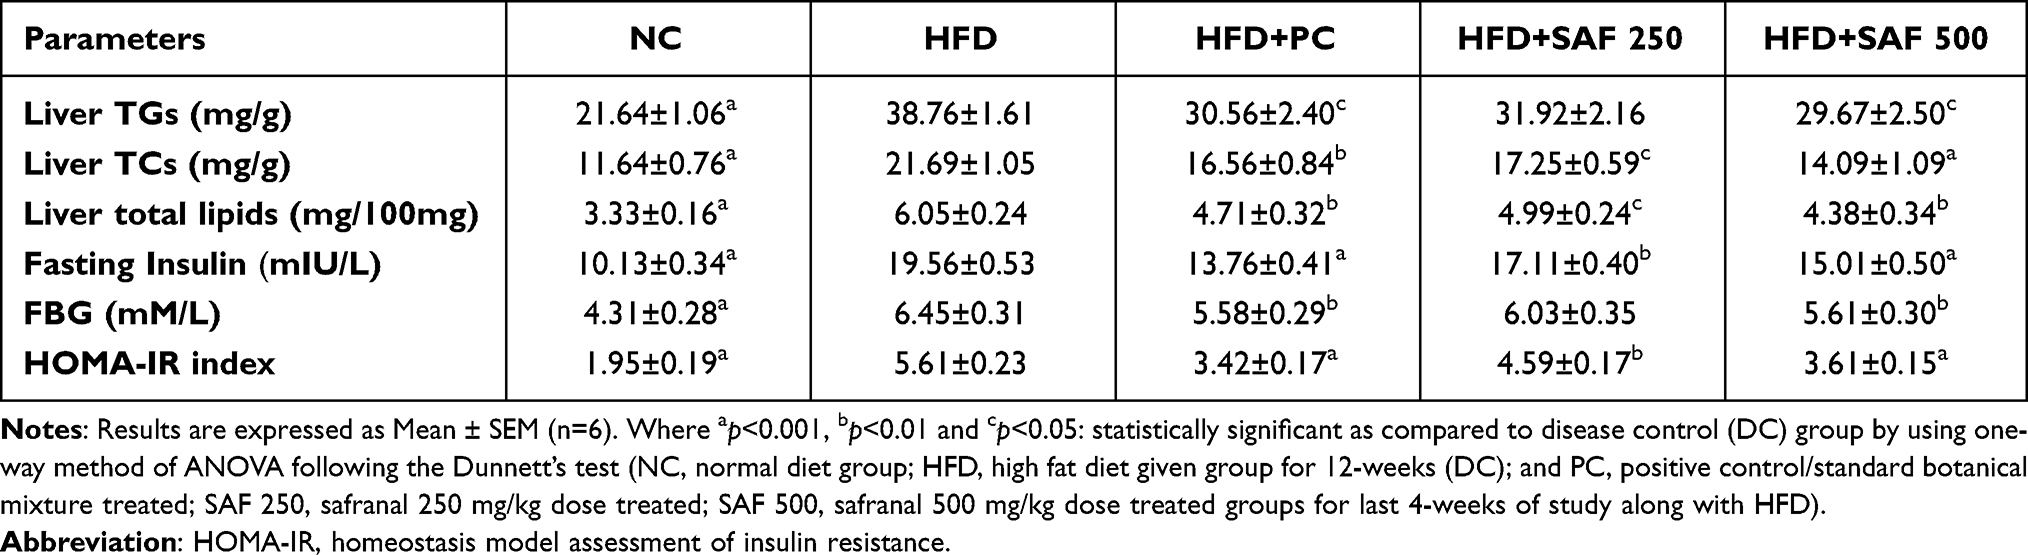 |
Table 5 Safranal Effects on Hepatic Lipids Accumulation, Fasting Blood Glucose (FBG), Fasting Plasma Insulin and HOMA-IR Index of the NAFLD Rat Model |
Effects on Hepatic Triglycerides (TGs) and Total Cholesterol (TC) Contents
As indicated in Table 5, there was a considerable (p ˂ 0.001) elevation in liver TGs and TC accumulation in the DC group, which caused steatosis. The hepatic fat content was considerably (p ˂ 0.01) decreased by the safranal treated group (500 mg/kg) with 25.64% protection. The standard botanical mixture has shown 19.05% protection so that safranal has exhibited better efficacy in terms of reducing hepatic lipid deposition caused by an HFD. In treatment groups, the cholesterol content was more significantly reduced (p ˂ 0.001) than that of the TGs content (p ˂ 0.05). The TC accumulation was decreased by 29.65% in the safranal treated groups in ascending order of doses.
Safranal Effects on Hepatic Oxidative Stress Markers
After 12 weeks on the HFD, the levels of hepatic MDA, AOPPs, and NO2− were significantly (p < 0.001) elevated in rats (Figure 4A–C). In ascending dose order, the safranal treated groups notably (p ˂ 0.01) diminished the MDA levels, with a protection of 43.41%. Safranal (500 mg/kg) treatment also markedly (p ˂ 0.01) decreased AOPP levels, providing 36.29% protection. The hepatic NO2− levels were remarkably ameliorated (p < 0.001) in safranal administered group of rats at a dose of 500 mg/kg, with a protection of 63.41%.
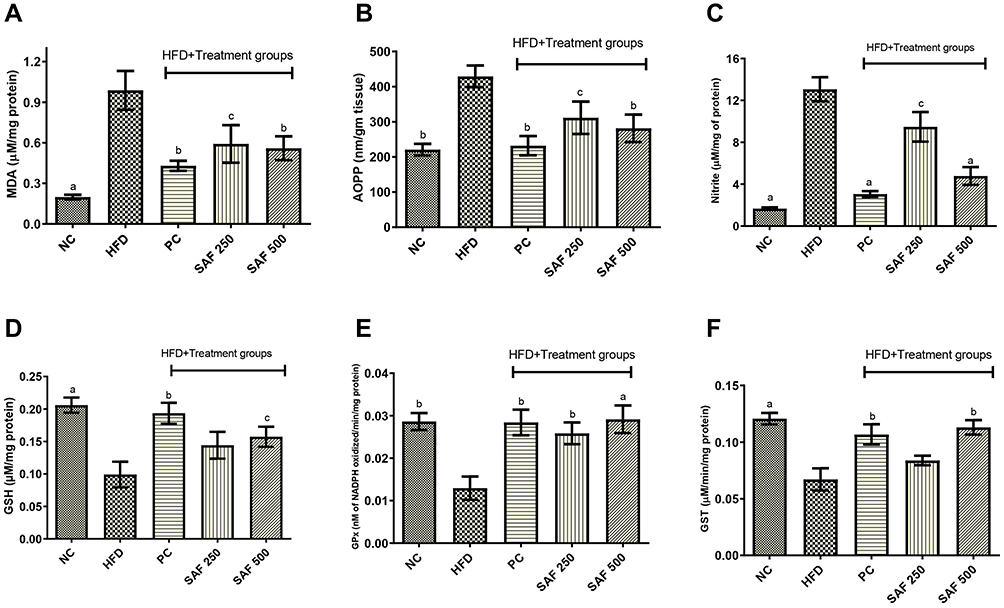 |
Figure 4 Effect of safranal on hepatic oxidative stress markers namely MDA (A), AOPP (B), nitrites (C), and glutathione system GSH (D), GPx (E) and GST (F) levels in HFD-induced NAFLD rat model. Results are expressed as mean± SEM (n=6) and statistically significant as compared to disease control (DC) group by using one-way method of ANOVA following the Dunnett’s test. Where ap<0.001, bp<0.01 and cp<0.05. Abbreviations: NC, normal control diet group; HFD, high fat diet group (DC); PC, positive control/standard botanical mixture treated group; SAF 250, safranal 250 mg/kg dose treated group; SAF 500, safranal 500 mg/kg dose treated group; MDA, malondialdehyde; AOPP, advance oxidation protein product; GPx, glutathione peroxidase; GST, glutathione-S-transferase. |
Safranal Restored Hepatic Glutathione System and Other Antioxidant Enzymes
Due to prolonged HFD intake, hepatic GSH, GPx, and GST levels were considerably reduced (p ˂ 0.001) in the DC group (Figure 4D–F). The safranal (500 mg/kg) treated group notably (p ˂ 0.001) restored (1.29-fold) the liver GPx levels, which is higher than the standard botanical mixture treated group, which exhibits a 1.19-fold rise in the enzyme. Similarly, safranal has a significant effect on liver GST and GSH levels with a dose-dependent trend of protection. The percentage restoration for GST level (p ˂ 0.01) was 56.27%, and for GSH levels (p ˂ 0.05) was 58.85%, respectively.
In the HFD control group of rats, hepatic SOD and CAT levels were considerably (p˂0.001) depleted (Figure 5A and B). The safranal (500 mg/kg) treatment group markedly (p˂0.05) increased SOD levels (85.2%). Similarly, safranal treatment significantly (p˂0.01) increased liver CAT levels, with a dose-dependent protection of 89.91%.
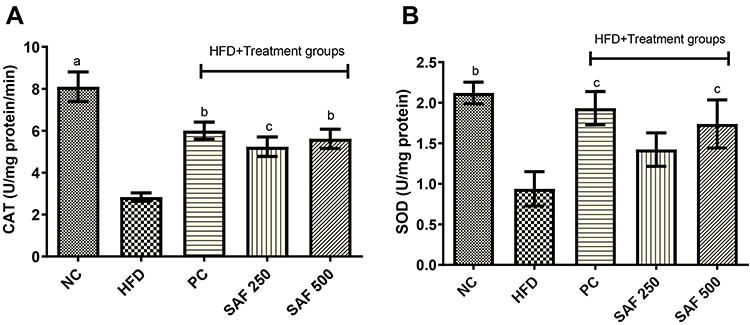 |
Figure 5 Effect of safranal on hepatic antioxidant enzymes namely CAT (A) and SOD (B) levels in NAFLD rat model. Results are expressed as mean± SEM (n=6) and statistically significant as compared to disease control (DC) group by using one-way method of ANOVA following the Dunnett’s test. Where ap<0.001, bp<0.01 and cp<0.05. Abbreviations: NC, normal control diet group; HFD, high fat diet group (DC); PC, positive control/standard botanical mixture treated group; SAF 250, safranal 250 mg/kg dose treated group; SAF 500, safranal 500 mg/kg dose treated group; CAT, catalase; SOD, superoxide dismutase. |
Effect of Safranal on Serum TNF-α (Pg/mL) and Hepatic Collagen (Mg/100 Mg Tissue)
As compared to the NC group, serum TNF-α levels were substantially (p ˂ 0.001) higher (82.27%) in the DC group of rats (Figure 6A). Its levels were markedly (p ˂ 0.001) reduced in a dose-dependent way by safranal treatment groups (250 and 500 mg/kg), with 14.75% and 27.94% protection, respectively, indicating its anti-inflammatory effect in an HFD-induced NAFLD model.
 |
Figure 6 Effects of safranal on serum tumor necrosis factor-α (TNF-α) (A), and hepatic collagen levels (B). Results are expressed as mean± SEM (n=6) and statistically significant as compared to disease control (DC) group by using one-way method of ANOVA following the Dunnett’s test. Where ap<0.001 and bp<0.01. Abbreviations: NC, normal control diet group; HFD, high fat diet group (DC); PC, positive control/standard botanical mixture treated group; SAF 250, safranal 250 mg/kg dose treated group; SAF 500, safranal 500 mg/kg dose treated group. |
In HFD fed rats, hepatic collagen deposition was significantly (p ˂ 0.001) increased (Figure 6B). Its levels were considerably (p ˂ 0.001) reduced by the safranal treatment group with an increasing tendency of inhibition at ascending order of doses. When compared to the DC group, the protection value was 30.95% at 500 mg/kg dose.
Effects on Tissue Histopathology and NAFLD Activity Score (NAS)
After 12 weeks on the HFD, rats developed severe hepatic necrosis, steatosis (macrovesicular and microvesicular), inflammation, and hepatocellular hypertrophy, as shown in images of histological sections (Figures 7 and 8) and Supplementary Figure S1. The results of NAS score for each group are shown in Figure 9. Due to chronic consumption of HFD, lipid accumulation was seen in hepatocytes and observed as droplets of fats under the microscope. The liver steatosis was significantly (p ˂ 0.01) mitigated in the safranal (500 mg/kg) treated group, with a 29.2% protection, and the anti-steatotic effect was superior to that of standard botanical mixture.
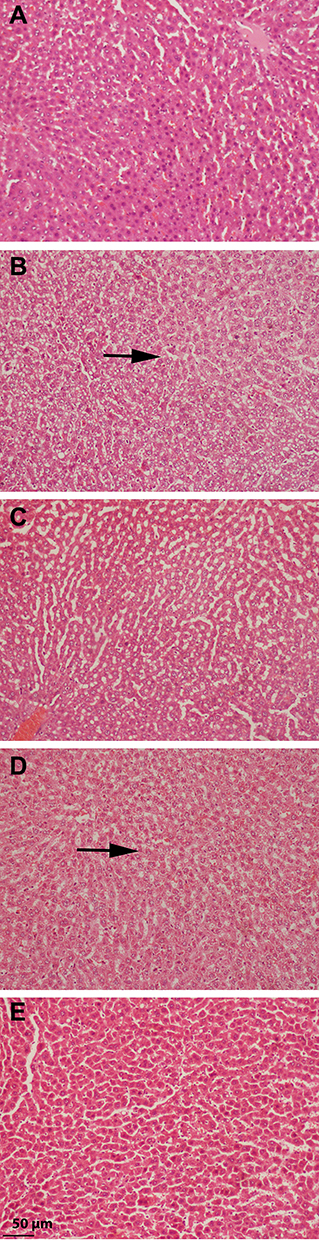 |
Figure 7 Histology images of rat’s liver with macrovesicular and microvesicular steatosis (magnification, 100x), where black arrows shows the fat droplets (A) liver of normal control group presenting normal hepatocytes; (B) liver of rat fed with HFD showing severe steatosis and fatty degeneration of hepatocytes; (C) liver of rat treated with standard botanical mixture along with HFD, showing moderate fatty degeneration of hepatocytes; (D) liver sections of rats fed with HFD and treated with safranal 250 mg/kg/day showing moderate fatty degeneration of hepatocytes; (E) liver sections of rats fed with HFD and treated with safranal 500 mg/kg/day showing mild fatty deposition. |
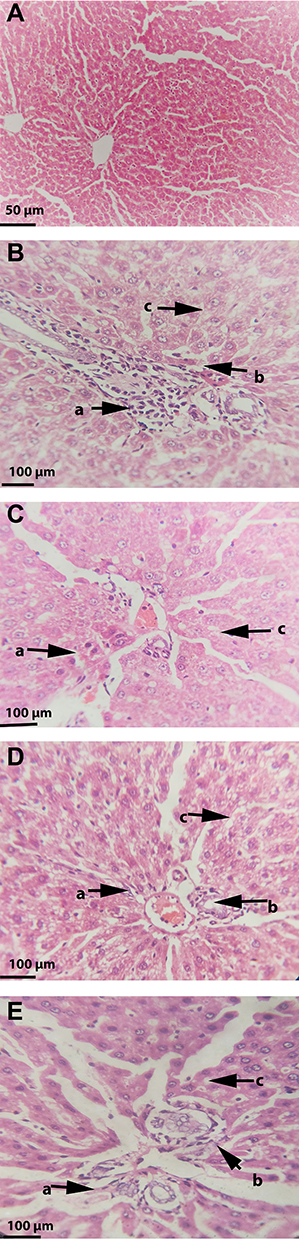 |
Figure 8 Effect of Safranal on the histopathology of HFD fed rat’s liver stained with hematoxylin-eosin. Images of representative sections of each group are shown lobular inflammation and steatosis around central vein. Where (arrow a) indicates oval cells hyperplasia, (arrow b) inflammatory cells, and (arrow c) steatosis. (A) Normal control group showing normal hepatocytes and central vein (magnification, 100x); (B) disease control group showing steatosis and severe inflammation around central vein with mixture of oval cells hyperplasia (400x); (C) group treated with standard botanical mixture showing moderate steatosis and inflammation (400x); (D) group treated with safranal-250 mg/kg dose showing moderate steatosis, inflammation and oval cells (400x); (E) group treated with safranal-500 mg/kg showing mild fatty infiltration, inflammation and oval cells (400x). |
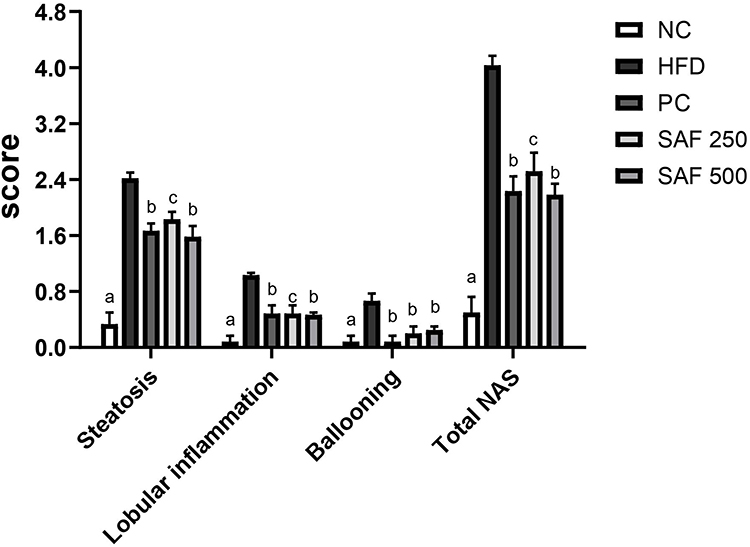 |
Figure 9 Effects of Safranal on scoring of rat livers for steatosis, ballooning, and lobular inflammation. Results are expressed as mean ± SEM (n=6) and statistically significant as compared to disease control (DC) group by using one-way method of ANOVA following the Dunnett’s test. Where ap<0.001, bp<0.01 and cp<0.001. Abbreviations: NC, normal control diet group; HFD, high fat diet group (DC); PC, positive control/standard botanical mixture treated group; SAF 250, safranal 250 mg/kg dose treated group; SAF 500, safranal 500 mg/kg dose treated group. |
The numbers of inflammatory cells and foci for each field were counted at magnifications of 100x and 400x to measure the severity of the inflammation (view size of 3.2 mm2). Five distinct areas were tallied, and then the average was calculated. Lobular inflammation and oval cell hyperplasia around the portal vein was significantly elevated (p ˂ 0.001) in hepatocytes out of the DC group. It was found that the safranal (500 mg/kg) treated group had a significant (p˂0.01) effect on inflammation abatement, with 36.5% protection. The ballooning of hepatocytes was also significantly reduced (p ˂ 0.01) in the treatment groups compared to the DC group. The total NAS score was decreased (p ˂ 0.01) in the safranal treatment group (500 mg/kg/day) with 36.5% protection.
Discussion
In clinical settings, it has been established that excessive dietary fat consumption is a key factor in developing NAFLD.5 As a result, contemporary research has frequently investigated the idea of utilizing the HFD to induce a comparable state in animals all over the world. Rat models are suitable for studying obesity-induced NAFLD because they easily acquire weight when fed with HFD.14 In the current study, a high-calorie diet (60% energy from fat) induced NAFLD-like features in rats, demonstrating the model’s usefulness for drug screening in preclinical settings. These findings corroborate previous studies demonstrating that HFD was induced the onset of various disease characteristics, such as steatosis, oxidative stress, inflammation, and insulin resistance.40,41
Phytochemicals may serve as lead molecules in the therapy of NAFLD through several mechanisms, including their antioxidant, anti-inflammatory, anti-apoptotic, and insulin sensitizing effects.15 In a surge of new therapies from natural sources, terpenoids are found to be effective against NAFLD in several animal models.16,17 This study aimed to assess the anti-NAFLD effect of safranal at two dosing levels in a rat model of HFD. To the best of our knowledge, this is the first study reported by safranal in which we investigated its effect on hepatic lipid accumulation induced by prolonged consumption of a purpose-built diet, as well as its impact on subsequent pathology associated with steatosis, characterized by NASH and fibrosis.
The chronic use of HFD increases fat deposition in adipose tissues and results in adipocytes hyperplasia and hypertrophy.41 The condition results in a cumulative increase in body weight and a rise in the BMI and adiposity index of the rats, all of which are well-known risk factors for developing NAFLD.4 In our study, safranal therapy at increasing dose levels decreased these parameters, showing an anti-obesity effect. It was observed that a monoterpene compound (paeoniflorin) had similar anti-obesity effects in an animal model of NAFLD induced by an HFD.26 There was a statistically insignificant difference in the food efficiency ratio among the treatment groups. Furthermore, unlike food consumption, weight loss was not associated with appetite or energy intake, suggesting that safranal’s restricted weight gain impact was due to metabolic control.
In clinical and experimental studies, saturated fat consumption increases hepatic steatosis, glycosylation, fibrosis, and hepatomegaly, all of which increase the size and weight of the liver.19 In summary, the stages of steatosis include: (1) an increase in hepatic FFA uptake and de novo-lipogenesis (DNL), (2) a reduction in FAs mitochondrial β-oxidation, and (3) export as VLDL-C particles.42 According to the recent “multihit” theory, the initial step toward NAFLD development is altered hepatic lipid metabolism and insulin sensitivity. The accumulation of lipids in the liver results in impaired insulin signaling,13 which promotes the release of FFAs from adipose tissues by inhibiting lipoprotein lipase activity.2 This substantially contributes to steatosis and its subsequent development by activating the proteins involved in DNL.12 It also reduces the synthesis and stability of apolipoprotein B (ApoB), a protein implicated in the liver’s release of VLDL-C.11
Safranal (500 mg/kg) reduced liver weight (liver index), as well as hepatic TGs and cholesterol levels, therefore protecting the liver against lipotoxicity and liver injury. In a previous study, safranal oral treatment restored cellular carnitine palmitoyl transferase-1A (CPT1A) levels with those reported in control rats.23 This may be a plausible mechanism by which safranal enhances the β-oxidation of the long-chain fatty acids in the mitochondria and reduces lipid accumulation in the liver. Similarly, compared to TGs, safranal at 500 mg/kg dose showed a considerable impact with greater protection for normalizing hepatic total cholesterol levels. This might be due to more significant effect of compound on downregulating pathways and enzymes involved in cholesterol synthesis and metabolism, such as hydroxy-3-methylglutaryl-coenzymeA reductase (HMGCR), low-density lipoprotein receptors (LDLR), and sterol regulatory element-binding protein-2 (SREBP2).42 Similarly, in a prior study, paeoniflorin was found to have a similar anti-steatosis effect in NAFLD animals that had been exposed to HFD.43 Elevated serum aminotransferases (AST and ALT) in the absence of other liver diseases can confirm the diagnosis of NAFLD.44 ALT levels are more specific to hepatic injury but usually rise later in the process, while AST levels contrarily increase rapidly at the beginning.9 Safranal remarkably reduced the AST, ALT, and ALP levels in HFD-fed rats, showing that it is hepatoprotective during the development of NAFLD.
Type 2 diabetes mellitus and dyslipidemia are the most often reported co-morbidities in obese patients. In 20% to 80% of cases, NAFLD is linked with an increased risk of cardiovascular diseases.4 HFD may produce irregularities in blood lipids due to insulin resistance, viciously leading to lipotoxicity and steatosis.13 The kinetic, qualitative, and quantitative alterations in all lipoprotein subtypes may be the root cause of blood lipid irregularities and fatty liver. The increase in VLDL-C concentration is related to an increase in atherogenic LDL-C production, while the levels of cardioprotective lipoproteins (HDL-C) are decreased.40 Almost all the doses of safranal showed antihyperlipidemic activity in the treated groups, and the results were in agreement with its previously reported data.20 The suggested anti-hyperlipidemic mechanism of safranal is associated with a reduction in insulin resistance. The improvement in insulin signaling reduces DNL (both hepatic TGs and TC production) and lipolysis of intraabdominal fat, increasing FAs oxidation, and ultimately reducing steatosis. As a result, an abnormal rise in the synthesis and release of large VLDL particles (TG-rich) in the blood is reduced.13
HFD can promote hyperglycemia and raise fasting as well as random blood glucose levels. The hepatic gluconeogenesis arm continues to remain functional during insulin resistance state, enhancing the DNL by supplying the substrate for glycolysis.13 Furthermore, in NAFLD, the OGTT is thought to be a significant predictor of the host’s insulin sensitivity and blood glucose management ability.25 Safranal dose-dependently decreased glucose intolerance in rats fed an HFD in our study. Hyperinsulinemia and an increased HOMA-IR index were significantly decreased to normal values after safranal administration. According to a previous study, safranal probably improves insulin signaling by inhibiting insulin receptor substrate (IRS)-1 phosphorylation at ser370 and increases phosphorylation of glycogen synthase kinase (GSK)-3 and Akt in IR-challenged myocardium.45 In prior preclinical studies, treatment with some other terpenoids, such as actein and ursolic acid, seemed to have similar effects41,46 and improve OGTT and the insulin signaling pathway in HFD-induced NAFLD models.
According to the two-hit hypothesis of NAFLD, oxidative stress has been considered the “second hit” and is implicated in the pathogenesis of HFD-induced NAFLD and its progression.10 The formation of TGs and cholesterol and their storage in the liver is a temporary mechanism to prevent toxicity. Later, due to excessive steatosis, lipotoxicity and glucotoxicity may be induced in the hepatocytes in context of NASH by forming reactive oxygen and nitrogen species (ROS and RNS) in various organelles, such as ER, peroxisomes, and mitochondria.7 Cytochrome P450 2E1 (CYP2E1) is a potent ROS-producing enzyme in microsomes and one of the most effective inducers of oxidative stress in hepatocytes by increasing FA oxidation.43 Secondly, as seen in the blood of patients with metabolic syndrome and NAFLD, hyperuricemia is a significant source of oxidative stress.9 Finally, hepatic mitochondrial dysfunction may precede insulin resistance, hepatic steatosis, and depletion of endogenous antioxidants in a vicious cycle.8
ROS can oxidize physiological polyunsaturated fatty acids, resulting in lipid peroxidation and the formation of MDA.47 Similarly, in the cytoplasm, excessive NO generation by inducible nitric oxide synthase (iNOS) is involved in various diseases, including NAFLD.33 Additionally, increased NO generation has been associated with cytotoxicity and chronic inflammation. Its levels may be quantified in terms of the metabolite nitrite (NO2−), and previous research has revealed that HFD intake dramatically increases NO (NO2−) levels in animals.29 In the current study, HFD-fed rats showed increased levels of these hepatic oxidative stress products. Safranal treatment resulted in a dose-dependent reduction in oxidonitrative stress in rats. The results are in line with findings of Lertnimitphun et al,22 in which safranal suppressed NO production by downregulating iNOS in lipopolysaccharide-stimulated RAW264.7 cells and macrophages derived from bone marrow. Similarly, Karafakıoğlu et al21 reported a reduction of MDA levels after oral administration of safranal in cisplatin-induced nephrotoxicity model.
Advanced oxidation protein products (AOPPs) are dityrosine‐containing cross‐linked protein products recognized as a novel OS marker for estimating the degree of protein oxidation.32 It is formed due to the action of hypochlorous acid (HOCl−) and chloramines produced by myeloperoxidase in activated neutrophils. Literature suggests that the levels of these oxidative moieties are elevated in the blood and liver of NASH patients.48 It induces inflammation and fibrosis in the tissue, binds to advanced glycation end products, and triggers the apoptotic pathways. AOPPs specifically oxidize plasma proteins such as albumin and also bind to the high-density lipoprotein (HDL) scavenger receptors, and antagonize them.49 In the present study, HFD increased AOPP levels in hepatic homogenate and safranal treatment significantly reduced its levels. Furthermore, it is suggested that the tested compound has a potential effect against the production of chloraminated oxidants in the steatotic liver.
High oxidative stress markers were linked to lower hepatic enzymatic and nonenzymatic antioxidants, such as SOD, CAT, and the glutathione (GSH) system in rats given HFD for 12 weeks. The intake of saturated fat and cholesterol is linked to their depletion, implying a pro-oxidant role throughout the development of NAFLD.12,34 Four weeks of safranal treatment considerably restored hepatic antioxidants, with a more pronounced effect on hepatic GPx and GST levels. GPx is an enzyme that catalyzes the reduction of various peroxides using GSH as a cofactor.10 In a previous study by Hamza et al,23 oral therapy of safranal reduced valproate-induced injury by decreasing CYP2E1 expression, lowering ROS and apoptotic signals in the liver. Furthermore, safranal’s antioxidant properties may potentially be explained by upregulation of nuclear erythroid-related factor-2 (Nrf-2), a signaling cascade in cells that activates SOD and the GSH system.24
According to the researchers, metabolic signals from accumulated lipids and oxidative stress may activate intracellular inflammatory pathways in hepatocytes and Kupffer cells in the event of HFD-induced obesity and NAFLD.50 Adipose tissues, on the other hand, not only serve as a storage organ for TGs but also as an endocrine organ in the presence of insulin resistance, through an unprovoked synthesis of pro-inflammatory adipocytokines, such as TNF-α by adipocytes and macrophages.10 In the course of the “second hit” of disease, the resulting redox imbalance may activate redox-sensitive transcription factors, including nuclear factor-κB (NF-κB) in liver. It acts as a master regulator of inflammation, leading to an increase in pro-inflammatory mediators like TNF-α and iNOS. Furthermore, oxidative stress can trigger the c-Jun N-terminal kinases (JNK) pathway and stimulate cytokine release.9 In addition, MDA and NO can also set off a pro-inflammatory response and damage the hepatocytes.3
As a consequence, elevated TNF-α production is responsible for metabolic changes, the synthesis of other inflammatory mediators, and the establishment of programmed apoptosis.3 It may also impair the insulin signaling pathway by blocking the tyrosine kinase activity of insulin receptor while increasing activation of protein kinase C (PKCɛ) activity via the JNK pathway and IRS-1 phosphorylation at ser370.5 It can also inhibit activation of the AMP-activated protein kinase (AMPK) and neutralize adiponectin, which is the link between the first and second hits.11 Safranal exerted an anti-inflammatory effect at both doses by reducing blood TNF- α levels. Lertnimitphun et al22 reported that it has been shown to decrease the cytokine production in cells by inhibiting the phosphorylation and nuclear translocation of components of the mitogen-activated protein kinase (MAPK) pathway, such as extracellular signal-regulated kinase (ERK), as well as JNK and NF-κB system proteins. Other phytochemicals, such as baicalin and boswellic acids, have been studied in the HFD model of NAFLD and shown to have comparable antioxidant and anti-inflammatory effects.44,50
If left untreated, NAFLD might eventually lead to fibrosis due to collagen accumulation in the liver. Inflammation, reactive oxygen species, toxic lipids, and lipid peroxide aldehydes can induce hepatic stellate cells (HSCs) to produce collagen.3 In the current study, it was found that HFD increased the amount of hydroxyproline and indirectly the collagen levels present in the extracellular matrix of rat’s hepatic tissues. There was a substantial reduction in hydroxyproline (collagen) levels with safranal treatment indicating drug’s potential anti-fibrotic action.
Liver biopsy is regarded as the gold standard in diagnosing NAFLD/NASH,27 so we examined the histology of liver. Animals fed a high-fat and high-cholesterol diet develop more severe hepatic lesions, such as inflammation and fibrosis, than those on a low-fat, low-cholesterol diet. Adding 1% cholesterol to the HFD has been observed to accelerate disease progression to the NASH stage,40 and in our study, similar results were observed. In the course of hepatic necrosis, there is crosstalk between HSCs, Kupffer cells, neutrophils, and progenitor oval cells resulting in oxidative stress, cytokine release, and collagen deposition.51,52 The findings of the histological assessment proved the protective role of safranal found in the biochemical analyses and reaffirmed its favorable benefits against HFD-induced NAFLD. The considerable improvement in steatosis and ballooning scores in rats treated with safranal (500 mg/kg) was due to a significant reduction in liver FFAs, TGs, and cholesterol, and hence steatosis. A remarkable decrease in lobular inflammation was expected because the liver was shielded from oxidative stress and the resulting lipotoxicity, as evidenced by a substantial drop in blood TNF-α levels. The progression of disease was started to slow down, and the drug at 500 mg/kg dose had a more substantial anti-steatotic and anti-inflammatory impact than that of the standard botanical mixture. The hepatic liver function enzymes and histopathology results corroborate previous findings where safranal has shown a strong anti-apoptotic effect, as demonstrated by increased Bcl-2 expression and reduced Bax and caspase-3 expression in hepatic injury caused by infrarenal aortic occlusion, as well as in IR-challenged myocardium.45
Conclusion
NAFLD is considered a multifactorial illness since it is associated with lipotoxicity, inflammation, oxidative stress, and insulin resistance, which are thought to be causal factors in its development and progression. As a result, a multi-pronged strategy to manage this disease is preferable. In this study, the pathogenesis of NAFLD is explained by increased steatosis, pro-inflammatory markers, and oxidonitrative stress, which led to the development of insulin resistance in rats. The current study found that safranal treatment caused a substantial decrease in hepatic lipid accumulation and prevented the disease progression at stage-1 of simple steatosis. Furthermore, drug treatment caused a reduction in oxidative stress indicators and cytokine and considerably increased antioxidants in hepatocytes. The resulting insulin resistance was ameliorated as indicated by a decrease in blood glucose and insulin levels, dyslipidemia, and ultimately HOMA-IR index. The increased insulin sensitivity may be a factor in improving liver health, as seen by histological testing, and finally, safranal demonstrated encouraging benefits against both hits in NAFLD induced by HFD.
Acknowledgments
We acknowledge Dr. Shafaat Yar Khan, Assistant Professor, Department of Zoology, University of Sargodha, for providing facilities to conduct ELISA and other spectrophotometric methods, and Yusuf S. Althobaiti was supported by Taif University Researchers Supporting Project number (TURSP-2020/78), Taif University, Taif, Saudi Arabia.
Author Contributions
All authors made a significant contribution to the work reported, whether that is in the conception, study design, execution, acquisition of data, analysis and interpretation, or in all these areas; took part in drafting, revising or critically reviewing the article; gave final approval of the version to be published; have agreed on the journal to which the article has been submitted; and agree to be accountable for all aspects of the work.
Funding
This research project was funded by Higher Education Commission of Pakistan under the Indigenous Scholarship Program.
Disclosure
Usman Sabir reports grants from Higher Education Commission of Pakistan, during the conduct of the study; supporting project from Taif University Researchers Supporting Project number (TURSP-2020/78), Taif University, Taif, Saudi Arabia, outside the submitted work. The authors report no other potential conflicts of interest in this work.
References
1. Samuel VT, Shulman GI. Nonalcoholic fatty liver disease as a nexus of metabolic and hepatic diseases. Cell Metab. 2018;27(1):22–41. doi:10.1016/j.cmet.2017.08.002
2. Polyzos SA, Kountouras J, Mantzoros CS. Obesity and nonalcoholic fatty liver disease: from pathophysiology to therapeutics. Metabolism. 2019;92:82–97. doi:10.1016/j.metabol.2018.11.014
3. Niederreiter L, Tilg H. Cytokines and fatty liver diseases. Liver Res. 2018;2(1):14–20. doi:10.1016/j.livres.2018.03.003
4. Velasco JV-R, García-Jiménez E, García-Zermeño K, et al. Extrahepatic complications of non-alcoholic fatty liver disease. Revista de Gastroenterología de México. 2019;84(4):472–481. doi:10.1016/j.rgmxen.2019.05.004
5. Lian C-Y, Zhai Z-Z, Li Z-F, Wang L. High fat diet-triggered non-alcoholic fatty liver disease: a review of proposed mechanisms. Chem Biol Interact. 2020;330:109199. doi:10.1016/j.cbi.2020.109199
6. Ore A, Akinloye OA. Oxidative stress and antioxidant biomarkers in clinical and experimental models of non-alcoholic fatty liver disease. Medicina. 2019;55(2):26. doi:10.3390/medicina55020026
7. Spahis S, Delvin E, Borys J-M, Levy E. Oxidative stress as a critical factor in nonalcoholic fatty liver disease pathogenesis. Antioxid Redox Signal. 2017;26(10):519–541. doi:10.1089/ars.2016.6776
8. Ashraf N, Sheikh T. Endoplasmic reticulum stress and oxidative stress in the pathogenesis of non-alcoholic fatty liver disease. Free Radic Res. 2015;49(12):1405–1418. doi:10.3109/10715762.2015.1078461
9. Asrih M, Jornayvaz FR. Inflammation as a potential link between nonalcoholic fatty liver disease and insulin resistance. J Endocrinol. 2013;218(3):R25–R36. doi:10.1530/JOE-13-0201
10. Chen Z, Tian R, She Z, Cai J, Li H. Role of oxidative stress in the pathogenesis of nonalcoholic fatty liver disease. Free Radic Biol Med. 2020;152:116–141. doi:10.1016/j.freeradbiomed.2020.02.025
11. Chen Z, Yu R, Xiong Y, Du F, Zhu S. A vicious circle between insulin resistance and inflammation in nonalcoholic fatty liver disease. Lipids Health Dis. 2017;16(1):203. doi:10.1186/s12944-017-0572-9
12. Rindler PM, Crewe CL, Fernandes J, Kinter M, Szweda LI. Redox regulation of insulin sensitivity due to enhanced fatty acid utilization in the mitochondria. Am J Physiol Heart Circ Physiol. 2013;305(5):H634–H643. doi:10.1152/ajpheart.00799.2012
13. Santoleri D, Titchenell PM. Resolving the paradox of hepatic insulin resistance. Cell Mol Gastroenterol Hepatol. 2019;7(2):447–456. doi:10.1016/j.jcmgh.2018.10.016
14. Denk H, Abuja PM, Zatloukal K. Animal models of NAFLD from the pathologist’s point of view. Biochimica et Biophysica Acta. 2019;1865(5):929–942. doi:10.1016/j.bbadis.2018.04.024
15. Xu Y, Guo W, Zhang C, et al. Herbal medicine in the treatment of non-alcoholic fatty liver diseases-efficacy, action mechanism, and clinical application. Front Pharmacol. 2020;11. doi:10.3389/fphar.2020.00601
16. Vinholes J, Rudnitskaya A, Gonçalves P, Martel F, Coimbra MA, Rocha SM. Hepatoprotection of sesquiterpenoids: a quantitative structure–activity relationship (QSAR) approach. Food Chem. 2014;146:78–84. doi:10.1016/j.foodchem.2013.09.039
17. Jahangeer M, Fatima R, Ashiq M. Therapeutic and biomedical potentialities of terpenoids–a review. J Pure Appl Microbiol. 2021;15(2):471–483. doi:10.22207/JPAM.15.2.04
18. Hosseinzadeh H, Shakib SS, Sameni AK, Taghiabadi E. Acute and subacute toxicity of safranal, a constituent of saffron, in mice and rats. Iran J Pharm Res. 2013;12(1):93.
19. Mashmoul M, Azlan A, Mohtarrudin N, et al. Protective effects of saffron extract and crocin supplementation on fatty liver tissue of high-fat diet-induced obese rats. BMC Complement Altern Med. 2016;16(1):1–7. doi:10.1186/s12906-016-1381-9
20. Malekzadeh S, Heidari MR, Razavi BM, Rameshrad M, Hosseinzadeh H. Effect of safranal, a constituent of saffron, on olanzapine (an atypical antipsychotic) induced metabolic disorders in rat. Iran J Basic Med Sci. 2019;22(12):1476. doi:10.22038/IJBMS.2019.13992
21. Karafakıoğlu YS, Bozkurt MF, Hazman Ö, Fıdan AF. Efficacy of safranal to cisplatin-induced nephrotoxicity. Biochem J. 2017;474(7):1195–1203. doi:10.1042/BCJ20160971
22. Lertnimitphun P, Jiang Y, Kim N, et al. Safranal alleviates dextran sulfate sodium-induced colitis and suppresses macrophage-mediated inflammation. Front Pharmacol. 2019;10:1281. doi:10.3389/fphar.2019.01281
23. Hamza AA, El Hodairy F, Badawi A. Safranal ameliorates Sodium Valproate-induced liver toxicity in rats by targeting gene expression, oxidative stress and apoptosis. J Biomed Pharm Res. 2015;4(6):46–60.
24. Pan P, Qiao L, Wen X. Safranal prevents rotenone-induced oxidative stress and apoptosis in an in vitro model of Parkinson’s disease through regulating Keap1/Nrf2 signaling pathway. Cell Mol Biol. 2016;62(14):11–17. doi:10.14715/cmb/2016.62.14.2
25. Zhao D, Gao F, Zhu H, et al. Selenium-enriched Bifidobacterium longum DD98 relieves metabolic alterations and liver injuries associated with obesity in high-fat diet-fed mice. J Funct Foods. 2020;72:104051. doi:10.1016/j.jff.2020.104051
26. Ma Z, Chu L, Liu H, et al. Beneficial effects of paeoniflorin on non-alcoholic fatty liver disease induced by high-fat diet in rats. Sci Rep. 2017;7(1):1–10. doi:10.1038/s41598-016-0028-x
27. Kleiner DE, Brunt EM, Van Natta M, et al. Design and validation of a histological scoring system for nonalcoholic fatty liver disease. Hepatology. 2005;41(6):1313–1321. doi:10.1002/hep.20701
28. Folch J, Lees M, Stanley GS. A simple method for the isolation and purification of total lipides from animal tissues. J Biol Chem. 1957;226(1):497–509. doi:10.1016/S0021-9258(18)64849-5
29. Das S, Choudhuri D. Calcium supplementation shows a hepatoprotective effect against high-fat diet by regulating oxidative-induced inflammatory response and lipogenesis activity in male rats. J Tradit Complement Med. 2020;10(5):511–519. doi:10.1016/j.jtcme.2019.06.002
30. Waterborg JH. The Lowry method for protein quantitation. In: The Protein Protocols Handbook. Springer; 2009:7–10.
31. Ohkawa H, Ohishi N, Yagi K. Assay for lipid peroxides in animal tissues by thiobarbituric acid reaction. Anal Biochem. 1979;95(2):351–358. doi:10.1016/0003-2697(79)90738-3
32. Tiwari BK, Kumar D, Abidi A, Rizvi SI. Efficacy of composite extract from leaves and fruits of medicinal plants used in traditional diabetic therapy against oxidative stress in alloxan-induced diabetic rats. Int Sch Res Notices. 2014;2014:608590.
33. Green LC, Wagner DA, Glogowski J, Skipper PL, Wishnok JS, Tannenbaum SR. Analysis of nitrate, nitrite, and [15N] nitrate in biological fluids. Anal Biochem. 1982;126(1):131–138. doi:10.1016/0003-2697(82)90118-X
34. Sedlak J, Lindsay RH. Estimation of total, protein-bound, and nonprotein sulfhydryl groups in tissue with Ellman’s reagent. Anal Biochem. 1968;25:192–205. doi:10.1016/0003-2697(68)90092-4
35. Paglia DE, Valentine WN. Studies on the quantitative and qualitative characterization of erythrocyte glutathione peroxidase. J Lab Clin Med. 1967;70(1):158–169.
36. Habig WH. Glutathione S-transferase: the first enzymatic step in mercapturic acid formation. J Biol Chem. 1974;249:7130–7139. doi:10.1016/S0021-9258(19)42083-8
37. Li X. Improved pyrogallol autoxidation method: a reliable and cheap superoxide-scavenging assay suitable for all antioxidants. J Agric Food Chem. 2012;60(25):6418–6424. doi:10.1021/jf204970r
38. Aebi H. [13] Catalase in vitro. In: Methods in Enzymology. Vol. 105. Academic Press; 1984:121–126.
39. Reddy G, Enwemeka C. A simplified method for the analysis of in biological tissues hydroxyproline. Clin Biochem. 1996;29:3.
40. Ichimura M, Kawase M, Masuzumi M, et al. High-fat and high-cholesterol diet rapidly induces non-alcoholic steatohepatitis with advanced fibrosis in S Prague–D awley rats. Hepatology Res. 2015;45(4):458–469. doi:10.1111/hepr.12358
41. Li S, Meng F, Liao X, et al. Therapeutic role of ursolic acid on ameliorating hepatic steatosis and improving metabolic disorders in high-fat diet-induced non-alcoholic fatty liver disease rats. PLoS One. 2014;9(1):e86724. doi:10.1371/journal.pone.0086724
42. Ipsen DH, Lykkesfeldt J, Tveden-Nyborg P. Molecular mechanisms of hepatic lipid accumulation in non-alcoholic fatty liver disease. Cell Mol Life Sci. 2018;75(18):3313–3327. doi:10.1007/s00018-018-2860-6
43. Zhang L-J, Yang B, Yu B-P. Paeoniflorin protects against nonalcoholic fatty liver disease induced by a high-fat diet in mice. Biol Pharm Bull. 2015:b14–00892. doi:10.1248/bpb.b14-00892
44. Zaitone SA, Barakat BM, Bilasy SE, Fawzy MS, Abdelaziz EZ, Farag NE. Protective effect of boswellic acids versus pioglitazone in a rat model of diet-induced non-alcoholic fatty liver disease: influence on insulin resistance and energy expenditure. Naunyn Schmiedebergs Arch Pharmacol. 2015;388(6):587–600. doi:10.1007/s00210-015-1102-9
45. Bharti S, Golechha M, Kumari S, Siddiqui KM, Arya DS. Akt/GSK-3β/eNOS phosphorylation arbitrates safranal-induced myocardial protection against ischemia–reperfusion injury in rats. Eur J Nutr. 2012;51(6):719–727. doi:10.1007/s00394-011-0251-y
46. Chen H-J, Liu J. Actein ameliorates hepatic steatosis and fibrosis in high fat diet-induced NAFLD by regulation of insulin and leptin resistant. Biomed Pharmacother. 2018;97:1386–1396. doi:10.1016/j.biopha.2017.09.093
47. Bharathi V, Rengarajan R, Radhakrishnan R, et al. Effects of a medicinal plant Macrotyloma uniflorum (Lam.) Verdc. formulation (MUF) on obesity-associated oxidative stress-induced liver injury. Saudi J Biol Sci. 2018;25(6):1115–1121. doi:10.1016/j.sjbs.2018.03.010
48. Ozenirler S, Erkan G, Konca Degertekin C, et al. The relationship between advanced oxidation protein products (AOPP) and biochemical and histopathological findings in patients with nonalcoholic steatohepatitis. J Dig Dis. 2014;15(3):131–136. doi:10.1111/1751-2980.12113
49. Zhao Y, Zhang L, Ouyang X, et al. Advanced oxidation protein products play critical roles in liver diseases. Eur J Clin Invest. 2019;49(6):e13098. doi:10.1111/eci.13098
50. Zhong X, Liu H. Baicalin attenuates diet induced nonalcoholic steatohepatitis by inhibiting inflammation and oxidative stress via suppressing JNK signaling pathways. Biomed Pharmacother. 2018;98:111–117. doi:10.1016/j.biopha.2017.12.026
51. Overi D, Carpino G, Franchitto A, Onori P, Gaudio E. Hepatocyte injury and hepatic stem cell niche in the progression of non-alcoholic steatohepatitis. Cells. 2020;9(3):590. doi:10.3390/cells9030590
52. Younes R, Burgoyne R, Tiniakos D, Govaere O. Clinical implications of hepatic progenitor cell activation in non-alcoholic fatty liver disease. Hepatoma Res. 2021;7:15.
 © 2022 The Author(s). This work is published and licensed by Dove Medical Press Limited. The full terms of this license are available at https://www.dovepress.com/terms.php and incorporate the Creative Commons Attribution - Non Commercial (unported, v3.0) License.
By accessing the work you hereby accept the Terms. Non-commercial uses of the work are permitted without any further permission from Dove Medical Press Limited, provided the work is properly attributed. For permission for commercial use of this work, please see paragraphs 4.2 and 5 of our Terms.
© 2022 The Author(s). This work is published and licensed by Dove Medical Press Limited. The full terms of this license are available at https://www.dovepress.com/terms.php and incorporate the Creative Commons Attribution - Non Commercial (unported, v3.0) License.
By accessing the work you hereby accept the Terms. Non-commercial uses of the work are permitted without any further permission from Dove Medical Press Limited, provided the work is properly attributed. For permission for commercial use of this work, please see paragraphs 4.2 and 5 of our Terms.