")
Back to Journals » OncoTargets and Therapy » Volume 10
Reduction of AZGP1 predicts poor prognosis in esophageal squamous cell carcinoma patients in Northern China
Authors Tang H, Wu Y , Qin Y, Wang H, Wang L, Guan X, Luo S, Wang Q
Received 31 May 2016
Accepted for publication 8 November 2016
Published 20 December 2016 Volume 2017:10 Pages 85—94
DOI https://doi.org/10.2147/OTT.S113932
Checked for plagiarism Yes
Review by Single anonymous peer review
Peer reviewer comments 3
Editor who approved publication: Dr Ingrid Espinoza
Hong Tang,1,* Yufeng Wu,1,* Yanru Qin,2 Haiying Wang,1 Lili Wang,1 Xinyuan Guan,3 Suxia Luo,1 Qiming Wang1
1Department of Internal Medicine, Affiliated Cancer Hospital of Zhengzhou University, Henan Cancer Hospital, 2Department of Clinical Oncology, The First Affiliated Hospital of Zhengzhou University, Zhengzhou, Henan, 3Department of Clinical Oncology, The University of Hong Kong, Hong Kong, People’s Republic of China
*These authors contributed equally to this work
Background: As a key regulator in lipid mobilization, AZGP1 has been reported to play a significant role in various cancers. This study was carried out to investigate the role of AZGP1 in the development of esophageal squamous cell carcinoma (ESCC) patients in Northern China.
Materials and methods: Through the application of quantitative real-time polymerase chain reaction and immunohistochemical staining, AZGP1 expression in ESCC tissues from Northern China was examined.
Results: Decreased expression of AZGP1 was observed in ~60% ESCC patients. AZGP1 downregulation was significantly associated with lymph node metastasis (P=0.035), advanced clinical stage (P=0.018), poor prognosis for 5-year disease-specific survival (DSS; P<0.001), local recurrence-free survival (LRFS; P=0.016), and metastasis-free survival (MeFS; P=0.014). In addition, Cox multivariate analysis revealed that AZGP1 downregulation remained to be an independent prognosticator for shorter DSS (P=0.001), LRFS (P=0.011), and MeFS (P=0.004).
Conclusion: AZGP1 might be a candidate tumor suppressor and a potential novel prognostic biomarker for ESCC patients in Northern China.
Keywords: AZGP1, ESCC, prognosis, Northern China
Introduction
With incidence varying greatly by geographic location and ethnicity,1,2 esophageal cancer (EC) is one of the leading causes of cancer death worldwide. Due to lifestyle, dietary habits, and multiple genetic alterations, Northern China has one of the highest rates of EC in the world. Accounting for >90% of EC, esophageal squamous cell carcinoma (ESCC) predominates in eastern countries, particularly in Northern China.3,4 In spite of recent advances in diagnosis and therapeutic options, the prognosis is still poor with ~10%–41% average overall 5-year survival rate.5–8 Decreasing the mortality rate will require early diagnosis and effective treatment for ESCC patients. So far, genetic alterations have been widely investigated; however, reliable biomarkers for clinical diagnosis, prognosis, and therapeutic efficiency evaluation are still lacking. Therefore, identifying more effective biomarkers for early diagnosis and targeted therapies is of significant clinical value.
In order to identify more novel EC-related genes that might be potential biomarkers for diagnosis or therapeutic targets, cDNA microarray technology was adopted to simultaneously analyze the changes in the expression of thousands of genes. In our previous research, a number of discriminatively expressed genes have been identified, such as CTTN, EMS1, AZGP1 HMGCS2, and SORBS29 through Affymetrix Human Genome U133 Plus 2.0 GeneChip consisting of 47,000 transcripts, so as to compare gene expression profiles between tumor tissues and matched normal epithelia from 10 ESCC specimens. In this study, AZGP1 expression in primary ESCC and the correlation with clinical parameters were verified.
Materials and methods
Statement of ethics
ESCC tissue samples used in this study were approved by the Committees for Ethical Review of Research involving Human Subjects at Zhengzhou University (Zhengzhou, People’s Republic of China). Written informed consent for the original human work producing tissue samples was obtained.
ESCC clinical samples
After surgical resection at Linzhou Cancer Hospital, Northern China, primary ESCC tumor tissues and their paired nontumor tissues were immediately collected from the proximal resection margins. Some was quickly put into vials stored in liquid nitrogen, and other tumor tissues were routinely formalin-fixed and paraffin-embedded. The inclusion criteria were listed as follows: 1) histological evidence of ESCC, 2) complete surgical resection (R0), 3) no perioperative chemotherapy and/or radiotherapy treatment, and 4) complete follow-up for 60 months. TNM staging is based on the American Joint Committee on Cancer Guidelines.10
Quantitative real-time polymerase chain reaction (qRT-PCR)
By adopting TRIzol (Invitrogen, Carlsbad, CA, USA), total RNA was extracted from frozen ESCC tissues. According to the manufacturer’ instructions, reverse transcription of total RNA (2 μg) was done by making use of Advantage RT-for-PCR Kit (Clontech). In order to detect the expression level of corresponding β-actin and AZGP1, qRT-PCR was performed with an SYBR Green PCR Kit (Applied Biosystems) and ABI 7900HT Fast Real-Time PCR System (Applied Biosystems). β-Actin served as an internal control for AZGP1. In Table 1, primers of AZGP1 and β-actin are listed. To validate them, we have tested PCR products in gels to confirm the accuracy and specificity of PCR amplification (Figure S1). SDS2.3 software (Applied Biosystems) was used to analyze relative expression levels. Through the Ct method, the real-time value for each sample was averaged and compared. ΔΔCt (sample) = ΔCt (sample) − ΔCt (calibrator), ΔCt (sample) = Ct (sample) of target gene − Ct (sample) of β-actin, ΔCt (calibrator) = Ct (calibrator) of target gene − Ct (calibrator) of β-actin; calibrator was defined as pooled samples from 45 adjacent nontumor tissues.
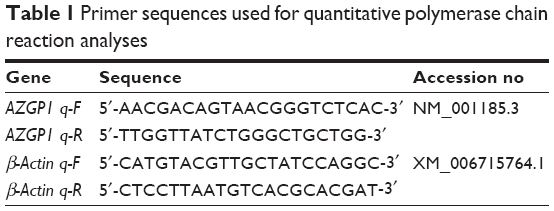 | Table 1 Primer sequences used for quantitative polymerase chain reaction analyses |
ESCC tissue microarray (TMA) and immunohistochemical (IHC) staining
Containing 300 pairs of primary ESCC tissue samples and their corresponding nontumor tissues, TMAs were constructed as described previously.9 In short, tissue sections with a thickness of 5 μm were cut from TMA blocks and mounted on microscope slides. By using the standard streptavidin–biotin–peroxidase complex method, IHC staining was performed.9 TMA slides were deparaffinized in xylene, rehydrated by a graded alcohol series, and incubated with 3% hydrogen peroxide. For antigen retrieval, TMA slides were boiled in 10 mM sodium citrate buffer (pH 6.0) for 15 minutes through a pressure cooker. Blocked by 10% normal mouse serum at room temperature for 30 minutes, the slides were then incubated with primary anti-AZGP1 monoclonal antibody (Proteintech; 1:200 dilution) at 4°C overnight, which has been confirmed by Western blot assay (Figure S2). At a concentration of 1:75, the TMA section was incubated with biotinylated goat antimouse immunoglobulin at 37°C for 30 minutes. Through the application of ImmPress Universal Kit (Vector Laboratories, Burlingame, CA, USA), primary antibody staining was visualized with NovaRed (Vector Laboratories) as a substrate. In the next step, the sections were counterstained with hematoxylin, dehydrated, and mounted. As stated before, an immunoreactivity score system was applied.11 The percentage of AZGP1-positive cells was scored as 0, <5% negative; 1, 5%–25% sporadic; 2, 25%–50% focal; and 3, >50% diffuse. In addition, the intensity of AZGP1-positive staining was scored as 0, negative; 1, weak; 2, moderate; and 3, strong. Both the percentage of positive cells and the intensity of cell staining were determined in a double-blinded manner. According to the following formula, the total score was determined: staining index = intensity × positive rate. In this study, staining index of not more than 4 was regarded as down expression and staining index of more than 4 was regarded as normal expression.
Statistical analysis
SPSS standard version 16.0 was adopted to perform statistical analysis, and paired two-tailed t-test was used to compare AZGP1 expression in primary ESCC tumors and their paired nontumorous tissues. Through χ2 test or Fisher’s exact tests, the statistical significance of correlations between AZGP1 expression and clinicopathologic characteristics was assessed. The points for disease-specific survival (DSS), local recurrence-free survival (LRFS), and metastasis-free survival (MeFS) were calculated from the surgery date to the date that event developed. Survival curves were plotted through Kaplan–Meier method, and statistical analysis was performed through log-rank test. And then, parameters demonstrating prognostic significance at the univariate test were enrolled into multivariate comparisons through the Cox proportional hazards model. P<0.05 was considered to be statistically significant.
Results
Frequent downregulation of AZGP1in ESCC
By using qRT-PCR, the mRNA expression of AZGP1 was compared between tumor and their paired nontumor tissues in 45 ESCC patients. When compared with their normal counterparts, the relative expression level of AZGP1 was significantly downregulated in tumor tissues (P<0.001; Figure 1). AZGP1 downregulation was detected in 29/45 (64.4%) ESCC tumors compared with their normal counterparts (defined as a 2-fold decrease of AZGP1 expression in tumors). Using a TMA, AZGP1 expression in protein level was further studied by IHC. Informative results were obtained from 215 pairs of ESCCs. Noninformative samples were not included in data analysis, including 57 cases of lost samples, 9 cases of unrepresentative samples, 13 cases of samples with too few tumor cells, and 6 cases of samples with inappropriate staining. As the staining index of AZGP1 was ≥4 in nontumor tissue, staining index of not less than 4 was then counted as normal AZGP1 expression. When staining index was <4, AZGP1 downregulation was defined, which was detected in 118/215 (54.9%) ESCC tissues compared with their adjacent nontumor tissues (P<0.001; Figure 2), and the corresponding hematoxylin and eosin staining was visible in Figure S3. In both mRNA and protein level, a consistent result was detected in AZGP1 expression.
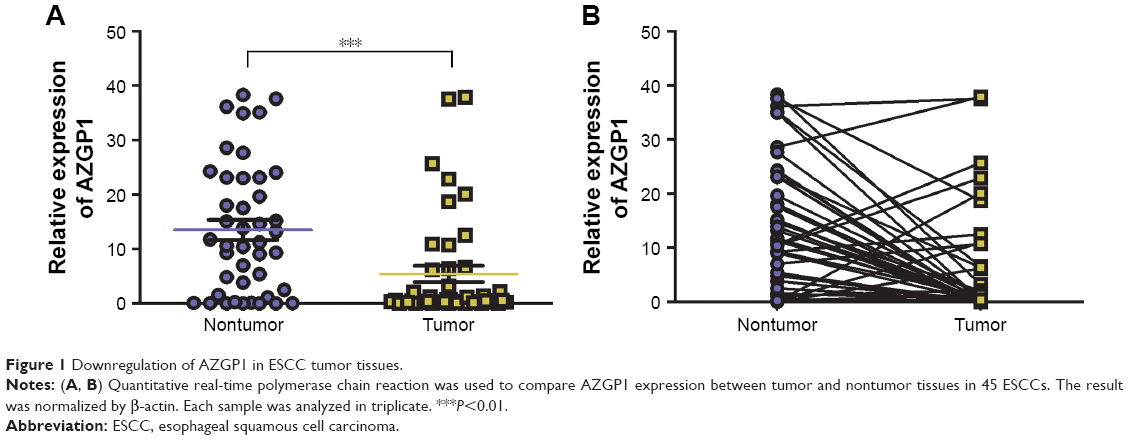 | Figure 1 Downregulation of AZGP1 in ESCC tumor tissues. |
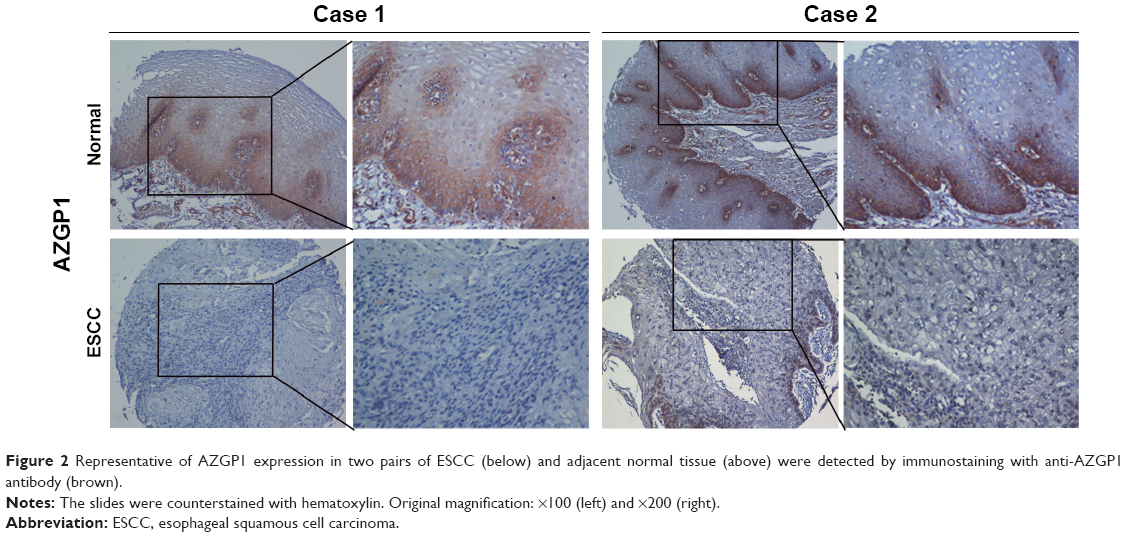 | Figure 2 Representative of AZGP1 expression in two pairs of ESCC (below) and adjacent normal tissue (above) were detected by immunostaining with anti-AZGP1 antibody (brown). |
Correlation of AZGP1 downregulation with clinicopathologic characteristics
Next, the clinical association between AZGP1 protein expression and clinicopathologic characteristics of ESCC patients from Northern China were examined. The analysis results demonstrated that AZGP1 downregulation was significantly associated with pathologic N status (P=0.035) and advanced clinical staging (P=0.018). Moreover, no correlation was observed between AZGP1 expression and patient’s age (P=0.067), gender (P=0.487), tumor location (P=0.173), tumor cell differentiation (P=0.721), pathologic T status (P=0.112), and general classification (P=0.899; Table 2).
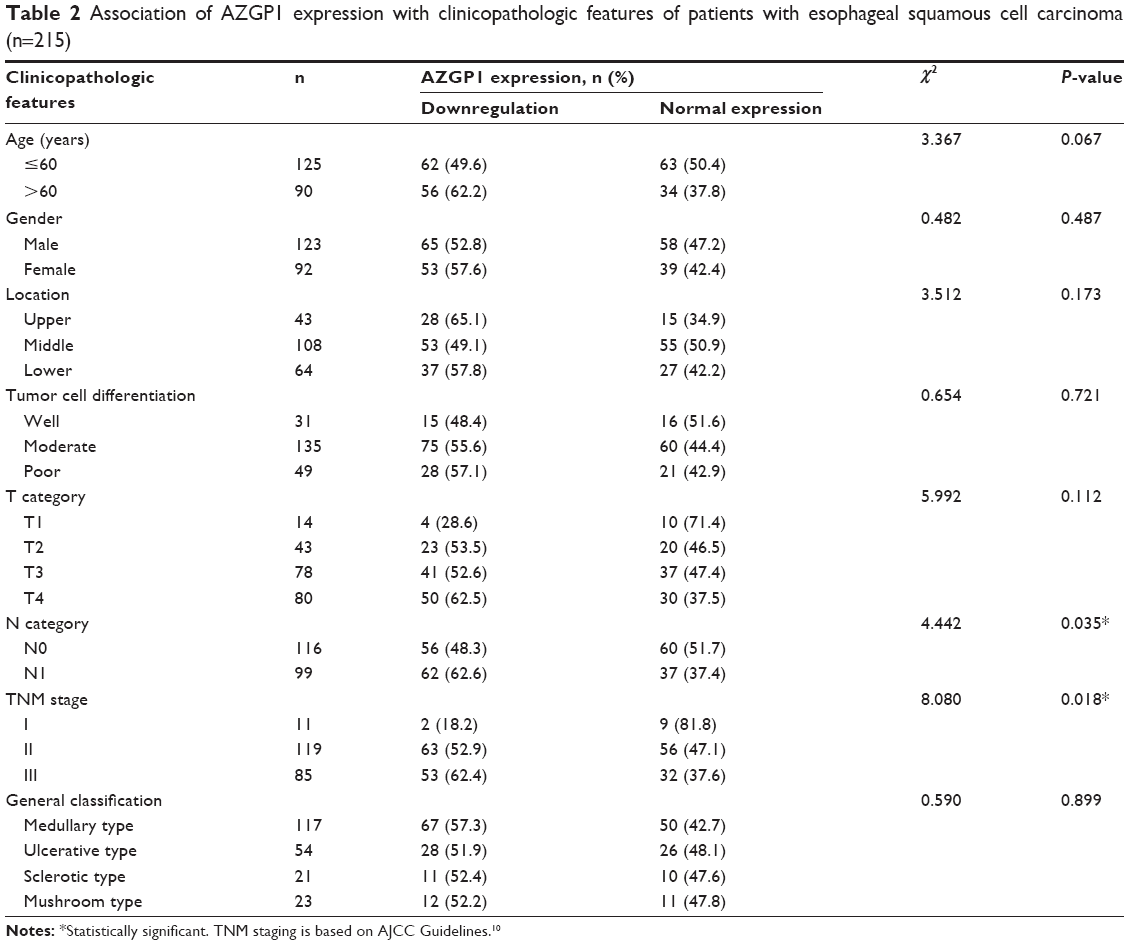 | Table 2 Association of AZGP1 expression with clinicopathologic features of patients with esophageal squamous cell carcinoma (n=215) |
Prognostic impact of AZGP1 expression in ESCC
The mean follow-up duration of these patients was 27.4 months (ranging from 1 to 60 months). Kaplan–Meier analysis revealed that ESCC patients with AZGP1 downregulation (median survival time of 18 months) had a shorter DSS than patients with normal AZGP1 expression (median survival time of 30 months, P<0.000; Figure 3A). Furthermore, no significant difference in DSS was observed in patients with TNM stage III (P=0.295) in a stratified survival analysis according to the TNM stage. However, AZGP1 expression could differentiate the prognosis of patients among those with TNM stage I–II (P<0.001; Figure 3B). Similarly, patients with AZGP1 downregulation had a shorter median LRFS (9 months vs 15 months, P=0.016; Figure 3C) and median MeFS (9.5 months vs 17 months, P=0.014; Figure 3D). In univariate analysis of these clinicopathologic parameters (Table 3), there were a number of risk factors that were significantly associated with worse DSS, including pathologic T status (P<0.001), pathologic N status (P<0.001), and tumor cell differentiation (P=0.002). Through the application of multivariate analysis (Table 4), advanced pathologic T status (P=0.001) and pathologic N status (P<0.001) were identified as independent risk factors for tumor local recurrence. Furthermore, pathologic T status (P=0.005) and pathologic N status (P<0.001) were independent factors for tumor metastasis prediction. But above all, downregulated AZGP1 was significantly predictive for worse DSS (P<0.001), LRFS (P=0.026), and MeFS (P=0.018), as shown in Table 3 and Figure 2. In multivariate analysis, downregulated AZGP1, pathologic T status, and tumor cell poor differentiation were prognostically significant for inferior DSS (P=0.001, P<0.001, and P=0.005, respectively). Moreover, AZGP1 expression, pathologic T status, and pathologic N status were independent prognostic predictors for LRFS (P=0.011, P=0.040, and P=0.014, respectively), AZGP1 expression and pathologic N status for MeFS (P=0.004 and P=0.009, respectively; Table 3).
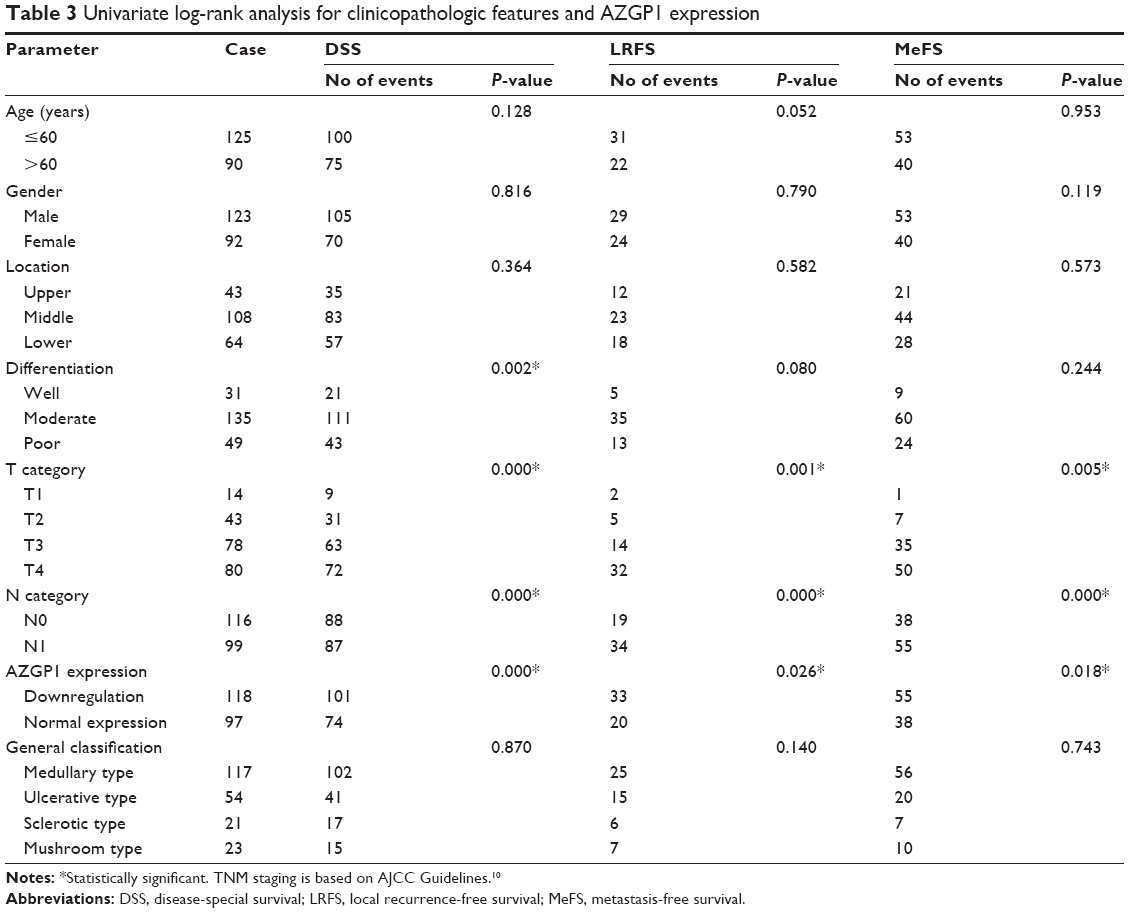 | Table 3 Univariate log-rank analysis for clinicopathologic features and AZGP1 expression |
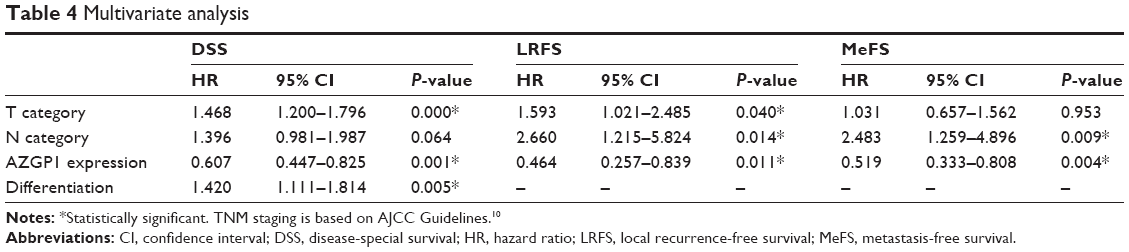 | Table 4 Multivariate analysis |
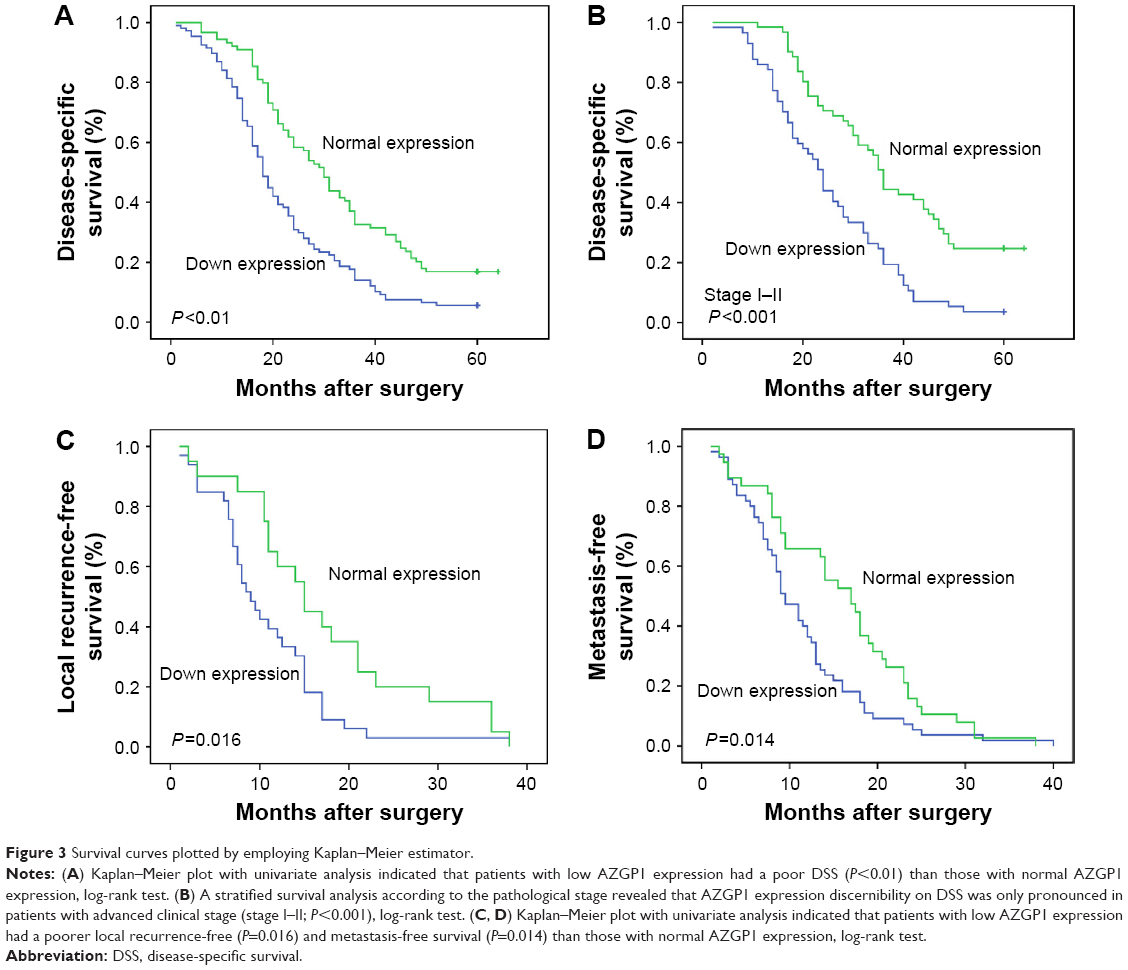 | Figure 3 Survival curves plotted by employing Kaplan–Meier estimator. |
Discussion
Recently, AZGP1 has been highlighted to play a crucial role in carcinogenesis in human cancers.12–15 To our knowledge, this is the first study to explore the relationship between AZGP1 gene expression and human ESCC occurrence and development. In this study, it was shown that when compared with their paired normal control, both mRNA and protein expression of AZGP1 was significantly downregulated in ESCC tissues. Moreover, AZGP1 downregulation was notably more prevalent in patients with lymph node metastasis, advanced clinical staging, shorter DSS, LRFS, and worse MeFS. These results might suggest AZGP1 as a novel prognostic biomarker for ESCC.
Assigned to chromosome 7q22.1, AZGP1 is a soluble 41 kDa secreted glycoprotein, which was identified from human plasma, and its chemical structure and properties were explored by Burgi and Schmid.16 As an adipokine in human adipocytes, cancer cell, AZGP1 plays a key role in lipid mobilization.17 There is evidence to show that due to the high level of amino acid sequence homology with a tumor-derived lipid-mobilizing factor, AZGP1 is associated with cancer cachexia by stimulating lipid degradation in adipocytes.18,19 In recent studies, AZGP1 was reported to be overexpressed in some tumors, but lost or reduced expression in other tumors.20,21 Although the exact mechanism remains unclear, AZGP1 expression has been demonstrated to be regulated by the acetylation status of histone, which regulates gene activity by means of changing chromatin conformation.22 It is shown that AZGP1 is downregulated in lung adenocarcinoma through inhibiting histone acetylation.21 On the contrary, it is histone deacetylation that results in lost expression of AZGP1 in pancreatic adenocarcinoma.23 In this study, the rates of AZGP1 downregulation were 64.4% and 54.9% in mRNA and protein level, respectively. Therefore, whether histone deacetylation contributes to AZGP1 down expression in ESCC requires further investigation.
It was indicated that AZGP1 downregulation was associated with tumor cells poor differentiation in a majority of popular tumors, such as breast cancer, prostate cancer, oral squamous cell carcinomas, pancreatic cancer, cervical cancer, and gastric cancer.14,15,21–24 Because of its high structural homology to the major histocompatibility complex class I family, AZGP1 plays a antitumor role by participating the immune response.12 By downregulating mammalian target of rapamycin signaling pathway downstream and inhibiting cdc2 that could regulate G2/M transition, AZGP1 overexpression impaired the proliferation and migration potential.25 The relationship between AZGP1 expression and cancer patients’ clinical stages is incomprehensible. In bladder cancer, AZGP1 expression was increased in a stage-dependent manner;13 however, its expression was inversely related to tumor stage in prostate cancer and gastric cancer.24,26 It was reported that low AZGP1 expression was associated with advanced T stage in gastric cancer.24 In this study, the percentage of AZGP1 protein downregulation increased as tumor cell differentiation degree decreased. Nevertheless, there was no statistical significance between AZGP1 protein downregulation and tumor cell differentiation. However, AZGP1 protein downregulation was notably more correlated with lymph node metastasis and advanced clinical stage. Besides, it was proven that lower AZGP1 level could induce TGF-β mediated epithelial–mesenchymal transition, while AZGP1 overexpression could maintain the epithelial phenotype in pancreatic cancer.21 These findings might explain why AZGP1 downregulation promotes metastasis. In addition, there was no correlation between AZGP1 expression and tumor location, pathologic T status, and general classification. Our findings suggested that AZGP1 down expression might promote ESCC progression.
In the past, a number of studies confirmed that AZGP1 downregulation was relevant to poor prognosis, which has been identified as a predictor of prognosis in various malignant tumors.24,27–30 In lung adenocarcinoma and prostate cancer, patients with low levels of AZGP1 were reported to be associated with worse survival than those with high levels of AZGP1.26,31 Utilizing numerous prostate cancer cases, Jung et al32 demonstrated the superiority of AZGP1 over other prognosis factors in predicting biochemical recurrence, such as hCAP-D3, mucin 1, vimentin, E-cadherin, and ERG. Another research showed that in the analysis of patients with early-stage breast cancer, the presence of AZGP1 protein was related to poor DSS and overall survival time.33 By making use of Kaplan–Meier survival analysis, ESCC patients with AZGP1 down expression had a significantly shorter DSS than those with normal expression in this study. Univariate analyses showed that decreased AZGP1 expression in ESCC tissues, tumor cells differentiation, and pT and pN categories were significantly associated with 5-year survival rate. Multivariate analysis demonstrated that AZGP1 expression, tumor cells differentiation, and pT category were independent risk factors for ESCC patients’ DSS. Furthermore, normal AZGP1 expression was significantly related to longer clinical recurrence period and distant metastasis. Cox regression analysis indicated that AZGP1 might be one of the factors affecting ESCC patients’ recurrence and metastasis. These observations suggested that after surgical resection, AZGP1 might act as a new predictor of prognosis in ESCC patients.
In summary, the expression levels and prognostic value of AZGP1 in ESCC were investigated in this study for the first time. The results of this study demonstrated that AZGP1 downregulation in ESCC tissues indicated aggressive tumor behaviors and predicted a worse clinical outcome. These suggested that AZGP1 might serve as a candidate tumor suppressor and prognostic marker in ESCC, as well as a potential therapeutic target for ESCC patients.
Acknowledgments
This work was supported by grants from the Key Science and Technology Research Foundation of Henan Province (nos 152102410087 to Hong Tang), Ph.D. Research Foundation of Henan Cancer Hospital (nos 201511004 to Yufeng Wu), the National Science Foundation of China (nos 81272600 to Qiming Wang).
Disclosure
The authors report no conflicts of interest in this work.
References
Kamangar F, Dores GM, Anderson WF. Patterns of cancer incidence, mortality, and prevalence across five continents: defining priorities to reduce cancer disparities in different geographic regions of the world. J Clin Oncol. 2006;24(14):2137–2150. | ||
Wheeler JB, Reed CE. Epidemiology of esophageal cancer. Surg Clin North America. 2012;92(5):1077–1087. | ||
Shahbaz Sarwar CM, Luketich JD, Landreneau RJ, Abbas G. Esophageal cancer: an update. Int J Surg. 2010;8(6):417–422. | ||
Hongo M, Nagasaki Y, Shoji T. Epidemiology of esophageal cancer: orient to Occident. Effects of chronology, geography and ethnicity. J Gastroenterol Hepatol. 2009;24(5):729–735. | ||
Portale G, Hagen JA, Peters JH, et al. Modern 5-year survival of resectable esophageal adenocarcinoma: single institution experience with 263 patients. J Am Coll Surg. 2006;202(4):588–596; discussion 596–588. | ||
Li XH, Wang XP, Gu WS, et al. Clinical significance of preoperative thrombin time in patients with esophageal squamous cell carcinoma following surgical resection. PLoS One. 2015;10(10):e0140323. | ||
Chao YK, Chang CB, Chuang WY, et al. Correlation between tumor regression grade and clinicopathological parameters in patients with squamous cell carcinoma of the esophagus who received neoadjuvant chemoradiotherapy. Medicine (Baltimore). 2015;94(34):e1407. | ||
Guo JC, Huang TC, Lin CC, et al. Postchemoradiotherapy pathologic stage classified by the American Joint Committee on the cancer staging system predicts prognosis of patients with locally advanced esophageal squamous cell carcinoma. J Thorac Oncol. 2015;10(10):1481–1489. | ||
Xie D, Sham JS, Zeng WF, et al. Heterogeneous expression and association of beta-catenin, p16 and c-myc in multistage colorectal tumorigenesis and progression detected by tissue microarray. Int J Cancer. 2003;107(6):896–902. | ||
American Joint Committee on Cancer. AJCC Guidelines, 7th Edition; 2009. Available from: www.cancerstaging.org. | ||
Brown RS, Wahl RL. Overexpression of Glut-1 glucose transporter in human breast cancer. An immunohistochemical study. Cancer. 1993;72(10):2979–2985. | ||
Hassan MI, Waheed A, Yadav S, Singh TP, Ahmad F. Zinc alpha 2-glycoprotein: a multidisciplinary protein. Mol Cancer Res. 2008;6(6):892–906. | ||
Irmak S, Tilki D, Heukeshoven J, et al. Stage-dependent increase of orosomucoid and zinc-alpha2-glycoprotein in urinary bladder cancer. Proteomics. 2005;5(16):4296–4304. | ||
Abdul-Rahman PS, Lim BK, Hashim OH. Expression of high-abundance proteins in sera of patients with endometrial and cervical cancers: analysis using 2-DE with silver staining and lectin detection methods. Electrophoresis. 2007;28(12):1989–1996. | ||
Lei G, Arany I, Selvanayagam P, et al. Detection and cloning of epidermal zinc-alpha 2-glycoprotein cDNA and expression in normal human skin and in tumors. J Cell Biochem. 1997;67(2):216–222. | ||
Burgi W, Schmid K. Preparation and properties of Zn-alpha 2-glycoprotein of normal human plasma. J Biol Chem. 1961;236:1066–1074. | ||
Bao Y, Bing C, Hunter L, Jenkins JR, Wabitsch M, Trayhurn P. Zinc-alpha2-glycoprotein, a lipid mobilizing factor, is expressed and secreted by human (SGBS) adipocytes. FEBS Lett. 2005;579(1):41–47. | ||
Russell ST, Zimmerman TP, Domin BA, Tisdale MJ. Induction of lipolysis in vitro and loss of body fat in vivo by zinc-alpha2-glycoprotein. Biochim Biophys Acta. 2004;1636(1):59–68. | ||
Bing C, Bao Y, Jenkins J, et al. Zinc-alpha2-glycoprotein, a lipid mobilizing factor, is expressed in adipocytes and is up-regulated in mice with cancer cachexia. Proc Natl Acad Sci U S A. 2004;101(8):2500–2505. | ||
Brysk MM, Lei G, Adler-Storthz K, et al. Zinc-alpha2-glycoprotein expression as a marker of differentiation in human oral tumors. Cancer Lett. 1999;137(1):117–120. | ||
Kong B, Michalski CW, Hong X, et al. AZGP1 is a tumor suppressor in pancreatic cancer inducing mesenchymal-to-epithelial transdifferentiation by inhibiting TGF-beta-mediated ERK signaling. Oncogene. 2010;29(37):5146–5158. | ||
Diez-Itza I, Sanchez LM, Allende MT, Vizoso F, Ruibal A, Lopez-Otin C. Zn-alpha 2-glycoprotein levels in breast cancer cytosols and correlation with clinical, histological and biochemical parameters. Eur J Cancer. 1993;29A(9):1256–1260. | ||
Hale LP, Price DT, Sanchez LM, Demark-Wahnefried W, Madden JF. Zinc alpha-2-glycoprotein is expressed by malignant prostatic epithelium and may serve as a potential serum marker for prostate cancer. Clin Cancer Res. 2001;7(4):846–853. | ||
Huang CY, Zhao JJ, Lv L, et al. Decreased expression of AZGP1 is associated with poor prognosis in primary gastric cancer. PLoS One. 2013;8(7):e69155. | ||
He N, Brysk H, Tyring SK, Ohkubo I, Brysk MM. Zinc-alpha(2)-glycoprotein hinders cell proliferation and reduces cdc2 expression. J Cell Biochem Suppl. 2001;(Suppl 36):162–169. | ||
Descazeaud A, de la Taille A, Allory Y, et al. Characterization of ZAG protein expression in prostate cancer using a semi-automated microscope system. Prostate. 2006;66(10):1037–1043. | ||
Lapointe J, Malhotra S, Higgins JP, et al. hCAP-D3 expression marks a prostate cancer subtype with favorable clinical behavior and androgen signaling signature. Am J Surg Pathol. 2008;32(2):205–209. | ||
Huang Y, Li LZ, Zhang CZ, et al. Decreased expression of zinc-alpha2-glycoprotein in hepatocellular carcinoma associates with poor prognosis. J Transl Med. 2012;10:106. | ||
Agesen TH, Sveen A, Merok MA, et al. ColoGuideEx: a robust gene classifier specific for stage II colorectal cancer prognosis. Gut. 2012;61(11):1560–1567. | ||
Ji D, Li M, Zhan T, et al. Prognostic role of serum AZGP1, PEDF and PRDX2 in colorectal cancer patients. Carcinogenesis. 2013;34(6):1265–1272. | ||
Albertus DL, Seder CW, Chen G, et al. AZGP1 autoantibody predicts survival and histone deacetylase inhibitors increase expression in lung adenocarcinoma. J Thorac Oncol. 2008;3(11):1236–1244. | ||
Jung WY, Sung CO, Han SH, et al. AZGP-1 immunohistochemical marker in prostate cancer: potential predictive marker of biochemical recurrence in post radical prostatectomy specimens. Appl Immunohistochem Mol Morphol. 2014;22(9):652–657. | ||
Bundred NJ, Walker RA, Everington D, White GK, Stewart HJ, Miller WR. Is apocrine differentiation in breast carcinoma of prognostic significance? Br J Cancer. 1990;62(1):113–117. |
Supplementary materials
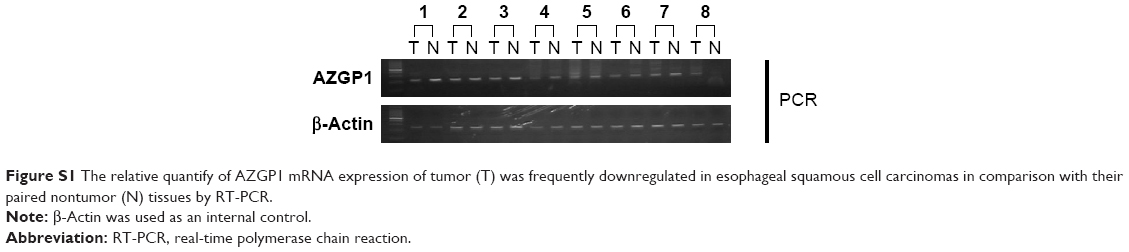 | Figure S1 The relative quantify of AZGP1 mRNA expression of tumor (T) was frequently downregulated in esophageal squamous cell carcinomas in comparison with their paired nontumor (N) tissues by RT-PCR. |
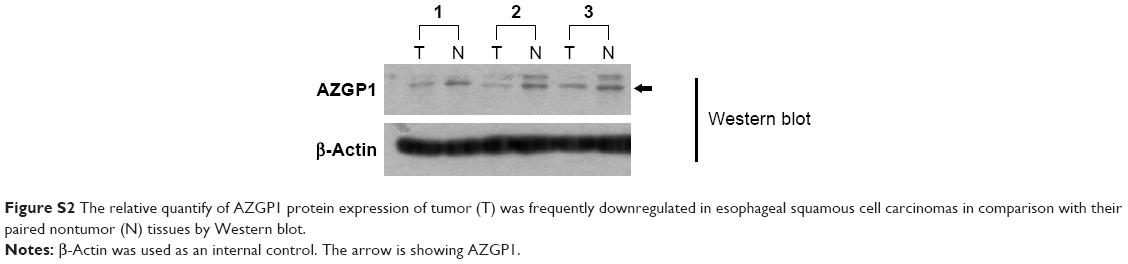 | Figure S2 The relative quantify of AZGP1 protein expression of tumor (T) was frequently downregulated in esophageal squamous cell carcinomas in comparison with their paired nontumor (N) tissues by Western blot. |
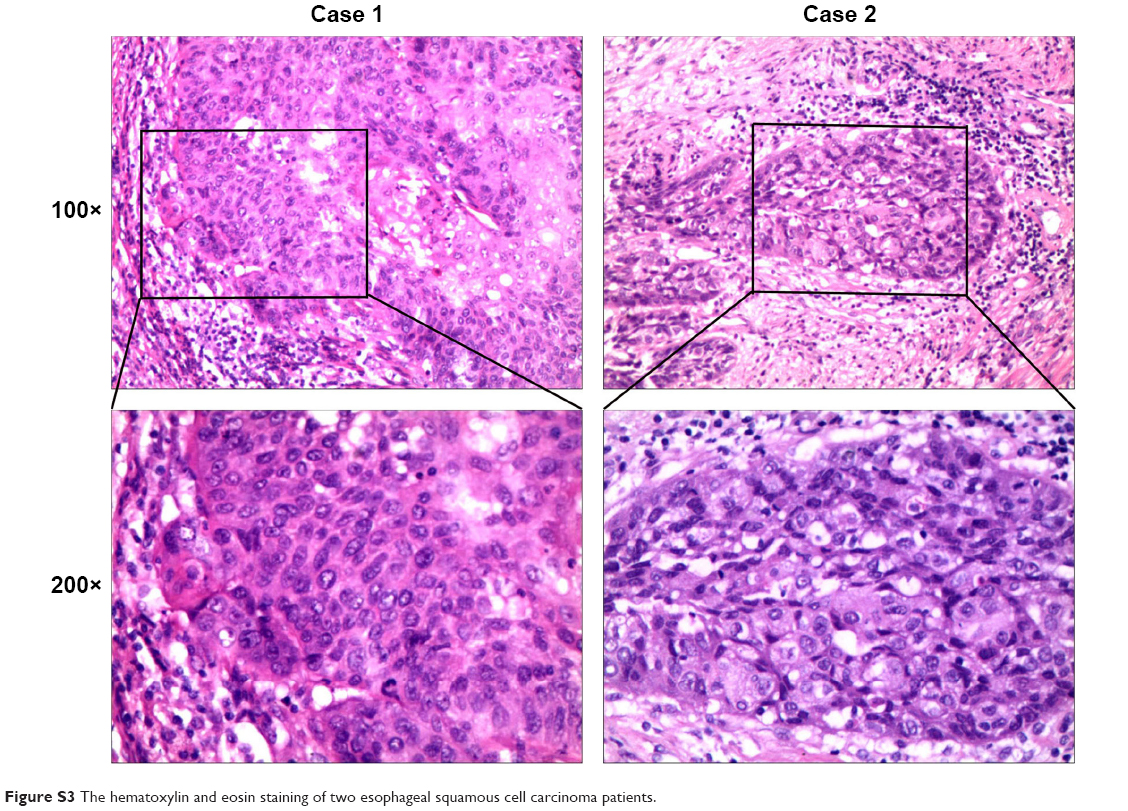 | Figure S3 The hematoxylin and eosin staining of two esophageal squamous cell carcinoma patients. |
 © 2016 The Author(s). This work is published and licensed by Dove Medical Press Limited. The full terms of this license are available at https://www.dovepress.com/terms.php and incorporate the Creative Commons Attribution - Non Commercial (unported, v3.0) License.
By accessing the work you hereby accept the Terms. Non-commercial uses of the work are permitted without any further permission from Dove Medical Press Limited, provided the work is properly attributed. For permission for commercial use of this work, please see paragraphs 4.2 and 5 of our Terms.
© 2016 The Author(s). This work is published and licensed by Dove Medical Press Limited. The full terms of this license are available at https://www.dovepress.com/terms.php and incorporate the Creative Commons Attribution - Non Commercial (unported, v3.0) License.
By accessing the work you hereby accept the Terms. Non-commercial uses of the work are permitted without any further permission from Dove Medical Press Limited, provided the work is properly attributed. For permission for commercial use of this work, please see paragraphs 4.2 and 5 of our Terms.