")
Back to Journals » International Journal of General Medicine » Volume 15
Reduced CCR2 Can Improve the Prognosis of Sarcoma by Remodeling the Tumor Microenvironment
Received 9 January 2022
Accepted for publication 8 March 2022
Published 14 March 2022 Volume 2022:15 Pages 3043—3053
DOI https://doi.org/10.2147/IJGM.S349295
Checked for plagiarism Yes
Review by Single anonymous peer review
Peer reviewer comments 2
Editor who approved publication: Dr Scott Fraser
Baixing Wei, Hao Feng, Han Wu
Department of Orthopedics, China-Japan Union Hospital of Jilin University, Changchun, People’s Republic of China
Correspondence: Han Wu, Tel +86 043189876902, Email [email protected]
Background: The tumor microenvironment (TME) plays a very important role in the development of sarcoma (SARC), but it is still unknown how to effectively regulate the TME.
Aim: Our study aims to identify core molecules that can concurrently regulate immune and stromal cells in TME as potential therapeutic targets.
Methods and Results: We used the ESTIMATE algorithm to score the immune and stromal components of 265 SARC samples and determined that increased immune and stromal components in TME were both associated with poor prognosis in SARC. Next, we identified differential genes that regulate both immune and stromal cells, and identified the core prognostic gene CCR2 through the protein–protein interaction (PPI) network, COX analysis, survival analysis, and GSEA enrichment analysis. Next, we calculated the content of infiltrating immune cells and stromal cells in tumors using the CIBERSORT and xcell algorithms, respectively. Using differential analysis and Spearman correlation analysis, we identified 12 immune cells and 7 stromal cells, including CD4+T cells, CD8+T cells, monocytes, macrophages, dendritic cells, NK cells, mesenchymal stem cells (MSC), Fibroblasts and Endothelial cells, all of which were regulated by CCR2.
Conclusion: Increased immune and stromal cell components were associated with poor prognosis in SARC, and CCR2 had a prognostic role in TME, regulating multiple immune and stromal cells, and was an important target for TME remodeling as well as immunotherapy in SARC.
Keywords: CCR2, tumor microenvironment, stromal cells, immunity, macrophages
Introduction
Sarcomas (SARC) are heterogeneous tumors originating from mesenchymal tissue and are malignant tumors commonly found in children and adolescents.1–3 The five year survival rate of SARC patients is 50%, but it decreases sharply in patients with advanced disease; in addition, distant recurrence occurs in nearly half of SARC.4,5 To date, the most common treatment for local SARC is surgery combined with radiotherapy and chemotherapy, but the recurrence rate after treatment is still as high as 50%;6,7 therefore, new therapies and targets are needed to treat SARC.
The tumor microenvironment (TME) refers to the cellular environment in which tumor or tumor stem cells exist.8 It has been widely recognized that the tumor microenvironment plays an important role in dynamically regulating tumor progression and influencing therapeutic outcomes.9 TME not only maintains tumor cell survival and proliferation by resisting apoptosis and evading growth inhibition, but also modulates the response to therapy.10 Therefore, TME plays an essential role within the therapeutic outcome and clinical prognosis of cancer patients.
In addition to tumor cells, the tumor microenvironment also includes stromal cells and immune cells. Immune cell infiltration is related to poor prognosis in SARC,11 especially macrophages, and has an important impact on local recurrence, distant metastasis and overall survival of SARC patients.12 Mesenchymal stem cells (MSC) can significantly increase the number of cancer stem cells (CSC) promoting the production of SARC precursors and causing a CSC-like state by inducing epithelial-mesenchymal transition.13 Therefore, finding a target that can modulate immune and stromal cells to enable alteration of SARC TME, leading to an improved prognosis of SARC is critical.
In this article we used the ESTIMATE to estimate the level of stromal and immune cell infiltration in malignant tumor tissue, and our study shows that increased infiltration of stromal cells and immune cells correlated significantly with poor survival status in SARC patients. We then performed a string of analyses to identify a core prognostic marker, CCR2, related to both stromal and immune cells. Calculation of the relative content of tumor-infiltrating immune cells by the CIBERSORT algorithmic program in order to subsequently analyze the immune cells associated with CCR2. We calculated the relative content of tumor-infiltrating stromal cells by the xcell algorithm to find the stromal cells associated with CCR2. Our study shows that reduced CCR2 is closely associated with poor prognosis in SARC and the ability to drive multiple immune and stromal cells, and is an important regulator of remodeling SARC TME to improve tumor prognosis, providing an important target for SARC therapy.
Materials and Methods
Raw Data
This study used 256 SARC RNA-seq cases and the corresponding clinical data downloaded from the TCGA database. 256 SARC RNA-seq cases include 2 normal samples and 263 tumor samples and the database is https://portal.gdc.cancer.gov/.
Generation of the ImmuneScore, StromalScore, and ESTIMATEScore
The ESTIMATE algorithm14 was performed using the estimate package loaded with R language version 4.0.3 to evaluate the proportion of immune and stromal components in each sample, presented in three forms of scores, ImmuneScore, StromalScore, and ESTIMATEScore. ImmuneScore, StromalScore, and ESTIMATEScore have positive correlation with the amount of immune cells, stromal cells, and the sum of the two in the tumor, respectively. A high score means a high content.
Survival Analysis
Survival analysis was performed by the survival and survminer packages loaded in R language. Survival time and status were recorded in the clinical data for survival analysis in 263 tumor samples, grouped using the optimal cutoff value, and survival curves were plotted by using the Kaplan-Meier method, and log rank was used as a significance analysis, with p<0.05 being considered significant.
Difference Analysis of Clinical Characteristics
Clinical data such as age and sex of TCGA-SARC samples were analyzed using Wilcoxon rank sum test in R language.
Generation of DGEs and Heatmap
The samples were divided into two groups based on the median values of ImmuneScore and StromalScore, respectively, and differential gene expression analysis was performed by using the limma package, and differential genes with |log(FC)| >1 and false discovery rate (FDR) <0.05 between the high group and the low group were considered as DGEs. The pheatmap package was used for heatmap of DEGs.
Enrichment Analysis of GO and KEGG
Enrichment analyses of GO and KEGG were carried out on 545 DGEs by the clusterProfiler, enrichplot and ggplot2 packages loaded in R language. Compliance with p-value and q-value simultaneously <0.05 was regarded as significantly enriched.
PPI Network Construction
PPI networks were constructed by STRING database, and nodes with interaction relationship confidence higher than 0.95 were used as reconstructed PPI networks by Cytoscape version 3.8.2. The top 20 DGEs according to the number of adjacent nodes were considered as the core genes for the next step of analysis.
Regression Analysis of Univariate COX
Regression analysis of univariate COX was performed by the survival package loaded in R language. The top 20 genes are displayed in univariate COX regression analysis plots in order of smallest to largest P-value.
Survival Analysis of CCR2 as a Prognostic Marker for SARC
First, samples were separated into two groups in accordance with the median value of CCR2 expression levels. Subsequently, the Kaplan-Meier method was implemented to analyze the relationship between CCR2 expression level and Overall Survival, and this was used to plot survival curves.
Gene Enrichment Analysis
Hallmark downloaded from MSigDB as the target gene set. Enrichment was carried out by using 4.1.0 GSEA software. Gene sets that met both p and q-value < 0.05 were regarded as remarkably enriched.
Immune Cell and Stromal Cell Infiltration
The CIBERSORT algorithm was applied to assess the content of immune cells in the tumor samples. Samples with P<0.05 in mass filtering were used for subsequent analysis. The relative content of stromal cells in tumor samples was calculated using the xcell software package.
Analysis of Differences and Correlation
The median value of CCR2 gene expression was used as a grouping criterion to compare immune and stromal cell differences using the Wilcox test, and the correlations of CCR2 with immune and stromal cells was analyzed using the spearman test. p<0.05 was deemed significant.
Results
The Analysis Process of This Research
The flow of our research is illustrated in Figure 1: First, we downloaded the transcriptome RNA-seq data of 263 SARC cases from the TCGA database, then analyzed the TME composition of SARC, and calculated the immune and stromal cell components of SARC samples using the ESTIMATE algorithm. And we tried to determine whether the immune component and stromal component have any effect on the survival time of SARC patients. Next, we found DGEs that differed in both immune score and stromal score, and used PPI network and COX regression analysis to find core genes with prognostic effects to obtain CCR2.We then focused on several important analyses of CCR2, including survival analysis to determine its value as a prognostic marker for SARC and GSEA enrichment to analyzed its function. Finally we explored which immune and stromal cells this prognostic gene could regulate in SARC by two methods.
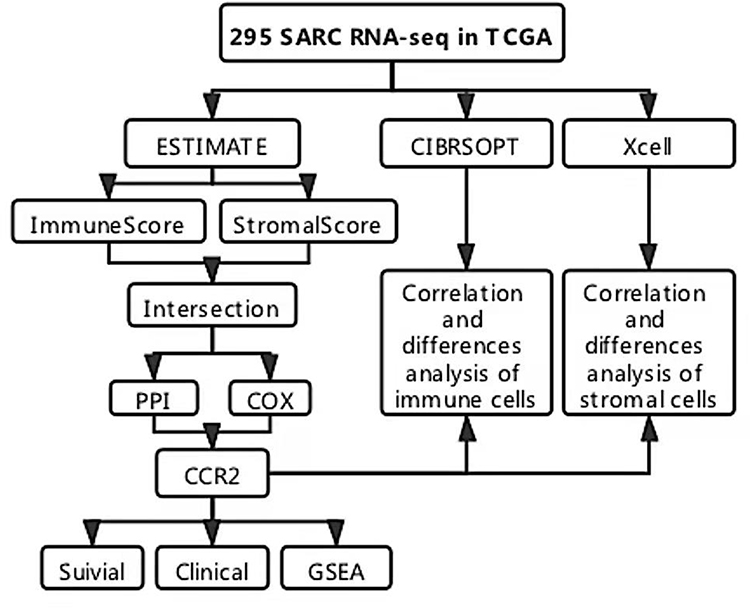 |
Figure 1 Article analysis flow. |
Association of Tumor Microenvironment Scores with Patient Survival and Clinical Traits
To identify the relationship between the content of immune and stromal components of TME and survival in SARC patients, survival analyses were carried out separately for ImmuneScore, StromalScore and ESTIMATEScore by using Kaplan-Meier. ImmuneScore, StromalScore represent the relative content of immune or stromal cell components in TME, respectively. ESTIMATEScore is the sum o ImmuneScore, StromalScore. As shown in Figure 2A-C, ImmuneScore, StromalScore and ESTIMATEScore were strongly associated with patient survival, suggesting that the immune and stromal components of TME in SARC patients play an important role in patient prognosis.In addition to the StromalScore, the ESTIMATEScore and ImmuneScore were also higher in the older patients (Figure 2D, F and H). Interestingly, all scores were higher in female patients than in male patients significantly, demonstrating a greater difference in the components of TME between female SARC patients and male SARC patients (Figure 2E, G and I).
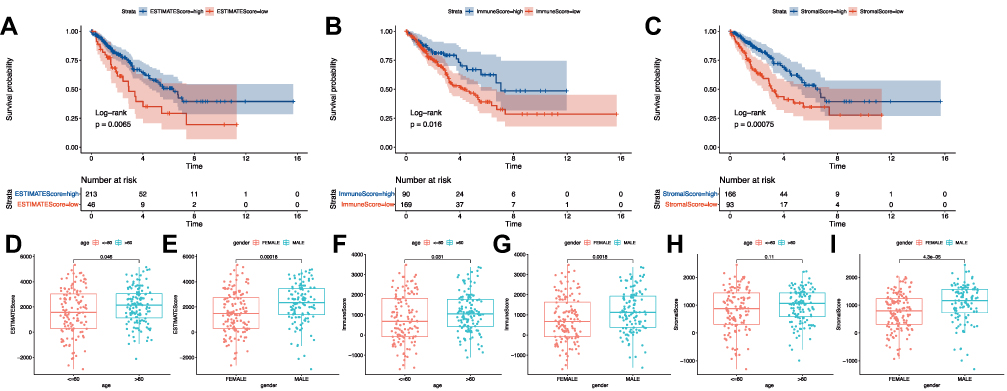 |
Figure 2 Relationship between SARC patient scores and survival, age and sex. SARC patients were grouped separately using the best cutoff value for high and low groups for survival analysis, and ESTIMATEScore group with p=0.0065 by Log rank test (A), ImmuneScore group with p=0.016 by Log rank test (B), StromalScore group with p=0.00075 by Log rank test (C). The P value of ESTIMATEScore(D), ImmuneScore(F) and StromalScore(H) subgroup in age is 0.046, 0.031 and 0.11 respectively. By Wilcoxon rank sum test, the P value of ImmuneScore(G) and StromalScore(I) subgroup in gender is 0.00018, 0.0018 and 4.3e −05, respectively. |
DEGs are Mainly Related to Immune Function
To explore the altered gene profile in TME related to immune and stromal components, we compared the high and low subgroups (Figure 3A and B).In the comparison of samples with high scores and low scores by ImmuneScore, we obtained 881 upregulated DEGs, and 288 downregulated DEGs.Similarly, 1562 up-regulated genes and 2859 down-regulated genes were obtained by the StromalScore.Performing intersection analysis showed that there were 484 upregulated genes in both ImmuneScore and StromalScore high subgroups at the same time, meaning that these DGEs are up-regulated with higher stromal and immune cell contents in TME, and in both low scores subgroups there were 61 genes downregulated, for a total of 555 DEGs (Figure 3C and D).
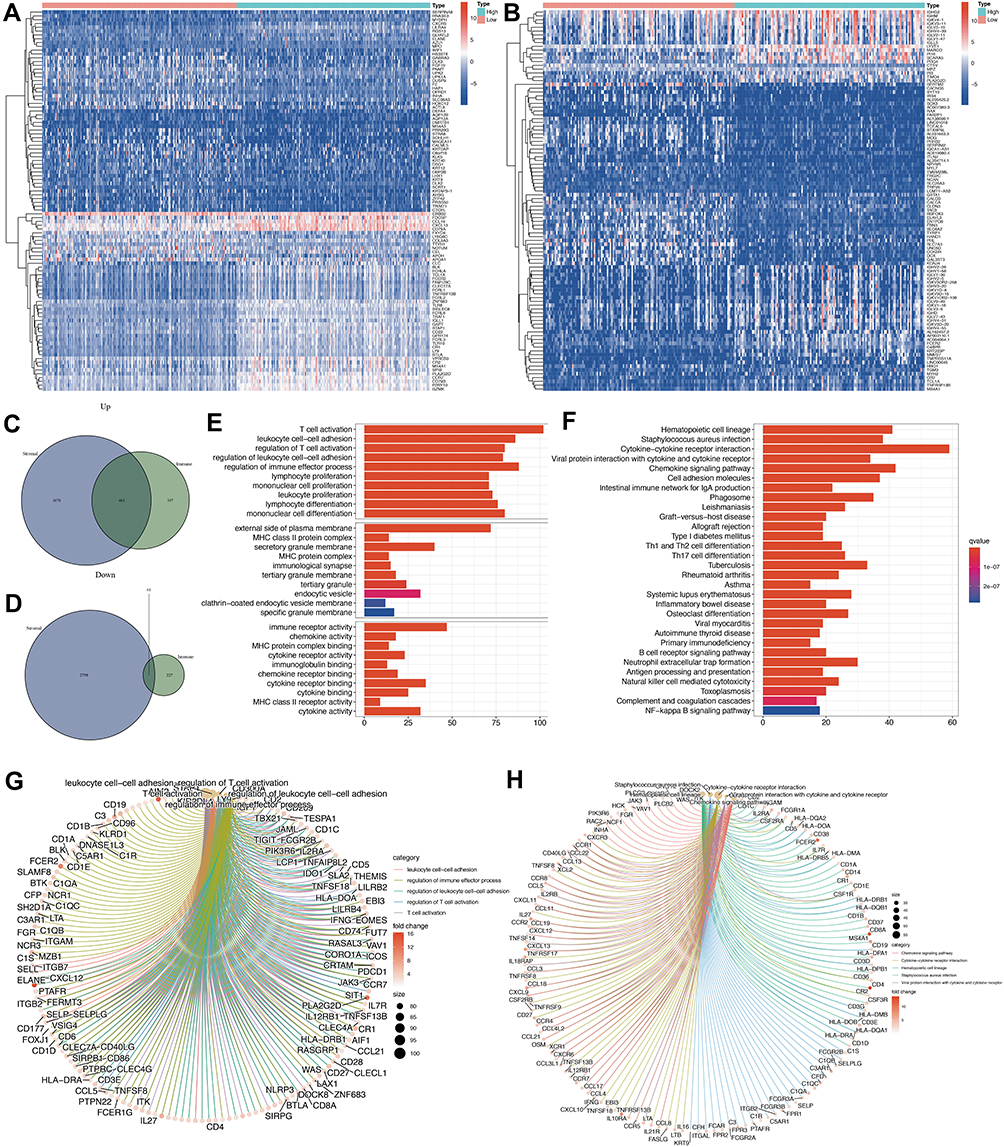 |
Figure 3 The generation and function of DEGs. Heatmaps of DEGs were obtained by comparing the difference genes between the high and low subgroups of ImmuneScore(A) and StromalScore(B) using the Wilcoxon test. |log(FC)| >1 and false discovery rate (FDR) <0.05. (C and D) Intersection plot showing the intersection of immune and stromal group co-upregulated and co-downregulated genes. (E-H) Column and circle plots represent the results of the enrichment analysis of 545 DEGs, which were considered significantly enriched when the p-value and q-value were both <0.05. |
These DEGs may be the determinants of the dynamic changes in TME. Gene Ontology (GO) enrichment analysis results revealed that almost all of these DEGs are associated with immune-related biological processes, such as the T cell activation and regulation, the regulation of immune effector processes, and the lymphocyte proliferation and differentiation (Figure 3E and G).Kyoto Encyclopedia of Genes and Genomes (KEGG) enrichment analysis also showed enrichment in chemokine signaling pathways, cytokine-cytokine receptor interactions, and cell adhesion molecule pathways (Figure 3F and H).Thus, the whole function of DEGs seems to map onto immune-related activities. It also implies immune factors are a major characteristic of TME in SARD patients.
Identification of Core Prognostic Genes Affecting the Tumor Microenvironment
To identify core genes that play a critical role in the tumor microenvironment, we build a PPI network supported by STRING database using Cytoscape software [National Institute of General Medical Sciences (NIGMS) USA]. Figure 4A shows the top 30 genes sorted by the amount of significant nodes. Univariate COX regression analysis was then performed to identify the top 20 genes with prognostic significance according to p-value (Figure 4B).Finally, we performed intersection analysis to identify core genes with prognostic value, As shown in Figure 4C, the core gene with prognostic role that can influence the composition of tumor microenvironment in SARC is CCR2.
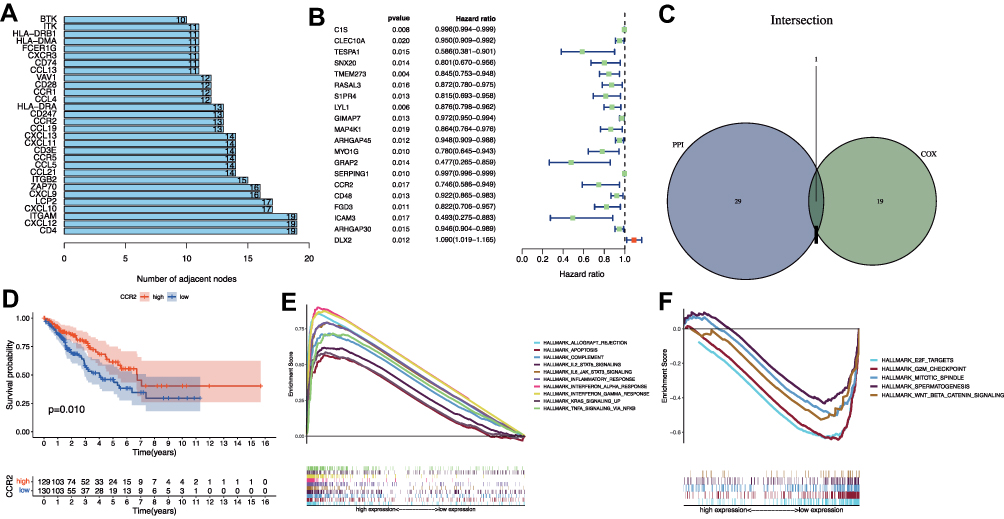 |
Figure 4 Analysis of the core prognostic marker CCR2. (A), Bar graph showing the 20 genes with the highest number of neighboring nodes in the PPI network with interaction confidence value>0.95. (B), Univariate COX analysis showing the 20 most significant genes ranked by p-value from smallest to largest, p<0.001. (C), Venn diagram showing the intersection of the above two analyses, residing in the core gene of prognostic value–CCR2. (D), Survival analysis was performed by grouping median CCR2 expression values, and p<0.05 was considered significant. Enrichment analysis of the HALLMARK gene set was performed in the CCR2 high expression group (E) and low expression group (F), respectively, and was considered significantly enriched when it met p-value and q-value simultaneously <0.05. |
CCR2 is a receptor for monocyte chemoattractant protein-1, a chemokine that is specifically known to mediate monocyte chemotaxis. Survival analysis revealed SARC patients with higher CCR2 expression survived longer than those with low CCR2 expression (Figure 4D), indicating that it is a beneficial factor for patient survival. Next, we explored its function in tumors, and we used the MSigDB-defined tumor signature gene set for enrichment, which showed the enrichment of multiple immune-functional gene sets in the CCR2 highly expressed group, such as the inflammatory response, the interleukin 2-STAT5 pathway, the interleukin 6-JAK-STAT3 pathway, and the interferon α and interferon γ responses (Figure 4E).However, in the low CCR2 expression group, gene sets such as the G2M checkpoint, the WNT β-catenin pathway, and the E2F transcription factor pathway associated with cell cycle and senescence were enriched (Figure 4F).These results suggest that CCR2 may be an important target capable of influencing the prognosis of SARC patients by regulating TME composition.
Correlation of CCR2 with the Proportion of Tumor-Infiltrating Immune Cells
For the further confirmation the association between the expression of CCR2 and the immune microenvironment, we conducted an analysis of the proportion of tumor-infiltrating immune subpopulations via the CIBERSORT algorithm. The results of correlation and difference analysis revealed that a total of 12 immune cells were related to the expression of CCR2. (Figure 5A and B). Among them, nine immune cells had positive correlation with CCR2 expression, including T cells CD8, activated T cells CD4 memory, T cells follicular helper, T cells regulatory (Tregs), naive B cells, Plasma cells, Dendritic cells resting, Macrophages M1, Monocytes. Three types of immune cells were negatively correlated with CCR2 expression, including Macrophages M0, Macrophages M2, NK cells resting (Figure 5C-N). These findings further support that the CCR2 expression level affects the TME immune activities.
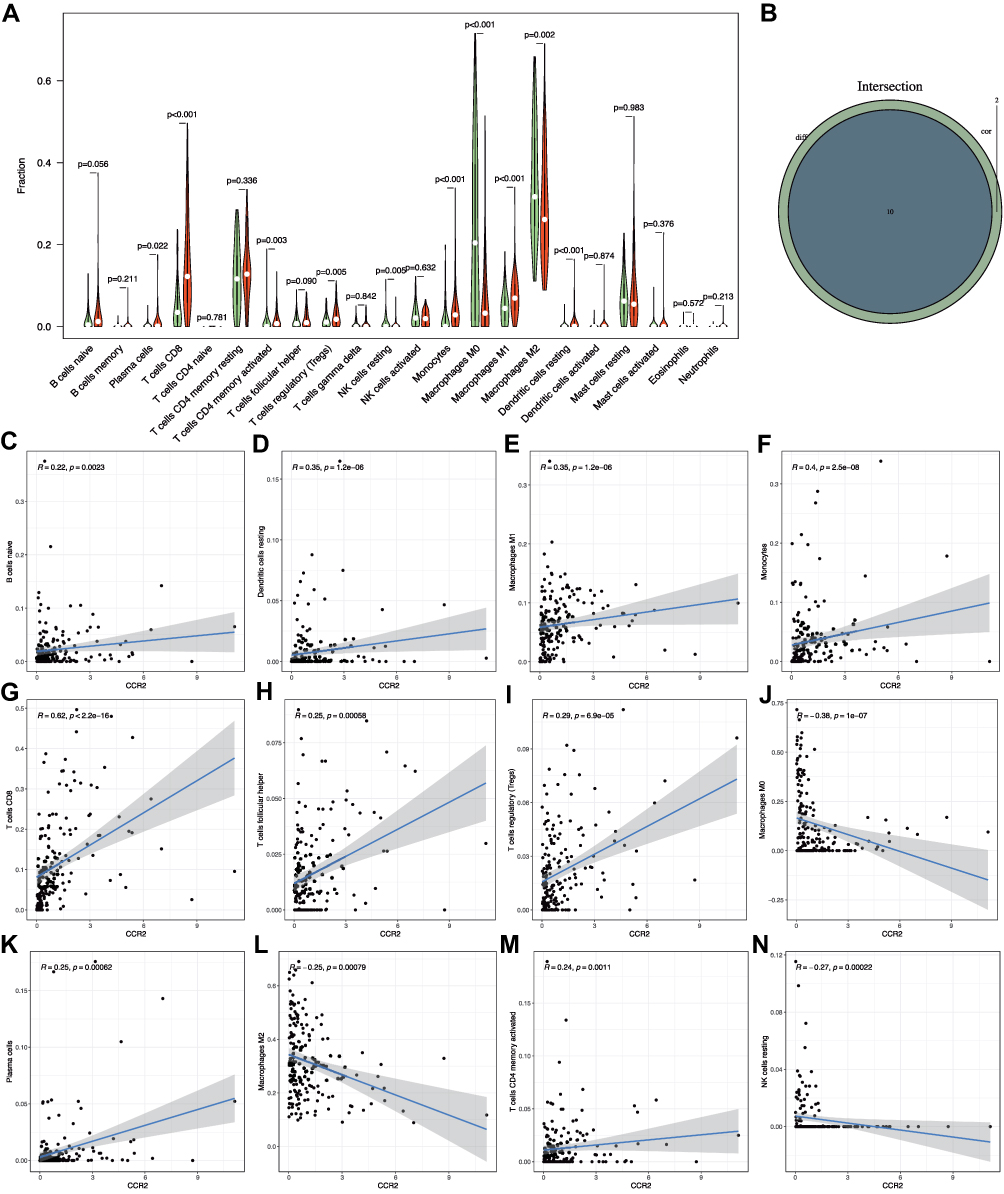 |
Figure 5 Correlation of CCR2 with immune cells. (A), Violin plot demonstrating differences in 22 immune cells grouped by median CCR2 expression using Wilcoxon analysis, p<0.05 proving statistical significance. (B). Vene plot indicating the intersection of immune cells that were significant with both difference analysis and correlation analysis with CCR2 expression. p<0.05 was considered significant. (C-N), Scatter plot indicating immune cells with CCR2 expression correlated immune cells, using spearman analysis, p<0.05 was considered statistically significant. |
Correlation of CCR2 with the Proportion of Tumor-Infiltrating Stromal Cells
Next, we analyzed the content of seven tumor-infiltrating stromal cells for subsequent analysis using the xcell algorithm, and the outcomes of correlation and difference analysis revealed that all seven stromal cells were correlated with CCR2 expression (Figure 6A and B). Among them, three stromal cells were positively correlated with CCR2 expression, including Endothelial cells, mv Endothelial cells, and ly Endothelial cells; Four stromal cells were negatively correlated with CCR2 expression, including MSC, Fibroblasts, Pericytes, and Smooth muscle (Figure 6C-I). These results demonstrated the level of CCR2 also had an effect on the stromal cells of TME.
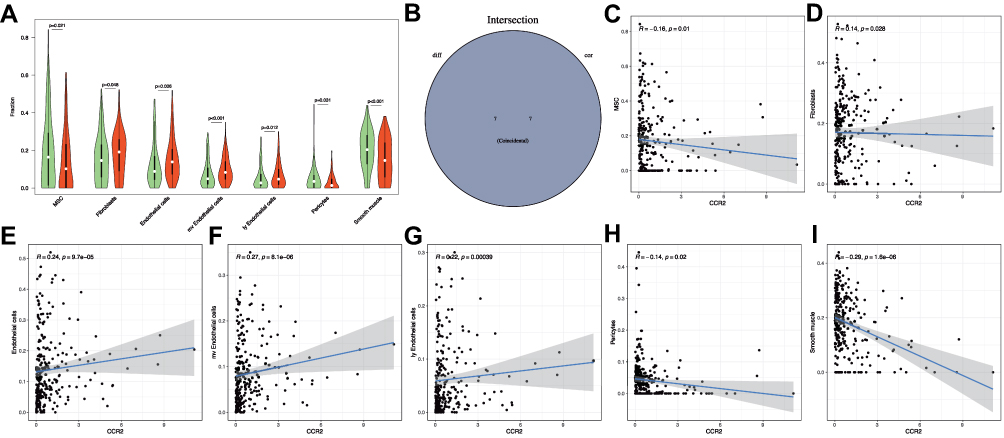 |
Figure 6 Correlation of CCR2 with stromal cells. (A), violin plot demonstrating differences in seven stromal cells grouped by median CCR2 expression using Wilcoxon analysis, p<0.05 proving statistical significance. (B). Venn diagram indicating the intersection of stromal cells that were significant with both differential and correlation analysis of CCR2 expression. p<0.05 was considered significant. (C-I), Scatter plot indicating correlation with CCR2 expression of stromal cells, using spearman analysis, p<0.05 was considered statistically significant. |
Discussion
In our research, we attempted to find out the key genes that are closely associated with TME formation and patient prognosis in SARC by screening the TCGA database. Through a series of bioinformatic analyses, the close association that CCR2 had with TME formation and poor prognosis in SARC has been confirmed. Further, we found that CCR2 was associated with 12 immune cells such as T cells CD8, T cells CD4 memory activated, T cells regulatory (Tregs), Macrophages, and 7 stromal cells such as Endothelial cells, MSC, Fibroblasts.
TME plays an essential role in tumorigenesis and progression. It would be useful to explore potential therapeutic targets that could contribute to the TME remodeling and facilitate the shift from tumor-promoting to tumor-suppressing TME. The important role the tumor microenvironment TME plays in dynamically regulating cancer progression and influencing therapeutic outcomes is now well known.9 Immunotherapy has made tremendous progress in recent years, with immune checkpoint inhibitors such as the PD1-PD1 ligand 1 (PDL1) axis and/or cytotoxic T lymphocyte-associated antigen 4 (CTLA4) having been approved as first-line agents in a variety of solid tumors.15–19 However, the efficiency of immune checkpoint inhibitor therapy in SARC treatment is limited.20,21 Therefore, targeting the sarcoma microenvironment is an attractive therapeutic approach, but its implementation may need to be combined with other therapeutic targets. Our analysis of SARC transcriptome data from the TCGA database revealed that increased immune and stromal components in TME are associated with poor prognosis in SARC patients, and these results highlight the importance of exploring targets that regulate immune as well as stromal cell infiltration. Subsequently, our findings show that CCR2 is associated with tumor prognosis and is involved in the chemotaxis of multiple immune and stromal cells in TME of SARC, and therefore, CCR2 may be a therapeutic target and potential prognostic marker for TME of SARC patients.
CCR2 is a receptor for chemokine (CC motif) ligand 2 (CCL2), and CCR2 is selectively expressed on the cell surface, participating in multiple signaling pathways and regulating cell migration.22 When CCL2 binds to CCR2, it induces chemotactic activity and increases calcium inward flow. It has various effects on wide variety of cells, including monocytes, macrophages, osteoclasts, basophils and endothelial cells, and it is also involved in multiple diseases.23 Moreover, CCR2 has multiple effects in tumor progression, like increasing tumor cell proliferation and invasiveness, as well as creating a tumor microenvironment by increasing angiogenesis and immunosuppressive cell recruitment.24 However, our results suggest that elevated CCR2 expression in SARC patients is associated with a better patient prognosis, which seems inconsistent with other cancers. Therefore, we speculate that CCR2 expression may exhibit differential effects of anti-tumor versus tumor-promoting effects in different tumors.
In the tumor microenvironment, CD4+ and CD8+ T cells act as central players in tumor growth.25,26 Increased CD8+ lymphocyte infiltration is associated with a better prognosis for synovial SARC and is related with longer survival in angiosarcoma patients.27 Our study showed that CCR2 positively correlated with T cells CD8, T cells CD4 memory activated, and T cells regulatory (Tregs) expression, while higher infiltration of CD8+ or FOXP3+ lymphocytes was related to favorable overall survival in patients,28 so we hypothesized that increased CCR2 was associated with better prognosis in patients by inducing increased infiltration of CD8+ or CD4+ lymphocytes. Besides, higher infiltrated CD163+ macrophages were associated with poorer progression-free survival in SATC,28 while our study proved that high CCR2 expression was negatively correlated with Macrophages M0, Macrophages M2, in agreement with previous studies. Meanwhile, SARC immune checkpoint therapy requires CD4+ and CD8+ T cells,29 and increased CCR2 could also increase the efficacy of immune checkpoints. In addition to immune cells, stromal cells play an important role in tumor prognosis, such as MSCs,30 MSCs promotes osteosarcoma growth through PI3K/Akt and Ras/Erk intracellular cascade responses and promote metastasis via CXCR4 signaling.31 In addition, MSCs-mediated STAT-3 pathway activation in osteosarcoma increases MMP2/9 and decreases E-calmodulin expression, promoting tumor progression.32 Our results show that increased CCR2 is negatively correlated with the expression of MSCs, again demonstrating the beneficial prognostic role of CCR2.
In conclusion, in this study, through bioinformatic analyzing SARC samples in the TCGA database, we clarified that the immune and stromal components of the TME of SARC are closely associated with the prognosis of patients, and identified the core gene CCR2 as a marker capable of influencing the prognosis of SARC patients through the tumor microenvironment. Furthermore, we identified 12 immune cells and 7 stromal cells associated with CCR2 and found that its high expression had negatively correlation with Macrophages M0, Macrophages M2, MSC, and other immune and stromal cells that were related to poor SARC prognosis, and positively correlated with CD4+ and CD8+ T that made SARC prognosis better. Therefore, we suggest that CCR2 may be involved in the regulation of TME in SARC and may be an effective target to improve the efficacy of SARC immunotherapy.
Conclusion
Increased immune and stromal cell components are associated with poor prognosis in SARC, and decreased CCR2 in TME helps drive multiple immune cells and stromal cells that contribute to poor prognosis in SARC, making CCR2 an important target for TME remodeling as well as SARC immunotherapy.
Abbreviations
SARC, sarcomas; TME, the tumor microenvironment; MSC, mesenchymal stem cells; CSCs, cancer stem cells; FDR, false discovery rate; KEGG, Kyoto Encyclopedia of Genes and Genomes; GO, Gene Ontology; Tregs, T cells regulatory; PDL1, PD1-PD1 ligand 1, CTLA4, T lymphocyte-associated antigen 4.
Ethics Statement
The patients involved in the database have obtained ethical approval. Our study was based on open source data where users can download relevant data for free for research and publish relevant articles. There were no ethical issues. And this study was submitted to the Ethics Committee of the China-Japan Union Hospital of Jilin University for review and was deemed ethics approval was not necessary.
Acknowledgments
We acknowledge TCGA database for providing their platforms and contributors for uploading their meaningful datasets. TCGA belongs to public databases.
Funding
This work was supported by the Department of Science and Technology of Jilin Province (project number: 20200404187YY).
Disclosure
The authors report no conflicts of interest in this work.
References
1. Hui JY. Epidemiology and Etiology of Sarcomas. Surg Clin North Am. 2016;96(5):901–914. doi:10.1016/j.suc.2016.05.005
2. Toro JR, Travis LB, Wu HJ, Zhu K, Fletcher CD, Devesa SS. Incidence patterns of soft tissue sarcomas, regardless of primary site, in the surveillance, epidemiology and end results program, 1978-2001: an analysis of 26,758 cases. Int J Cancer. 2006;119(12):2922–2930. doi:10.1002/ijc.22239
3. Jo VY, Fletcher CD. WHO classification of soft tissue tumours: an update based on the 2013 (4th) edition. Pathology. 2014;46(2):95–104. doi:10.1097/PAT.0000000000000050
4. Bessen T, Caughey GE, Shakib S, et al. A population-based study of soft tissue sarcoma incidence and survival in Australia: an analysis of 26,970 cases. Cancer Epidemiol. 2019;63:101590. doi:10.1016/j.canep.2019.101590
5. Kollar A, Rothermundt C, Klenke F, et al. Incidence, mortality, and survival trends of soft tissue and bone sarcoma in Switzerland between 1996 and 2015. Cancer Epidemiol. 2019;63:101596. doi:10.1016/j.canep.2019.101596
6. Italiano A, Mathoulin-Pelissier S, Cesne AL, et al. Trends in survival for patients with metastatic soft-tissue sarcoma. Cancer. 2011;117(5):1049–1054. doi:10.1002/cncr.25538
7. Raj S, Miller LD, Triozzi PL. Addressing the Adult Soft Tissue Sarcoma Microenvironment with Intratumoral Immunotherapy. Sarcoma. 2018;2018:9305294. doi:10.1155/2018/9305294
8. Spill F, Reynolds DS, Kamm RD, Zaman MH. Impact of the physical microenvironment on tumor progression and metastasis. Curr Opin Biotechnol. 2016;40:41–48. doi:10.1016/j.copbio.2016.02.007
9. Bejarano L, Jordao MJC, Joyce JA. Therapeutic Targeting of the Tumor Microenvironment. Cancer Discov. 2021;11(4):933–959. doi:10.1158/2159-8290.CD-20-1808
10. Junttila MR, de Sauvage FJ. Influence of tumour micro-environment heterogeneity on therapeutic response. Nature. 2013;501(7467):346–354. doi:10.1038/nature12626
11. Zuo S, Wei M, Wang S, Dong J, Wei J. Pan-Cancer Analysis of Immune Cell Infiltration Identifies a Prognostic Immune-Cell Characteristic Score (ICCS) in Lung Adenocarcinoma. Front Immunol. 2020;11:1218. doi:10.3389/fimmu.2020.01218
12. Smolle MA, Herbsthofer L, Goda M, et al. Influence of tumor-infiltrating immune cells on local control rate, distant metastasis, and survival in patients with soft tissue sarcoma. Oncoimmunology. 2021;10(1):1896658. doi:10.1080/2162402X.2021.1896658
13. Li C, Zhao H, Wang B. Mesenchymal stem/stromal cells: developmental origin, tumorigenesis and translational cancer therapeutics. Transl Oncol. 2021;14(1):100948. doi:10.1016/j.tranon.2020.100948
14. Yoshihara K, Shahmoradgoli M, Martinez E, et al. Inferring tumour purity and stromal and immune cell admixture from expression data. Nat Commun. 2013;4:2612. doi:10.1038/ncomms3612
15. Larkin J, Chiarion-Sileni V, Gonzalez R, et al. Combined Nivolumab and Ipilimumab or Monotherapy in Untreated Melanoma. N Engl J Med. 2015;373(1):23–34. doi:10.1056/NEJMoa1504030
16. Robert C, Schachter J, Long GV, et al. Pembrolizumab versus Ipilimumab in Advanced Melanoma. N Engl J Med. 2015;372(26):2521–2532. doi:10.1056/NEJMoa1503093
17. Motzer RJ, Escudier B, McDermott DF, et al. Nivolumab versus Everolimus in Advanced Renal-Cell Carcinoma. N Engl J Med. 2015;373(19):1803–1813. doi:10.1056/NEJMoa1510665
18. Garon EB, Rizvi NA, Hui R, et al. Pembrolizumab for the treatment of non-small-cell lung cancer. N Engl J Med. 2015;372(21):2018–2028. doi:10.1056/NEJMoa1501824
19. Ferris RL, Blumenschein G, Fayette J, et al. Nivolumab for Recurrent Squamous-Cell Carcinoma of the Head and Neck. N Engl J Med. 2016;375(19):1856–1867. doi:10.1056/NEJMoa1602252
20. Tawbi HA, Burgess M, Bolejack V, et al. Pembrolizumab in advanced soft-tissue sarcoma and bone sarcoma (SARC028): a multicentre, two-cohort, single-arm, open-label, Phase 2 trial. Lancet Oncol. 2017;18(11):1493–1501. doi:10.1016/S1470-2045(17)30624-1
21. Toulmonde M, Penel N, Adam J, et al. Use of PD-1 Targeting, Macrophage Infiltration, and IDO Pathway Activation in Sarcomas: a Phase 2 Clinical Trial. JAMA Oncol. 2018;4(1):93–97. doi:10.1001/jamaoncol.2017.1617
22. Li M, Chen L, Gao Y, et al. Recent advances targeting C-C chemokine receptor type 2 for liver diseases in monocyte/macrophage. Liver Int. 2020;40(12):2928–2936. doi:10.1111/liv.14687
23. Zhu S, Liu M, Bennett S, Wang Z, Pfleger KDG, Xu J. The molecular structure and role of CCL2 (MCP-1) and C-C chemokine receptor CCR2 in skeletal biology and diseases. J Cell Physiol. 2021;236(10):7211–7222. doi:10.1002/jcp.30375
24. Kadomoto S, Izumi K, Mizokami A. Roles of CCL2-CCR2 Axis in the Tumor Microenvironment. Int J Mol Sci. 2021;22:16. doi:10.3390/ijms22168530
25. Ostroumov D, Fekete-Drimusz N, Saborowski M, Kuhnel F, Woller N. CD4 and CD8 T lymphocyte interplay in controlling tumor growth. Cell Mol Life Sci. 2018;75(4):689–713. doi:10.1007/s00018-017-2686-7
26. Knocke S, Fleischmann-Mundt B, Saborowski M, et al. Tailored Tumor Immunogenicity Reveals Regulation of CD4 and CD8 T Cell Responses against Cancer. Cell Rep. 2016;17(9):2234–2246. doi:10.1016/j.celrep.2016.10.086
27. Fujii H, Arakawa A, Utsumi D, et al. CD8(+) tumor-infiltrating lymphocytes at primary sites as a possible prognostic factor of cutaneous angiosarcoma. Int J Cancer. 2014;134(10):2393–2402. doi:10.1002/ijc.28581
28. Oike N, Kawashima H, Ogose A, et al. Prognostic impact of the tumor immune microenvironment in synovial sarcoma. Cancer Sci. 2018;109(10):3043–3054. doi:10.1111/cas.13769
29. Alspach E, Lussier DM, Miceli AP, et al. MHC-II neoantigens shape tumour immunity and response to immunotherapy. Nature. 2019;574(7780):696–701. doi:10.1038/s41586-019-1671-8
30. Stamatopoulos A, Stamatopoulos T, Gamie Z, et al. Mesenchymal stromal cells for bone sarcoma treatment: roadmap to clinical practice. J Bone Oncol. 2019;16:100231. doi:10.1016/j.jbo.2019.100231
31. Fontanella R, Pelagalli A, Nardelli A, et al. A novel antagonist of CXCR4 prevents bone marrow-derived mesenchymal stem cell-mediated osteosarcoma and hepatocellular carcinoma cell migration and invasion. Cancer Lett. 2016;370(1):100–107. doi:10.1016/j.canlet.2015.10.018
32. Wang Y, Chu Y, Yue B, et al. Adipose-derived mesenchymal stem cells promote osteosarcoma proliferation and metastasis by activating the STAT3 pathway. Oncotarget. 2017;8(14):23803–23816. doi:10.18632/oncotarget.15866
 © 2022 The Author(s). This work is published and licensed by Dove Medical Press Limited. The full terms of this license are available at https://www.dovepress.com/terms.php and incorporate the Creative Commons Attribution - Non Commercial (unported, v3.0) License.
By accessing the work you hereby accept the Terms. Non-commercial uses of the work are permitted without any further permission from Dove Medical Press Limited, provided the work is properly attributed. For permission for commercial use of this work, please see paragraphs 4.2 and 5 of our Terms.
© 2022 The Author(s). This work is published and licensed by Dove Medical Press Limited. The full terms of this license are available at https://www.dovepress.com/terms.php and incorporate the Creative Commons Attribution - Non Commercial (unported, v3.0) License.
By accessing the work you hereby accept the Terms. Non-commercial uses of the work are permitted without any further permission from Dove Medical Press Limited, provided the work is properly attributed. For permission for commercial use of this work, please see paragraphs 4.2 and 5 of our Terms.