")
Back to Journals » Diabetes, Metabolic Syndrome and Obesity » Volume 12
Real-world insulin therapy in German type 2 diabetes mellitus patients: patient characteristics, treatment patterns, and insulin dosage
Authors Wilke T , Picker N , Mueller S , Geier S, Foersch J, Aberle J, Martin S, Riedl M , Gabler M
Received 3 May 2019
Accepted for publication 28 June 2019
Published 24 July 2019 Volume 2019:12 Pages 1225—1237
DOI https://doi.org/10.2147/DMSO.S214288
Checked for plagiarism Yes
Review by Single anonymous peer review
Peer reviewer comments 2
Editor who approved publication: Prof. Dr. Antonio Brunetti
Thomas Wilke,1 Nils Picker,2 Sabrina Mueller,2 Silke Geier,3 Johannes Foersch,4 Jens Aberle,5 Stephan Martin,6 Matthias Riedl,7 Maximilian Gabler3
1IPAM, University of Wismar 23966 Wismar, Germany; 2Real-World Evidence and Health Economics, Ingress-Health HWM GmbH, Wismar 23966, Germany; 3HP Country Commercial - Market Access, Boehringer Ingelheim Pharma GmbH & Co. Kg, Ingelheim Am Rhein 55216, Germany; 4HP Country Medical Affairs, Boehringer Ingelheim Pharma GmbH & Co. Kg, Ingelheim Am Rhein 55216, Germany; 5Department of Internal Medicine III, Universitätsklinikum Hamburg-Eppendorf (UKE), Hamburg 20246, Germany; 6German Diabetes Center, Leibniz Institute at Heinrich Heine University, Düsseldorf 40591, Germany; 7Center for Diabetology, Internal and Nutritional Medicine, Medicum Hamburg MVZ GmbH, Hamburg 20097, Germany
Background: A substantial share of type 2 diabetes mellitus (T2DM) patients receive insulin. However, little is known about the real-world treatment patterns around insulin initiation.
Methods: This was a retrospective claims data analysis. T2DM patients who initiated an insulin therapy between 01/01/2013 and 31/12/2015 were identified in the German AOK PLUS dataset. For validation of results, additional data on a similar T2DM patient population were collected in a Germany-wide medical chart review.
Results: A total of 284,878 T2DM patients were identified. Of these, 27,340 (9.6%) initiated an insulin treatment during the inclusion period (mean age: 72.2 years; 51.4% female). Mean/median weight and BMI of patients with available clinical data was 85.8/84.0 kg (SD:18.9) and 30.6/29.8 kg/m2, (SD:6.1), respectively at baseline. Mean/median HbA1c-value at baseline was 8.4/8.0% (SD: 1.8). Most commonly prescribed antidiabetic drugs (AD) within 6 months before insulin initiation were metformin (MET; 54.0%), DPP-4 inhibitors (DPP-4i; 37.6%), and sulfonylureas (SU; 29.5%). As high as 23.2% of the patients did not receive any AD prescription within 6 months before insulin initiation. A total of 10,953 of above 27,340 insulin starters (40.1%) initiated their insulin therapy without concomitant ADs (insulin monotherapy); 43% of these patients did not receive any AD before insulin initiation. Of the remaining 16,387 patients (59.9%), 4070 patients (14.9%) received MET only as concomitant AD, 6385 (23.4%) received MET plus at least one further AD, and 5932 (21.7%) received at least one further AD excluding MET. Throughout the first year of treatment, prescribed insulin dosage increased over time, resulting in approximately 43.3–77.9 IUs per observed patient day after 12 months of insulin treatment.
Conclusions: Characteristics of German T2DM patients initiating insulin deviate substantially from the average German population, especially in terms of weight. We identified an unexpectedly high number of patients without previous AD therapy receiving insulin monotherapy, which is not in line with the clinical guidelines.
Keywords: T2DM, antidiabetic treatment, claims data, chart review
Corrigendum for this paper has been published
Introduction
Among the most common chronic diseases, type 2 diabetes mellitus (T2DM) presents some of the greatest clinical and health-economic challenges.1 In addition to the burdens directly associated with this disease, diabetic patients also face an increased risk of micro- and macrovascular complications and increased mortality rates.2–7 Prevalence of T2DM in industrialized countries reaches at least 5% of the whole population and is as high as 25% in those over 85 years old.8–10 According to the International Diabetes Federation (IDF) atlas for 2015, 6.5 million people were living with T2DM in Germany, with an increasing trend in the next years.2–7,11,12
The long-term treatment of T2DM aims to prevent micro-/macroangiopathic complications, restoration of quality of life, improvement in accompanying illnesses, and avoidance of hypoglycemia and weight gain.11 To reach these goals, it is of utmost importance to control blood glucose levels.13,14 If lifestyle modifications and/or metformin (MET) monotherapy result in an HbA1c value that is still elevated beyond the agreed-upon target range (generally between 6.5% and 7.5%11), the treatment can be amplified with the addition of other antidiabetic drugs (ADs) and/or, finally, by prescription of insulin.11 A previous study based on a German sample of 394,828 T2DM patients in 2011 showed that approximately 30% of the T2DM patients were treated with insulin either as monotherapy or in combination with other ADs, with a higher percentage of insulin users among more comorbid T2DM patients.3
There exist several different insulin regimens for T2DM patients as, for example, a conventional therapy with a premixed insulin, an intensified combination therapy involving long-acting or intermediate-acting basal insulin administration and fast-acting insulin boluses with each meal, or a long-acting insulin therapy supported by an additional AD (eg, MET). Yet, there is no evidence from clinical trials demonstrating superiority of one of these regimens over the other(s).11 So, available guidelines recommend that the insulin regimen should be based on the patient’s individual needs, quality of life, and his/her metabolic state.11,13–15
There is a general lack of data on the real-world treatment of T2DM patients, especially around initiation of insulin therapy. This relates to AD treatment of patients before insulin initiation, concomitant AD treatment after start of insulin therapy as well as characteristics of patients initiating an insulin therapy. Consequently, the objective of this study was to close this data gap, based on a large real-world sample of T2DM patients.
Methods
Dataset and samples
This was a retrospective claims data analysis using data provided by a German statutory health insurance fund (AOK PLUS). The database included about 3.5 million insured persons in Germany, which reflects 4.3% of the German population insured by statutory health insurance funds. It included information on patients’ demographics (age, gender, date of death), outpatient treatment (diagnosis codes, drug therapy, and visits to GPs and specialists), inpatient treatment (dates, main diagnoses, procedures, length of stay), and claims filed for prescription medications (drug groups, prescribed dosage as defined daily dosages [DDD] as published by the German Institute of Medical Documentation and Information (DIMDI),16 date of prescription). Furthermore, basic clinical information was available for a subgroup of patients participating in a T2DM disease management program (DMP).
The dataset covered five consecutive years from 01/01/2012 to 31/12/2016. All continuously insured patients with an age of at least 18 years and a confirmed diagnosis of T2DM (ICD-10 E11.- at least one inpatient or two outpatient diagnoses in two different quarters of the study period) were included. Each included patient was required to have started an insulin therapy of any type between 01/01/2013 and 31/12/2015, meaning that for all included patients a minimum insulin-naive period of 12 months as well as a minimum follow-up period (between 01/01/2016 and 31/12/2016) of at least 12 months after insulin initiation was required. Patients with a concomitant T1DM diagnosis as well as pregnant patients were excluded.
Patient characteristics were described based on index date and/or based on a 6 months pre-index baseline period. This included the comorbidity status of the patients, which was described based on the Charlson Comorbidity Index17,18 (CCI; Table S2) and the adapted Diabetes Complications Severity Index2,7 (aDCSI; Table S1). For a subsample of above patients who were inscribed in above-mentioned DMP, additional patient characteristics such as HbA1c, weight, and BMI were available. These characteristics, based on measured values within 3 months before/1 month after index date (in case of multiple measurements, values closest to index date were considered), were described for those DMP patients with valid DMP data. Invalid data were defined as patients with identical values for weight or HbA1c throughout the first year of insulin treatment measured within 3 months before/1 month after index date and compared to a second measurement within 9–15 months after index date (in case of multiple measurements, values closest to exactly 1 year after index were considered).
Identification of insulin treatment regimens
Patients starting an insulin regimen were classified into subgroups according to their concomitant AD medication: Patients without any additional AD prescription at insulin start (index date) or within the following two weeks were categorized as “Insulin Mono”, while patients with at least one prescription of MET in addition to insulin within two weeks after index date were classified as “Insulin + MET” patients. In case of MET prescriptions later than during this two-week period, a patient was assigned to this group if pre-index MET prescriptions with remaining stock at index date had been identified. The assessment of the stock was based on supplied DDDs of all MET prescriptions observed in the pre-index period.16 In case a patient received a second AD as add-on medication to insulin and MET within the first two weeks after index date and/or an overlapping treatment as described for MET above, he/she was classified as “Insulin + MET + AD” patient. Finally, all the remaining patients were classified to be “Insulin + AD” patients. The following non-insulin AD agents were observed: MET, SU, DPP-4 inhibitors (DPP-4i), glinides, GLP-1 receptor agonists (GLP-1-RA), alpha-glucosidase inhibitors, thiazolidinediones, and sodium-glucose cotransporter-2 inhibitors (SGLT-2i).
Data on the insulin regimen and the prescribed concomitant ADs were additionally reported for the whole 12 months follow-up period since insulin initiation. In addition, based on the observed insulin prescriptions in the claims database, the patient-specific daily insulin dosage was calculated by excluding observed hospitalization days. For this purpose, the prescribed amount of a specific insulin prescription was evenly distributed over the period between two observed prescriptions. If a patient received more than one type of insulin, the insulin-specific calculated dosages were added in case of overlapping prescriptions. For the respective last prescriptions during the follow-up period, the same daily dosage as for the previous prescription interval was assumed, until the end of the observational period (end of 12 months or death, whatever came first). In cases of a DDD-based insulin supply gap of >15/30/90 days (sensitivity: 180 days), a patient was assumed to have interrupted the insulin therapy and was therefore excluded from insulin dosage calculations during the identified gap period. In scientific research on insulin usage, a wide range of definitions of supply gaps/grace periods has been used.19–23 Given the nature of insulin therapy and based on three recently conducted claims data analyses on insulin usage and associated persistence and adherence, we decided to use a supply gap of 30 days as base case scenario. To account for any uncertainty around this assumption, we ran scenario analyses based on 15 days and 90 days (additional sensitivity analysis: 180 days).
Validity check by comparing claims data with MCR data
The claims data analysis described earlier was conducted based on data from AOK PLUS, a regional sickness fund operating in two states of Germany (Saxony, Thuringia). To address the resulting potential regional bias, an additional Germany-wide MCR was performed as a validity check. The MCR was based on a nation-wide sample of diabetologists, internists, and general practitioners (GPs). At maximum, 30 patients could be included per study site to reduce the probability of cluster effects. Patients with an age of at least 18 years and a confirmed diagnosis of T2DM who initiated an insulin therapy between 01/01/2013 and 31/12/2015 were identified and included into the study by the participating physicians, with the vast majority of patients (90%) being included by diabetologists. Again, patients with a pregnancy during the observational period or 6 months before insulin initiation were excluded.
Physicians generated PatientLog lists containing all patients who met the general inclusion criteria; for these, information on concomitant AD medication at the start of insulin therapy was documented. Based on these lists, specific patients in the three subgroups “Insulin Mono”, “Insulin + MET”, and “Insulin + MET + AD” were randomly selected for a full MCR. We aimed for a balanced distribution among these subgroups by assigning up to 100 patients to each category. Enrollment of the first patient took place in December 2017. In September 2018, the last case report was filled in.
Statistical analysis and ethical approval
All reported variables were presented using descriptive statistics such as mean, median, ranges, and standard deviation. Comparisons of baseline characteristics among patient subgroups were conducted for continuous variables using unpaired (two sample) t-test or a suitable non-parametric test. For comparisons of categorical variables, either Chi-square tests or Fisher’s exact test were used. Statistical analyses were performed using STATA (Version 14.1) and MySQL (Version 8.0).
The study was coordinated and led by a Scientific Steering Committee to which all authors belonged. It was approved by the Ethics Committee of the Faculty of Medicine, University of Rostock and the Saxon State Ministry for Social Welfare and Consumer Protection in accordance to § 75 SGB X.
Results
Patient characteristics and baseline treatment
We identified 284,878 patients with confirmed T2DM in our claims database. Among these, 27,340 T2DM patients started an insulin therapy between 01/01/2013 and 31/12/2015. Thereof, 10,953 patients (40%) started insulin without any concomitant other ADs (“Insulin Mono”), 4070 patients (15%) started insulin with metformin (“Insulin + MET”), 6385 patients (23%) were prescribed with insulin plus MET and at least one further AD (“Insulin + MET + AD”) and 5932 patients (22%) received insulin together with at least one further AD excluding MET (“Insulin + AD”).
Table 1 presents baseline characteristics of the overall T2DM sample initiating insulin therapy as well as for the four patient subgroups regarding the initiated insulin regimen. Mean/median age of insulin starting T2DM patients was 72.2/75.0 years, 51.4% of the patients were female. Mean CCI was 5.2 and mean aDCSI in that population was 3.2. Patients in the “Insulin Mono” group and “Insulin + AD” groups were older and more comorbid than patients who started their insulin therapy with either MET only or MET plus at least one additional AD (Table 1).
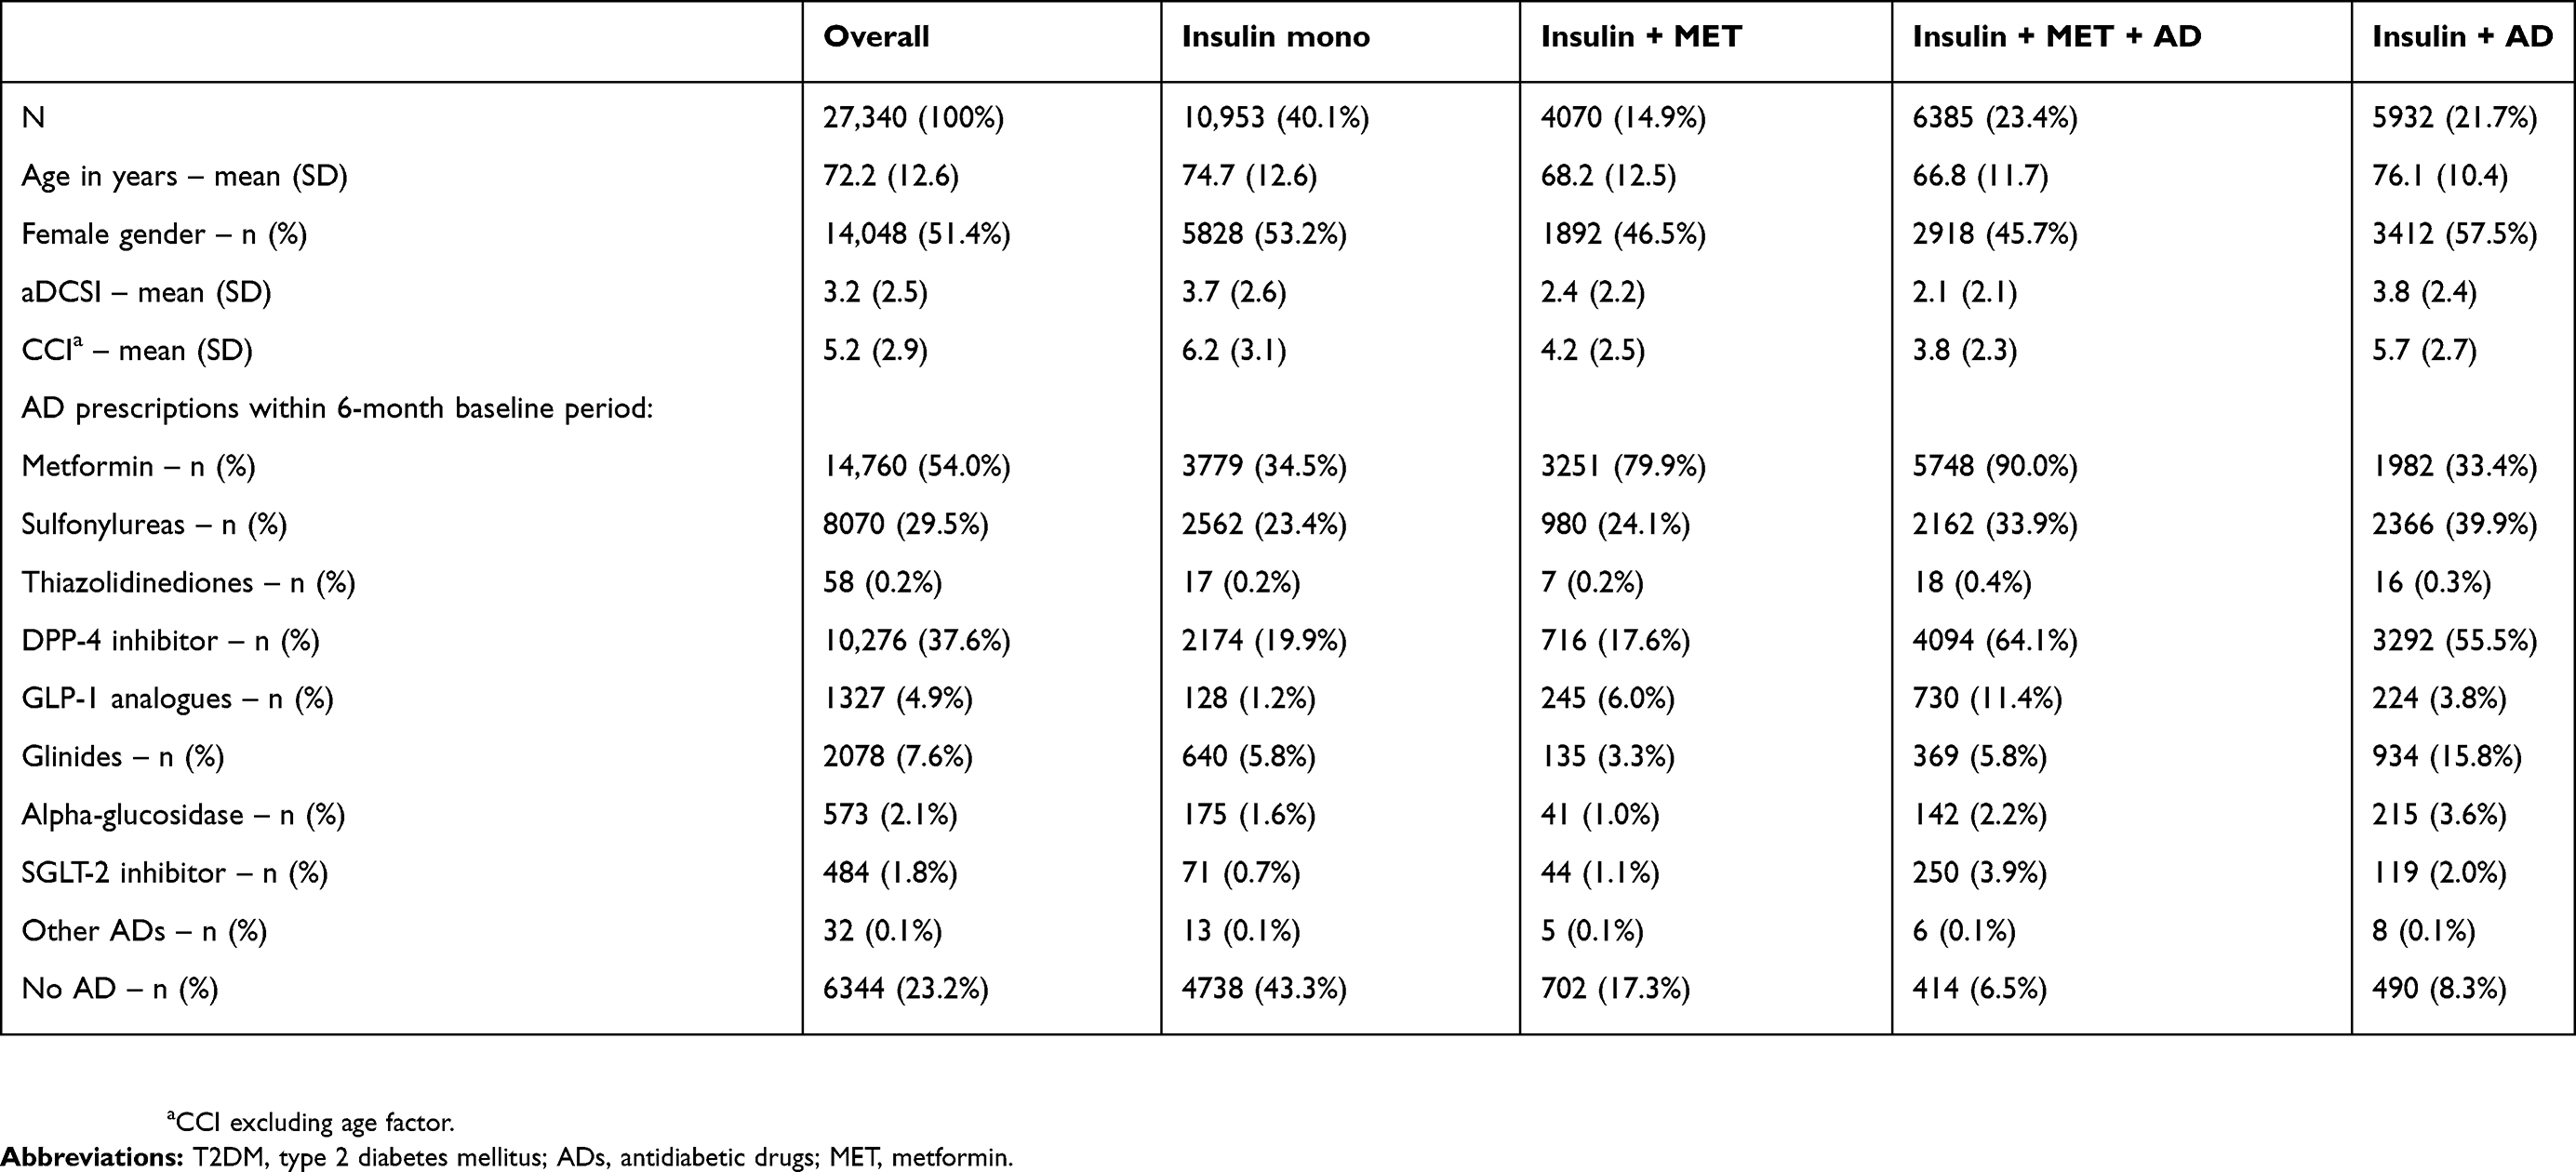 |
Table 1 Baseline characteristics of T2DM patients who started an insulin therapy |
The most commonly prescribed AD before insulin initiation was MET (54%), followed by 38% of the patients with at least one prescription of a DPP-4i, and 30% receiving at least one prescription of SU (Table 1). A total of 6344 (23%) T2DM insulin starters did not receive any AD treatment in the 6 months baseline period. Most of these previously untreated patients started with an insulin monotherapy. Out of the 10,953 “Insulin Mono” patients, 43% did not receive any AD in the 6 months before insulin initiation. Furthermore, patients starting an insulin therapy in combination with MET were more frequently previously treated with MET than the others (“Insulin Mono”: 35% and “Insulin + AD”: 33% vs “Insulin + MET”: 80% and “Insulin + MET + AD”: 90%).
Description of insulin treatment
As presented in Figure 1, the most frequently initiated insulin types in patients among all subgroups were long-acting insulins (“Insulin Mono”: 26%/“Insulin + MET”: 42%/“Insulin + MET + AD”: 72%/“Insulin + AD”: 62%) and fast-acting insulins (“Insulin Mono”: 28%/Insulin + MET: 20%/“Insulin + MET + AD”: 9%/“Insulin + AD”: 12%). Intermediary-acting insulins or combination regimens with long- and fast-acting insulins or premixed insulin compounds were less often prescribed at insulin initiation.
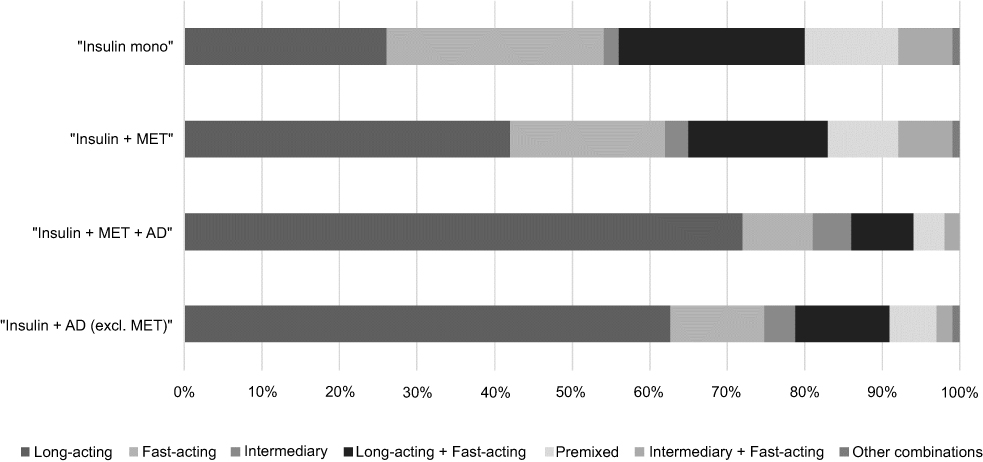 |
Figure 1 Distribution of initiated insulin types across subgroups. Notes: Distribution of initially prescribed types of insulin across subgroups of T2DM insulin-starting patients. This figure shows the percentage of patients receiving a specific type of insulin as identified by ATC codes in German claims data (Long-acting: A10AE-, Fast-acting: A10AB, Intermediary: A10AC, Premixed: A10AD) at time of initiating the insulin treatment, separately for each of the respective subgroups: “Insulin Mono”: Patients receiving insulin alone without any observed prescription of other ADs within 2 weeks after index; “Insulin+MET”: Patients receiving insulin plus MET within 2 weeks after index or with a sufficient stock of MET as observed within the 6 months pre-index period; “Insulin + MET + AD”: Patients receiving both – MET and at least one additional antidiabetic agent according to the definition above; “Insulin + AD”: Remaining patients receiving at least one AD, which cannot be MET.Abbreviations: T2DM, type 2 diabetes mellitus; AD, antidiabetic drug; MET, metformin. |
We observed a continuous increase in daily prescribed insulin dosage over the first 12 months (Figure 2); reported daily insulin dosage at the end of the 12 months follow-up period depended on the methodological assumptions. Based on the assumption that a patient continuously received an insulin therapy if she/he did not experience a supply gap of 15/30/90 days, the resulting insulin dosage after 360 days was 77.9/63.4/43.3 IUs/day (Figure 2; data for 180 days gap calculation in Figure S1). Figure 3 demonstrates differences in calculated insulin dosages across subgroups, based on a 30-day supply gap. Patients starting an insulin monotherapy demonstrated the highest dosage throughout the first year of insulin treatment (mean: 68.6 IU at day 360 after start of therapy; considering a 30 days gap | mean of 80.8/46.9 IU with 15/90 days gap; Figure 4), while patients receiving at least three AD agents including MET received substantially lower insulin dosages (mean: 57.9 IU [72.9/38.4 IU with 15/90 days gap] at day 360). Respectively, the estimated daily insulin dosage at day 360 after the start of therapy was on average 64.2 IU (76.3/45.3 IU with 15/90 days gap) for patients with “Insulin + MET” and 59.4 IU (78.5/41.7 IU with 15/90 days gap) for patients with “Insulin + AD”.
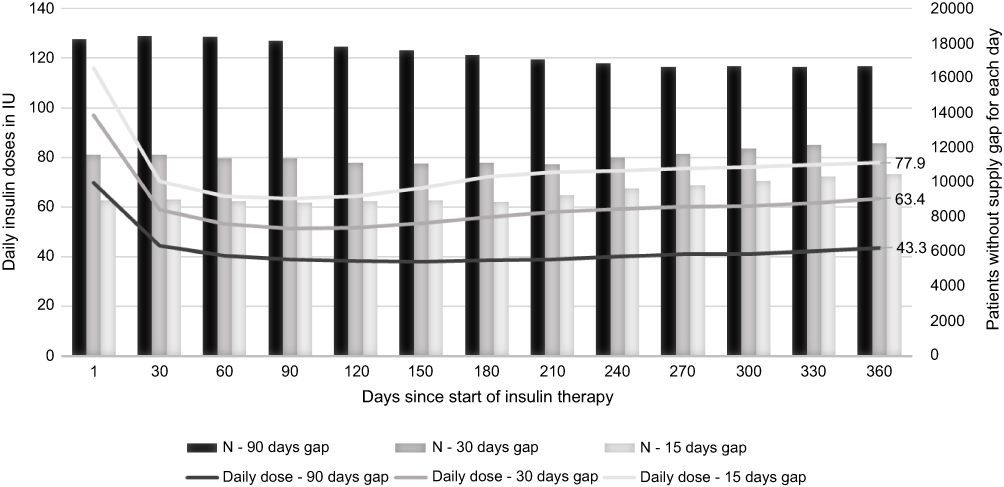 |
Figure 2 Estimated daily insulin dosage in 1st year of treatment considering different supply gaps (90/30/15 days). Notes: The figure shows the estimated daily insulin dosage on a patient-level, based on time intervals between two observed insulin prescriptions of the same type within the first year of insulin treatment. Dosage is expressed in international units (IU) for three calculations performed under different assumptions for insulin supply gaps. A supply gap was defined as number of days between two prescription days, subtracted by the prescribed daily defined dose (DDD) of the first prescription and days in hospital (assuming complete supply of insulin during hospitalization). If a patient experienced a supply gap of 90/30/15 days, he/she was excluded from the estimation due to an assumed interruption of insulin therapy.Abbreviation: N, patient number. |
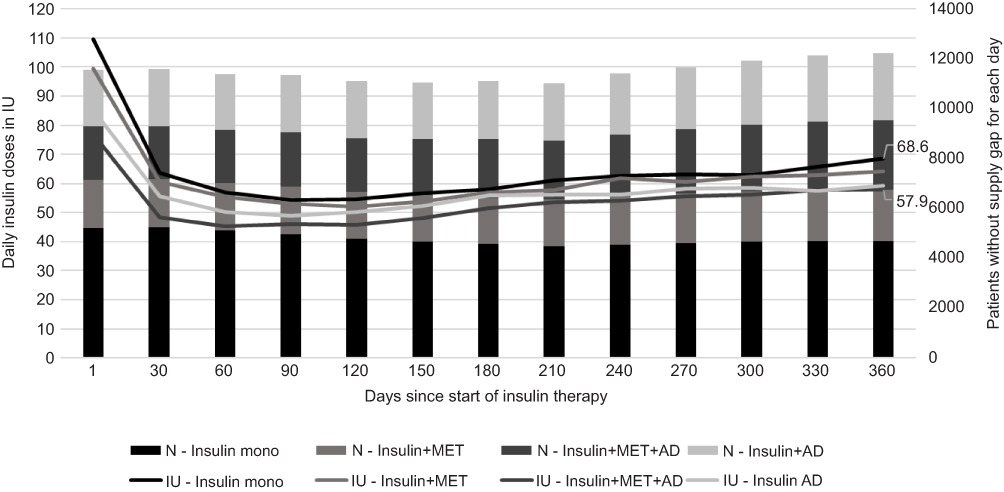 |
Figure 3 Estimated daily insulin dosage across subgroups – 30-day supply gap. Notes: Estimated daily insulin doses compared across subgroups. The figure is showing dose estimates for the respective subgroups assuming an insulin supply gap of at minimum 30 days. A patient is excluded from these estimates if he/she exceeds a supply gap of 30 days.Abbreviations: AD, antidiabetic drug; IU, insulin units; MET, metformin; N, patient number. |
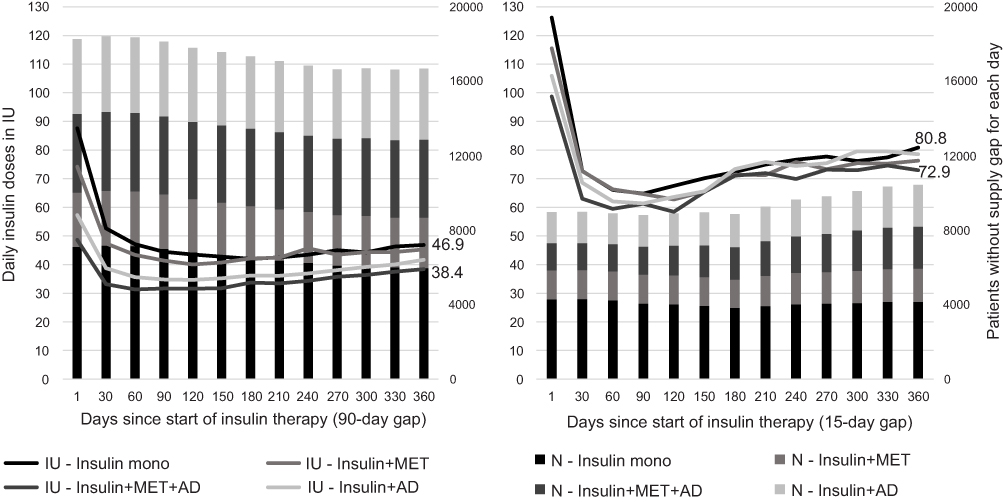 |
Figure 4 Estimated daily insulin dosage across subgroups – 90/15-day supply gap. Notes: Estimated daily insulin doses compared across subgroups. The figure is showing dose estimates for the respective subgroups assuming different insulin supply gaps of at minimum 90/15 days. A patient is excluded from these estimates if he/she exceeds a supply gap of 90 (respectively 15) days.Abbreviations: AD, antidiabetic drug; IU, insulin units; MET, metformin; N, patient number. |
Clinical characteristics of patients
For 7475 (27%) of above 27,340 observed patients, valid DMP data were available (Table 2). Mean age of these patients was 69.5 (SD: 11.8) years, which was slightly younger than the overall sample, while the share of observed female patients (49.9%) was similar. Furthermore, substantially less patients starting an insulin monotherapy (2077 patients, ie, 27.8%) were identified in this subsample. The observed mean/median HbA1c at baseline was 8.5/8.2%. Mean/median weight of patients at baseline was 87.4/86.0 kg (BMI: 31.1/30.4 kg/m2). This was 9.5 kg heavier than the average citizen in Germany as reported by the Federal Statistical Office (Destatis). Patients starting insulin treatment without further AD are characterized by lower weight at index (83.4 kg/BMI: 29.8 kg/m2). HbA1c values at baseline did not show significant discrepancies among the subgroups, only patients using insulin with MET initially exhibited a slightly increased HbA1C value (8.9%) in comparison to the other groups.
 |
Table 2 Clinical characteristics of T2DM insulin starters |
Validity check by comparing claims data with MCR data
The additionally conducted Germany-wide retrospective chart review was based on 31 study centers (23 diabetologists, 8 internal medicine specialists/GPs). Based on PatientLog lists of all T2DM patients who started an insulin therapy in 2015, 824 T2DM insulin starters could be identified (417 [51%] from Saxony/Thuringia, 407 [49%] from other GER regions). A total of 671 of these patients (81.4%; other GER regions: 83.0%) could be assigned to one of the predefined subgroups: “Insulin Mono” 193 patients (23.4%; other GER regions: 29.0%), “Insulin + MET” 202 patients (24.5%; other GER regions: 21.4%), and “Insulin + MET + AD” 276 patients (33.5%; other GER regions: 32.7%). Thus, percentage of patients with an incident insulin monotherapy was slightly lower in this MCR sample in comparison to claims data, but even higher in the non-Saxony/Thuringia regions (Table S3). This confirms the results of above claims data analyses.
Discussion
As there is a general lack of data around T2DM patients newly initiating an insulin therapy, it was the main objective of this study to collect these data. The main strength of this analysis is the use of a large claims dataset unaffected by any selection bias and an additional collection of MCR data for reasons of a validity check of claims data analysis results, as the claims data specifically addressed two German states (Saxony/Thuringia). The results of the MCR confirmed the findings of the claims data analysis, so that this study is not substantially affected by any regional bias.
Both German and international guidelines recommend MET as standard baseline therapy in case lifestyle modifications are not sufficient to control blood glucose levels.13,24 To the knowledge of the authors, no guideline recommends initiation of an insulin monotherapy in T2DM patients without any previous non-insulin AD treatment. Nevertheless, our data do not only show that a high percentage of up to 40% of the patients receive an incident insulin monotherapy, but 43% of these patients were previously untreated with other ADs. We conclude that this treatment pattern is in most cases not in line with current treatment guidelines. Obviously, there is an undertreatment of T2DM patients with non-insulin ADs including newer agents. Interestingly, even though a substantial percentage of patients can be classified as overweight, newer agents such as DPP-4i, SGLT-2i or GLP-1-RA agents are not widely used in our observed patient population. Therefore, we hypothesize that a substantial percentage of our observed insulin starters should not yet get an insulin therapy and/or should get a concomitant AD treatment. A retrospective cohort study based on primary data coming from the UK identified a similar amount of T2DM patients starting with an insulin monotherapy (54% “Insulin Mono” vs 46% “Insulin + MET”) when initiating insulin usage.25 We recommend further investigating this treatment pattern, especially if patients started an insulin monotherapy without having previously received other ADs.
In our patient population, we observed an insulin dosage of 43.3–77.9 IUs per day after 12 months of treatment with insulin. Throughout the first year of treatment, an increasing trend in insulin dosages was identified in our dataset. It should be mentioned that claims data estimates are sensitive to underlying assumptions for potential supply gaps between prescription dates for insulin packages. Here, the assumption when a patient can be considered as continuously treated with insulin influences the analysis results mainly. We consider 15/30/90 days as most valid assumptions in this respect and used a 30 days gap as our base case. Results for a 180 days gap assumption are reported as sensitivity analysis in addition. Our insulin dosage findings generally show higher insulin dosages than in previous clinical trials (UKPDS, Kumamoto study, ORIGIN study).26–28 Obviously, insulin dosages are higher in clinical practice compared to clinical trials. This is in line with other observational studies for developed countries.29 Apart from methodological limitations around the calculation of used insulin dosages, our comparatively high insulin dosages might be explained by two additional facts. First, T2DM insulin starters weigh more than the average population, with about 10 kg above the usual assumptions used by German authorities. Second, a substantial percentage of patients starts an insulin monotherapy, which is itself associated with higher insulin dosages that other treatment regimens such as “Insulin + MET” or “Insulin + MET + AD”.
Limitations
We acknowledge some limitations. Our conclusions are mainly based on German claims data. Their main strength, access to a large unselected patient sample, is associated with the main weakness that some disease/patient specifics such as duration since first T2DM diagnosis are not available. Especially around the calculation of prescribed/used insulin dosages, we needed to work with assumptions as outlined in this manuscript. Reporting of clinical characteristics was based on a subsample of DMP patients, which differed from all insulin starters in type of initiated insulin treatment. DMP patients were slightly younger (on average about 3 years) and the share of patients starting an insulin monotherapy was substantially smaller compared to the overall sample (27.8% versus 40.0%).
Moreover, we observed some differences between claims and MCR data. In the regions of Saxony/Thuringia, we identified 40.0% of the patients starting an insulin monotherapy in the claims data, whereas this percentage was 23.4% for MCR patients in Saxony/Thuringia. As we identified a higher percentage of insulin monotherapy patients in the MCR sample for the remaining German regions (29.0%), we conclude that the percentage of insulin monotherapy starters is at least 40% in other German regions and that MCRs focusing on diabetologists as treatment sites underestimate this percentage.
Conclusions
German T2DM patients who start their insulin therapy are heavier in weight than currently assumed and, consequently, receive comparatively high and increasing insulin dosages after the start of such a therapy. Up to 40% of the T2DM patients start their insulin therapy as insulin monotherapy. Among them, more than 40%, ie, more than 16% of all insulin starters, do not receive any AD in the 6 months before insulin initiation, meaning that insulin seems to be the first AD treatment in these patients. Further studies need to look at this patient population in more detail in order to understand the reasons for this treatment pattern and, potentially, to increase the percentage of T2DM patients treated according to guidelines.
Abbreviation list
AD, antidiabetic drug; aDCSI, adapted diabetes complications severity index; BMI, body mass index; CCI, Charlson comorbidity index; DDD, defined daily dose; DDP-4i, dipeptidyl peptidase inhibitor; DIMDI, German institute of medical documentation and information; DMP, disease management program; GLP-1-RA, Glucagon-like peptide receptor antagonist; GP, general practitioners; IDF, international diabetes federation; IU, international unit; MCR, medical chart review; MET, metformin; SD, standard deviation; SGLT-2i, sodium–glucose cotransporter 2 inhibitors; SU, sulfonylureas; T1DM, type-1 diabetes mellitus; T2DM, type-2 diabetes mellitus.
Ethical approval
The study was approved by the Ethics Committee of the Faculty of Medicine, University of Rostock and the Saxon State Ministry for Social Welfare and Consumer Protection in accordance to § 75 SGB X.
Informed consent
Informed consent was obtained from all individual participants included in the study.
Acknowledgments
The study was funded by Boehringer Ingelheim Pharma GmbH & Co. KG, Ingelheim, Germany.
Disclosure
Thomas Wilke participated in this study as a staff member of IPAM and received honoraria from several pharmaceutical/consultancy companies (Novo Nordisk, Abbvie, Merck, GSK, BMS, LEO Pharma, Astra Zeneca, Bayer, Boehringer Ingelheim, Pharmerit). Maximilian Gabler, Silke Geier, and Johannes Foersch are employed at Boehringer Ingelheim Pharma GmbH & Co. KG. Sabrina Mueller and Nils Picker participated in this study as staff members of Ingress-Health; the work of Ingress-Health in this study was financed by Boehringer Ingelheim. Jens Aberle, Stephan Martin, and Matthias Riedl participated as clinical advisors in the steering committee of this study and received honoraria and reimbursement of travel costs from Boehringer Ingelheim. Furthermore, Stephan Martin received external funding for research projects from Boehringer Ingelheim. He also reports personal fees from Boehringer Ingelheim, during the conduct of the study. He received grants, personal fees from Almased, Deutsches Institut für Telemedizin und Gesundheitsförderung, and Astra Zeneca, outside the submitted work. Jens Aberle reports grants, personal fees from Lilly, Novo Nordisk, Boehringer Ingelheim, during the conduct of the study. He also reports personal fees from Novo Nordisk, Lilly, and Boehringer Ingelheim, outside the submitted work. The authors report no other conflicts of interest in this work.
References
1. Robert Koch Institute. Gesundheitsberichterstattung des Bundes, Gesundheit in Deutschland Aktuell (GEDA): Daten Und Fakten: Ergebnisse Der Studie “Gesundheit in Deutschland Aktuell 2009”. Berlin; 2011.
2. Young BA, Lin E, Korff M, et al. Diabetes complications severity index and risk of mortality, hospitalization, and healthcare utilization. Am J Manag Care. 2008;14(1):15–23.
3. Wilke T, Groth A, Fuchs A, et al. Real life treatment of diabetes mellitus type 2 patients: an analysis based on a large sample of 394,828 German patients. Diabetes Res Clin Pract. 2014;106(2):275–285. doi:10.1016/j.diabres.2014.08.002
4. Norgaard ML, Andersen SS, Schramm TK, et al. Changes in short- and long-term cardiovascular risk of incident diabetes and incident myocardial infarction–a nationwide study. Diabetologia. 2010;53(8):1612–1619. doi:10.1007/s00125-010-1783-z
5. Liebl A, Neiss A, Spannheimer A, Reitberger U, Wagner T, Görtz A. Kosten des Typ-2-Diabetes in Deutschland. Ergebnisse der CODE-2-Studie. Dtsch Med Wochenschr. 2001;126(20):585–589. doi:10.1055/s-2001-14102
6. International Diabetes Federation. IDF Diabetes Atlas.
7. Chang H-Y, Weiner JP, Richards TM, Bleich SN, Segal JB. Validating the adapted Diabetes Complications Severity Index in claims data. Am J Manag Care. 2012;18(11):721–726.
8. Wilke T, Ahrendt P, Schwartz D, Linder R, Ahrens S, Verheyen F. Inzidenz und Prävalenz von Diabetes mellitus Typ 2 in Deutschland. Dtsch Med Wochenschr. 2013;138(3):69–75. doi:10.1055/s-0032-1327394
9. Schipf S, Werner A, Tamayo T, et al. Regional differences in the prevalence of known Type 2 diabetes mellitus in 45–74 years old individuals: results from six population-based studies in Germany (DIAB-CORE Consortium). Diabetic Med. 2012;29(7):e88–e95. doi:10.1111/j.1464-5491.2012.03578.x
10. Guariguata L, Whiting DR, Hambleton I, Beagley J, Linnenkamp U, Shaw JE. Global estimates of diabetes prevalence for 2013 and projections for 2035. Diabetes Res Clin Pract. 2014;103(2):137–149. doi:10.1016/j.diabres.2013.11.002
11. Pfeiffer AFH, Klein HH. The treatment of type 2 diabetes. Dtsch Arztebl Int. 2014;111(5):
12. Wilke T, Mueller S, Groth A, et al. Treatment-dependent and treatment-independent risk factors associated with the risk of diabetes-related events: a retrospective analysis based on 229,042 patients with type 2 diabetes mellitus. Cardiovasc Diabetol. 2015;14:14. doi:10.1186/s12933-015-0179-2
13. Bundesärztekammer KV. Arbeitsgemeinschaft der Wissenschaftlichen Medizinischen Fachgesellschaften. In: Nationale VersorgungsLeitlinie: Therapie Des Typ-2-Diabetes,
14. International Diabetes Federation Guideline Development Group. Global guideline for type 2 diabetes. Diabetes Res Clin Pract. 2014;104(1):1–52. doi:10.1016/j.diabres.2012.10.001
15. McCarthy M. American Diabetes Association issues new guidelines for type 1 diabetes. BMJ. 2014;348:g4119. doi:10.1136/bmj.g4119
16. WIdO/DIMDI. Amtlicher ATC-Index mit DDD-Angaben für Deutschland im Jahr 2019. 2019. Available from: https://www.dimdi.de/dynamic/.downloads/arzneimittel/atcddd/atc-ddd-amtlich-2019.pdf.
17. Charlson M, Szatrowski TP, Peterson J, Gold J. Validation of a combined comorbidity index. J Clin Epidemiol. 1994;47(11):1245–1251. doi:10.1016/0895-4356(94)90129-5
18. Sundararajan V, Henderson T, Perry C, Muggivan A, Quan H, Ghali WA. New ICD-10 version of the Charlson comorbidity index predicted in-hospital mortality. J Clin Epidemiol. 2004;57(12):1288–1294. doi:10.1016/j.jclinepi.2004.03.012
19. Slabaugh SL, Bouchard JR, Li Y, Baltz JC, Meah YA, Moretz DC. Characteristics relating to adherence and persistence to basal insulin regimens among elderly insulin-naïve patients with Type 2 diabetes: pre-filled pens versus vials/syringes. Adv Ther. 2015;32(12):1206–1221. doi:10.1007/s12325-015-0266-5
20. Perez-Nieves M, Kabul S, Desai U, et al. Basal insulin persistence, associated factors, and outcomes after treatment initiation among people with type 2 diabetes mellitus in the US. Curr Med Res Opin. 2016;32(4):669–680. doi:10.1185/03007995.2015.1135789
21. Hadjiyianni I, Desai U, Suzuki S, et al. Basal insulin persistence, associated factors, and outcomes after treatment initiation: a retrospective database study among people with Type 2 diabetes mellitus in Japan. Diabetes Ther. 2017;8(1):149–166. doi:10.1007/s13300-016-0215-6
22. Nishimura R, Kato H, Kisanuki K, et al. Treatment patterns, persistence and adherence rates in patients with type 2 diabetes mellitus in Japan: a claims-based cohort study. BMJ Open. 2019;9(3):e025806. doi:10.1136/bmjopen-2018-025806
23. Jermendy G, Kiss Z, Rokszin G, Abonyi-Tóth Z, Wittmann I, Kempler P. Persistence to treatment with novel antidiabetic drugs (Dipeptidyl Peptidase-4 Inhibitors, Sodium-Glucose Co-Transporter-2 Inhibitors, and Glucagon-Like Peptide-1 Receptor Agonists) in people with type 2 diabetes: a nationwide cohort study. Diabetes Ther. 2018;9(5):2133–2141. doi:10.1007/s13300-018-0483-4
24. Ryden L, Grant PJ, Anker SD, et al. ESC Guidelines on diabetes, pre-diabetes, and cardiovascular diseases developed in collaboration with the EASD. Eur Heart J. 2014;35(27):1824. doi:10.1093/eurheartj/ehu076
25. Holden SE, Jenkins-Jones S, Currie CJ. Association between insulin monotherapy versus insulin plus metformin and the risk of all-cause mortality and other serious outcomes: a retrospective cohort study. PLoS One. 2016;11(5):e0153594. doi:10.1371/journal.pone.0153594
26. King P, Peacock I, Donnelly R. The UK Prospective Diabetes Study (UKPDS): clinical and therapeutic implications for type 2 diabetes. Br J Clin Pharmacol. 1999;48(5):643–648. doi:10.1046/j.1365-2125.1999.00092.x
27. Shichiri M, Kishikawa H, Ohkubo Y, Wake N. Long-term results of the Kumamoto Study on optimal diabetes control in type 2 diabetic patients. Diabetes Care. 2000;23(Suppl 2):B21–B29.
28. Gerstein HC, Bosch J, Dagenais GR, et al. Basal insulin and cardiovascular and other outcomes in dysglycemia. N Engl J Med. 2012;367(4):319–328. doi:10.1056/NEJMoa1203858
29. Ray KK, Kendall DM, Zhao Z, et al. A multinational observational study assessing insulin use: understanding the determinants associated with progression of therapy. Diabetes Obes Metab. 2018. doi:10.1111/dom.13622
Supplementary materials
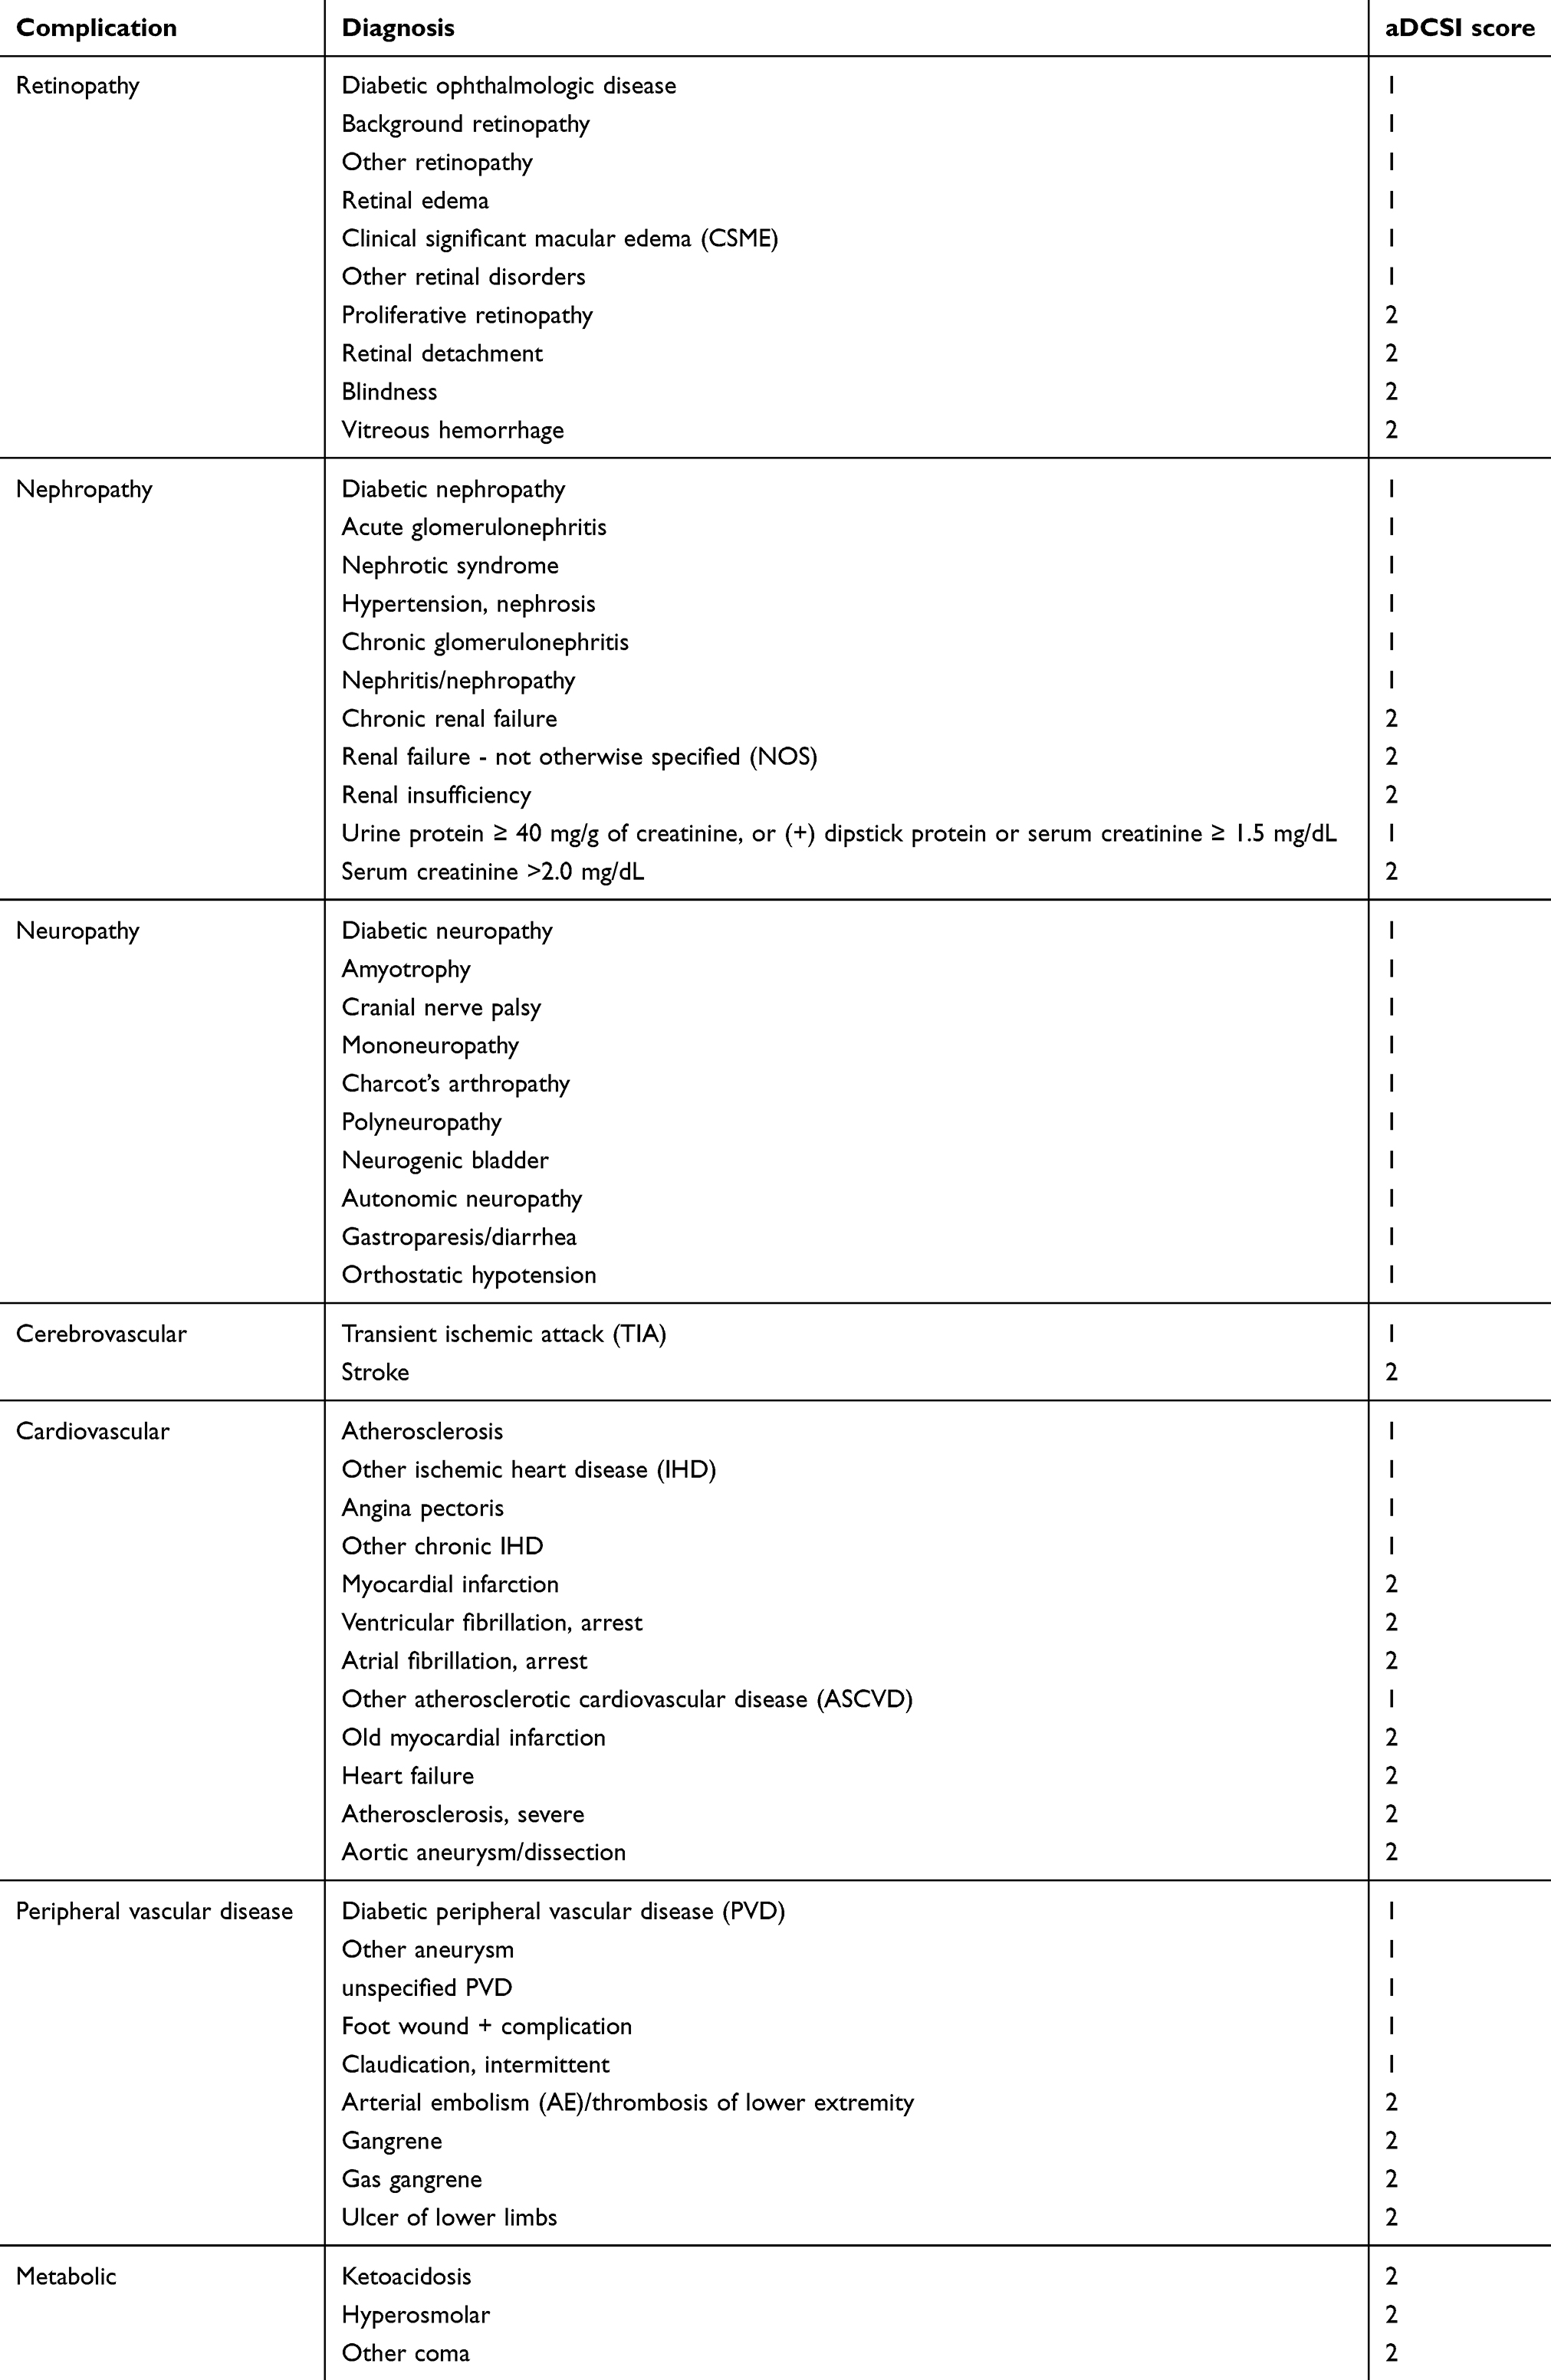 |
Table S1 Adapted Diabetes Complications Severity Index (aDCSI) |
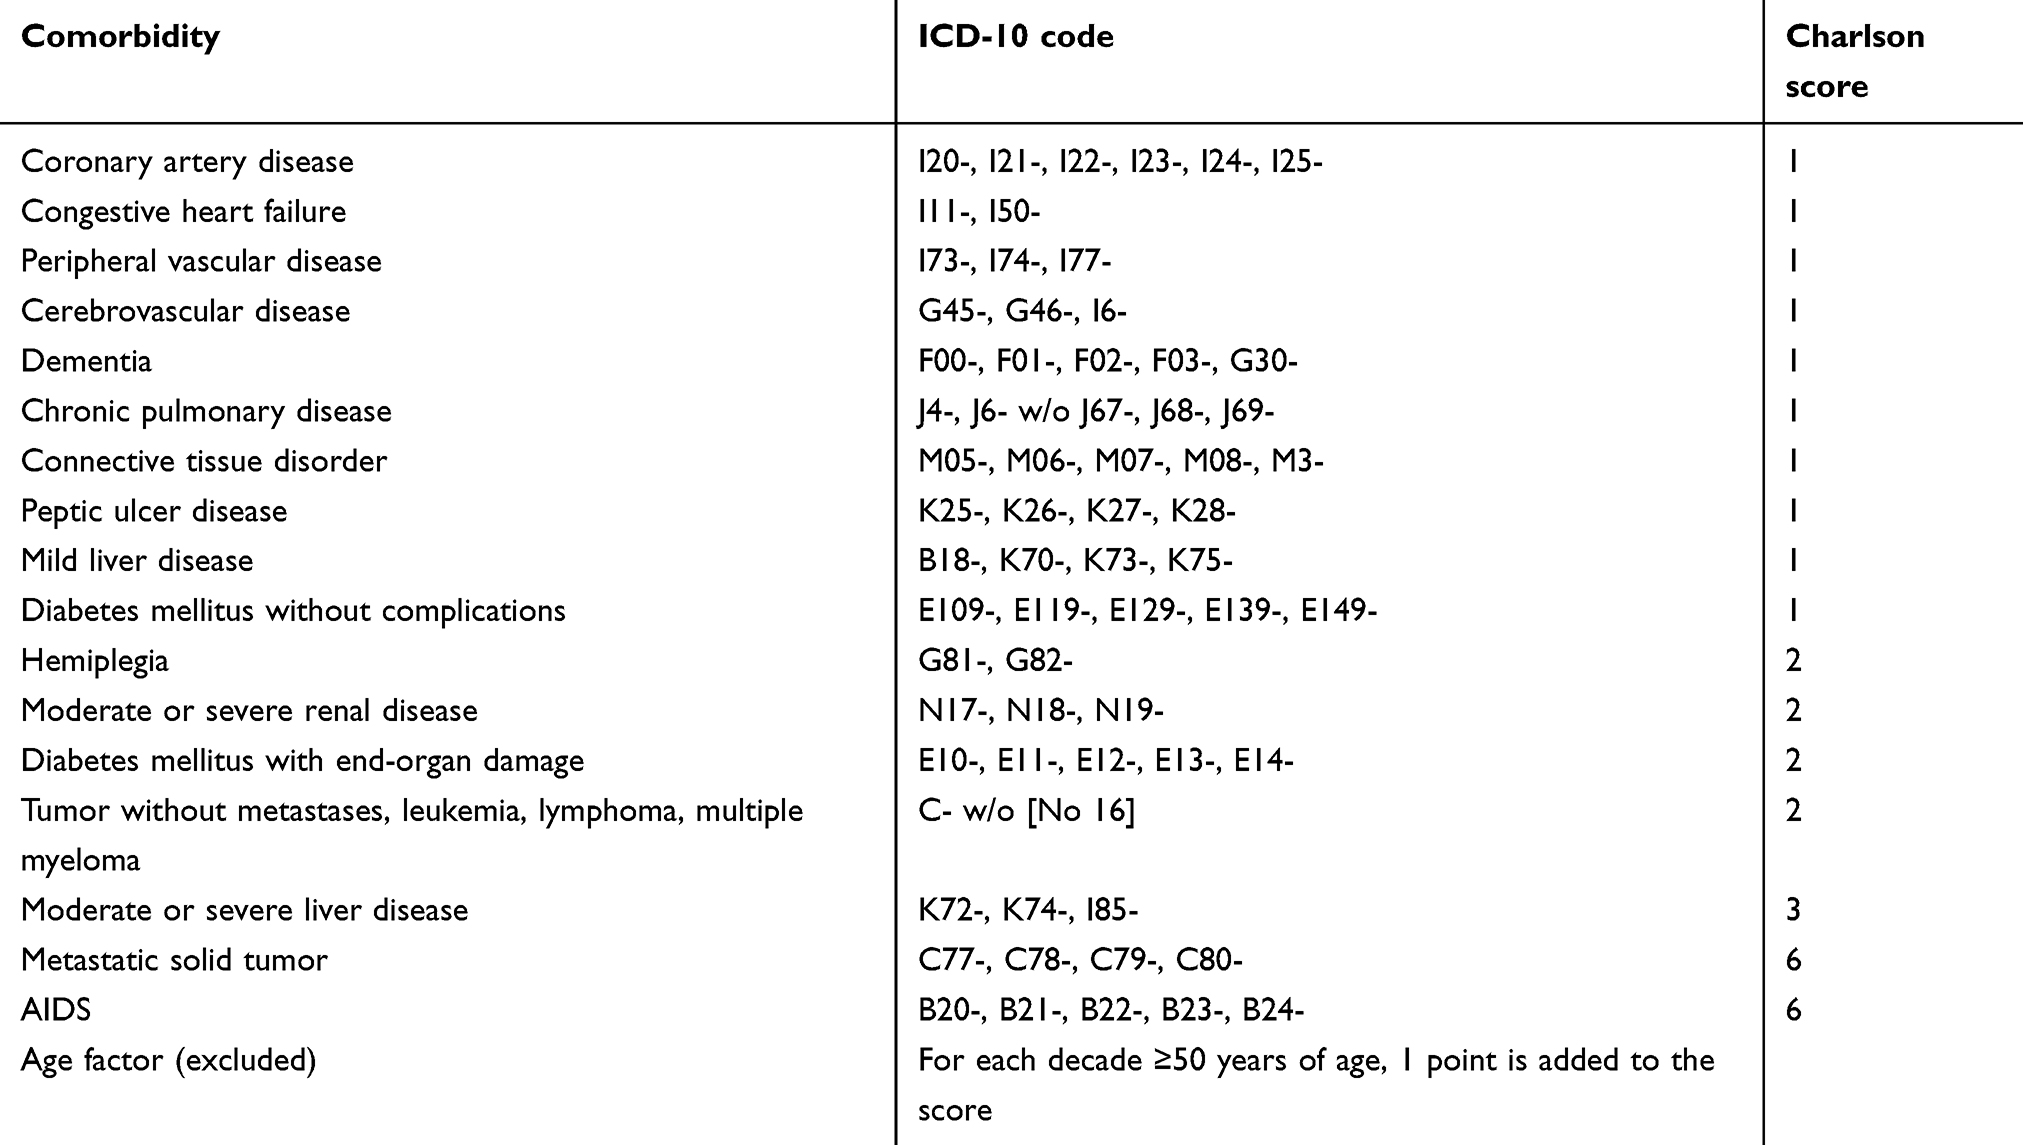 |
Table S2 Charlson-Comorbidity-Score (CCI) and components |
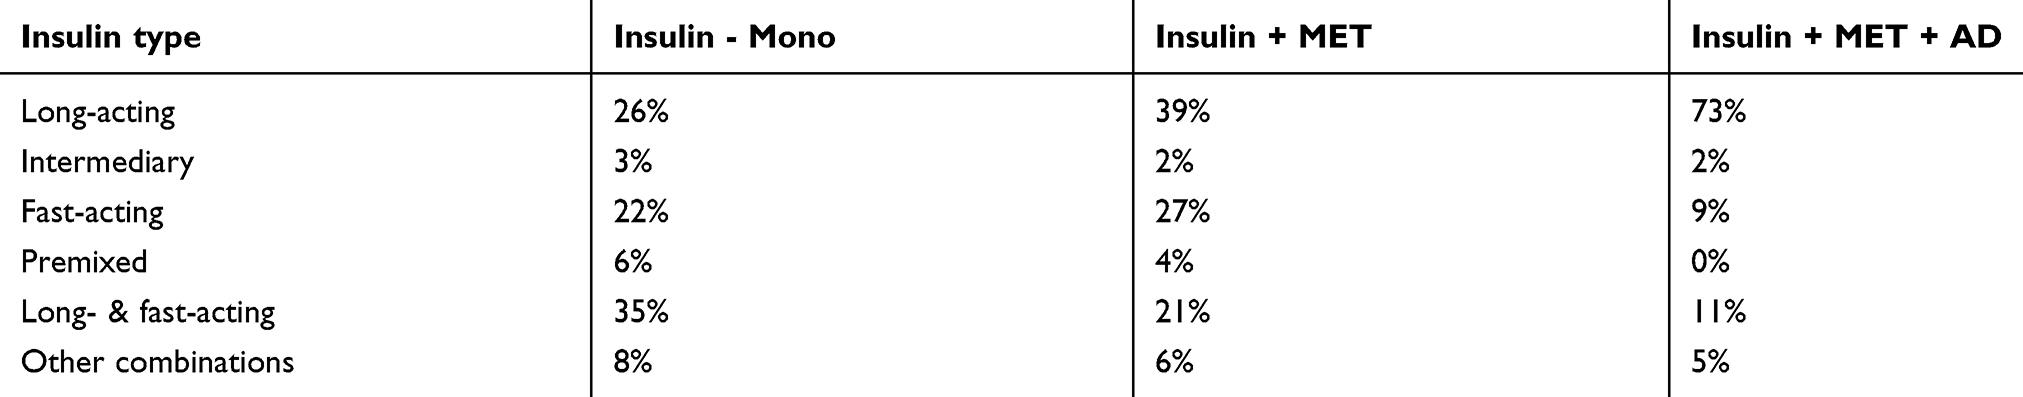 |
Table S3 Initiated insulin regimen according to medical chart review |
 |
Figure S1 Insulin dosage – sensitivity analysis with 180-day supply gap. Notes: Estimated daily insulin doses compared across subgroups. The figure is showing dose estimates for the respective subgroups assuming an extended insulin supply gaps of at minimum 180 days. A patient is excluded from these estimates if he/she exceeds a supply gap of 180 days.Abbreviations: AD, antidiabetic drug; IU, insulin units; MET, metformin; N, patient number. |
 © 2019 The Author(s). This work is published and licensed by Dove Medical Press Limited. The full terms of this license are available at https://www.dovepress.com/terms.php and incorporate the Creative Commons Attribution - Non Commercial (unported, v3.0) License.
By accessing the work you hereby accept the Terms. Non-commercial uses of the work are permitted without any further permission from Dove Medical Press Limited, provided the work is properly attributed. For permission for commercial use of this work, please see paragraphs 4.2 and 5 of our Terms.
© 2019 The Author(s). This work is published and licensed by Dove Medical Press Limited. The full terms of this license are available at https://www.dovepress.com/terms.php and incorporate the Creative Commons Attribution - Non Commercial (unported, v3.0) License.
By accessing the work you hereby accept the Terms. Non-commercial uses of the work are permitted without any further permission from Dove Medical Press Limited, provided the work is properly attributed. For permission for commercial use of this work, please see paragraphs 4.2 and 5 of our Terms.