")
Back to Journals » Cancer Management and Research » Volume 11
Real-world cost-effectiveness of targeted therapy in metastatic renal cell carcinoma in Sweden: a population-based retrospective analysis
Authors Redig J , Dalén J, Harmenberg U, Lindskog M, Ljungberg B, Lundstam S, Sandin R, Wahlgren T , Åkerborg Ö, Jakobsson M
Received 26 September 2018
Accepted for publication 31 December 2018
Published 8 February 2019 Volume 2019:11 Pages 1289—1297
DOI https://doi.org/10.2147/CMAR.S188849
Checked for plagiarism Yes
Review by Single anonymous peer review
Peer reviewer comments 2
Editor who approved publication: Dr Antonella D'Anneo
Josefine Redig,1 Johan Dalén,1 Ulrika Harmenberg,2 Magnus Lindskog,3 Börje Ljungberg,4 Sven Lundstam,5 Rickard Sandin,6 Thomas Wahlgren,6 Örjan Åkerborg,1 Maria Jakobsson6
1ICON, Stockholm, Sweden; 2Department of Oncology-Pathology, Karolinska Institute, Stockholm, Sweden; 3Department of Immunology, Genetics and Pathology, Uppsala University, Uppsala, Sweden; 4Department of Surgical and Perioperative Sciences, Urology and Andrology, Umeå University, Umeå, Sweden; 5Department of Urology, Sahlgrenska University Hospital, Gothenburg, Sweden; 6Pfizer AB, Sollentuna, Sweden
Objective: To explore cost-effectiveness of targeted therapies (TTs) in the treatment of metastatic renal cell carcinoma (mRCC) in a real-world context using a nationwide population-based approach.
Methods: Data on patients diagnosed with mRCC between 2002 and 2012 were extracted from Swedish national health data registers. To facilitate comparisons of patients diagnosed before and after TT introduction to the market, three cohorts were derived: pre-TT introduction (preTT), patients diagnosed 2002–2005; early TT introduction (TTi), patients diagnosed 2006–2008; and late TT introduction (TTii), which was limited to patients diagnosed 2009–2010 to ensure availability of total health care resource utilization (HCRU) data. Patients were followed until end of 2012. The value of TTs across cohorts was estimated using mean HCRU costs per life-year (LY) gained. Data on HCRU were obtained through national health registers for dispensed medication and inpatient and outpatient care, and the associated costs were estimated using the Lin method to account for censoring. LYs gained were defined as the difference in mean survival over the study period.
Results: The preTT, TTi, and TTii cohorts consisted of 1,366, 1,158, and 806 patients, respectively. Mean survival in years from mRCC diagnosis was 1.45 in the preTT cohort, 1.62 in the TTi cohort, and 1.83 in the TTii cohort. The respective mean total HCRU cost per patient over the study period was US$16,894, US$29,922, and US$30,037. The cost per LY gained per cohort was US$78,656 for TTi vs preTT, US$34,132 for TTii vs preTT, and US$523 for TTii vs TTi.
Conclusion: Given common willingness-to-pay per LY gained thresholds, this study in a real-world population suggests the use of TTs in the Swedish mRCC population is increasingly cost-effective over time.
Keywords: metastatic renal cell carcinoma, targeted therapy, cost-effectiveness, Sweden
Introduction
Renal cell carcinoma (RCC) accounts for ~2% of all cancers and results in ~102,000 deaths worldwide.1 In Sweden 1,100 new cases of RCC were reported annually between 2010 and 2014, and the disease is estimated to cause ~500 deaths per year. The age-adjusted incidence rate per 100,000 individuals has increased during the past 10 years; however, the age-adjusted death rate has decreased during the same period.2
Many patients with RCC present with advanced or unresectable disease, and up to 20% of patients treated by nephrectomy for localized disease will eventually relapse.3 Due to lack of effectiveness, traditional chemotherapeutic agents are not used in the treatment of metastatic renal cell carcinoma (mRCC). Radiation therapy is mainly indicated as palliative care in patients with bone or brain metastases or, less often, delivered as high-dose stereotactic radiotherapy to achieve disease control in patients with limited spread of disease. In 1994, the first immunomodulatory agent for the treatment of mRCC, IFN-α, was approved by the Swedish Medical Products Agency. Although remission rates of above 20% were achieved in some cases, the resulting survival benefit with IFN-α therapy was modest compared with patients who received placebo.4
Since the first targeted therapies (TTs) were approved in 2005, the prognosis for patients with mRCC has improved.5–7 In clinical trials, TTs have mainly shown improvement in progression-free survival. In 2014, approved TTs for the treatment of mRCC in Sweden included sunitinib, sorafenib, temsirolimus, bevacizumab plus IFN-α, everolimus, pazopanib, and axitinib.8 As most of these agents are administered orally, the burden of administration and the associated costs of treatment have decreased, while drug costs have increased.9–12
The cost-effectiveness of TTs in the mRCC setting has been evaluated using clinical trial data.13,14 A number of studies have confirmed the survival benefits of TTs in patients with mRCC in clinical practice15–23 and one study estimated the cost impact of TTs in a national cohort of patients with mRCC;11 however, to the best of our knowledge, no studies have estimated the cost-effectiveness of TTs using real-world data. Given the limited trial data evidence of overall survival gains and uncertain external validity of randomized clinical trials, real-world cost-effectiveness analyses may provide important information for clinicians and payers on the value of TTs in the treatment of patients with mRCC and, in turn, facilitate improved decision-making and resource allocation. Therefore, the objective of this study was to explore cost-effectiveness of TTs in the treatment of patients with mRCC by estimating and comparing survival and health care resource utilization (HCRU) costs in relation to the introduction of TTs in Sweden using real-world data from population-based registers. Overall survival and factors influencing overall survival in this population have previously been published by Lindskog et al.22
Materials and methods
Data sources
This study retrospectively analyzed patient-level data stored and maintained by the Swedish National Board of Health and Welfare. Data were extracted from three registers: the Swedish Cancer Registry (SCR), the Swedish Prescribed Drug Registry (PDR), and the National Patient Registry (NPR). Data were linked and anonymized prior to extraction, and ethical approval was granted by the Regional Ethical Review Board (2013/1551-31/4) in Stockholm.
The SCR was used to identify patients and to estimate survival. The register contains information on all patients diagnosed with cancer since 1958. Information on dispensed drugs, including dates, amounts, and costs was collected from the PDR, which covers all prescriptions dispensed in Swedish pharmacies after July 2005. Information on inpatient and outpatient care was retrieved from the NPR, which contains information on inpatient care with complete national coverage since 1987 and specialist outpatient care since 2001, albeit with regional variations in the quality.
The Swedish national health data registers have been extensively used in population-based health care research. Overall, the completeness and quality of the data are high, as described in detail elsewhere.24–26
Study design and patient population
This study was designed to compare patient populations treated for mRCC before and after the introduction of TTs. The study sample and predefined algorithm identifying patients have been described in detail elsewhere.21,22 An overview of the study design is presented in Figure 1. The final study sample was derived from patients with a registered diagnosis of RCC, according to ICD-10 codes C64.0 and C64.9, from the start of the registry through 2012. In order to exclude patients with Wilms tumors, patients younger than 16 years of age at RCC diagnosis were excluded. The algorithm identified patients with mRCC using the following criteria: 1) evidence of metastatic disease at diagnosis (M1 disease); 2) evidence of secondary (malignant) tumors; or 3) had visited an oncology clinic. The date of mRCC diagnosis was defined as the earliest of the three qualifying events. The algorithm could be applied from 2002. After identifying patients in the SCR, patient-level data were linked with data from the NPR and PDR to obtain information on resource utilization.
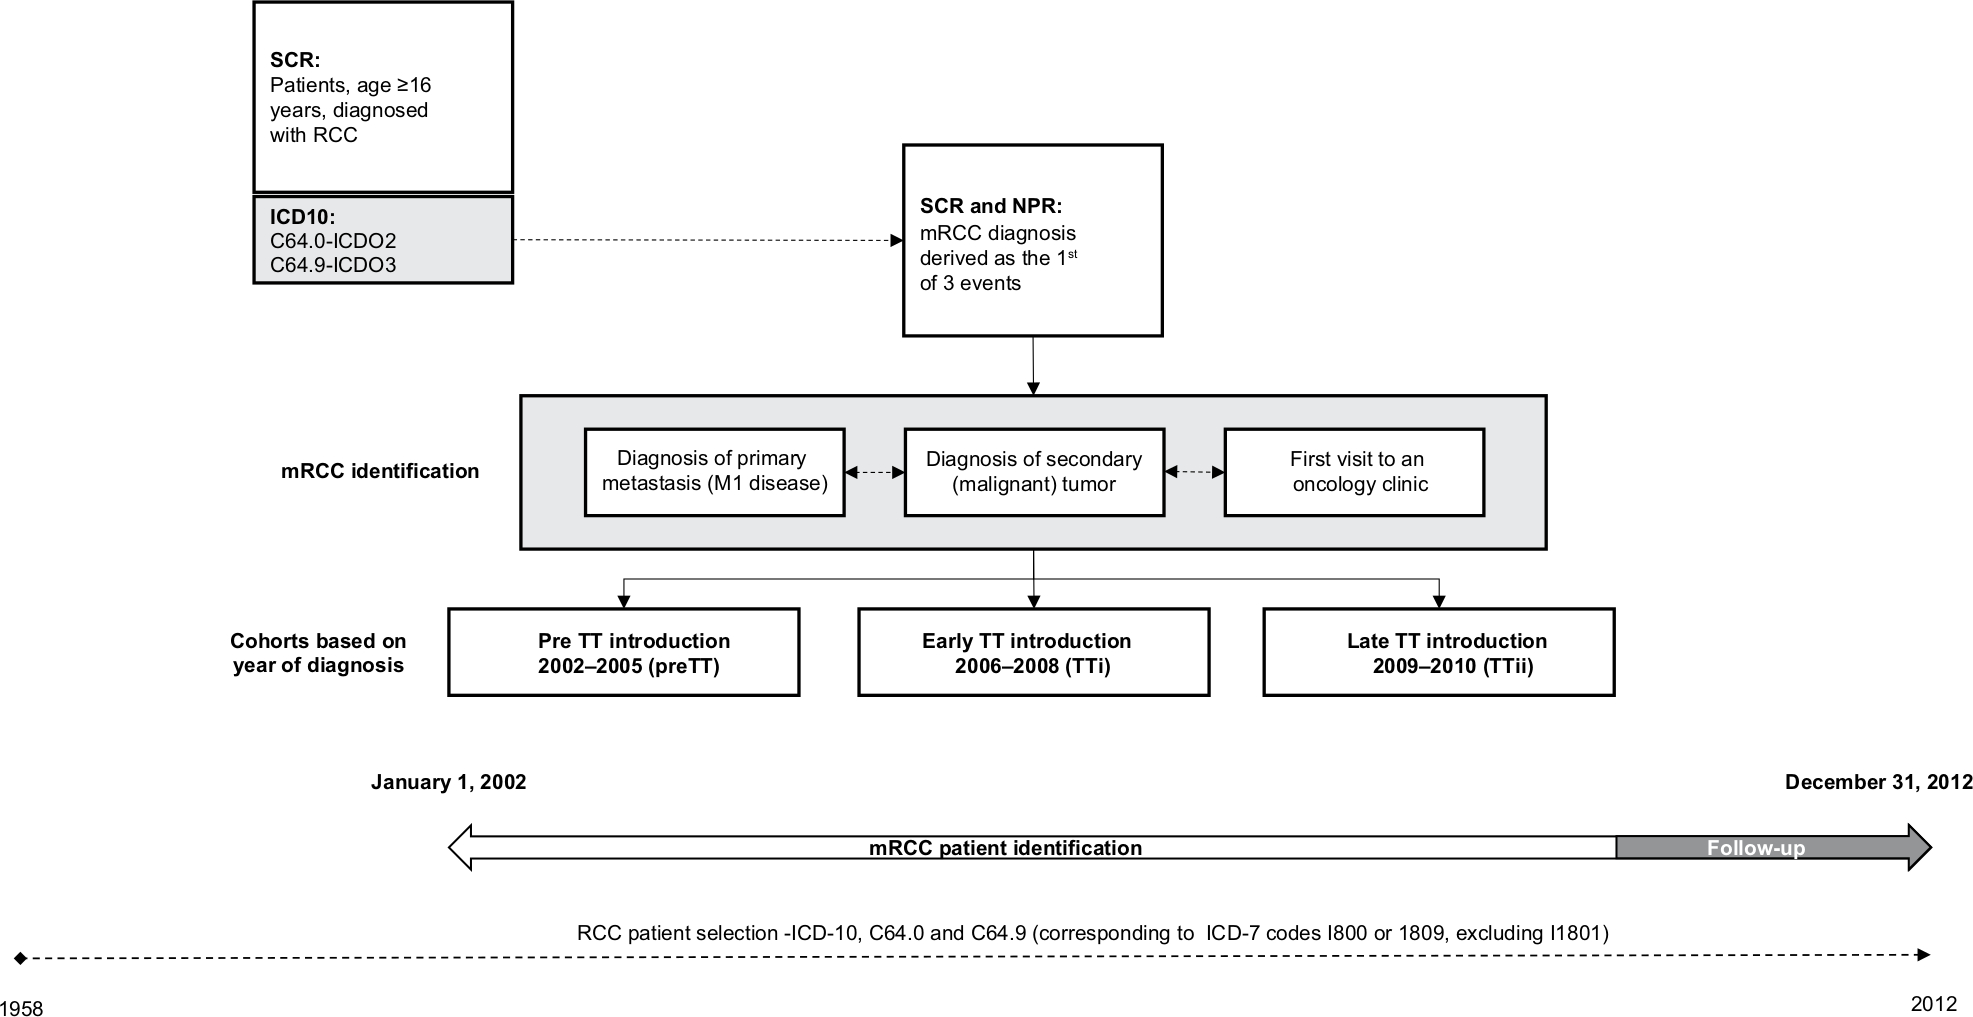 | Figure 1 Study design: identification of Swedish patients diagnosed with mRCC between 2002–2010. Abbreviations: mRCC, metastatic renal cell carcinoma; NPR, National Patient Registry; PreTT, pre-TT introduction (patients diagnosed with mRCC 2002–2005); RCC, renal cell carcinoma; SCR, Swedish Cancer Registry; TT, targeted therapies; TTi, early TT introduction (patients diagnosed with mRCC 2006–2008); TTii, late TT introduction (patients diagnosed with mRCC 2009–2010). |
The patient population was divided into three cohorts based on the year of mRCC diagnosis to reflect the evolving treatment landscape of mRCC during the study period: pre-TT introduction ([preTT]; patients diagnosed 2002–2005) period, early TT introduction ([TTi]; patients diagnosed 2006–2008), and late TT introduction ([TTii]; patients diagnosed 2009–2010). For preTT patients, the treatment landscape of mRCC was dominated by IFN-α, whereas TTs were introduced and predominantly used in the TTi and TTii time periods. It is notable that sunitinib and sorafenib were introduced and reimbursed in Sweden during the TTi period, whereas pazopanib, everolimus, and axitinib came to market during the TTii time period. All included patients were followed from mRCC diagnosis until death or the end of the follow-up. Given that HCRU data were only available until December 31, 2012, the follow-up period was restricted to 4 years to enable cost comparisons across cohorts. The preTT and TTi cohorts correspond to the Lindskog et al cohorts,22 whereas the TTii cohort in this study is limited to patients diagnosed 2009–2010, excluding those who were diagnosed later due to a lack of follow-up data.
Analysis
Mean survival was estimated for a follow-up period of 4 years using standard Kaplan–Meier methodology.27 HCRU comprised specialist outpatient care, inpatient care, and dispensed medications. Expected HCRU costs were estimated using the Lin methodology to account for censoring.28 First, the time period was divided into 3-month intervals, using the date of mRCC diagnosis as the index date, with a maximum follow-up of 4 years (16 intervals). Thereafter, mean cost per resource category was calculated within each interval based on patients who were alive at the start of that interval. Mean costs were then multiplied by the Kaplan–Meier estimator of the probability of being alive at the start of the interval. For each cohort, the costs were summed across all cost categories and all 16 intervals to estimate the mean cost per patient over 4 years for the three cohorts.
For analysis of HCRU costs, the cost per health care visit was derived through the diagnosis-related group (DRG) system used in Nordic countries, NordDRG. Weights for each DRG code were available in the NPR, and the corresponding costs were provided by the Swedish National Board of Health and Welfare. The costs attached to the DRG codes were assigned to all events for outpatient and inpatient care. As the aim was to capture resource use related to the diagnosis of mRCC, only visits with RCC as the primary diagnosis were included in the analysis.
Information on resource use of prescribed medication was available beginning July 2005. Therefore, resource use prior to this date was imputed using data from 2005. Since information on diagnosis is not available in the PDR, all drug costs were included in this analysis. Drug costs were presented separately for TT prescriptions (imatinib, gefitinib, erlotinib, sunitinib, sorafenib, dasatinib, lapatinib, nilotinib, everolimus, pazopanib, and axitinib) and other prescribed drugs (all drugs except TTs).
Cost-effectiveness was defined as incremental costs per life-year (LY) gained. Incremental costs were defined as the difference in mean total costs between cohorts; LYs gained were defined as the difference in mean survival between cohorts.
In many regions in Sweden, TTs are dispensed at hospital clinics and are therefore not captured in the PDR. The structure of the DRG code implies that the cost of drugs used for hospitalized patients should be included in the DRG cost and thus, included in the cost for inpatient and outpatient care. However, as it is not possible to assess to what extent TT costs were accounted for, a sensitivity analysis was conducted, adding an estimate of the costs of TTs dispensed in hospitals. National sales statistics for TTs by drug, region, and month were used to estimate the proportions of sales dispensed in hospitals vs prescribed by clinicians and administered outside of the hospital setting.
All costs were calculated in 2014 Swedish Krona (SEK) (1 SEK = US$ 0.12) and all analyses were conducted using Stata version 14 (StataCorp LP, College Station, TX, USA).
Results
A total of 52,467 patients aged ≥16 years were identified in the SCR as having been diagnosed with RCC. After implementation of the algorithm that derived mRCC diagnosis, 3,430 patients with evidence of mRCC between January 1, 2002 and December 31, 2010, remained in the final study sample (preTT, n=1,466; TTi, n=1,158; TTii, n=806). A detailed description of the sequential sample selection is presented in Figure 2. Overall, ~61% of the patients in the study sample were male, with a mean age of 66 years at the date of RCC diagnosis. The vast majority of patients (91%) were diagnosed with RCC after 1995. The mean age at the date of diagnosis of mRCC was 69 years. Only minor differences in baseline characteristics were observed across cohorts (Table 1). The qualifying events for an mRCC diagnosis (M1 disease, secondary malignant tumor, or oncology clinic visit) were evenly distributed overall; however, differences were observed across cohorts. The proportion of patients with an oncology clinic visit as the qualifying mRCC event was 39.8% in the preTT cohort, 24.7% in the TTi cohort, and 24.3% in the TTii cohort. Although the proportion of patients with M1 disease and secondary malignant tumors, respectively, as qualifying mRCC events were similar in the preTT (28.0% and 32.2%) and TTii (38.2% and 37.5%) cohorts, M1 disease was more prevalent as the qualifying event in the TTi cohort (44.3% and 31.0%).
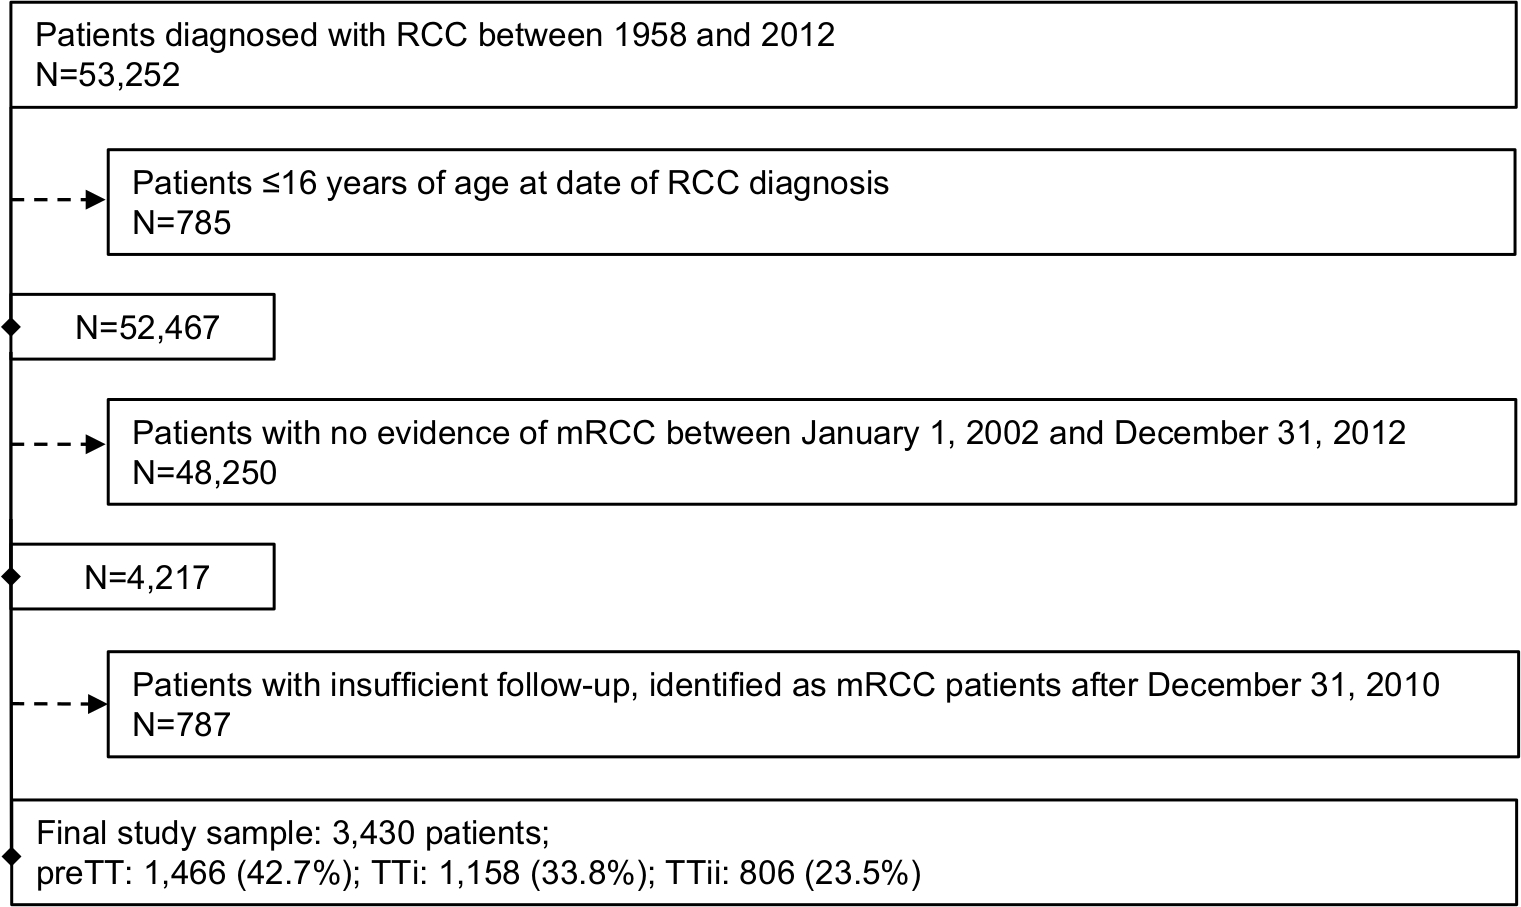 | Figure 2 Patient selection flow chart: Swedish patients diagnosed with mRCC between 2002–2010. Abbreviations: mRCC, metastatic renal cell carcinoma; PreTT, pre-TT introduction (patients diagnosed with mRCC 2002–2005); RCC, renal cell carcinoma; TT, targeted therapies; TTi, early TT introduction (patients diagnosed with mRCC 2006–2008); TTii, late TT introduction (patients diagnosed with mRCC 2009–2010). |
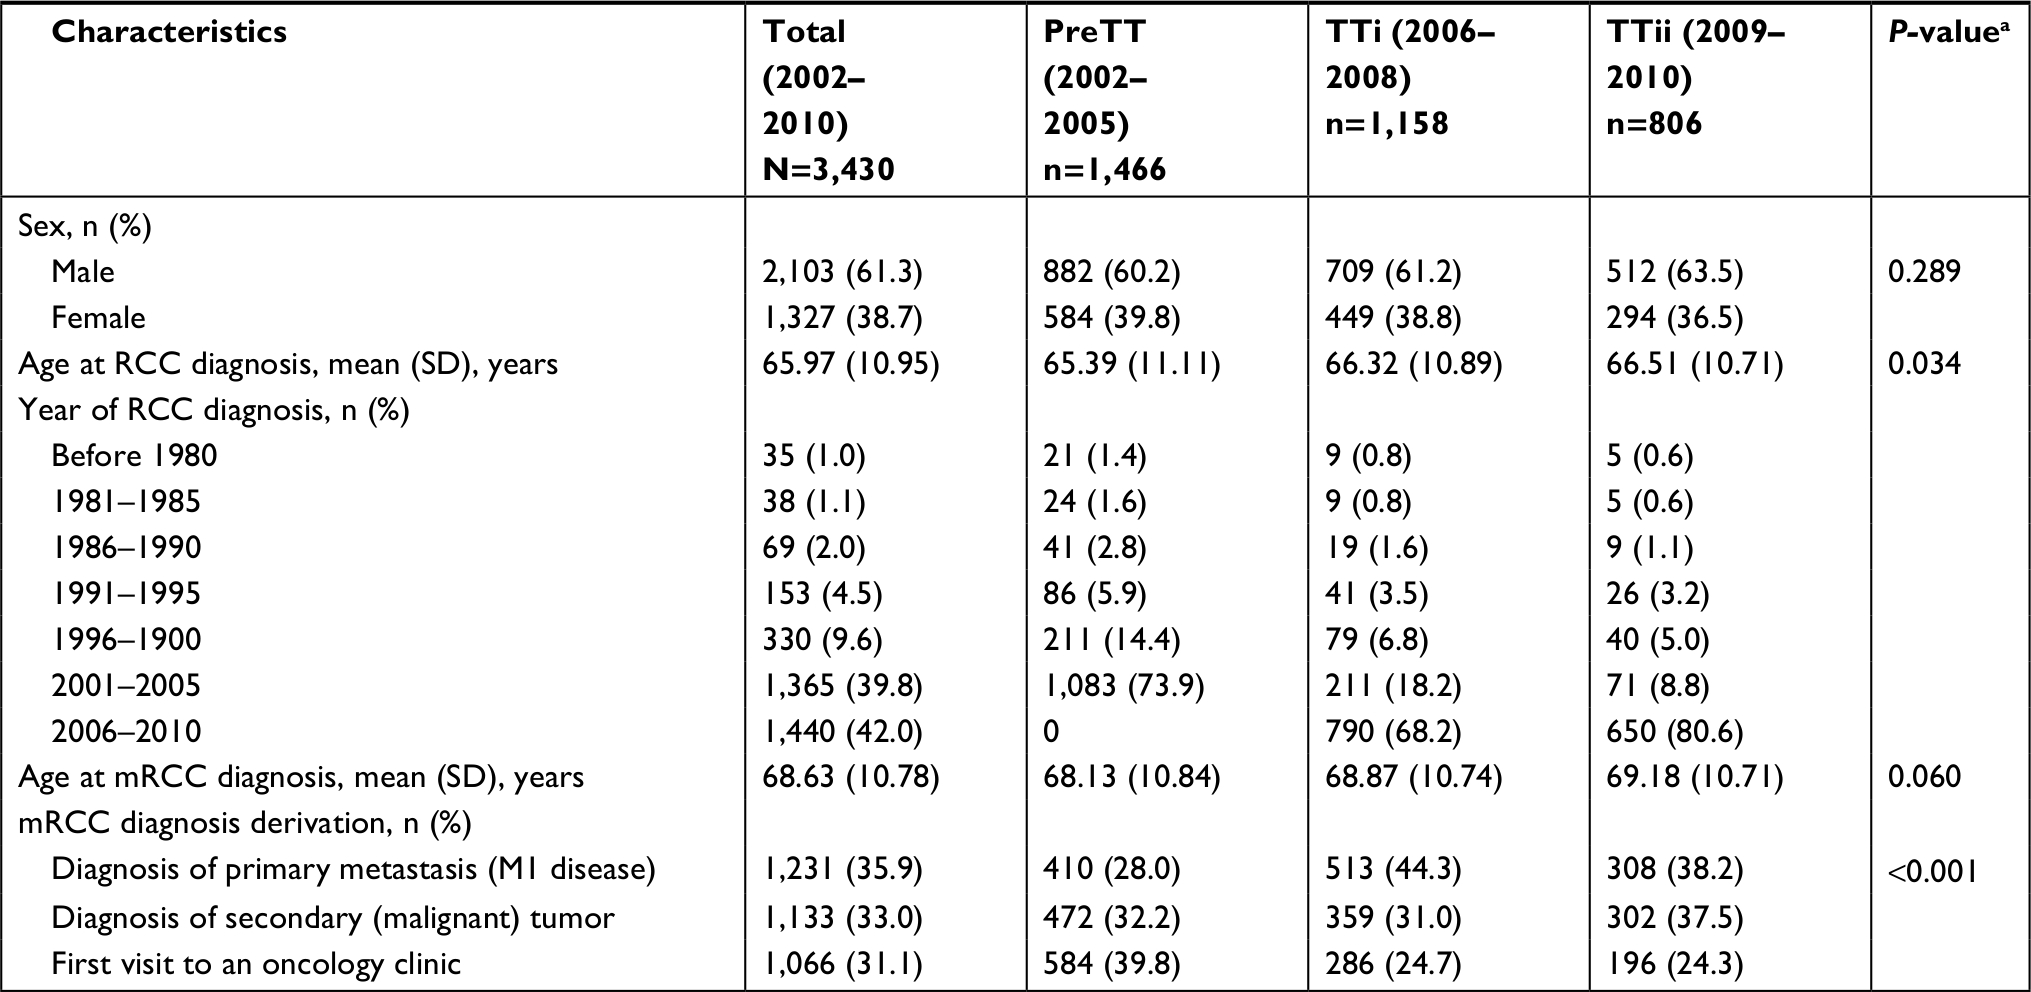 | Table 1 Baseline characteristics of Swedish patients with mRCC (2002–2010) by period of diagnosis Note: aKruskal-Wallis and χ2 tests were used to assess differences across cohorts. Abbreviations: mRCC, metastatic renal cell carcinoma; PreTT, pre-TT introduction (patients diagnosed with mRCC 2002–2005); TT, targeted therapies; TTi, early TT introduction (patients diagnosed with mRCC 2006–2008); TTii, late TT introduction (patients diagnosed with mRCC 2009–2010). |
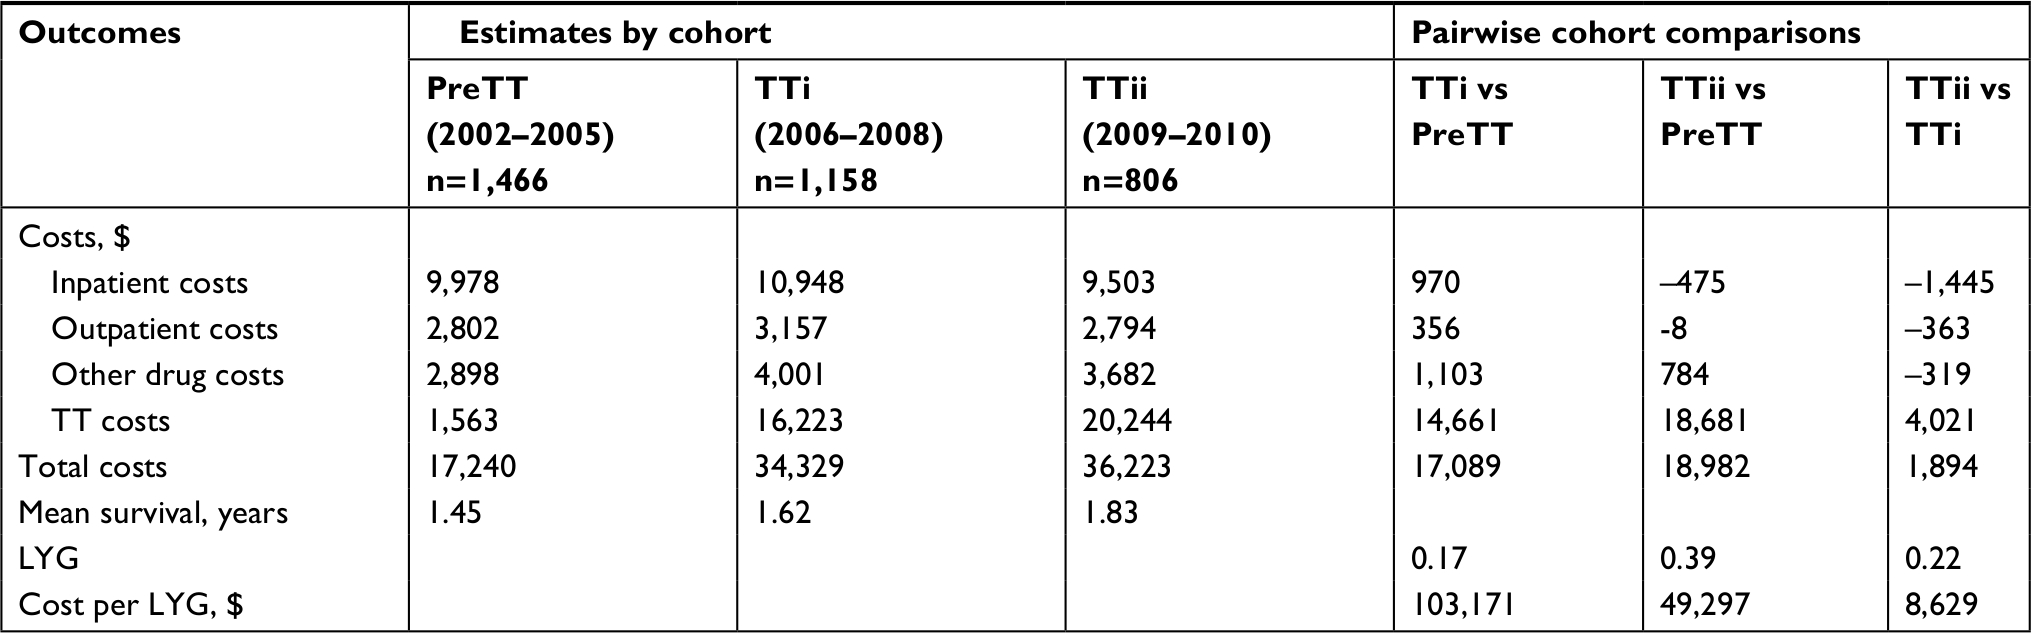
Mean estimated survival in years was 1.45, 1.62, and 1.83 for the preTT, TTi, and TTii cohorts, respectively. Thus, pairwise cohort comparisons estimated the LYs gained to 0.17, 0.39, and 0.22 for the TTi vs preTT, TTii vs preTT, and TTii vs TTi cohorts, respectively (Table 2). The observed mean differences in survival across all cohorts was supported by a log-rank test (P<0.001).
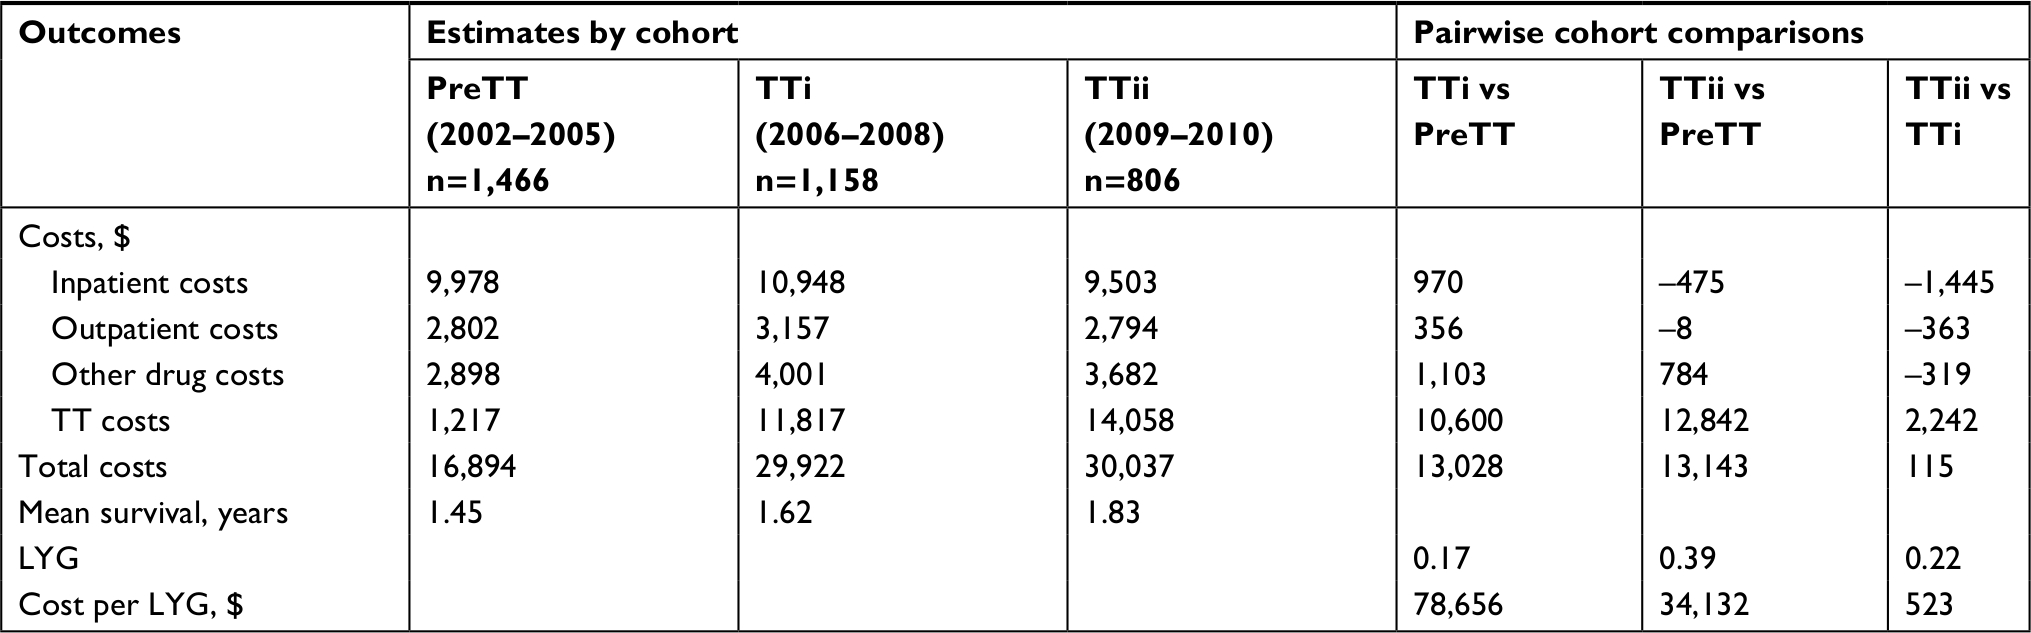 | Table 2 Estimated mean costs, mean survival, estimated LYG, and cost per LYG per patient in Swedish patients with mRCC (2002–2010) by period of diagnosis Notes: All costs are represented in US$. Abbreviations: LYG, life-years gained; mRCC, metastatic renal cell carcinoma; PreTT, pre-TT introduction (patients diagnosed with mRCC 2002–2005); TT, targeted therapies; TTi, early TT introduction (patients diagnosed with mRCC 2006–2008); TTii, late TT introduction (patients diagnosed with mRCC 2009–2010). |
The analysis of HCRU costs stratified by cohort is presented in Table 2 and Figure 3. The estimated 4-year mean total HCRU costs per patient were $16,894 in the preTT cohort, $29,922 in the TTi cohort, and $30,037 in the TTii cohort. The higher total costs were driven by increases in TT costs ($1,217 in the preTT cohort; $11,817 in the TTi cohort; and $14,058 in the TTii cohort). Although all HCRU cost categories were higher in the TTi cohort relative to the preTT cohort, inpatient and outpatient care costs decreased by $475 and $8, respectively, in the TTii cohort compared with the preTT cohort. The higher TT costs observed in the TTii compared with the TTi cohort ($2,242) were partially offset by lower costs for inpatient care ($1,445), outpatient care ($363), and other drug costs ($319), resulting in an incremental mean total cost of $115 (Table 2).
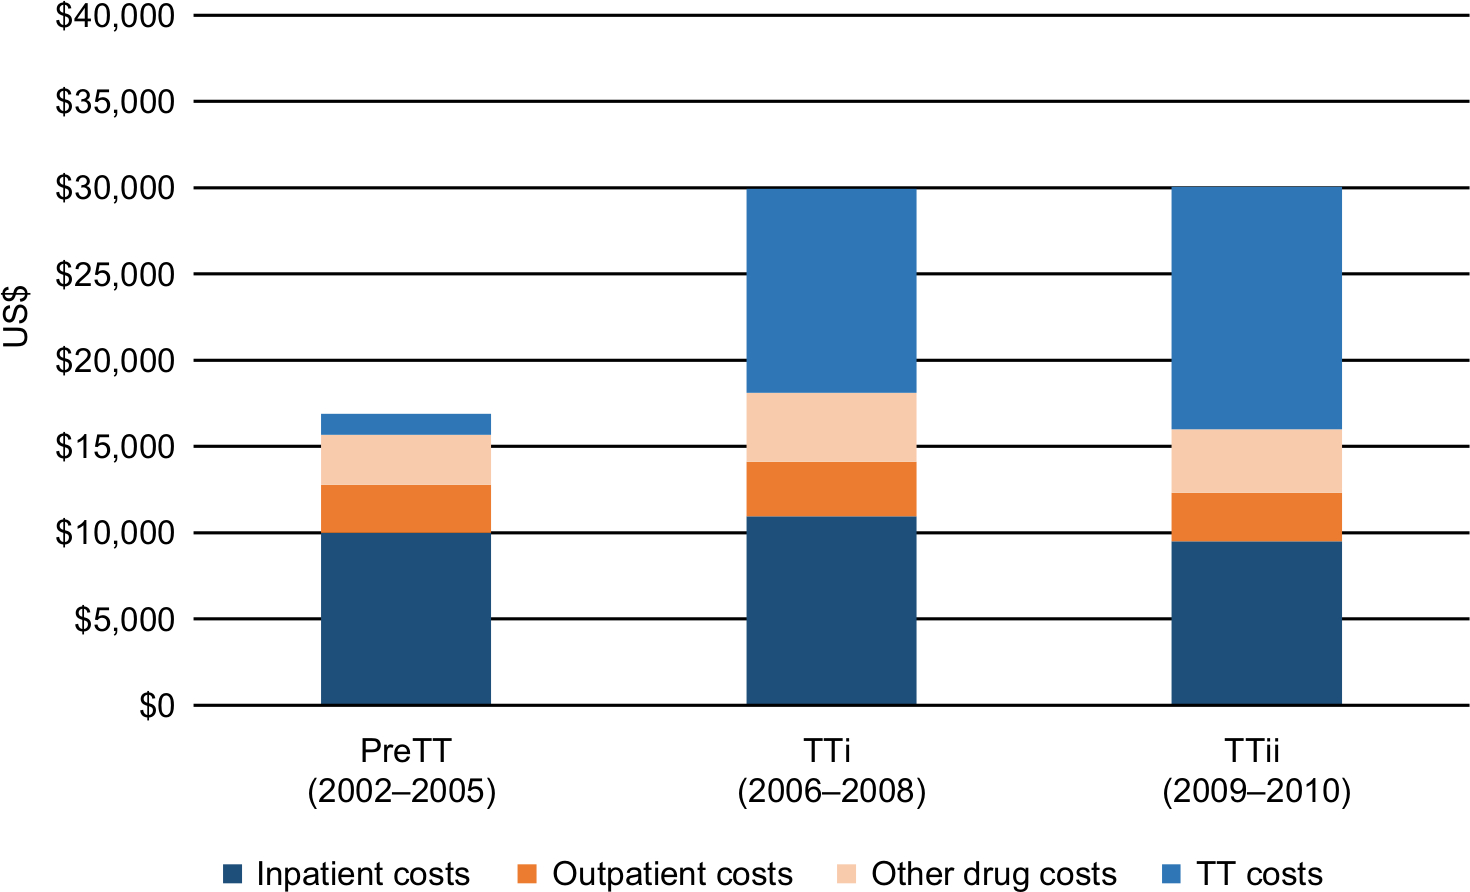 | Figure 3 Estimated mean costs per patient in Swedish patients with mRCC (2002–2010) by period of diagnosis. Abbreviations: mRCC, metastatic renal cell carcinoma; PreTT, pre-TT introduction (patients diagnosed with mRCC 2002–2005); TT, targeted therapies; TTi, early TT introduction (patients diagnosed with mRCC 2006–2008); TTii, late TT introduction (patients diagnosed with mRCC 2009–2010). |
Given the survival benefits and costs presented, mean incremental costs per LY gained were estimated at $78,656, $34,132, and $523 for the TTi vs preTT, TTii vs preTT, and TTii vs TTi cohorts, respectively (Table 2).
The results of the sensitivity analysis are presented in Table 3. Assuming that drug costs were not accounted for in DRG costs, the total costs increased by 2% in the preTT cohort, 15% in the TTi cohort, and 21% in the TTii cohort. The increases in total costs resulted in a mean incremental cost per LY gained estimated at $103,171, $49,297, and $8,629 for the TTi vs preTT, TTii vs preTT, and TTii vs TTi cohorts, respectively (Table 3).
 | Table 3 Sensitivity analysis including TT dispensed at hospitals: estimated mean costs, mean survival, estimated LYG, and cost per LYG per patient in Swedish patients with mRCC by period of diagnosis Notes: All costs are presented in US$. Abbreviations: LYG, life-years gained; mRCC, metastatic renal cell carcinoma; PreTT, pre-TT introduction (patients diagnosed with mRCC 2002–2005); TT, targeted therapies; TTi, early TT introduction (patients diagnosed with mRCC 2006–2008); TTii, late TT introduction (patients diagnosed with mRCC 2009–2010). |
Discussion
Using data from Swedish national registers, the objective of this study was to explore the real-world cost-effectiveness of TTs in patients with mRCC. TT improved survival in patients with mRCC, but also increased costs. Compared with the time before TTs were available (2002–2005), costs per LY gained were estimated at $78,656 for the early TT period (2006–2008) and $34,132 (2009–2010) for the later TT period. Although there is no official threshold for the willingness-to-pay per LY gained in Sweden, the revealed willingness-to-pay per quality-adjusted LY (QALY) ranges between $84,000 and $144,000,29 indicating the observed costs per LY gained would be considered cost-effective. The results from the sensitivity analysis, wherein TT costs increased by 2%, 15%, and 21% for the preTT, TTi, and TTii cohorts, respectively, further confirm that the cost per LY gained could be considered cost-effective for the TTi and TTii cohorts when compared with the preTT cohort. However, TT costs in this analysis are potentially overestimated, as they are partly accounted for in the DRG unit cost. Although the total HCRU costs increased slightly from TTi to TTii, the costs for inpatient as well as outpatient care decreased. One contributing factor could be the increased median treatment duration of each patient treated with TTs in the late-TT era. In other words, shorter or fewer treatment breaks would be expected with growing experience in using TTs among uro-oncologists. For example, a switch from a 4-week-on/2-week-off (4/2) schedule to a 2-week-on/1-week off (2/1) schedule when administering sunitinib, as adopted by most clinicians in the late-TT period (albeit this was not the schedule tested in the registration study), has proven more tolerable while maintaining dose intensity, thus enabling prolonged, effective treatment.30–37 In parallel, improved proactive and early handling of adverse events may have led to fewer health care visits or procedures in the TTii era.
The increase in mean total HCRU cost per patient over the study period was predominately driven by TT costs. These findings are qualitatively similar to results from a US study on privately insured patients with mRCC wherein costs were found to have increased from $11,458 in 2004 to $68,660 in 2010.9 The discrepancy in absolute costs and relative cost increases between the two studies is difficult to assess without access to the underlying data, but may reflect differences in health care delivery and costing of resources. In contrast, a population-based study of patients with mRCC conducted in Denmark found no difference in total HCRU costs associated with the introduction of TTs. That study compared costs in a TT-treated cohort (n=439) in the years 2006–2009 to an immunology-treated cohort (n=192) during 2002–2005.11 Costs were calculated over a 2-year follow-up period and were presented per patient per year. The study showed that higher outpatient, radiology, and drug costs in the TT cohort were offset by inpatient care and radiotherapy costs, resulting in a total cost of €27,856 in the immunology-treated cohort and €27,676 in the TT-treated cohort (P=0.5). It should be noted that the costs of immunotherapy and TTs were also calculated separately and were not included in the main analysis, as it was assumed that these costs were (at least partly) accounted for in the DRG unit cost.
Although potential cost offsets in inpatient care were observed in the present study, these offsets were substantially smaller compared with the Danish study. Notably, the health care costs in Denmark in the pre-TT time period were considerably higher (two- to three-fold) for inpatient as well as outpatient care. This likely reflects the widespread use of costly immunotherapies, including IL-2, in Denmark in the pre-TT era, as opposed to Sweden where high-dose IL-2 was not approved.11,38 Hence, it is not surprising that the switch from earlier therapies to TTs in Denmark had less impact on total costs compared with Sweden. Moreover, the differences in results may reflect an underestimation of actual costs in the Danish study from using the DRG tariffs.11,39
The present study has certain limitations originating from the type of available data. In addition to the mRCC diagnosis derived by an algorithm,21,22 not all relevant health care resources were captured. For example, resource utilization as registered in the NPR did not include primary care or specialized outpatient care provided by any medical personnel not registered as a specialized doctor, which excludes costs carried by the patient, home-based palliative care, informal care provided by the patient’s relatives and friends, and indirect costs in terms of productivity losses. Furthermore, as the NPR lacks an informative and direct link between resource utilization and its underlying cause, treatment-related costs for adverse events could not be explicitly derived. However, costs associated with treatment-induced adverse events managed in a hospital setting were encompassed by the total cost of HCRU. Although information on the costs of adverse events outside of the hospital setting are lacking,40 previous research has shown that these costs are likely to be low in relation to the total costs (<2%–3%) due to a low incidence of severe and costly adverse events with the currently approved TTs.41,42 Additionally, while we were able to estimate survival benefits, health-related quality of life (HRQoL) is not captured in the registers. Therefore, a QALY estimate that incorporates impact of disease and treatment-related symptoms and patient’s functioning could not be performed. However, in this context, the Swedish dental and pharmaceutical benefits agency prefers experience-based HRQoL estimates, which generally place survival at a relatively high value compared with HRQoL.43 In addition, because this analysis was performed using Swedish registry data, the results may not be generalizable to other settings. Finally, the survival and cost impacts of TTs were estimated using cohorts stratified by year of diagnosis, and therefore, factors other than TTs that have changed over time may confound the results.
This study also has several strengths. Analysis of real-world data from administrative registers ensures that patients are treated in accordance with clinical practice and removes the possibility of the Hawthorne effect bias.44–46 Further, according to the previously described algorithm, all patients in Sweden diagnosed with mRCC between January 1, 2002 and December 31, 2010 were included in the study, minimizing selection bias and improving generalizability. In addition, the population-based design using data from national health care registers substantially reduces study attrition and loss to follow-up. Bias in cost estimation has also been reduced by applying the Lin methodology.28 Alternative methods for estimating HCRU costs would restrict the analysis to patients with complete follow-up time or include all observed costs. However, this would lead to biased estimates, as the analysis would be restricted to patients with either a short survival period or an early date of diagnosis, or exclusion of costs that occurred after censoring, and would have resulted in underestimation of costs.
Further research is needed. As the rapidly expanding and more individualized mRCC treatment options become available, there are concerns regarding the perceived high cost of immunotherapy and combination therapies. Thus, there is a continuous need for economic evaluation informed by real-world effectiveness and resource use.47–49 This, in turn, requires high-quality data, emphasizing the need for further engagement by providers, payers, and drug manufacturers to facilitate the infrastructure of administrative as well as clinical registries.
In the context of our study, extending the follow-up period beyond 2012 may also allow for the assessment of the impact of newer TTs such as cabozantinib and nivolumab, which are both currently reimbursed in Sweden but have not been evaluated in the real-world setting.
In conclusion, this study showed that the introduction of TTs in the treatment of mRCC improved survival but also increased costs for patients with mRCC. Although no official threshold for the willingness-to-pay costs per LYs gained exist in Sweden, our data suggest that TTs in mRCC are increasingly cost-effective over time.
Acknowledgments
Editorial support was provided by Linda Cirella at Engage Pharma Group and was funded by Pfizer. This study was funded by Pfizer.
Disclosure
J Redig, J Dalén, and Ö Åkerborg, employees of ICON, were paid consultants to Pfizer for development of this manuscript. B Ljungberg reports personal fees from Ipsen, personal fees from Pfizer, personal fees from Novartis, personal fees from BMS, outside the submitted work. T Wahlgren, R Sandin, and M Jakobsson are employees of and own stock in Pfizer. M Lindskog, S Lundstam, B Ljungberg, and U Harmenberg were scientifically involved in this research. The authors report no other conflicts of interest in this work.
References
Parkin DM, Bray F, Ferlay J, Pisani P. Global cancer statistics, 2002. CA Cancer J Clin. 2005;55(2):74–108. | ||
Engholm GFJ, Christensen N, Kejs AMT. NORDCAN: cancer incidence, mortality, prevalence and survival in the Nordic countries: association of the Nordic Cancer registries. Danish Cancer Society. 2016. | ||
Dabestani S, Thorstenson A, Lindblad P, Harmenberg U, Ljungberg B, Lundstam S. Renal cell carcinoma recurrences and metastases in primary non-metastatic patients: a population-based study. World J Urol. 2016;34(8):1081–1086. | ||
Coppin C, Porzsolt F, Kumpf J, Coldman A, Wilt T. Immunotherapy for advanced renal cell cancer. Cochrane Database Syst Rev. 2000 (3):Cd001425. | ||
Escudier B, Porta C, Schmidinger M, et al. Renal cell carcinoma: ESMO clinical practice guidelines for diagnosis, treatment and follow-up. Ann Oncol. 2014;25(Suppl 3):iii49–iii56. | ||
Ljungberg B, Bensalah K, Canfield S, et al. EAU guidelines on renal cell carcinoma: 2014 update. Eur Urol. 2015;67(5):913–924. | ||
National Comprehensive Cancer Network. NCCN clinical practice guidelines in oncology. Kidney Cancer, version 2.2016; 2016. | ||
Regionalt cancercentrum. [National Swedish guidelines, Renal cell carcinoma 2017]. Nationellt vårdprogram Njurcancer 2017; 2017. Available from: http://cancercentrum.se/samverkan/cancerdiagnoser/urinvagar/njurcancer/vardprogram/. Accessed February 01, 2019. Swedish. | ||
Geynisman DM, Hu JC, Liu L, Tina Shih YC. Treatment patterns and costs for metastatic renal cell carcinoma patients with private insurance in the United States. Clin Genitourin Cancer. 2015;13(2):e93–e100. | ||
Maroun R, Maunoury F, Benjamin L, Nachbaur G, Durand-Zaleski I. In-hospital economic burden of metastatic renal cell carcinoma in France in the era of targeted therapies: analysis of the French National Hospital database from 2008 to 2013. PLoS One. 2016;11(9):e0162864. | ||
Soerensen AV, Donskov F, Kjellberg J, et al. Health economic changes as a result of implementation of targeted therapy for metastatic renal cell carcinoma: national results from DARENCA Study 2. Eur Urol. 2015;68(3):516–522. | ||
Wilking N, Wilking U, Jönsson B. The positioning of economic principles under the changing conditions of the novel drug developmental process in cancer. Chin Clin Oncol. 2014;3(2):23. | ||
Remák E, Charbonneau C, Négrier S, Kim ST, Motzer RJ. Economic evaluation of sunitinib malate for the first-line treatment of metastatic renal cell carcinoma. J Clin Oncol. 2008;26(24):3995–4000. | ||
Hoyle M, Green C, Thompson-Coon J, et al. Cost-effectiveness of temsirolimus for first line treatment of advanced renal cell carcinoma. Value Health. 2010;13(1):61–68. | ||
Heng DY, Chi KN, Murray N, et al. A population-based study evaluating the impact of sunitinib on overall survival in the treatment of patients with metastatic renal cell cancer. Cancer. 2009;115(4):776–783. | ||
Pal SK, Nelson RA, Vogelzang N. Disease-specific survival in de novo metastatic renal cell carcinoma in the cytokine and targeted therapy era. PLoS One. 2013;8(5):e63341. | ||
Schlesinger-Raab A, Treiber U, Zaak D, Hölzel D, Engel J. Metastatic renal cell carcinoma: results of a population-based study with 25 years follow-up. Eur J Cancer. 2008;44(16):2485–2495. | ||
Shek D, Tomlinson B, Brown M, Brunson A, Pan CX, Lara PN. Epidemiologic trends in renal cell carcinoma in the cytokine and post-cytokine eras: a Registry analysis of 28,252 patients. Clin Genitourin Cancer. 2012;10(2):93–98. | ||
Soerensen AV, Donskov F, Hermann GG, et al. Improved overall survival after implementation of targeted therapy for patients with metastatic renal cell carcinoma: results from the Danish renal cancer Group (DARENCA) study-2. Eur J Cancer. 2014;50(3):553–562. | ||
Vaishampayan U, Vankayala H, Vigneau FD, et al. The effect of targeted therapy on overall survival in advanced renal cancer: a study of the national surveillance epidemiology and end results registry database. Clin Genitourin Cancer. 2014;12(2):124–129. | ||
Wahlgren T, Harmenberg U, Sandström P, et al. Treatment and overall survival in renal cell carcinoma: a Swedish population-based study (2000-2008). Br J Cancer. 2013;108(7):1541–1549. | ||
Lindskog M, Wahlgren T, Sandin R, et al. Overall survival in Swedish patients with renal cell carcinoma treated in the period 2002 to 2012: update of the RENCOMP study with subgroup analysis of the synchronous metastatic and elderly populations. Urol Oncol. 2017;35(9):541.e15–541541. | ||
Beisland C, Johannesen TB, Klepp O, et al. Overall survival in renal cell carcinoma after introduction of targeted therapies: a Norwegian population-based study. Onco Targets Ther. 2017;10:371–385. | ||
Barlow L, Westergren K, Holmberg L, Talbäck M. The completeness of the Swedish Cancer register: a sample survey for year 1998. Acta Oncol. 2009;48(1):27–33. | ||
Wettermark B, Hammar N, Michaelfored C, et al. The new Swedish Prescribed Drug Register—opportunities for pharmacoepidemiological research and experience from the first six months. Pharmacoepidemiol Drug Saf. 2007;16(7):726–735. | ||
Ludvigsson JF, Andersson E, Ekbom A, et al. External review and validation of the Swedish national inpatient register. BMC Public Health. 2011;11(1):450. | ||
Kaplan EL, Meier P. Nonparametric estimation from incomplete observations. J Am Stat Assoc. 1958;53(282):457–481. | ||
Lin DY, Feuer EJ, Etzioni R, Wax Y. Estimating medical costs from incomplete follow-up data. Biometrics. 1997;53(2):419–434. | ||
Marty M, Cognetti F, Maraninchi D, et al. Randomized phase II trial of the efficacy and safety of trastuzumab combined with docetaxel in patients with human epidermal growth factor receptor 2-positive metastatic breast cancer administered as first-line treatment: the M77001 Study Group. J Clin Oncol. 2005;23(19):4265–4274. | ||
Bjarnason GA, Khalil B, Hudson JM, et al. Outcomes in patients with metastatic renal cell cancer treated with individualized sunitinib therapy: correlation with dynamic microbubble ultrasound data and review of the literature. Urol Oncol. 2014;32(4):480–487. | ||
Jonasch E, Slack RS, Geynisman DM, et al. Phase II study of two weeks on, one week off sunitinib scheduling in patients with metastatic renal cell carcinoma. J Clin Oncol. 2018;36(16):1588–1593. | ||
Bracarda S, Iacovelli R, Boni L, et al. Sunitinib administered on 2/1 schedule in patients with metastatic renal cell carcinoma: the rainbow analysis. Ann Oncol. 2015;26(10):2107–2113. | ||
Najjar YG, Mittal K, Elson P, et al. A 2 weeks on and 1 week off schedule of sunitinib is associated with decreased toxicity in metastatic renal cell carcinoma. Eur J Cancer. 2014;50(6):1084–1089. | ||
Atkinson BJ, Kalra S, Wang X, et al. Clinical outcomes for patients with metastatic renal cell carcinoma treated with alternative sunitinib schedules. J Urol. 2014;191(3):611–618. | ||
Kondo T, Takagi T, Kobayashi H, et al. Superior tolerability of altered dosing schedule of sunitinib with 2-weeks-on and 1-week-off in patients with metastatic renal cell carcinoma--comparison to standard dosing schedule of 4-weeks-on and 2-weeks-off. Jpn J Clin Oncol. 2014;44(3):270–277. | ||
Kalra S, Rini BI, Jonasch E. Alternate sunitinib schedules in patients with metastatic renal cell carcinoma. Ann Oncol. 2015;26(7):1300–1304. | ||
Lee JL, Kim MK, Park I, et al. Randomized phase II trial of sunitinib four weeks on and two weeks off versus two weeks on and one week off in metastatic clear-cell type renal cell carcinoma: restore trial. Ann Oncol. 2015;26(11):2300–2305. | ||
Donskov F, von der Maase H. Impact of immune parameters on long-term survival in metastatic renal cell carcinoma. J Clin Oncol. 2006;24(13):1997–2005. | ||
Laguna MP. Re: health economic changes as a result of implementation of targeted therapy for metastatic renal cell carcinoma: national results from DARENCA Study 2. J Urol. 2016;195(3):608–609. | ||
Swallow E, Messali A, Ghate S, Mcdonald E, Duchesneau E, Perez JR. The additional costs per month of progression-free survival and overall survival: an economic model comparing everolimus with cabozantinib, nivolumab, and axitinib for second-line treatment of metastatic renal cell carcinoma. J Manag Care Spec Pharm. 2018;24(4):335–343. | ||
Benedict A, Figlin RA, Sandström P, et al. Economic evaluation of new targeted therapies for the first-line treatment of patients with metastatic renal cell carcinoma. BJU Int. 2011;108(5):665–672. | ||
Thompson Coon J, Hoyle M, Green C, et al. Bevacizumab, sorafenib tosylate, sunitinib and temsirolimus for renal cell carcinoma: a systematic review and economic evaluation. Health Technol Assess. 2010;14(2):1–184, iii-iv. | ||
Burström K, Sun S, Gerdtham UG, et al. Swedish experience-based value sets for EQ-5D health states. Qual Life Res. 2014;23(2):431–442. | ||
Franke RH, Kaul JD. The Hawthorne experiments: first statistical interpretation. Am Sociol Rev. 1978;43(5):623–643. | ||
Braunholtz DA, Edwards SJ, Lilford RJ. Are randomized clinical trials good for us (in the short term)? Evidence for a “trial effect”. J Clin Epidemiol. 2001;54(3):217–224. | ||
Peppercorn JM, Weeks JC, Cook EF, Joffe S. Comparison of outcomes in cancer patients treated within and outside clinical trials: conceptual framework and structured review. Lancet. 2004;363(9405):263–270. | ||
Tartari F, Santoni M, Burattini L, Mazzanti P, Onofri A, Berardi R. Economic sustainability of anti-PD-1 agents nivolumab and pembrolizumab in cancer patients: recent insights and future challenges. Cancer Treat Rev. 2016;48:20–24. | ||
Mckay RR, Bossé D, Choueiri TK. Evolving systemic treatment landscape for patients with advanced renal cell carcinoma. J Clin Oncol. 2018:JCO2018790253:3615–3623. | ||
Flippot R, Escudier B, Albiges L. Immune checkpoint inhibitors: toward new paradigms in renal cell carcinoma. Drugs. 2018;78(14):1443–1457. |
 © 2019 The Author(s). This work is published and licensed by Dove Medical Press Limited. The full terms of this license are available at https://www.dovepress.com/terms.php and incorporate the Creative Commons Attribution - Non Commercial (unported, v3.0) License.
By accessing the work you hereby accept the Terms. Non-commercial uses of the work are permitted without any further permission from Dove Medical Press Limited, provided the work is properly attributed. For permission for commercial use of this work, please see paragraphs 4.2 and 5 of our Terms.
© 2019 The Author(s). This work is published and licensed by Dove Medical Press Limited. The full terms of this license are available at https://www.dovepress.com/terms.php and incorporate the Creative Commons Attribution - Non Commercial (unported, v3.0) License.
By accessing the work you hereby accept the Terms. Non-commercial uses of the work are permitted without any further permission from Dove Medical Press Limited, provided the work is properly attributed. For permission for commercial use of this work, please see paragraphs 4.2 and 5 of our Terms.