")
Back to Journals » International Journal of Chronic Obstructive Pulmonary Disease » Volume 17
Re-Defining High Risk COPD with Parameter Response Mapping Based on Machine Learning Models
Authors Pu Y, Zhou X, Zhang D, Guan Y , Xia Y, Tu W , Lu Y, Zhang W, Fu CC, Fang Q, de Bock GH , Liu S, Fan L
Received 21 April 2022
Accepted for publication 21 July 2022
Published 4 October 2022 Volume 2022:17 Pages 2471—2483
DOI https://doi.org/10.2147/COPD.S369904
Checked for plagiarism Yes
Review by Single anonymous peer review
Peer reviewer comments 2
Editor who approved publication: Dr Richard Russell
Yu Pu,1,* Xiuxiu Zhou,1,* Di Zhang,1,* Yu Guan,1,* Yi Xia,1 Wenting Tu,1 Yang Lu,2 Weidong Zhang,2 Chi-Cheng Fu,2 Qu Fang,2 Geertruida H de Bock,3 Shiyuan Liu,1 Li Fan1
1Department of Radiology, Changzheng Hospital, Naval Medical University, Shanghai, People’s Republic of China; 2Department of Scientific Research, Shanghai Aitrox Technology Corporation Limited, Shanghai, People’s Republic of China; 3Department of Epidemiology, University Medical Center Groningen, Groningen, the Netherlands
*These authors contributed equally to this work
Correspondence: Shiyuan Liu; Li Fan, Department of Radiology, ChangZheng Hospital, Naval Medical University, No. 415 Fengyang Road, Shanghai, 200003, People’s Republic of China, Tel +86 21 81886012 ; Tel +86 21 81886012, Fax +86 21 63587668, Email [email protected]; [email protected]
Purpose: To explore optimal threshold of FEV1% predicted value (FEV1%pre) for high-risk chronic obstructive pulmonary disease (COPD) using the parameter response mapping (PRM) based on machine learning classification model.
Patients and Methods: A total of 561 consecutive non-COPD subjects who were screened for chest diseases in our hospital between August and October 2018 and who had complete questionnaire surveys, pulmonary function tests (PFT), and paired respiratory chest CT scans were enrolled retrospectively. The CT quantitative parameter for small airway remodeling was PRM, and 72 parameters were obtained at the levels of whole lung, left and right lung, and five lobes. To identify a more reasonable thresholds of FEV1% predicted value for distinguishing high-risk COPD patients from the normal, 80 thresholds from 50% to 129% were taken with a partition of 1% to establish a random forest classification model under each threshold, such that novel PFT-parameter-based high-risk criteria would be more consistent with the PRM-based machine learning classification model.
Results: Machine learning-based PRM showed that consistency between PRM parameters and PFT was better able to distinguish high-risk COPD from the normal, with an AUC of 0.84 when the threshold was 72%. When the threshold was 80%, the AUC was 0.72 and when the threshold was 95%, the AUC was 0.64.
Conclusion: Machine learning-based PRM is feasible for redefining high-risk COPD, and setting the optimal FEV1% predicted value lays the foundation for redefining high-risk COPD diagnosis.
Keywords: chronic obstructive pulmonary disease, computed tomography, pulmonary function test, quantitative imaging, artificial intelligence
Introduction
Chronic obstructive pulmonary disease (COPD) is the third leading cause of death worldwide, with a global prevalence of 11.6%.1,2 The pulmonary structural abnormalities in COPD patients mainly include airway disease, lung parenchymal damage, and vascular remodeling.3 Koo et al4 found that the change of bronchioles in COPD patients occurred earlier than the presence of emphysema; specifically, the wall of bronchioles was thickening, the number of bronchioles was reduced, and the lumen of bronchioles was occluded in Global Initiative for Chronic Obstructive Lung Disease (GOLD) I COPD patients. This suggests the importance of early evaluation of the small airway for early warning of COPD. Moreover, airway diseases are shown to be reversible after smoking cessation or proper treatment.5,6 Therefore, early diagnosis and early intervention for small airway disease may greatly reduce symptoms and delay disease progress.
Early diagnosis cannot be achieved using PFT alone, because PFT is abnormal only when lung tissue damage is more than 30% and small airway obstruction is over 75%.7 Some patients with normal PFTs may still show emphysema, gas trapping, and airway wall thickening on CT images.8–10 The high-risk COPD or pre-COPD population is believed to be the population at risk of developing spirometrically-defined airflow obstruction in the future. The definitions of high-risk COPD or pre-COPD vary between studies. Regan et al9 defined high-risk COPD patients as current and former smokers with normal post-bronchodilator FEV1/FVC >0.70 and FEV1% predicted value ≥80%. Some researchers proposed that subjects with post-bronchodilator FEV1/FVC >0.70 and FEV1% predicted value <95% in the absence of a bronchodilator were defined as high-risk patients for COPD.11 Wan et al12 found that preserved ratio-impaired spirometry (PRISm) subjects had an FEV1% predicted value <80% predicted by FEV1/FVC ≥0.70. Therefore, the definition of high-risk COPD across studies is based on FEV1% predicted value, however, the threshold of FEV1% predicted value remains controversial.
Imaging has shown great potential to evaluate the early changes of COPD. Our previous studies showed that CT and MRI perfusion were more sensitive to the detection of abnormalities of smokers with normal PFT.13,14 Parameter response mapping (PRM) was acquired by registering full inspiration CT images to full expiration CT images, and it was introduced to indirectly evaluate the functional effects of small airway disease. Each voxel was classified as emphysema, functional small airway disease, or normal lung tissue by PRM.15 fSAD refers to a transitional stage from normal lung tissue to emphysema, indicating it appears earlier than emphysema.16 PRM could provide disease phenotype and detailed spatial information of disease distribution, and quantitative parameters of PRM.
Since it has been confirmed that CT can identify the early changes in high-risk COPD patients and PRM can evaluate structural abnormalities of lung, we hypothesized that the PRM-based machine learning classification model may reflect early changes in the high-risk population. The novel PFT-parameter-based high-risk criterion should have good consistency with the PRM-based machine learning classification model. Therefore, the purpose of this study was to explore the optimal thresholds of FEV1% predicted value for distinguishing high-risk and normal cases, under which PFT parameters and radiological PRM parameters are consistent. We investigated several FEV1% pre-threshold values in order to identify the presence of high-risk signs evaluated by PRM.
Materials and Methods
Data Collection
From August to October 2018, a total of 861 consecutive subjects were screened for the three major chest diseases (NELCIN-B3, ClinicalTrials.gov, NCT03988322) in our hospital and data of non-COPD subjects were collected retrospectively for the analytic sample. Inclusion criteria were as follows: 1) subjects with complete questionnaire survey, PFT, and paired respiratory phase CT; 2) complete PRM parameters were acquired by analysis software; and 3) participants included were non-COPD subjects with FEV1/FVC ≥0.7. Exclusion criteria were: 1) marked respiratory motion or metal artifact of CT images; 2) without thin slice (1 mm) DICOM format images; 3) underlying lung diseases such as lung cancer, severe pulmonary interstitial fibrosis, and massive pulmonary infection; 4) thoracic deformity; and 5) pleural effusion and chest surgery history. All the subjects filled out a questionnaire before undergoing the PFT test, then underwent the PFT test and chest CT scanning on the same day. The study was approved by the institutional review board of Changzheng Hospital, Naval Medical University, Shanghai, China, and the study was registered in the Chinese Clinical Trials Registry (http://www.chictr.org.cn/index.aspx; ChiCTR2000035283). The study was conducted in accordance with the Declaration of Helsinki. All the subjects signed written informed consent for participating in this study.
Questionnaire Survey
The questionnaire included basic information, behavior factors, family history, and disease symptoms. Four basic parameters were selected for data analysis: age, sex, weight, and height.
Pulmonary Function Test
All patients underwent the PFT by Multi-Functional Spirometer (HI-801 Chestgraph, CHEST M.I., Inc., Tokyo, Japan). Among 15 PFT parameters, FEV1/FVC and FEV1% predicted value were selected for this study.
CT Scanning
All patients underwent breath-hold training before CT scanning, and assumed a supine position with arms above the head. No contrast-enhanced volumetric chest CT scanning was performed at the end of inspiration and expiration using a 256-slice CT scanner (Brilliance-iCT, Philips Medical Systems, The Netherlands) from the thoracic inlet to the diaphragm, respectively. The following CT scanning parameters were used: collimation 128×0.625 mm, tube energy 120 kV, Z-axial and 3D automatic tube current modulation, Doseright collimator (Philips Healthcare) was on and reduced dose level 3 (inspiratory/expiratory scanning), pitch 0.915, slice thickness 1 mm, slice increment 1 mm, Field of View (FOV) 350 mm*350 mm, matrix 512*512, high and standard resolution algorithms.
Image Analysis
Image analysis was performed by a thoracic radiologist with 20 years experience who was blinded to patient’s clinical information and PFT results. The PRM was analyzed with commercial software (A-VIEW, Suhai Alderi Information Technology Ltd., Dubai, UAE). The voxels were divided into four categories according to CT values on paired respiratory CT images: 1) Emphysema, voxels less than or equal to −950 HU on the inspiratory image and less than −856 HU on the expiratory image; 2) fSAD, voxels greater than −950 HU on the inspiratory image and less than or equal −856 HU on the expiratory image; 3) Normal lung, voxels greater than −950 HU on the inspiratory image and greater than −856 HU on the expiratory image; and 4) Uncategorized tissue, voxels less than −950 HU on the inspiratory image and greater than −856 HU on the expiratory image. The total volume as well as the volume percentage of each voxel category were calculated on the levels of whole lung, left lung, right lung, and fives lobes, respectively.
Random Forest Classification Model Construction
To find a threshold of FEV1% predicted value that has the best correspondence between PRM parameters and PFT result, we took 80 thresholds from 50% to 129% with a partition of 1% as experimental threshold to differentiate the high-risk group from the normal group. We established a random forest classification model under each of the 80 thresholds. Random forest is a type of ensemble learning, where the key idea is to combine multiple weak classifiers to obtain a strong classifier with significant classification performance. Therefore, compared with other machine learning algorithms (eg, ANN, SVM, logistic regression), random forests have the advantages of high generalization ability, easy parallel training, can handle high-dimensional data, and do not require feature selection. The 80 classification models were set with identical parameters: the number of estimators was 71, which means our random forest model consisted of 71 sub-estimators (decision trees), and it ensembled the classification results of all 71 estimators by voting when it made predictions. Details are presented in the Supplementary File. Seventy-two PRM parameters acquired on the whole lung, left lung, right lung, and five lobes levels, as well as the patients’ sex, age, height and weight, were included for model construction.
Random Forest Classification Model Training and Evaluation
Under each threshold, each sample was first labeled normal or high risk by comparing its FEV1% predicted value and the selected threshold: if the FEV1% predicted value was lower than the threshold value, the case was labeled as high risk; if the FEV1% predicted value was higher than or equal to the threshold value, it was labeled as normal. To avoid the effect of randomness in the partitioning of the training and test datasets, the classification performance of the model above was evaluated using 10-fold Monte Carlo cross-validation. For each cross-validated fold, the whole dataset was randomly partitioned into a training set (70% of cases) and test set (30% of cases). To fairly compare the performance of the 80 prediction models, the AUC (Area under ROC curve) value, a threshold-independent metric, was calculated for each model. The average AUC of all ten folds was calculated as the final performance metric under the particular threshold. The AUC values for each selected threshold were plotted on a line chart. Finally, class probability threshold dependent performance metrics, such as sensitivity, specificity, and accuracy, were calculated under the clinically applied FEV1% pre-thresholds (80% and 95%) and the FEV1% pre-threshold where the classification model has the highest performance. These class probability threshold-dependent performance metrics were calculated under the probability threshold where the Youden Index (sensitivity + specificity – 1) reaches maximum.
Statistical Analysis
Statistical analyses were performed using SPSS 26.0 software (IBM SPSS Statistics, Armonk, NY) and R language platform (Version 4.0.0, R foundation for Statistical Computing). The parameters for the questionnaire survey and PRM were compared between groups using Student’s t-tests and one-way ANOVA for normally distributed values and using Mann–Whitney U-tests and Kruskal Wallis tests for non-normally distributed data. The classification models were constructed with the class “Random Forest Classifier ()” from the Scikit-learn toolkit, Version 0.23.2 (Python Software Foundation, Fredericksburg, VA); (https://scikit-learn.org/stable/index.html).17 Programming was based on the Python 3.6.12 platform (Python Software Foundation). All reported p-values were two-sided with a 0.05 significance level.
Results
Non-COPD Subjects’ Demographic and Clinical Characteristics, PFT Parameters, and 72 PRM Parameters
Among the 861 consecutive subjects included in screening for three major chest diseases in our hospital from August to October 2018, 246 subjects were excluded. Six hundred and fifteen subjects with paired respiratory phases CT, PFT, questionnaires, and PRM, were divided into non-COPD group (n=561) and COPD group (n=54). Finally, 561 non-COPD subjects were eligible for further analysis (Figure 1). Table 1 shows baseline characteristics and PRM parameters at the whole lung level of 561 non-COPD subjects. Supplementary Table 1 shows PRM parameters at the level of right/left lung and five lobes of 561 non-COPD subjects.
 |
Table 1 Descriptive Statistics for Clinical, Demographic, PFT Parameters, and PRM Parameters at Whole Lung Level for 561 Non-COPD Subjects |
 |
Figure 1 Flowchart of the included subjects. |
High Risk Redefinition by Selecting the Threshold of FEV1% Predicted Value with Random Forest Classification Model
The model performance metrics, including the AUC, sensitivity, specificity, and accuracy for the thresholds of 72%, 80%, and 95% are listed in Table 2. The results of machine learning-based parameter mapping on PRM parameters showed that AUC was 0.84 when the threshold was 72%, representing the best AUC under different thresholds of FEV1% predicted value. When the threshold was 95%, the AUC was 0.64; when threshold was 80%, the AUC was 0.72. The line chart is shown in Figure 2. Sensitivity and accuracy in model for the threshold of 72% were greater than those in models for the threshold of 80% and 95%. Specificity in the model under the threshold of 72% and 80% was higher than that in the model for the threshold of 95%. Besides, we also summarized the top 10 features that contributed the most to the classification of these models (Supplementary Table 2). In the models under the threshold of 72% and 80%, the first feature was age. In the model for the threshold of 95%, the first feature was emphysema volume percentage of the right lower lobe.
 |
Table 2 Proportion and Classification Performance of Normal and High-Risk Groups |
 |
Figure 2 Average AUC values under different thresholds of FEV1% predicted value. |
According to the three different thresholds of FEV1% predicted value shown above, 561 non-COPD subjects were divided into a normal group and high-risk COPD group. Table 2 shows the proportion and classification performance of normal and high-risk subjects under the three different thresholds of 72%, 80%, and 95%. Of the 561 non-COPD subjects, 27 (4.8%) subjects were classified as high-risk patients when the threshold was 72%; 65 (11.6%) subjects were classified as high-risk patients when the threshold was 80%; and 194 (34.6%) subjects were classified as high-risk patients when the threshold was 95%. The histogram of population frequency distribution for the three different thresholds is shown in Figure 3.
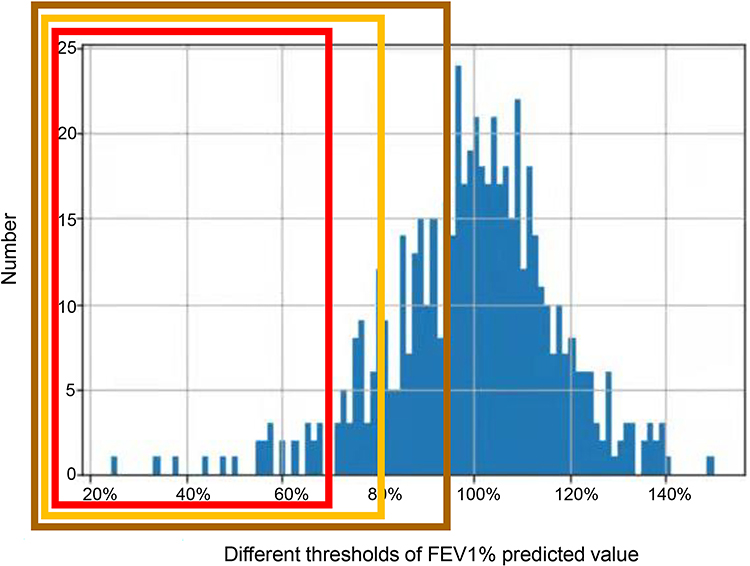 |
Figure 3 Histogram of population frequency distribution for three different thresholds. Red box indicates number of subjects for threshold of 72%, yellow box indicates number of subjects for threshold of 80%, and brown box indicates number of subjects for threshold of 95%. |
Table 3 shows the differences in demographic characteristics between the normal group and high-risk group with different thresholds of FEV1% predicted value. When the threshold was 72% or 80%, no significant differences in age, height, and weight were observed between the normal group and high-risk group (P>0.05). The two subgroups were mildly different with respect to age, height, and weight when the threshold was 95% (P<0.05). When the threshold was 80% or 95%, the number of males was more than the number of females in high-risk COPD group (P=0.01). There was no significant difference in BMI between the high-risk group and normal group among with different thresholds (P>0.05). The differences in PRM parameters at the whole lung level between the normal group and high-risk group with different thresholds of FEV1% predicted value is shown in Table 4 and Figure 4. Among different thresholds, volume of emphysema and fSAD in the high-risk group were higher than those in the normal lung group (P<0.05). Volume of normal lung in the high-risk group was lower than that in the normal group (P<0.05). When the threshold was 72%, the difference values (D-values) of volume of emphysema, volume of fSAD, and volume of normal lung between the normal and high-risk groups were 2.31, 10.25, and 12.75, respectively. Moreover, the D-value was the greatest between the normal and high-risk groups when the threshold was 72%. Figure 5 shows four subjects with PRM and corresponding CT manifestations.
 |
Table 3 Difference in Demographics Between Normal and High-Risk Groups with Different Thresholds of FEV1% Predicted Value |
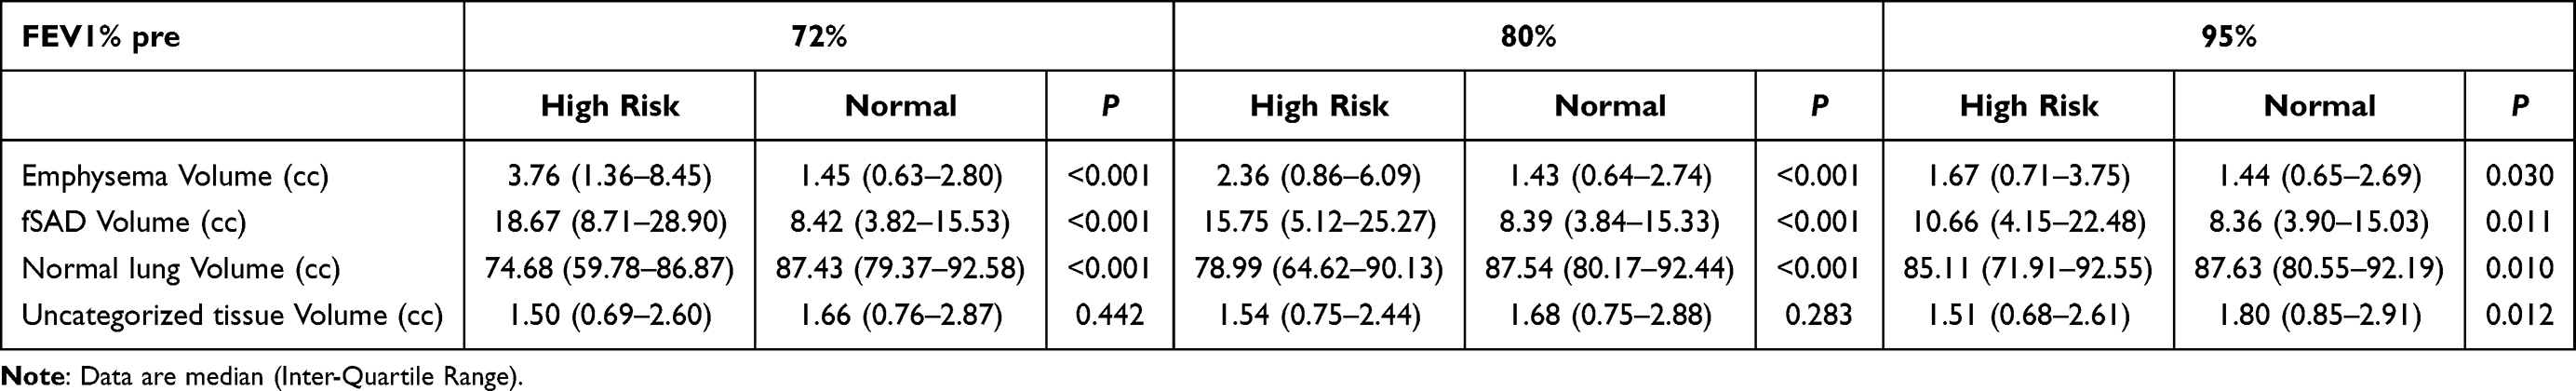 |
Table 4 Differences in PRM Parameters at Whole Lung Level Between Normal and High-Risk Groups with Different Thresholds of FEV1% Predicted Value |
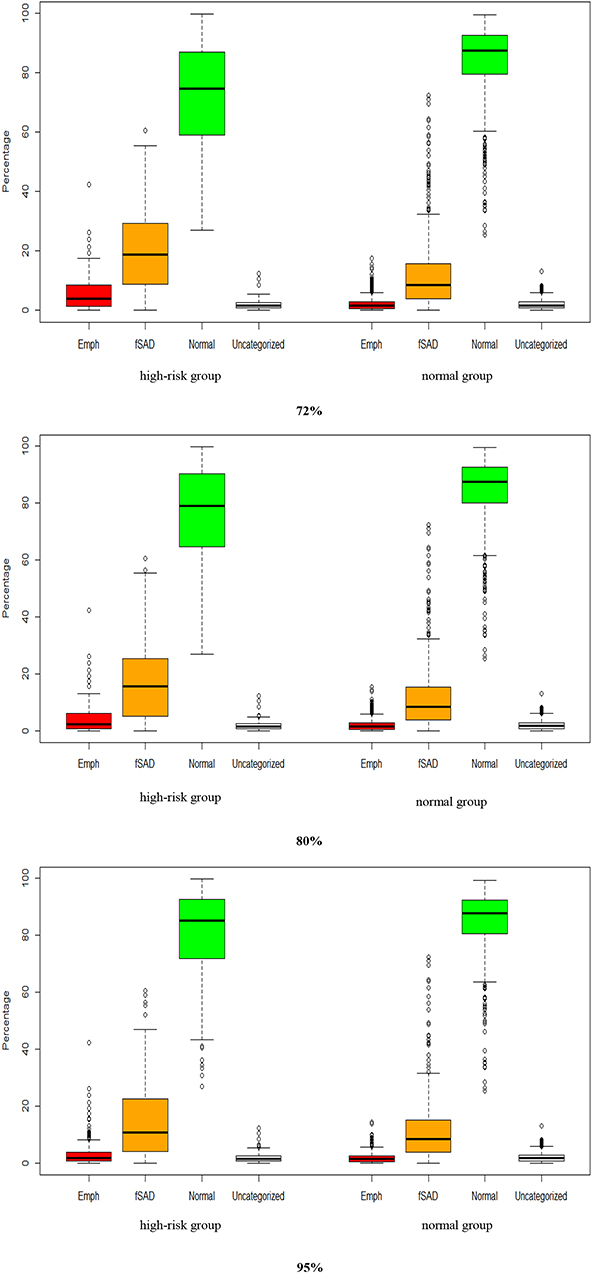 |
Figure 4 Box plot of PRM parameters in whole lung between normal group and high-risk group with different thresholds of FEV1% predicted value. |
 |
Figure 5 PRM and CT manifestations of four subjects. Subject A with the ratio of FEV1 and FVC was 0.74 and FEV1% predicted value was 71%, was assigned to high-risk whatever FEV1% threshold was. And this was verified by fSAD that was shown in PRM and CT manifestations. Subject B with FEV1/FVC of 0.77 and FEV1% predicted value of 78%, was divided as high-risk group according to 80% predicted value and subject C with FEV1/FVC of 0.87 and FEV1% predicted value of 80%, was also divided as high-risk group to 95% predicted value. Subject B and C were divided into normal group when FEV1% predicted value was 72%, CT finding and PRM of them was normal. Subject D was divided as normal group for FEV1/FVC of 0.94 and FEV1% predicted value of 97%, and the CT finding and PRM were normal. |
Discussion
When FEV1% predicted value was 72%, the best AUC and classification performance between high-risk COPD group and normal group were identified by the present study. This result satisfied our original goal of finding a reasonable threshold of FEV1% predicted value that showed better consistency with the PRM-based machine learning classification model.
The high-risk criteria for COPD remain controversial. The PRISm patients had respiratory-related symptoms and activity limitations, but without marked emphysema or gas trapping.18 About 37.8% of PRISm patients with moderate risk airway-predominant disease progressed to GOLD II–IV status during 5-year follow-up.19 Chen et al11 defined high-risk COPD patients as those with FEV1/FVC >0.70 and FEV1% predicted value <95%. Regan et al8 defined the high-risk COPD patients as those with FEV1/FVC >0.70 and an FEV1% predicted value ≥80%; those authors also found that 54.1% of high-risk COPD patients had one or more respiratory-related impairments and 42.3% showed emphysema or airway thickening on CT images. Recent studies have paid attention to redefining the COPD diagnosis based on imaging and GOLD criteria. For example, the Global Initiative for Chronic Obstructive Lung Disease 2020 Report proposed redefining the diagnosis of COPD based on environmental exposure, clinical symptoms, CT imaging, and spirometric criteria.20,21 In this study, the PFT results and CT-derived PRM were considered in order to acquire the best consistency between FEV1% predicted value and PRM parameters through machine learning and to redefine high-risk COPD. Until now, to the best of our knowledge, this type of study design was relatively rare.
An interesting AUC curve has been discovered. A peak appears in AUC curve, and the threshold corresponding to the peak AUC value was 72%. Airflow obstruction and formation of emphysema could cause a decrease of FEV1. Functional small airway disease and emphysema assessed by PRM were associated with FEV1 decline.22 As the decrease of FEV1% predicted value, greater difference of PRM parameters between the normal group and high-risk COPD group and better classification accuracy of the model between subgroups were found. The lower FEV1% predicted value, the lower percentage of high-risk COPD patients. When the threshold was 72%, only 4.8% of 561 non-COPD subjects would be classified as high-risk group with the greatest AUC, which was based on the CT-derived 72 PRM parameters. More parameters were considered, the more accurate and real of the definition of high-risk COPD. But, under thresholds less than 72%, more subjects were categorized as normal people by the model. A serious imbalance of numbers between two subgroups affected the classification efficiency of the model. Under thresholds more than 72%, more subjects were divided into the high-risk COPD group. With the increase of FEV1% predicted value, the difference of PRM parameters between the high-risk group and normal group gradually decreased, and also the AUC value gradually lowered to below 0.84.
Age has been recognized as an important factor contributing to rapid decline of FEV1. An accelerated decline in FEV1 is accelerated with age among COPD patients.23 There was a little difference in age between the high-risk group and normal group only when FEV1% predicted value was 95%. Compared with previous studies, participants included in this study were consistent in age; all participants were community residents over 40 years old. Once thought of primarily as a disease of men, the prevalence of COPD has rapidly increased among women during the past two decades. There were different gender phenotypes in exacerbations, comorbidities, and prognosis of COPD.24 Our study found a gender difference between high-risk COPD and the normal group. Low BMI was an important risk factor for the development of COPD, and a predictor for COPD severity.25 BMI of COPD patients was significantly lower than that of non-COPD subjects.26 However, we found no significant difference in BMI between the high-risk COPD group and normal group among different thresholds. The following factors may contribute to this finding. All subjects in this study came from economically-advanced city, good education, wealthy, great nutritional status, socioeconomic status, and cognizance of exercise may contribute to the subgroups without BMI difference.
This study has several limitations. First, this study was conducted at a single center using retrospective data, which may limit the generalization and applicability to other populations or locations. Further multi-center study is needed to confirm results of this study. Second, the optimal threshold of FEV1% predicted value was based on a PRM-based machine learning classification model, and more models are needed to compare the performances. Third, parameters of clinical evaluation including the smoking histories, clinical symptom, and 6-minute walk test were not included in our classification model, which may limit interpretation of high risk. Fourth, the progress status based on FEV1% predicted value should be further explored prospectively over a longer period by follow-up in the future.
Conclusion
Machine learning-based PRM was feasible for redefining high-risk COPD. The optimal FEV1% predicted value was 72% and showed good consistency of PFT parameters and radiological PRM parameters, which would help to clarify the high risk COPD considering both the PFT and CT-based PRM, and instruct early clinical intervention and control its progression.
Abbreviations
COPD, chronic obstructive pulmonary disease; PRM, parameter response mapping; PFT, pulmonary function test; GOLD, global initiative for obstructive lung disease; FEV1, forced expiratory volume in 1 second; FVC, forced vital capacity; PRISm, preserved ratio impaired spirometry; FEV1% pre, FEV1% predicted value; fSAD, functional small airway diseases; FOV, field of view.
Data Sharing Statement
The data sets supporting the conclusion of this article are included within the article. All data are available from the corresponding author upon reasonable request.
Acknowledgments
We greatly appreciate Mr. Qi Chen (Department of Statistics, Naval Medical University, Shanghai, China) for his assistance in statistical analysis.
Author Contributions
All authors made a significant contribution to the work reported, whether that is in the conception, study design, execution, acquisition of data, analysis and interpretation, or in all these areas; took part in drafting, revising, or critically reviewing the article; gave final approval of the version to be published; have agreed on the journal to which the article has been submitted; and agree to be accountable for all aspects of the work.
Funding
This work was supported by the the National Natural Science Foundation of China [grant number 81871321, 81930049, 82171926], National Key R&D Program of China [grant number 2022YFC2010002, 2022YFC2010000], The clinical Innovative Project of Shanghai Changzheng Hospital [grant number 2020YLCYJ-Y24]; The program of Science and Technology Commission of Shanghai Municipality [grant number 21DZ2202600], The program of Science and Technology Innovation Action Plan of Shanghai Municipality [grant number 19411951300], Shanghai Sailing Program [grant number 20YF1449000] and Pyramid Talent Project of Shanghai Changzheng Hospital.
Disclosure
The authors of this manuscript declare no conflicts of interest with any companies, whose products or services may be related to the subject matter of the article.
References
1. GBD 2017 Causes of Death Collaborators. Global, regional, and national age-sex-specific mortality for 282 causes of death in 195 countries and territories, 1980–2017: a systematic analysis for the Global Burden of Disease Study 2017. Lancet. 2018;392(10159):1736–1788.
2. Rabe KF, Watz H. Chronic obstructive pulmonary disease. Lancet. 2017;389(10082):1931–1940.
3. Celli BR, Agustí A. COPD: time to improve its taxonomy? ERJ Open Res. 2018;4(1):00132–2017.
4. Koo HK, Vasilescu DM, Booth S, et al. Small airways disease in mild and moderate chronic obstructive pulmonary disease: a cross-sectional study. Lancet Respir Med. 2018;6(8):591–602.
5. Jobst BJ, Weinheimer O, Buschulte T, et al. Longitudinal airway remodeling in active and past smokers in a lung cancer screening population. Eur Radiol. 2019;29(6):2968–2980.
6. Takayanagi S, Kawata N, Tada Y, et al. Longitudinal changes in structural abnormalities using MDCT in COPD: do the CT measurements of airway wall thickness and small pulmonary vessels change in parallel with emphysematous progression? Int J Chron Obstruct Pulmon Dis. 2017;12:551–560.
7. Guan ZHUBJ. HB. The application of quantitative CT in the diagnosis and treatment of COPD. J Pract Radio. 2018;34:1994.
8. Regan EA, Lynch DA, Curran-Everett D, et al. Clinical and radiologic disease in smokers with normal spirometry. JAMA Intern Med. 2015;175(9):1539–1549.
9. Çolak Y, Afzal S. Prognostic significance of chronic respiratory symptoms in individuals with normal spirometry. Eur Respir J. 2020;55(1):1902226.
10. Woodruff PG, Barr RG, Bleecker E, et al. Clinical significance of symptoms in smokers with preserved pulmonary function. N Engl J Med. 2016;374(19):1811–1821.
11. Chen S, Wang C, Li B, et al. Risk factors for FEV1 decline in mild COPD and high-risk populations. Int J Chron Obstruct Pulmon Dis. 2017;12:435–442.
12. Wan ES, Castaldi PJ, Cho MH, et al. Epidemiology, genetics, and subtyping of preserved ratio impaired spirometry (PRISm) in COPDGene. Respir Res. 2014;15(1):89.
13. Xia Y, Guan Y, Fan L, et al. Dynamic contrast enhanced magnetic resonance perfusion imaging in high-risk smokers and smoking-related COPD: correlations with pulmonary function tests and quantitative computed tomography. COPD. 2014;11(5):510–520.
14. Fan L, Xia Y, Guan Y, et al. Capability of differentiating smokers with normal pulmonary function from COPD patients: a comparison of CT pulmonary volume analysis and MR perfusion imaging. Eur Radiol. 2013;23(5):1234–1241.
15. Kirby M, Yin Y, Tschirren J, et al. A novel method of estimating small airway disease using inspiratory-to-expiratory computed tomography. Respiration. 2017;94(4):336–345.
16. Galbán CJ, Han MK, Boes JL, et al. Computed tomography-based biomarker provides unique signature for diagnosis of COPD phenotypes and disease progression. Nat Med. 2012;18(11):1711–1715.
17. Pedregosa F, Varoquaux G, Gramfort A, et al. Scikit-learn: machine learning in Python. J Machine Res. 2011;12:2825–2830.
18. Stringer WW, Porszasz J, Bhatt SP, McCormack MC, Make BJ, Casaburi R. Physiologic insights from the COPD genetic epidemiology study. Chronic Obstr Pulm Dis. 2019;6(3):256–266.
19. Young KA, Strand M, Ragland MF, et al. Pulmonary subtypes exhibit differential global initiative for chronic obstructive lung disease spirometry stage progression: the COPDGene® study. Chronic Obstr Pulm Dis. 2019;6(5):414–429.
20. Lowe KE, Regan EA, Anzueto A, et al. COPDGene® 2019: redefining the diagnosis of chronic obstructive pulmonary disease. Chronic Obstr Pulm Dis. 2019;6(5):384–399.
21. Balkissoon R. Journal Club-COPD2020 update. global initiative for chronic obstructive lung disease 2020 report and the journal of the COPD foundation special edition, moving to a new definition for COPD: ”COPDGene® 2019”. Chronic Obstr Pulm Dis. 2019;6(4):64–72.
22. Bhatt SP, Soler X, Wang X, et al. Association between functional small airway disease and FEV1 decline in chronic obstructive pulmonary disease. Am J Respir Crit Care Med. 2016;194(2):178–184.
23. Kim SJ, Lee J, Park YS, et al. Age-related annual decline of lung function in patients with COPD. Int J Chron Obstruct Pulmon Dis. 2015;11:51–60.
24. Grabicki M, Kuźnar-Kamińska B, Rubinsztajn R, et al. COPD course and comorbidities: are there gender differences? Adv Exp Med Biol. 2019;1113:43–51.
25. Zhou Y, Wang D, Liu S, et al. The association between BMI and COPD: the results of two population-based studies in Guangzhou, China. COPD. 2013;10(5):567–572.
26. Ran PX, Wang C, Yao WZ, et al. A study on the correlation of body mass index with chronic obstructive pulmonary disease and quality of life. Zhonghua Jie He He Hu Xi Za Zhi. 2007;30(1):18–22.
 © 2022 The Author(s). This work is published and licensed by Dove Medical Press Limited. The full terms of this license are available at https://www.dovepress.com/terms.php and incorporate the Creative Commons Attribution - Non Commercial (unported, v3.0) License.
By accessing the work you hereby accept the Terms. Non-commercial uses of the work are permitted without any further permission from Dove Medical Press Limited, provided the work is properly attributed. For permission for commercial use of this work, please see paragraphs 4.2 and 5 of our Terms.
© 2022 The Author(s). This work is published and licensed by Dove Medical Press Limited. The full terms of this license are available at https://www.dovepress.com/terms.php and incorporate the Creative Commons Attribution - Non Commercial (unported, v3.0) License.
By accessing the work you hereby accept the Terms. Non-commercial uses of the work are permitted without any further permission from Dove Medical Press Limited, provided the work is properly attributed. For permission for commercial use of this work, please see paragraphs 4.2 and 5 of our Terms.