")
Back to Journals » OncoTargets and Therapy » Volume 13
RCC2 Interacts with Small GTPase RalA and Regulates Cell Proliferation and Motility in Gastric Cancer
Authors Wang P, Zhang W , Wang L, Liang W , Cai A, Gao Y, Chen L
Received 27 August 2019
Accepted for publication 29 December 2019
Published 14 April 2020 Volume 2020:13 Pages 3093—3103
DOI https://doi.org/10.2147/OTT.S228914
Checked for plagiarism Yes
Review by Single anonymous peer review
Peer reviewer comments 3
Editor who approved publication: Professor Gaetano Romano
Pengpeng Wang,1,2 Wang Zhang,2 Lili Wang,2 Wenquan Liang,2 Aizhen Cai,2 Yunhe Gao,2 Lin Chen1,2
1School of Medicine, Nankai University, Tianjin 300071, People’s Republic of China; 2Department of General Surgery, Chinese People’s Liberation Army General Hospital, Beijing 100853, People’s Republic of China
Correspondence: Lin Chen
Department of General Surgery, Chinese People’s Liberation Army General Hospital, Fuxing Road 28#, Haidian District, Beijing 100853, People’s Republic of China
Email [email protected]
Background: Regulator of chromosome condensation 2 (RCC2), also known as TD-60, is associated with various human malignant cancers. RCC2 has been shown to exhibit guanine exchange factor (GEF) activity and contribute to early mitosis. However, the role and mechanism of RCC2 in gastric cancer remain unclear.
Materials and Methods: RCC2 expression in gastric cancer was studied using qPCR, Western blotting and immunochemistry staining of clinical specimens, and its roles in the cytobiology, mouse model and related molecular pathways were evaluated using gastric cell lines.
Results: RCC2 was frequently overexpressed in gastric cancer. RCC2 knockdown significantly inhibited cell proliferation, migration and invasion in vitro, which was further confirmed by the RCC2 overexpression results in gastric cancer cells. Moreover, RCC2 knockdown inhibited tumor progression in vivo. Further study revealed the interaction between RCC2 and RalA. The level of RalA-GTP was decreased in gastric cancer cells after RCC2 knockdown, while an increased phosphorylation level in MAPK/JNK was found. Furthermore, the changes in the level of RalA-GTP as well as cell proliferation, migration and invasion abilities were further confirmed using RBC8, a specific small-molecule inhibitor of the intracellular actions of Ral GTPases, in gastric cancer cells.
Conclusion: RCC2 plays an important role in gastric cancer. RCC2 knockdown inhibits cell growth, cell motility and tumor progression, which may act through RalA and affect the MAPK/JNK pathway.
Keywords: RCC2, RalA, gastric cancer, proliferation, migration and invasion
Introduction
Gastric cancer is a malignant tumor originating from the gastric mucosal epithelium, and it is one of the most prevalent malignant tumors, ranking fifth and third in terms of morbidity and mortality, respectively, among cancers worldwide.1 Gastric cancer ranks second in cancer morbidity and mortality with an estimated 679,000 new gastric cancer cases and 498,000 deaths in China in 2015.2 In addition, there are fewer early gastric cancer patients in China compared to patients in the US, and gastric cancer patients in China have larger tumors that are discovered at a later stage. Due to later detection combined with possible environmental and genetic risk factors, the probability of five-year death from gastric cancer is higher in Chinese patients after surgery than in American or Korean patients.3 Although the prognosis of gastric cancer has gradually improved with the use of multiform treatments, such as chemotherapy, surgery, radiotherapy and combination therapy, the overall treatment status for gastric cancer is still not optimistic, and the underlying mechanisms of the progression of gastric cancer remain unclear. The mechanism of gastric cancer-related genes needs to be further elucidated.
Regulator of chromosomal condensation 2 (RCC2), also known as TD-60, has been found to be required for the maintenance of the normal cell cycle.4,5 Recently, it has been shown that RCC2 is frequently overexpressed, and its overexpression is related to poor prognosis in lung adenocarcinoma.6 In colon cancer, mutations in the 5ʹUTR region of RCC2, which is associated with reduced expression of the protein, have been found to be an independent marker for improved outcomes in microsatellite-instable patients.7 RCC2 has been shown to exhibit functions by regulating the activity of small GTPases, including Rac1 and RalA.8,9 RalA belongs to a small GTPase superfamily named the Ras family of proteins. RalA activation has been shown to be associated with various human cancers, including pancreatic cancer,10,11 colorectal cancer,12 hepatocellular carcinoma,13 lung cancer,14 and prostate cancer.15 RalA has oncogenic effects and plays a multifunctional role in regulating tumor initiation and metastasis.16 The MAPK/JNK signaling pathway is involved in tumorigenesis and progression through interaction with a wide range of molecules, and it plays an important role in both cell proliferation and cell death.17 Our results revealed that RCC2 is often highly expressed in gastric cancer, but the function and underlying mechanisms have rarely been reported. Therefore, we investigate the effect and further details of RCC2 in gastric cancer in this study.
Our results indicated that RCC2 is commonly overexpressed in gastric cancer and may act as a tumor-promoting factor. Knockdown of RCC2 inhibits cell growth and motility, while RCC2 overexpression yields the opposite results. RCC2 may act, at least in part, through RalA, and knockdown of RCC2 may also affect the MAPK/JNK pathway.
Materials and Methods
Tissues and TMAs
Gastric cancer tissues (n=133) and paired adjacent normal tissues (n=133) were collected from 2015 to 2018 at the Chinese PLA General Hospital. All patients provided written informed consent. The study was approved by the Ethics Committee of the Chinese PLA General Hospital and was conducted in accordance with the Declaration of Helsinki. Tissue microarrays containing 115 paired gastric cancer tissues were created using the tissues obtained above. Histochemistry score (H-score) was used to assess the results of tissue microarray immunohistochemistry. The formula for H-score is as follows: H-score = (percentage of cells of weak intensity × 1) + (percentage of cells of moderate intensity × 2) + (percentage of cells of strong intensity × 3).
Cell Culture, Transfection and Chemicals
The SGC-7901 and MGC-803 human gastric cancer cell lines were purchased from the Institute of Basic Medical Sciences, Chinese Academy of Medical Sciences. All cells were cultured in DMEM (Gibco, USA) supplemented with 10% FBS (Kangyuan Biology, China) at 37°C and 5% CO2 in a cell incubator with standard humidity. Two effective siRNAs (5ʹ-GGUGAUAGCAAGAGAUGAA-3ʹ and 5ʹ-GGGACUUGAUUGGUCGAAA-3ʹ) and a negative control siRNA were transfected using Chemifect-R (Fengrui Biotechnology, China). The shRNA vector (shared the corresponding sequence as siRNA1) and the RCC2 overexpression vector were constructed using pLV-U6-MCS-luc-puro and pLV-CMV-MCS-3flag-luc-puro vectors (Hanbio, China). Vectors were transfected using Chemifect (Fengrui Biotechnology, China). To establish stable cell lines, lentiviral vectors were transfected into 293TN cells, and recombinant lentivirus was extracted and concentrated after 48 hrs of transfection. SGC-7901 and MGC-803 cells were infected with titer-determined lentivirus, and stably transfected cells were screened using puromycin (Beyotime Biotechnology, China). RBC8 was obtained from TargetMol (USA).
Western Blotting
Tissues and cells were lysed with RIPA lysis buffer (Beyotime Biotechnology, China). The concentrations of the protein extracts were determined using a BCA Protein Assay Kit (Pierce, USA). Equal amounts of cell lysates were separated by SDS-PAGE, transferred to PVDF membranes, and then blocked in 1x TBST with 5% skim milk. Membranes were incubated in primary antibodies overnight at 4°C and then with HRP-conjugated secondary antibodies (Zhongshan Golden Bridge, China) for 2 hrs. Chemiluminescent imaging was performed to detect the immunoreactivity signals using Tanon High-sig ECL Western Blotting Substrates (Tanon Science & Technology, China). The following primary antibodies were used: RCC2, MKK4, Ser257/Thr261p-MKK4, JNK, Thr183/Tyr185p-JNK, c-Jun, Ser63p-c-Jun, ATF-2, Thr71p-ATF-2, STAT3, Ser727p-STAT3, Bcl-2, Ser70p-Bcl-2, Bax, Flag, RalA (all from Cell Signaling Technology, USA), Thr167p-Bax (Biorbyt, UK) and GAPDH (Proteintech, USA).
qRT-PCR
In brief, total RNA was extracted using Trizol (Invitrogen, USA), and RNA concentration and purity were measured using a Nanodrop 2000 (Thermo Fisher Scientific, USA). First-strand cDNA was synthesized using a RevertAid First Strand cDNA Synthesis Kit (Thermo Fisher Scientific, USA). Specific primers (RCC2 forward, 5ʹ-GGTCTTAGCCACGAAGTGATTG-3ʹ; RCC2 reverse, 5ʹ-TCGTACTCTATCCGCTGTGCC-3ʹ; actin forward, 5ʹ-CACCCAGCACAATGAAGATCAAGAT-3ʹ; and actin reverse, 5ʹ-CCAGTTTTTAAATCCTGAGTCAAGC-3ʹ) were synthesized by Servicebio (China). FastStart Universal SYBR Green Master (ROX) (Roche, Switzerland) was used to configure the PCR amplification reaction system. Actin was used as an internal control, and RCC2 gene expression was quantified using the 2−ΔΔCt method.
Cell Proliferation and Wound-Healing Assay
Cells were seeded in 96-well plates, and 10 µL of CCK8 reagent (Dojindo Laboratories, Japan) was added per well according to the assay kit instructions at different time points. The absorbance was measured at a wavelength of 450 nm after 1 hr of incubation at 37°C and 5% CO2 with standard humidity.
For the wound-healing assay, cells were grown in 6-well plates, and an artificial wound was carefully created using pipette tips. Images of the wound areas were captured at 0, 24, and 48 hrs after the wound was created.
Cell Migration and Invasion Assays
Migration and invasion assays were performed using a 24-well transwell chamber (Corning, USA). Cells were counted and placed in the upper chamber of the well, and 500 µL of medium containing 20% serum was added to the lower chamber. The transwell chamber was then transferred to a cell incubator and incubated for 24 hrs at 37°C and 5% CO2 with standard humidity. The cells remaining on the upper surface of the chamber were wiped away carefully twice using cotton swabs. The cells that migrated to the lower surface were fixed with 4% paraformaldehyde and then subjected to crystal violet staining. The number of migrated cells from random fields was counted under a microscope. Each value was obtained using at least five random fields.
For the invasion assay, similar procedures were performed. However, cells were incubated for 48 hrs, and equal amounts of Matrigel (Corning, USA), which was melted at 4°C and diluted with serum-free medium, were placed into the upper chamber and incubated at 37°C before counting the cells.
Co-Immunoprecipitation
In brief, 293TN cells were transfected with control or RCC2-3xFlag vector as mentioned above. Cells were lysed using NP-40 lysis buffer after transfection. Supernatants were then collected after centrifugation at 4°C and transferred to preprocessed Flag beads (Sigma-Aldrich, USA) for 2 hrs at 4°C. Beads were collected after centrifugation and were washed three times, and 2x Laemmli buffer was added. After boiling for 10 mins, samples were analyzed by SDS-PAGE and Western blot analysis.
RalA Pull-Down Assay
RalA pull-down was performed using a RalA Activation Assay Biochem Kit (Cytoskeleton, USA). Established SGC-7901 and MGC-803 cell lines with or without RCC2 knockdown (SGC-7901-KD-RCC2 and MGC-803-KD-RCC2; or SGC-7901-NC and MGC-803-NC cells) were cultured and lysed using Cell Lysis Buffer. After the protein concentrations were determined as mentioned above, equivalent protein lysates were incubated with RalBP1-RBD beads at 4°C for 1 hr and then centrifuged and washed. The collected beads were resuspended in 10 µL of 2x Laemmli buffer and boiled followed by SDS-PAGE and Western blot analysis.
Xenograft Experiments
BALB/c nude mice (5−6 weeks old) were purchased from SPF Biotechnology (China) and injected with established MGC-803 cell lines (MGC-803-NC and MGC-803-KD cells). Cells were suspended in serum-free DMEM at a density of 2x10⁷/mL, mixed with Matrigel (Corning, USA) at a 1:1 ratio, and subsequently injected into the right dorsum of each mouse at a dose of 200 µL. Neoplasms were identified and measured twice per week. Tumor volumes were calculated using the following formula: V (mm3) = (L x W2)/2 (L, long diameter; W, wide diameter). Bioluminescence imaging was performed using IVIS Spectrum (PerkinElmer, USA) to detect xenograft tumors at 14 days after cancer cell injection. Briefly, mice from each group were injected intraperitoneally with 150 mg/kg luciferin (PerkinElmer, USA) 10−15 mins before in vivo imaging. After 2 weeks, mice were sacrificed, and tumors were collected for further hematoxylin and eosin (HE) staining and IHC analysis. All animal experiments were conducted in accordance with the regulations of the Administration of Laboratory Animals and were approved by the Medical Laboratory Animal Center of the Chinese PLA General Hospital.
Immunohistochemistry
Tissues were fixed with 4% paraformaldehyde, dehydrated, embedded in paraffin wax, and sectioned. After deparaffinization and rehydration, EDTA was used for antigen retrieval, and 3% H2O2 was added to block endogenous peroxidase. Sections were then blocked in 3% BSA for 30 mins at room temperature. Primary antibodies (RCC2, Abcam; p-JNK, Cell Signaling Technology) were added and incubated at 4°C overnight. HRP-conjugated secondary antibodies (Servicebio, China) were added, and sections were incubated for 50 mins at room temperature. DAB reagents were used for the color reaction followed by counterstaining with hematoxylin.
Statistical Analysis
Experimental data were displayed as the mean ± SD, and graphics were generated using GraphPad Prism version 7. Differences among experimental data were analyzed using Student’s t test, nonparametric tests or ANOVA according to the data model, and P<0.05 was considered statistically significant.
Results
RCC2 Is Frequently Overexpressed in Gastric Cancer
To identify if RCC2 is differentially expressed in tumor tissues and normal tissues, we performed quantitative RT-PCR on 11 paired samples of tumor and normal tissues. The mRNA level of RCC2 was significantly higher in tumor tissues than in normal tissues (Figure 1A). To confirm these results, we analyzed the RCC2 mRNA expression level in gastric cancer in the TCGA and GTEx databases using GEPIA. The results revealed consistent differences in tumor and normal tissues in gastric cancer (Figure 1B). We next investigated the protein expression of RCC2 in gastric cancer by performing IHC and using H-score to measure the protein expression in 115 paired tissues. The H-score for RCC2 was significantly higher in tumor tissues than in normal tissues (Figure 1C). Furthermore, RCC2 was more highly expressed in tumor tissues than in normal tissues in 94 patients (Figure 1D). The IHC results also revealed that RCC2 expression was higher in tumor tissues than in normal tissues from different T, N and pathological stage patients (Figure 1E). Representative IHC images from tumor and normal tissues are shown in Figure 1F, in which the expression of the protein in the cytosol and nucleus is indicated. The different expression levels were further confirmed by Western blotting using alternative tissues (Figure 1G). Moreover, we determined RCC2 expression in the 293TN cell line, a human gastric epithelial cell line (GES-1) and several gastric cancer cell lines (including HGC-27, AGS, MKN-45, SGC-7901, and MGC-803). RCC2 was expressed at lower levels in GES-1 cells than in the gastric cancer cell lines (Figure 1H).
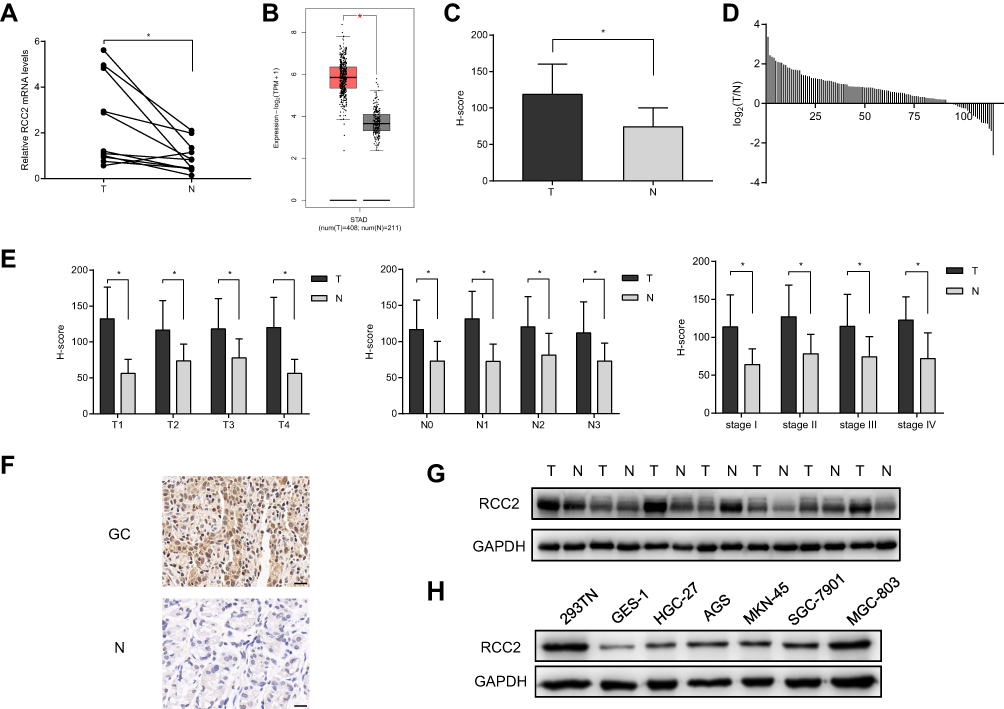 |
Figure 1 RCC2 is upregulated in gastric cancer. (A) Eleven paired samples of gastric cancer tissues (T) and adjacent normal tissues (N) were investigated by quantitative RT-PCR. The RCC2 mRNA level was significantly higher in gastric cancer tissues than in normal tissues. *P<0.05. (B) The RCC2 mRNA level was significantly higher in gastric cancer tissues (T) than in normal tissues (N) in the TCGA and GTEx databases using GEPIA. *P<0.05. (C) The RCC2 protein level was significantly higher in tumor tissues (T) than in adjacent normal tissues (N) according to IHC and H-score. *P<0.05. (D) Log2(T/N) value of the RCC2 H-score of the analyzed samples. T and N represent tumor tissues and adjacent normal tissues, respectively. (E) The RCC2 H-score was higher in tumor tissues (T) than in normal tissues (N) in samples with different T, N, and pathological stages. RCC2 levels were measured using IHC. *P<0.05. (F) Representative IHC images from tumor and normal tissues. Positive staining for RCC2 was found mainly in tumor tissues. Scale bar, 20 µm. (G) RCC2 expression was higher in tumor tissues than in adjacent normal tissues for most paired samples. (H) RCC2 expression in 293TN, GES-1, HGC-27, AGS, MKN-45, SGC-7901 and MGC-803 cell lines. |
RCC2 Knockdown Inhibits Cell Proliferation
SGC-7901 and MGC-803 cells were transfected with two siRNAs specifically targeting RCC2 and an overexpression vector. siRNA transfection efficiency was measured by fluorescence microscopy using FAM-siRNA (data not shown). To confirm the changes in the RCC2 protein expression level, Western blot analysis was performed with an anti-RCC2 antibody. The RCC2 protein level was downregulated in both SGC-7901 and MGC-803 cells after siRNA transfection (Figure 2A), while the RCC2 protein level was upregulated in SGC-7901 and MGC-803 cells after RCC2 overexpression vector transfection (Figure 2B). To further confirm the target gene changes, we performed quantitative RT-PCR to measure the mRNA level of RCC2 in post-transfection cells. The mRNA level was significantly lower or higher in target cells after siRNA or overexpression vector transfection, respectively, than in cells with negative siRNA or control vector transfection (Figure 2C and D). To investigate the effect of RCC2 changes on gastric cancer cell proliferation, a CCK8 assay was used. Knockdown of RCC2 significantly inhibited the growth of both SGC-7901 cells and MGC-803 cells (Figure 2E). In contrast, RCC2 overexpression promoted the proliferation of SGC-7901 cells and MGC-803 cells (Figure 2F). The difference between siRNA groups and vector groups became increasingly significant over time.
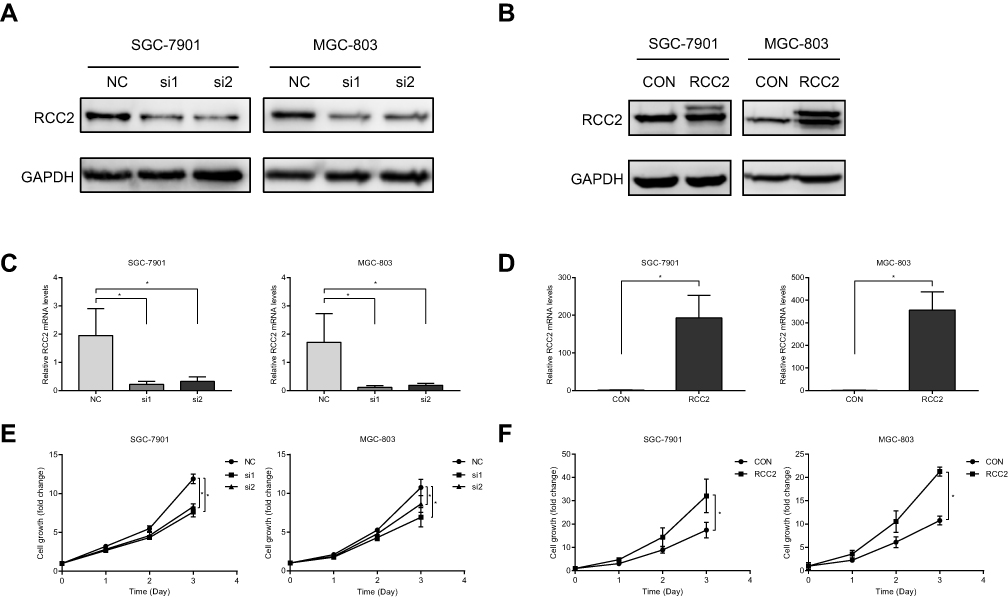 |
Figure 2 RCC2 knockdown inhibits cell proliferation. (A, B) RCC2 protein expression was downregulated or upregulated after RCC2 siRNAs or RCC2 vector transfection, respectively, compared to that after NC siRNA or control vector transfection in SGC-7901 and MGC-803 cells. (C, D) RCC2 mRNA was downregulated or upregulated after RCC2 siRNAs or RCC2 vector transfection, respectively, in SGC-7901 and MGC-803 cells. *P<0.05. (E, F) RCC2 knockdown inhibited cell growth in SGC-7901 and MGC-803 cells, while RCC2 overexpression promoted cell growth in SGC-7901 and MGC-803 cells. *P<0.05. |
RCC2 Knockdown Inhibits Cell Migration and Invasion
To investigate the motility of gastric cancer cells after RCC2 knockdown or overexpression, migration and invasion assays were performed. The migration assay showed that the SGC-7901 and MGC-803 cells migrated less and that fewer cells crossed the membrane when RCC2 was knocked down compared to cells in the NC group. The invasion assay showed a similar trend as mentioned above (Figure 3A and B). When RCC2 was overexpressed, the number of cells that crossed the membrane was increased in both the migration and invasion assays in both cell lines (Figure 3C and D). To further verify the migration ability, wound-healing assays were performed (Figure 3E and F). The images show that RCC2 knockdown inhibited wound closure in both SGC-7901 and MGC-803 cells after 24 hrs or 48 hrs of incubation, while RCC2 overexpression promoted wound closure to some extent. In conclusion, RCC2 downregulation inhibits the migration and invasion of SGC-7901 and MGC-803 cells, and overexpression of RCC2 promotes these abilities.
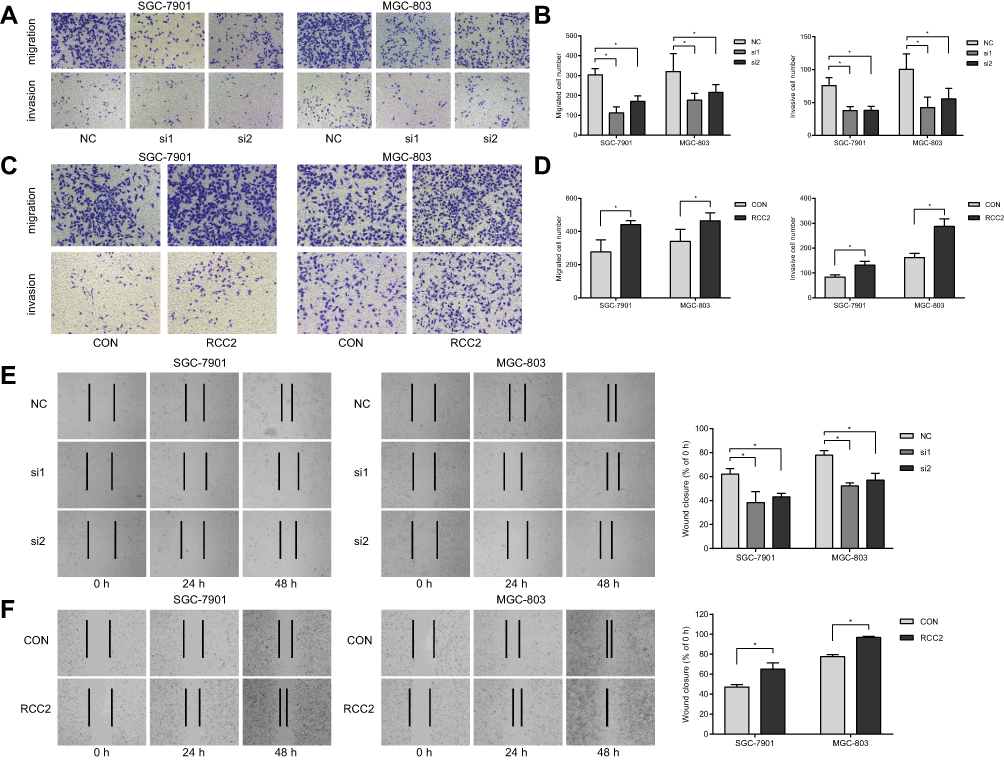 |
Figure 3 RCC2 knockdown inhibits the migration and invasion abilities of SGC-7901 and MGC-803 cells. (A–D) Transwell assays showed that RCC2 knockdown inhibited migration and invasion (A, B) but that RCC2 overexpression promoted migration and invasion (C, D) in SGC-7901 and MGC-803 cells. *P<0.05. (E, F) Wound-healing assays showed that RCC2 knockdown inhibited wound closure (E) but that RCC2 overexpression promoted wound closure (F) in SGC-7901 and MGC-803 cells. Representative images were captured after the wound was created at 0, 24 and 48 hrs. *P<0.05. |
RCC2 Interacts with RalA and Affects the MAPK/JNK Pathway
To investigate the underlying mechanism, a co-IP assay was performed using 293TN cells (Figure 4A). Cells were transfected with the RCC2-3xFlag vector or control vector. RCC2 and Flag were detected by anti-RCC2 and anti-Flag primary antibodies, which showed that the targeted and control vectors were successfully transfected. After processing with Flag beads, endogenous RalA was detected in the RCC2 vector-transfected group but not in the control group. The co-IP results demonstrated the interaction between RCC2 and RalA. It is well known that RalA, a small GTPase, produces an effect by interacting with its downstream effector proteins such as RalBP1 and changing its GTP form to a GDP form.18 To further investigate the interaction between RCC2 and RalA, a RalA pull-down assay was performed to detect changes in RalA-GTP levels using SGC-7901-NC and SGC-7901-KD-RCC2 as well as MGC-803-NC and MGC-803-KD-RCC2 cells (Figure 4B). The results indicated that the level of RalA-GTP was decreased when RCC2 was knocked down in both SGC-7901 and MGC-803 cells. In addition, we investigated several targets in the MAPK/JNK pathway (Figure 4C). Western blot analysis showed that increased levels of phosphorylated proteins were detected, while RCC2 levels were decreased in SGC-7901 and MGC-803 cells. These phosphorylated proteins included p-MKK4, p-JNK, p-c-Jun, p-ATF-2, p-STAT3, p-Bax and p-Bcl-2, which are related to the MAPK/JNK pathway. These results indicated that knockdown of RCC2 may reduce the level of RalA-GTP and affect the MAPK/JNK pathway.
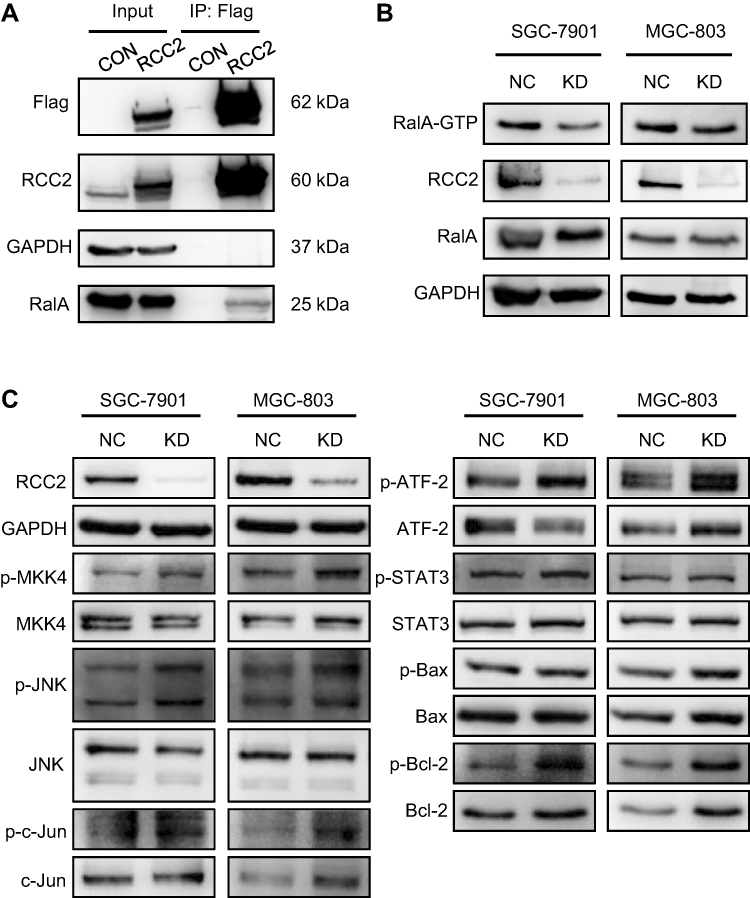 |
Figure 4 RCC2 interacts with RalA, mediating the levels of RalA-GTP and the MAPK/JNK pathway. (A) The interaction between RCC2 and RalA was measured by a co-IP assay after transfection of the RCC2-3xFlag vector or control vector. Endogenous RalA was detected by Western blotting. (B) The RalA-GTP level was measured by a RalA pull-down assay. RalA-GTP was downregulated in the RCC2 knockdown SGC-7901 and MGC-803 groups compared to the NC groups. (C) Western blot assays were performed to detect the phosphorylation of MAPK/JNK pathway. RCC2 knockdown promoted phosphorylation of the MAPK/JNK pathway in SGC-7901 and MGC-803 cells. |
RalA Inhibitor Blocks Cell Proliferation and Motility as Well as Mediates RalA-GTP and the MAPK/JNK Pathway
To confirm the effect of RalA in SGC-7901 and MGC-803 cells, RBC8, a specific small-molecule inhibitor, was used. To investigate the effect of RBC8 on cell proliferation, we performed a CCK8 assay (Figure 5A). The results showed that 20 µM and 40 µM RBC8 significantly inhibited cell growth of SGC-7901 and MGC-803 cells and that 40 µM RBC8 inhibited cell growth better than 20 µM RBC8. We next investigated the effect of RBC8 on cell motility by performing migration and invasion assays (Figure 5B). We found that 20 µM and 40 µM RBC8 significantly reduced the number of cells crossing the membrane in both the migration and invasion assays using SGC-7901 and MGC-803 cells (Figure 5C). To further verify the effect of RBC8 on cell migration, a wound-healing assay was performed (Figure 5D). The images showed that wound closure was slower upon treatment with 20 µM or 40 µM RBC8 than under the control conditions. The inhibition effects of RBC8 on cell proliferation and motility occurred in a dose-dependent manner. To investigate the effect of RBC8 on RalA-GTP, a RalA pull-down assay was performed. Western blot analysis showed that RBC8 decreased the level of RalA-GTP in both SGC-7901 and MGC-803 cells at concentrations of 20 µM and 40 µM (Figure 5E). These results suggested that cell proliferation and motility were inhibited by the blockade of RalA activation via RBC8. To investigate the effect of RBC8 on the MAPK/JNK pathway, we performed Western blot analyses (Figure 5F), which showed increased levels of phosphorylated proteins, including p-MKK4, p-JNK, p-c-Jun, p-ATF-2, p-STAT3, p-Bax and p-Bcl-2, in the RBC8 groups.
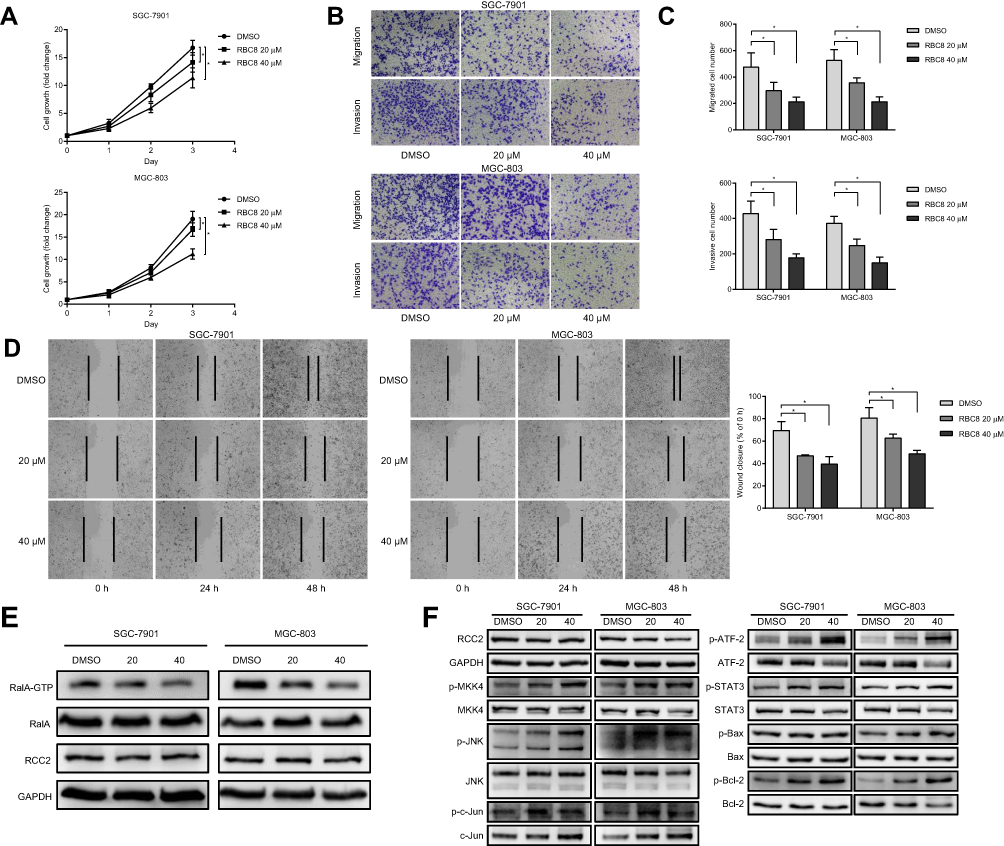 |
Figure 5 RBC8 inhibits cell proliferation and motility as well as mediates the levels of the RalA-GTP and MAPK/JNK pathways. (A) RBC8 (20 µM and 40 µM) inhibited SGC-7901 and MGC-803 cell growth. *P<0.05. (B, C) Cell migration and invasion assays showed that the number of cells passing through the membrane significantly decreased with the addition of 20 µM and 40 µM RBC8. *P<0.05. (D) Wound-healing assays showed that 20 µM and 40 µM RBC8 inhibited wound closure in SGC-7901 and MGC-803 cells. Representative images were captured after the wound was created at 0, 24 and 48 hrs. *P<0.05. (E) RalA-GTP was downregulated after treatment with 20 µM and 40 µM RBC8 compared to the DMSO group in SGC-7901 and MGC-803 cells. (F) RBC8 promoted phosphorylation of the MAPK/JNK pathway in SGC-7901 and MGC-803 cells. |
RCC2 Knockdown Inhibits Tumor Progression in vivo
To assess the effect of RCC2 knockdown in vivo, we established a xenograft tumor mouse by injecting MGC-803-NC or MGC-803-KD-RCC2 cells into the right dorsum of nude mice. During the observation period, tumor volumes were measured twice per week, and tumor growth was significantly slower in the RCC2 knockdown group than in the NC group (Figure 6A). At the end of the experiment, tumors were separated and weighed. The tumor sizes and weights were decreased in the RCC2 knockdown group (Figure 6B and C). Bioluminescence imaging was performed to detect the xenograft tumors in mice at day 14. Bioluminescence images showed weaker bioluminescent signals in the RCC2 knockdown group than in the NC group (Figure 6D). Further HE and IHC experiments were performed to identify tumors and the expression levels of RCC2 and p-JNK. HE staining showed that the tumor cells were arranged irregularly with large and deep stained nuclei (Figure 6E). IHC images showed decreased RCC2 and increased p-JNK in knockdown xenograft tumors compared to NC tumors (Figure 6E).
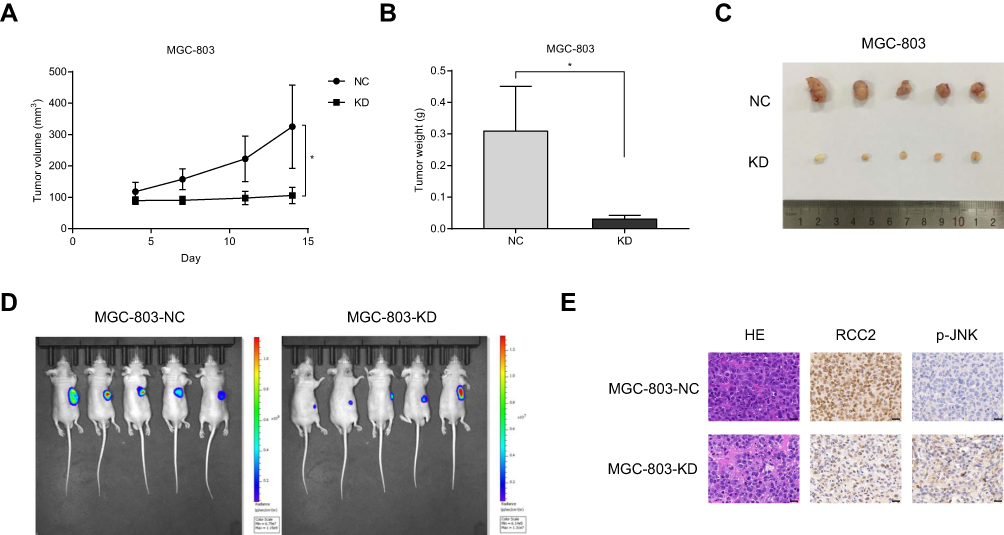 |
Figure 6 RCC2 knockdown inhibits xenograft tumor growth in vivo. (A) Tumor volumes were compared between the NC group and RCC2 knockdown group. Tumors in the knockdown group were significantly inhibited. *P<0.05. (B) Tumor weights were compared between the NC group and RCC2 knockdown group. Tumors in the knockdown group were significantly smaller. *P<0.05. (C) Images of mouse xenograft tumors from the NC group and RCC2 knockdown group. (D) Bioluminescence images showed weaker bioluminescent signals in mice from the RCC2 knockdown group than in mice from the NC group. (E) HE and IHC staining images verifying tumors and the expression of RCC2 and p-JNK. Scale bar, 20 µm. |
Discussion
RCC2 has been reported to be expressed abnormally in various cancers, including lung adenocarcinoma, colorectal cancer, and ovarian cancer.6,7,19 High expression of RCC2 may be associated with poor prognosis in lung adenocarcinoma and later pathological stages in ovarian cancer.6,19 The reduced expression of RCC2 caused by mutations in its 5ʹUTR region has been found to be an independent marker for improved outcomes in microsatellite instable (MSI) patients, while few RCC2 mutations have been found in microsatellite stable (MSS) patients, revealing that RCC2 may act as a prognostic marker in colorectal cancer.7 RCC2 has been found to be upregulated in cisplatin-resistant ovarian cancer cell lines and play a positive role in cell proliferation, apoptosis, and migration.20 Taken together, RCC2 may play an oncogenic role in these tumor models.
In this study, RCC2 was frequently overexpressed at both the mRNA and protein levels in gastric cancer compared to normal gastric tissues. The abnormal mRNA level of RCC2 in gastric cancer tissues was consistent with a previously published finding.21 The functions of RCC2 in cell proliferation, migration, and invasion were measured using two targeted siRNAs or an overexpression vector. Downregulated RCC2 significantly inhibited cell proliferation, migration, and invasion in SGC-7901 and MGC-803 gastric cancer cell lines, while upregulated RCC2 functioned in the opposite manner. Thus, RCC2 may play an oncogenic role in gastric cancer in vitro in accordance with the experiments using other tumor models mentioned above.
The underlying mechanism of RCC2 has been studied to some extent in previous studies. RCC2 may function in membrane protrusion and delivery by regulating Rac1 and Arf6.22 Furthermore, RCC2 guides mesenchymal migration by forming a complex with coronin-1C and Rac1.23 RCC2 may also alter apoptosis and drug sensitivity by interacting with Rac1 and inhibiting Rac1-GTP and STS-induced JNK phosphorylation in tumor cells, such as cervical cancer, lung cancer, and breast cancer.19 Moreover, RCC2 exhibits guanine exchange factor (GEF) activity toward RalA, a small GTPase, thus regulating kinetochore-microtubule interactions in early mitosis.9 RCC2 binds to RalA and promotes RalBP1, and RalA knockdown or overexpression reverses the cellular function changes induced by RCC2 overexpression or knockdown in ovarian cancer cells.20
In this study, we performed co-IP to verify the interaction between RCC2 and RalA. Furthermore, the level of RalA-GTP was determined and found to be decreased in RCC2 knockdown gastric cancer cells using a RalA pull-down assay. Moreover, the present study showed that the MAPK/JNK pathway was phosphorylated in RCC2 knockdown gastric cancer cells. RBC8 has been reported to be an effective small molecule that reduced the intracellular activation of RalA.24 Hence, RBC8 was used to investigate the cellular function changes by inhibiting RalA-GTP in gastric cancer cells. Treatment with the RalA inhibitor, RBC8, inhibited cell proliferation, migration, and invasion but promoted phosphorylation of the MAPK/JNK pathway. These results indicated that RCC2 knockdown may inhibit cell proliferation, migration, and invasion in gastric cancer by interacting with RalA and affecting the phosphorylation level of the MAPK/JNK pathway. It has been suggested that RalA and other small GTPases, such as Rac1 and Cdc42, may activate MLK3 and mediate JNK activation.25,26 Here, we found induced phosphorylation of the MKK4-JNK pathway in RCC2 knockdown or RBC8-processed gastric cancer cells, suggesting that other factors may exist that lead to consistent MAPK/JNK phosphorylation in these two situations. Further investigation is required. Finally, we used a xenograft model to investigate the effect of RCC2 knockdown on gastric cancer in vivo. RCC2 knockdown significantly inhibited tumor growth in a gastric cancer xenograft model, indicating that RCC2 may play an important role in gastric cancer progression.
Conclusions
In summary, this study demonstrated that RCC2 may play an important role in gastric cancer progression. RCC2 knockdown inhibited cell proliferation, migration, and invasion in vitro as well as tumor progression in vivo, which may act through RalA and affect the MAPK/JNK pathway.
Acknowledgment
This study was supported by the National Nature Science Foundation of China (No. 81672319 and 81972790) and the Major State Basic Research Development Program of China (2014CBA0200202).
Disclosure
The authors report no conflicts of interest in this work.
References
1. Bray F, Ferlay J, Soerjomataram I, Siegel RL, Torre LA, Jemal A. Global cancer statistics 2018: GLOBOCAN estimates of incidence and mortality worldwide for 36 cancers in 185 countries. CA Cancer J Clin. 2018;68(6):394–424. doi:10.3322/caac.21492
2. Chen W, Zheng R, Baade PD, et al. Cancer statistics in China, 2015. CA Cancer J Clin. 2016;66(2):115–132. doi:10.3322/caac.21338
3. Strong VE, Wu AW, Selby LV, et al. Differences in gastric cancer survival between the U.S. and China. J Surg Oncol. 2015;112(1):31–37. doi:10.1002/jso.23940
4. Yenjerla M, Panopoulos A, Reynaud C, Fotedar R, Margolis RL. TD-60 is required for interphase cell cycle progression. Cell Cycle. 2013;12(5):837–841. doi:10.4161/cc.23821
5. Mollinari C, Reynaud C, Martineau-Thuillier S, et al. The mammalian passenger protein TD-60 is an RCC1 family member with an essential role in prometaphase to metaphase progression. Dev Cell. 2003;5(2):295–307. doi:10.1016/s1534-5807(03)00205-3
6. Pang B, Wu N, Guan R, et al. Overexpression of RCC2 enhances cell motility and promotes tumor metastasis in lung adenocarcinoma by inducing epithelial-mesenchymal transition. Clin Cancer Res. 2017;23(18):5598–5610. doi:10.1158/1078-0432.CCR-16-2909
7. Bruun J, Kolberg M, Ahlquist TC, et al. Regulator of chromosome condensation 2 identifies high-risk patients within both major phenotypes of colorectal cancer. Clin Cancer Res. 2015;21(16):3759–3770. doi:10.1158/1078-0432.CCR-14-3294
8. Song C, Liang L, Jin Y, et al. RCC2 is a novel p53 target in suppressing metastasis. Oncogene. 2018;37(1):8–17. doi:10.1038/onc.2017.306
9. Papini D, Langemeyer L, Abad MA, et al. TD-60 links RalA GTPase function to the CPC in mitosis. Nat Commun. 2015;6:7678. doi:10.1038/ncomms8678
10. Lim KH, Baines AT, Fiordalisi JJ, et al. Activation of RalA is critical for Ras-induced tumorigenesis of human cells. Cancer Cell. 2005;7(6):533–545. doi:10.1016/j.ccr.2005.04.030
11. Lim KH, O’Hayer K, Adam SJ, et al. Divergent roles for RalA and RalB in malignant growth of human pancreatic carcinoma cells. Curr Biol. 2006;16(24):2385–2394. doi:10.1016/j.cub.2006.10.023
12. Martin TD, Samuel JC, Routh ED, Der CJ, Yeh JJ. Activation and involvement of Ral GTPases in colorectal cancer. Cancer Res. 2011;71(1):206–215. doi:10.1158/0008-5472.CAN-10-1517
13. Ezzeldin M, Borrego-Diaz E, Taha M, et al. RalA signaling pathway as a therapeutic target in hepatocellular carcinoma (HCC). Mol Oncol. 2014;8(5):1043–1053. doi:10.1016/j.molonc.2014.03.020
14. Male H, Patel V, Jacob MA, et al. Inhibition of RalA signaling pathway in treatment of non-small cell lung cancer. Lung Cancer. 2012;77(2):252–259. doi:10.1016/j.lungcan.2012.03.007
15. Yin J, Pollock C, Tracy K, et al. Activation of the RalGEF/Ral pathway promotes prostate cancer metastasis to bone. Mol Cell Biol. 2007;27(21):7538–7550. doi:10.1128/MCB.00955-07
16. Moghadam AR, Patrad E, Tafsiri E, et al. Ral signaling pathway in health and cancer. Cancer Med. 2017;6(12):2998–3013. doi:10.1002/cam4.1105
17. Dhanasekaran DN, Reddy EP. JNK-signaling: a multiplexing hub in programmed cell death. Genes Cancer. 2017;8(9–10):682–694. doi:10.18632/genesandcancer.155
18. Yan C, Theodorescu D. RAL GTPases: biology and potential as therapeutic targets in cancer. Pharmacol Rev. 2018;70(1):1–11. doi:10.1124/pr.117.014415
19. Wu N, Ren D, Li S, et al. RCC2 over-expression in tumor cells alters apoptosis and drug sensitivity by regulating Rac1 activation. BMC Cancer. 2018;18(1):67. doi:10.1186/s12885-017-3908-y
20. Gong S, Chen Y, Meng F, et al. RCC2, a regulator of the RalA signaling pathway, is identified as a novel therapeutic target in cisplatin-resistant ovarian cancer. FASEB J. 2019;33(4):5350–5365. doi:10.1096/fj.201801529RR
21. Matsuo M, Nakada C, Tsukamoto Y, et al. MiR-29c is downregulated in gastric carcinomas and regulates cell proliferation by targeting RCC2. Mol Cancer. 2013;12:15. doi:10.1186/1476-4598-12-15
22. Humphries JD, Byron A, Bass MD, et al. Proteomic analysis of integrin-associated complexes identifies RCC2 as a dual regulator of Rac1 and Arf6. Sci Signal. 2009;2(87):ra51. doi:10.1126/scisignal.2000396
23. Williamson RC, Cowell CA, Hammond CL, et al. Coronin-1C and RCC2 guide mesenchymal migration by trafficking Rac1 and controlling GEF exposure. J Cell Sci. 2014;127(Pt 19):4292–4307. doi:10.1242/jcs.154864
24. Yan C, Liu D, Li L, et al. Discovery and characterization of small molecules that target the GTPase Ral. Nature. 2014;515(7527):443–447. doi:10.1038/nature13713
25. van den Berg MC, van Gogh IJ, Smits AM, et al. The small GTPase RALA controls c-Jun N-terminal kinase-mediated FOXO activation by regulation of a JIP1 scaffold complex. J Biol Chem. 2013;288(30):21729–21741. doi:10.1074/jbc.M113.463885
26. Teramoto H, Coso OA, Miyata H, Igishi T, Miki T, Gutkind JS. Signaling from the small GTP-binding proteins Rac1 and Cdc42 to the c-Jun N-terminal kinase/stress-activated protein kinase pathway. A role for mixed lineage kinase 3/protein-tyrosine kinase 1, a novel member of the mixed lineage kinase family. J Biol Chem. 1996;271(44):27225–27228. doi:10.1074/jbc.271.44.27225
 © 2020 The Author(s). This work is published and licensed by Dove Medical Press Limited. The full terms of this license are available at https://www.dovepress.com/terms.php and incorporate the Creative Commons Attribution - Non Commercial (unported, v3.0) License.
By accessing the work you hereby accept the Terms. Non-commercial uses of the work are permitted without any further permission from Dove Medical Press Limited, provided the work is properly attributed. For permission for commercial use of this work, please see paragraphs 4.2 and 5 of our Terms.
© 2020 The Author(s). This work is published and licensed by Dove Medical Press Limited. The full terms of this license are available at https://www.dovepress.com/terms.php and incorporate the Creative Commons Attribution - Non Commercial (unported, v3.0) License.
By accessing the work you hereby accept the Terms. Non-commercial uses of the work are permitted without any further permission from Dove Medical Press Limited, provided the work is properly attributed. For permission for commercial use of this work, please see paragraphs 4.2 and 5 of our Terms.