")
Back to Journals » OncoTargets and Therapy » Volume 9
RBBP6: a potential biomarker of apoptosis induction in human cervical cancer cell lines
Received 20 November 2015
Accepted for publication 2 February 2016
Published 29 July 2016 Volume 2016:9 Pages 4721—4735
DOI https://doi.org/10.2147/OTT.S100964
Checked for plagiarism Yes
Review by Single anonymous peer review
Peer reviewer comments 2
Editor who approved publication: Dr Faris Farassati
Pontsho Moela, Lesetja Raymond Motadi
Department of Biochemistry, North-West University, Potchefstroom, South Africa
Abstract: Overexpression of RBBP6 in cancers of the colon, lung, and esophagus makes it a potential target in anticancer therapy. This is especially important because RBBP6 associates with the tumor suppressor gene p53, the inactivation of which has been linked to over 50% of all cancer types. However, the expression of RBBP6 in cancer and its interaction with p53 are yet to be understood in order to determine whether or not RBBP6 is cancer promoting and therefore a potential biomarker. In this study, we manipulated RBBP6 expression levels followed by treatment with either camptothecin or γ-aminobutyric acid in cervical cancer cells to induce apoptosis or cell cycle arrest. We began by staining human cervical cancer tissue sections with anti-RBBP6 monoclonal antibody to evaluate the extent of expression of RBBP6 in patients’ specimens. We followed on with silencing the overexpression of RBBP6 and treatment with anticancer agents to evaluate how the specimens respond to combinational therapy. Apoptosis induction was evaluated through confocal microscope, and flow cytometry using annexin V staining, and also by checking the mitochondrial and caspase-3/7 activity. Cell cycle arrest was evaluated using flow cytometry through staining with propidium iodide. RBBP6 was highly expressed in cervical cancer tissue sections that were in stage II or III of development. Silencing RBBP6 followed by treatment with γ-aminobutyric acid and camptothecin seems to sensitize cells to apoptosis induction rather than cell cycle arrest. Overexpression of RBBP6 seems to promote S-phase in cell cycle and cell proliferation. These results predict a proliferative role of RBBP6 in cancer progression rather than as a cancer-causing gene. Furthermore, sensitization of cells to camptothecin-induced apoptosis by RBBP6 targeting suggests a promising tool for halting cervical cancer progression.
Keywords: xCELLigence, camptothecin, GABA, apoptosis, silencing, overexpression
Introduction
Cancer is a disease with an enormous burden globally.1 At present, more people die from cancer than HIV/AIDS, tuberculosis, and malaria combined. Currently, cervical cancer is the most common cancer, accounting for over 60% of the gynecological cancer burden in developing countries.2 RBBP6 has been shown to be highly expressed in several cancers, and its ability to interact with the tumor suppressor protein p53 has drawn attention in evaluating its potential as a cancer biomarker. p53 is a crucial regulatory protein that triggers cellular responses such as DNA repair, cell cycle arrest, senescence, and apoptosis in response to cellular stress. In most human cancers, however, the TP53 pathway is often found to be defective, either by mutations or through deregulation by its negative regulators. In cervical cancer, p53 is found to be inactivated rather than mutated, and RBBP6 is suspected to be one of the negative regulators of p53.
Extensive research on the cause of cervical cancer has evidently singled out human papillomaviruses (HPVs) as the main cause.3–7 During the differentiation-dependent phase, the E6 viral protein regulates the viral replication in differentiated cells by suppressing transcription of active p53 cellular protein, thus abrogating the host cells’ ability to initiate cell cycle arrest, prompting uncontrolled cell proliferation.3,5 It is suspected that the viral protein achieves this p53 suppression via the proteasomal pathway in which it acts as an E3 ligase that functions to ubiquitinate protein molecules for proteasomal degradation. This mechanism is similar to the one involving RBBP6 in which it interacts with TP53 via its p53-binding domain. Research has shown that RBBP6 plays a role as a scaffold protein to promote the assembly of the p53/TP53-MDM2 complex, resulting in increased MDM2-mediated ubiquitination and degradation of p53/TP53. Therefore, this suggests that RBBP6 may function as a negative regulator of p53/TP3, thus leading to both apoptosis and cell growth.8,9 So in this study, we propose that RBBP6 mediates TP53 inactivation in the same manner as HPV proteins, since both proteins perform the activity of E3 ligase and have also been shown to interact with TP53. We therefore aimed to manipulate the expression of RBBP6 in cervical cancer cell lines and co-treat the cell lines with chemotherapeutic agents in order to sensitize them to apoptosis induction.
Materials and methods
Materials
Human cervical cancer tissue sections were purchased from Cybrdi (Rockville, MD, USA) after obtaining ethical clearance issued by the University of the Witwatersrand ethics committee (number M140801), and human cell lines SiHa, MRC-5, and HeLa were purchased from American Type Culture Collection (ATCC; Manassas, VA, USA). SiHa and HeLa cells were derived from the most prevalent squamous cervical carcinomas and the less prevalent adenocarcinomas, respectively, and both cell lines expressed wild-type p53. Silencing of RBBP6 was achieved using Ambion’s Silencer select Pre-designed siRNA supplied by Thermo Fisher Scientific (Waltham, MA, USA). RBBP6 overexpression was achieved using the pCMV6-AC-GFP mammalian expression vector supplied by Blue Heron Biotech, LLC (Bothell, WA, USA) to deliver the open reading frame of RBBP6 transcript variant 3 (NM_032626.5) into the cell lines. Camptothecin (Calbiochem, San Diego, CA, USA) and γ-aminobutyric acid (GABA) (Sigma-Aldrich Co., St Louis, MO, USA) were used as anticancer agents.
Methods
Immunohistochemistry
Tissue sections were dewaxed and rehydrated in absolute ethanol. Slides were subsequently incubated in absolute methanol containing 3% hydrogen peroxide to quench endogenous peroxidase. Antigen retrieval was performed by boiling the slides in 0.1 M sodium citrate (pH 6.0) in a microwave oven. Binding of endogenous biotin and nonspecific binding of protein were blocked by incubating the sections with biotin block and protein block, respectively (Dako Denmark A/S, Glostrup, Denmark), followed by 10% (v/v) human serum and 20% (v/v) swine serum. The sections were incubated for 18 hours with optimized dilutions of each of the specific mouse monoclonal antibodies. Subsequently, sections were incubated with biotinylated secondary anti-mouse antibody followed by streptavidin peroxidase (Dako LSAB kit). Labeling was visualized by incubation with a mixture of diaminobenzidine (Dako) and 3-amino-9-ethylcarbazole (Dako) to give a reddish brown product. Sections were lightly counterstained with Meyer’s hematoxylin, dehydrated, and mounted with Depex. Immunolabeled tissue sections were visualized using confocal light microscopy (BX63 Olympus Corporation, Tokyo, Japan). As negative controls, primary antibody was replaced with phosphate-buffered saline (PBS).
Cell culture
Monolayer human normal and cancer cell lines were grown in Dulbecco’s Modified Eagle’s Medium (DMEM; HyClone, Logan, UT, USA)/high-glucose growth medium supplemented with 10% fetal bovine serum (FBS) and 1% antibiotic (penicillin/streptomycin), and routinely maintained at 37°C in a 5% CO2 incubator. The cells were fed every second day of the week by replacing old growth medium with equal amount of fresh growth medium after rinsing twice with 2 mL PBS. The cells were subcultured at near-confluency at least once per week, and excess subcultures were preserved at ≥−80°C in DMEM/high-glucose growth medium supplemented with 10% FBS and 20% dimethyl sulfoxide.
Real-time cell growth assay
In vitro cell proliferation was measured using xCELLigence (xCELLigence, AECE, USA) Real-Time Cellular Analysis system. Briefly, the background impedance was measured following the addition of 100 μL of growth medium to the 16-well E-plates. Cell suspension containing 7×10³ SiHa or 3×10³ HeLa cells in 90 μL growth medium was seeded into the wells simultaneously with 30 nM siRNA or 1 μg expression vector (pCMV6-AC-GFP) carrying RBBP6, and attachment and proliferation were monitored using the xCELLigence Real-Time Cellular Analysis system. Upon reaching logarithmic phase, cells were further treated with 0.25 μM apoptosis-inducing agents (GABA and camptothecin) and continuously monitored for ~60 hours. Impendence changes expressed as cell index (CI) were automatically calculated as live cells interact with electrodes in the E-plates, correlating with viability or cytotoxicity of cells over time.
Annexin V/PI apoptosis assay
This technique was employed to determine the type of cell death induced by co-treatments. Annexin V detects the translocation of phosphatidylserine from the inner leaflet to the surface of the plasma membrane, which is characteristic of apoptotic cells, whereas propidium iodide (PI) detects late apoptotic and ruptured cells with permeabilized plasma membrane. Cultured cells were seeded in six-well plates and simultaneously transfected with siRNA or expression vector targeting RBBP6 for 24 hours and treated for additional 24 hours with apoptosis-inducing agents (100 μM GABA and 0.25 μM camptothecin). The treated cells were then trypsinized, transferred to 15 mL tubes, pelleted for 2 minutes at 1,500 rpm, and resuspended in 100 μL of 1X binding buffer (annexin V-fluorescein isothiocyanate [FITC] Apoptosis Detection Kit; Abcam, Cambridge, UK) at a concentration of 1×10⁴ cells/mL. The cell solution was then transferred to 1 mL tubes, and 5 μL of annexin V-FITC and 5 μL of PI were added. This was followed by gentle vortexing and incubation for 15 minutes at room temperature in the dark. Four hundred microliters of 1X binding buffer was then added to each tube, and the cell solutions were analyzed by flow cytometry within 1 hour.
Confocal microscopy
Cells were grown on coverslips inserted in six-well plates to attach overnight in the presence of siRBBP6 and pRBBP6 and then treated with the desired concentration of camptothecin (0.25 μM) or GABA (100 μM). The cells were then allowed to incubate for further 24 hours. For apoptosis detection, the cells were washed with cold PBS, and stained with annexin V-FITC/4′,6-diamidino-2-phenylindole (DAPI) for 30 minutes in the dark followed by fixation for 30 minutes with 4% formaldehyde. For protein expression analysis, fixed cells were permeabilized using 0.01% TritonX-100 and then immunostained with anti-GFP primary antibody for 1 hour in the dark after blocking the nonspecific binding with 1% bovine serum albumin blocking buffer. The cells were then rinsed four times with cold PBS followed by incubation for another 1 hour with secondary antibody conjugated to alexa fluor 488 fluorescent dye in order to enable visualization of GFP-positive cells. The cells were imaged at ×10 magnification using Olympus BX63 confocal fluorescence microscope.
Caspase-3/7 activity
Caspase activity was assayed by measuring light intensity using Caspase-Glo® 3/7 (Promega Corporation, Fitchburg, WI, USA) according to the manufacturer’s protocol. Briefly, cells (5×10⁴ cells/well) were seeded in the presence of either siRBBP6 or pRBBP6 (expression vector) in a white 96-well microplate and treated with camptothecin or GABA for 24 hours. Caspase-Glo reagent was added and incubated at room temperature for 30 minutes. The caspase activity was then measured using the GloMax®-96 (Promega Corporation, Fitchburg, WI, USA) microplate luminometer. The assay was performed in triplicates, and the results were presented as mean of relative light units (RLU).
ATP detection assay
Twenty-five microliters of 1×10⁴ cells/well were plated in the wells of white luminometer plate containing transfection agents (siRBBP6 or pRBBP6) overnight. Cells were then treated with equal amount of camptothecin or GABA diluted in a glucose-free media supplemented with 10 mM galactose. The plate was incubated at 37°C in a humidified incubator supplemented with 5% CO2 for a period of 24 hours. ATP detection reagent was added at a 1:1 ratio to each well. The plate was further incubated for 30 minutes at room temperature, and luminescence was measured using GloMax®-96. The assay was conducted in duplicates, and ATP levels were reported as a mean of RLU. The following formula was used to calculate the ATP levels in RLU:
RLU = Luminescence (sample) − Luminescence (blank) | (1) |
Cell cycle analysis by flow cytometry
Cell cycle analysis was performed by PI-based measurements of cell DNA content using flow cytometry. Cells were transfected with siRBBP6 or pRBBP6 for 24 hours and co-treated with either camptothecin or GABA for additional 24 hours, followed by collection of both attached and detached cells. Pellet was rinsed twice with cold PBS and fixed in 70% ice-cold ethanol for 30 minutes at 20°C. Fixed cells were then washed twice with PBS, and DNA was stained with 500 μL PI/RNase staining solution and incubated in the dark for a further 30 minutes. Flow cytometry analysis was carried out using BD Accuri C6 machine.
Real-time PCR
In this study, the Luminaris Color HiGreen qPCR Mastermix (inqaba biotec, Pretoria, South Africa) dye was used to quantify the amount of gene expression in cDNA synthesized using total RNA that was isolated from cultured cells. Briefly, cells were exposed to 48-hour transfection with 30 nM siRBBP6 and 1 μg pRBBP6 followed by treatment with either 0.25 μM camptothecin or 100 μM GABA. Total RNA was isolated using the Zymoresearch Quick RNA™ Miniprep and was measured using the NanoDrop (NanoDrop, Inqaba, SA). Normalized amounts of total RNA were reverse transcribed using the ImProm-II Reverse Transcription System (Promega Corporation) according to the manufacturer’s specifications. The real-time quantitative polymerase chain reaction (PCR) was performed in a 20 μL reaction mixture containing 2,100 ng/μL cDNA, SYBR Green, and primers specific for RBBP6, TP53, bax, bak1, bad, caspase-3, caspase-8, and bcl-2. The data were analyzed using REST 2009 software (Qiagen NV, Venlo, the Netherlands).
Western blot
Following 72-hour transfection with siRBBP6 and pRBBP6, and co-treatments with camptothecin and GABA, cells were lysed using radioimmunoprecipitation assay buffer (50 mM Tris–HCl pH 7.4, 150 mM NaCl, 1% NP-40, 0.1% sodium dodecyl sulfate (SDS), 2 mM ethylenediaminetetraacetic acid). Protein content was measured by the bicinchoninic acid assay, and equal amounts were electrophoresed in SDS polyacrylamide gel and then transferred onto nitrocellulose membranes. Membranes were subsequently immunoblotted with the anti-p53, anti-RBBP6, anti-MDM2, and anti-β-actin primary antibodies overnight and then in horseradish peroxidase-conjugated secondary antibody for 1 hour. Protein bands were detected on the ChemiDoc MP Imaging System following treatment with enhanced chemiluminescence reagent.
Statistical analysis
Experiments were performed in either duplicates or triplicates depending on the experimental design, and data sets were expressed as mean ± standard deviations. Data were analyzed using Student’s t-test, and statistical significance was accepted only at ***P<0.001, **P<0.01, or *P<0.05.
Results
Immunohistochemical staining in human cervical cancer tissue sections
The immunolabeling data showed that majority of cervical cancer tissues overexpressed RBBP6. Based on the degree of tumor differentiation, RBBP6 was highly expressed predominantly in well-differentiated than in poorly differentiated carcinomas (Figure 1B, D, F, and H). Localization in these tumors was more evident in the cytoplasm and cell membranes. More positive staining was observed around and within the keratinized regions (Figure 1D). Furthermore, the RBBP6 was found to be abundantly localized within the cytoplasm of well-differentiated squamous cell carcinoma (Figure 1F).
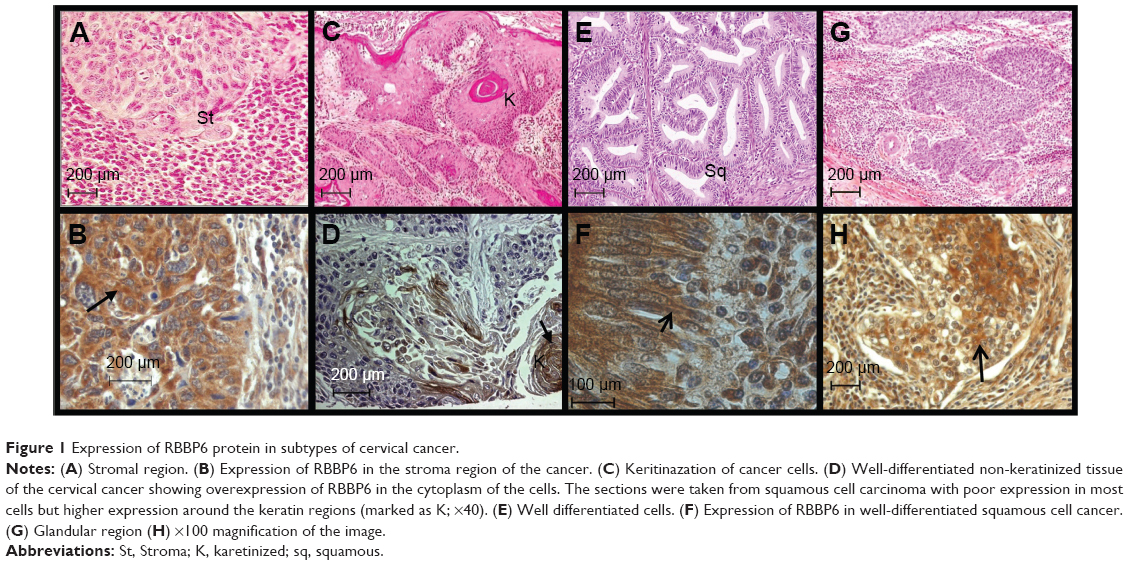 | Figure 1 Expression of RBBP6 protein in subtypes of cervical cancer. |
Confirmation of gene silencing and upregulation
In order to continue with our analysis of the role played by RBBP6 in cervical cancer progression, we verified if our silencing and overexpression were successful. Figure 2 shows that both overexpression and silencing were successful, with ~85%–100% increase in RBBP6 expression and 75%–90% knockdown of RBBP6 in both cell lines (Figure 2A–C). These results prompted us to further our study to see if either of the two effects has had any impact on the progression of cancer cells.
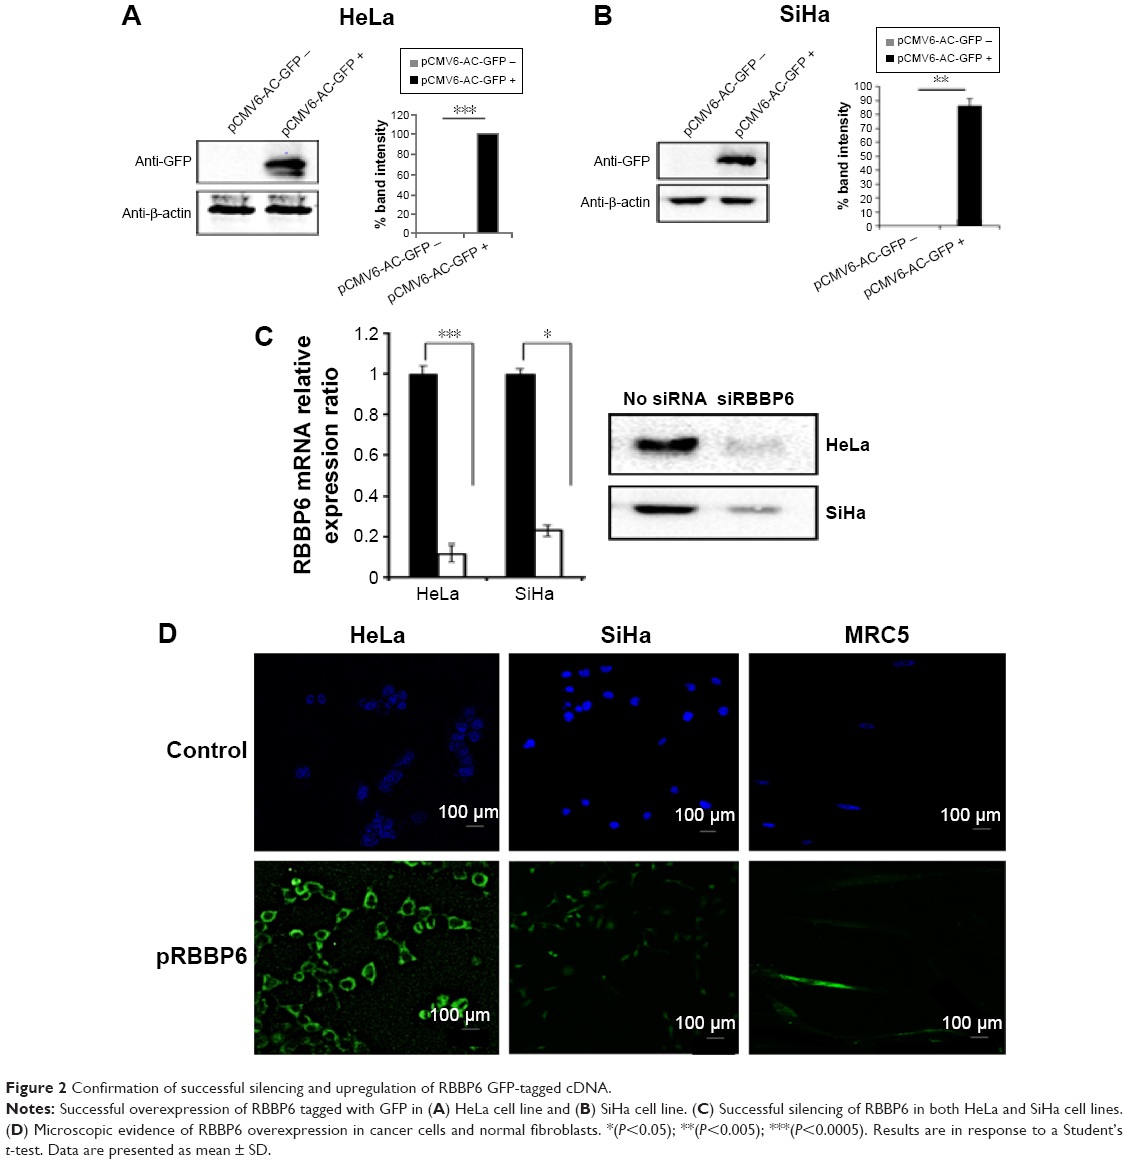 | Figure 2 Confirmation of successful silencing and upregulation of RBBP6 GFP-tagged cDNA. |
Effect of RBBP6 overexpression and silencing on cell proliferation
The objective of this section was to monitor the effect of RBBP6 overexpression and silencing on cell proliferation in both the normal and cervical cancer cell lines using xCELLigence system (Hoffman-La Roche Ltd., Basel, Switzerland). The xCELLigence system uses specially designed 16-well microtiter plates that contain interdigitated gold microelectrodes at the bottom of each well to noninvasively monitor the viability of cultured cells using electrical impedance as a readout in the form of CI. The cells were monitored over a period of ~3 days in the presence of transfection agents, that is, the RBBP6 expression vector (pRBBP6) and siRBBP6 oligonucleotide.
Growth curves were normalized to the CI at 24 hours just before the effects of either gene silencing or overexpression on cell proliferation were monitored. In SiHa cells, RBBP6 silencing steadily reduced growth rate to 1.0 CI, whereas RBBP6-overexpressing cells maintained higher CI throughout the remaining 32 hours of the entire experiment (Figure 3A). HeLa growth curve, which is presented in Figure 3B, showed a significant reduction in cellular growth at 24 hours post-siRBBP6 transfection. RBBP6 (red curve) overexpression promoted the growth of HeLa cells, as shown by the continued proliferation of cells transfected with pRBBP6. In MRC-5, pRBBP6 significantly increased CI or cell proliferation (Figure 3C). siRBBP6 and siRBBP6 + camptothecin significantly reduced CI in HeLa and SiHa, while GABA and siRBBP6 + GABA did not reduce CI (Figure 3D and E). MRC-5 cell line did not show any change in CI.
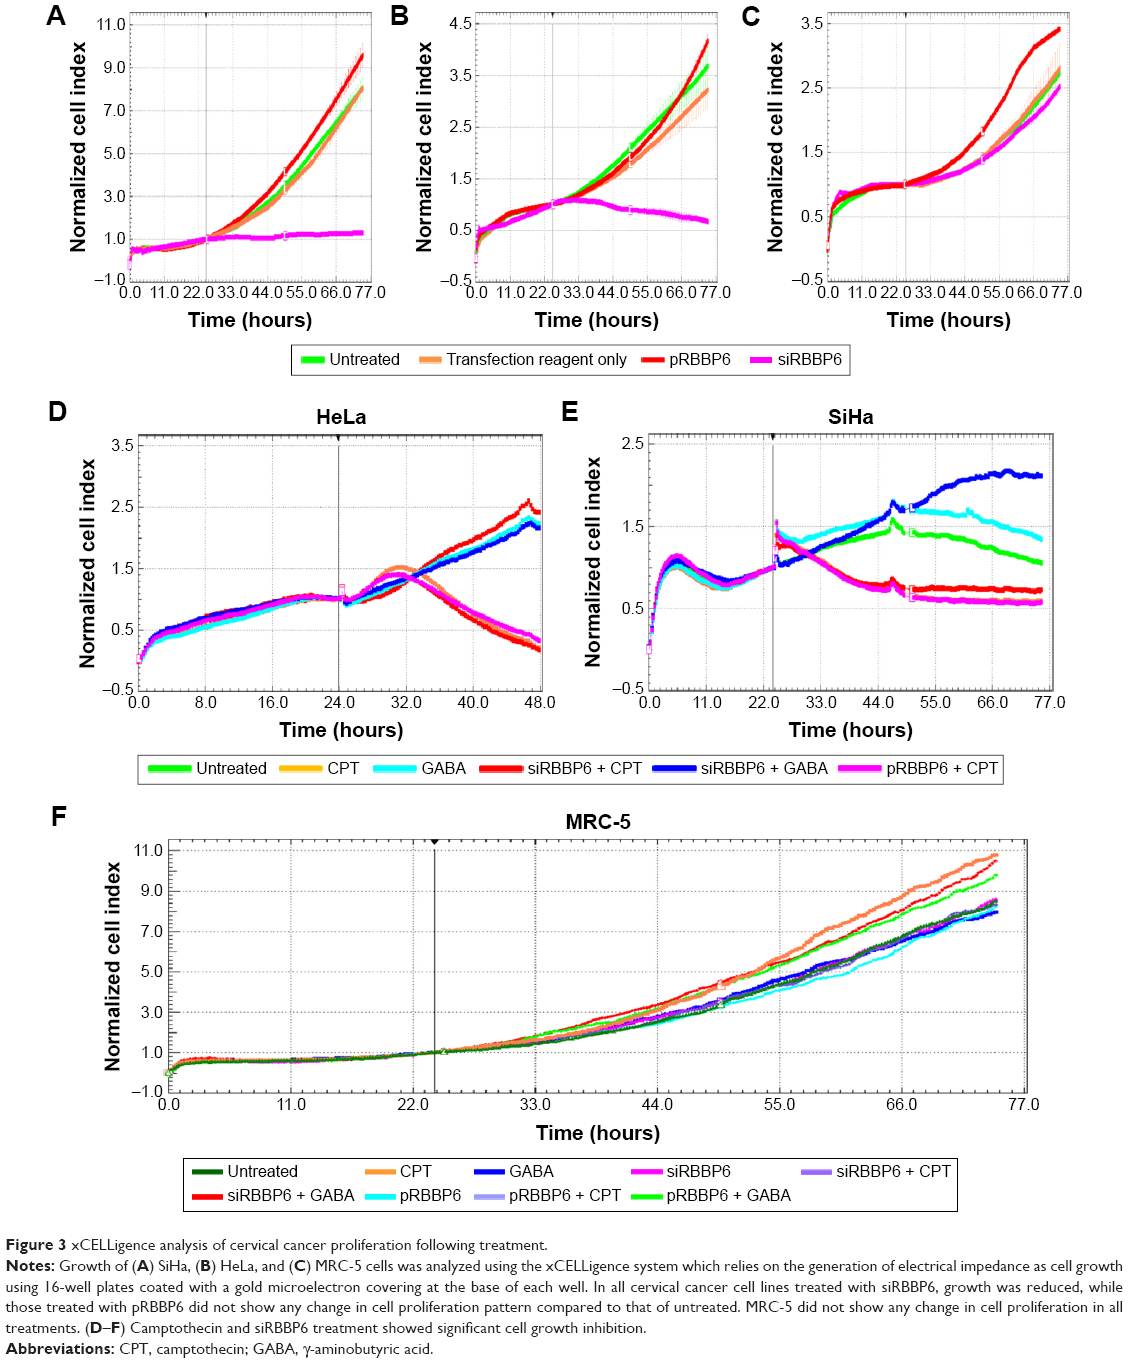 | Figure 3 xCELLigence analysis of cervical cancer proliferation following treatment. |
Flow cytometry detection of apoptosis
To identify whether the observed decrease in cell viability was a result of apoptosis or necrosis, flow cytometry analysis and fluorescence microscopy were used as described in the “Methods” section. Analysis by flow cytometry revealed that the percentage of apoptotic cells following transfection with siRBBP6 was significantly increased in most cell lines, with 48% apoptosis in HeLa and 45% in SiHa cells. Among the cells treated with GABA and camptothecin, apoptosis induction was significantly increased in HeLa by 29% and 53%, respectively, while in SiHa, by 32% and 47%, respectively. However, the same increase in apoptosis was observed in HeLa (73%) and SiHa (63%) cells that were treated with siRBBP6 (Figure 4). Combination of siRBBP6 and camptothecin showed a significant increase in apoptosis in HeLa (66%) and SiHa (61%) (Figure 4).
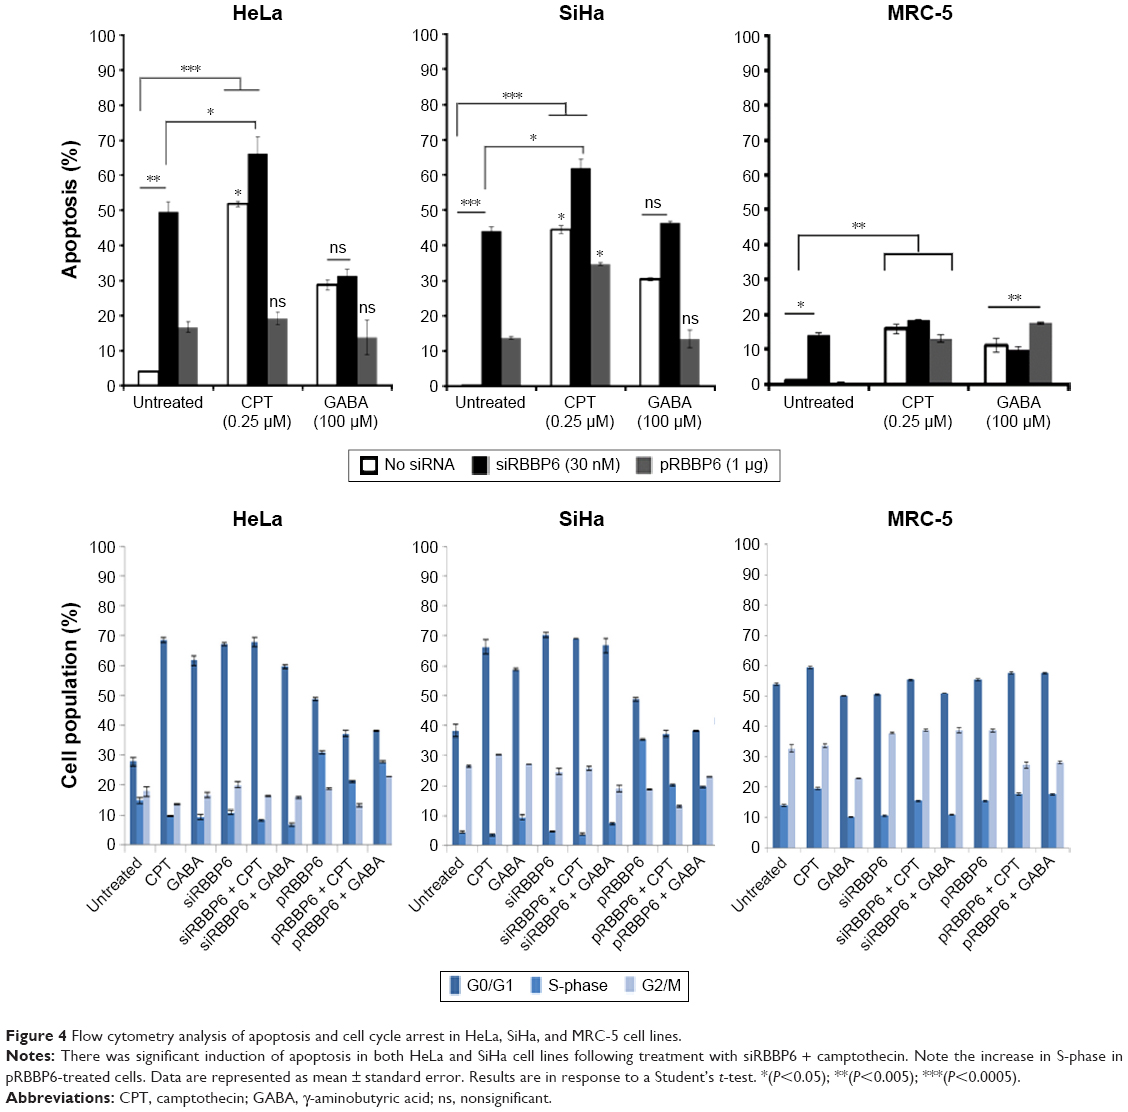 | Figure 4 Flow cytometry analysis of apoptosis and cell cycle arrest in HeLa, SiHa, and MRC-5 cell lines. |
In pRBBP6, a small percentage of apoptosis was induced across all cell lines, with 18% and 14% apoptosis in HeLa and SiHa, respectively, and a mere 0.1% in MRC-5. No change except slight reduction was observed in pRBBP6 + GABA (Figure 4). Apoptosis induction in MRC-5 fibroblasts was fairly low following treatment with GABA (12%) as compared to the one observed in tumorigenic cell lines (Figure 4). There was no significant change in apoptosis following combination of siRBBP6 and GABA (11%) or pRBBP6 with GABA (18%) when compared to GABA treatment only (12%). These results suggest an important role of camptothecin and siRBBP6.
Microscopic detection of apoptosis
Externalization of phosphatidylserine peptide, which is a marker of early apoptosis, as well as changes in nuclear morphology, was used to analyze the observed apoptosis. These events were imaged using confocal fluorescence microscope after staining with DAPI and annexin V-FITC. GABA treatment alone produced a weaker fluorescence signal; however, combination with siRBBP6 led to a higher fluorescence intensity. Changes in cell morphology were observed in cells treated with siRBBP6, siRBBP6 + camptothecin, and siRBBP6 + GABA compared to untreated cells; nuclei appeared to remain intact and round in shape in untreated cells (blue stain), whereas cells undergoing apoptosis had adopted irregular shapes (Figure 5).
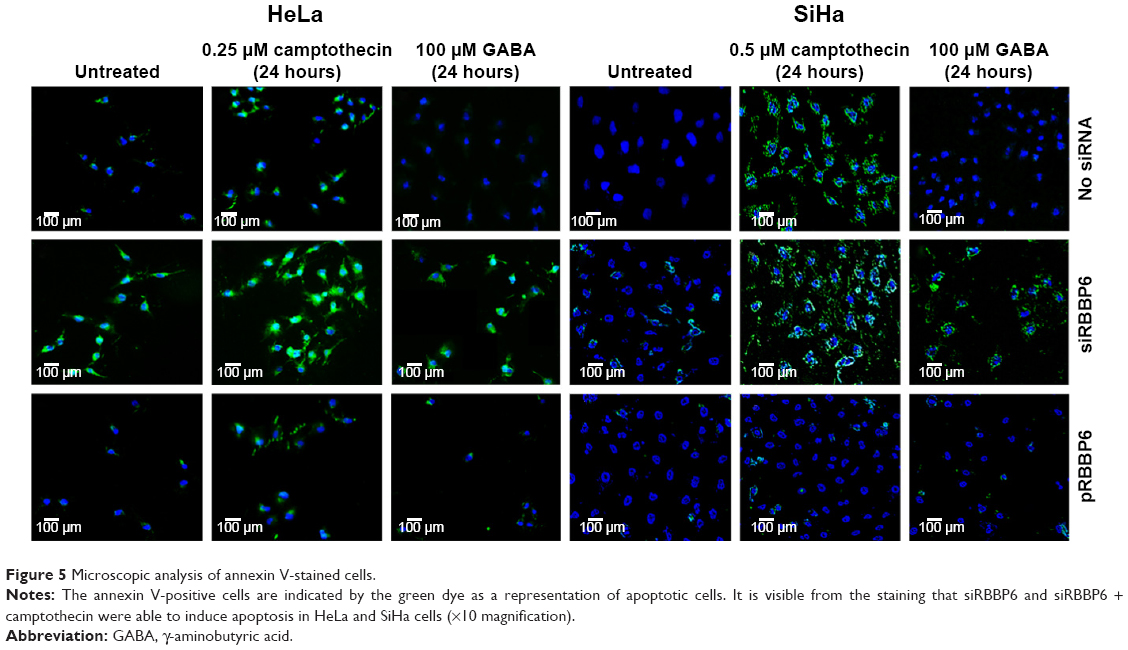 | Figure 5 Microscopic analysis of annexin V-stained cells. |
Analysis of caspase activity and mitochondrial ATP
Flow cytometry and fluorescence microscopy proposed that the observed reduction in cell viability was a result of apoptosis. In this study, caspase activity analysis and mitochondrial ATP measurement were performed to further confirm the observed apoptosis induction and to verify if the induced apoptosis pathway was mitochondrial dependent or independent. Caspase-3/7 activity was significantly increased in both HeLa (4,100 RLU) and SiHa (3,800 RLU) cells transfected with siRBBP6 (Figure 6). Caspase activity was increased to 7,200 RLU in SiHa cells treated with siRBBP6 + GABA (Figure 6). No significant activation of caspase-3/7 was observed in both HeLa and SiHa cell lines treated with only pRBBP6 or pRBBP6 in combination with GABA (Figure 6). Among the cells treated with siRBBP6 + camptothecin, caspase activity was significantly increased to 8,000 RLU in HeLa cells and 7,100 RLU in SiHa cells, but less increase was observed in those treated with only camptothecin (Figure 6). No significant caspase activity was observed in normal fibroblasts (MRC-5), except in cells transfected with siRBBP6 where a statistically significant caspase activity (308 RLU) was observed.
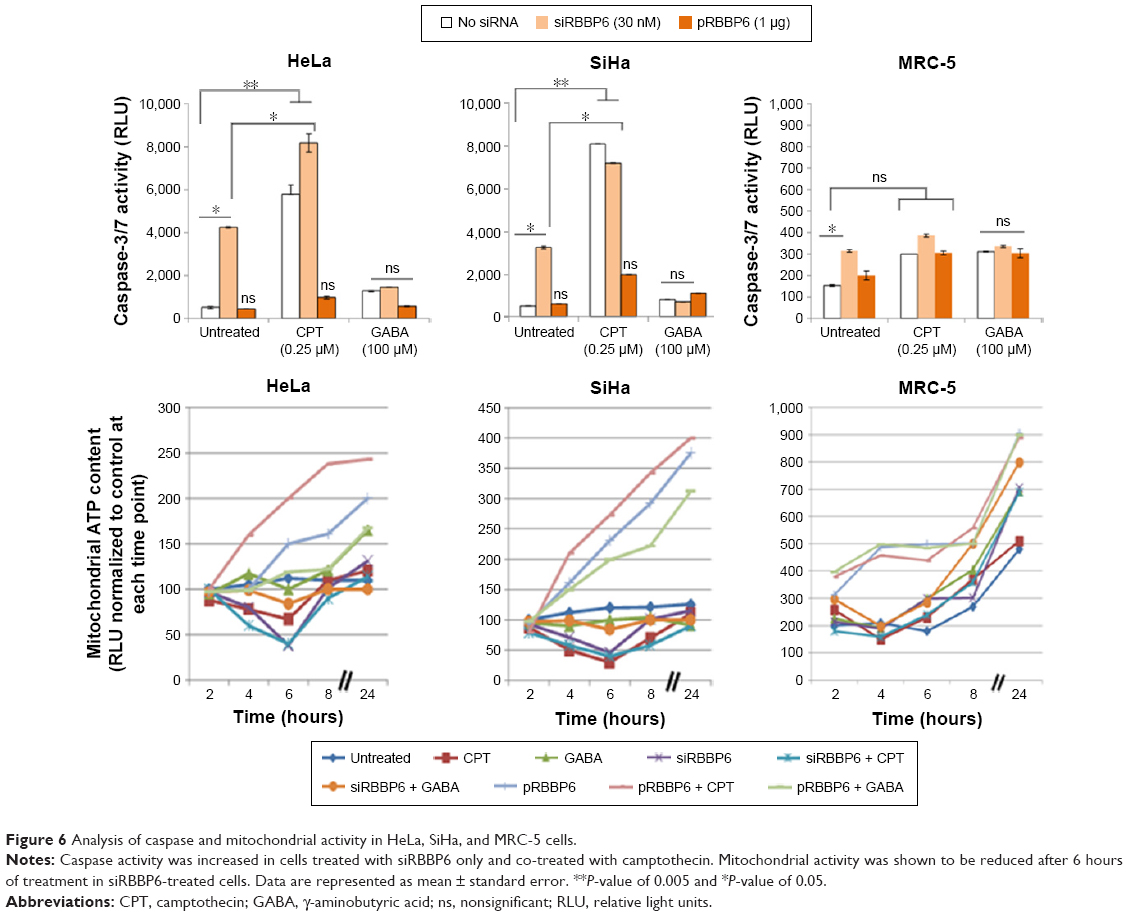 | Figure 6 Analysis of caspase and mitochondrial activity in HeLa, SiHa, and MRC-5 cells. |
Mitochondrial ATP depletion is a good indicator of outer membrane permeabilization due to activated pro-apoptotic proteins responsible for the activation of the intrinsic pathway. Following transfection with either siRBBP6 or pRBBP6 for 24 hours, mitochondrial ATP depletion was measured at 2-hour intervals after co-treatment with GABA. In both HeLa and SiHa cell lines, 6 hours after treatment with only siRBBP6 or co-treatment with siRBBP6 + camptothecin, ATP production decreased to <50 RLU (Figure 7). No ATP depletion was observed in cells co-treated with siRBBP6 + GABA in both HeLa and SiHa cells. HeLa and SiHa cells treated with either pRBBP6 + camptothecin or pRBBP6 + GABA continued to show an increase in ATP generation throughout the entire experiment (Figure 7). ATP activity was less in camptothecin-treated cells at 6 hours including in cells that were co-treated with siRBBP6.
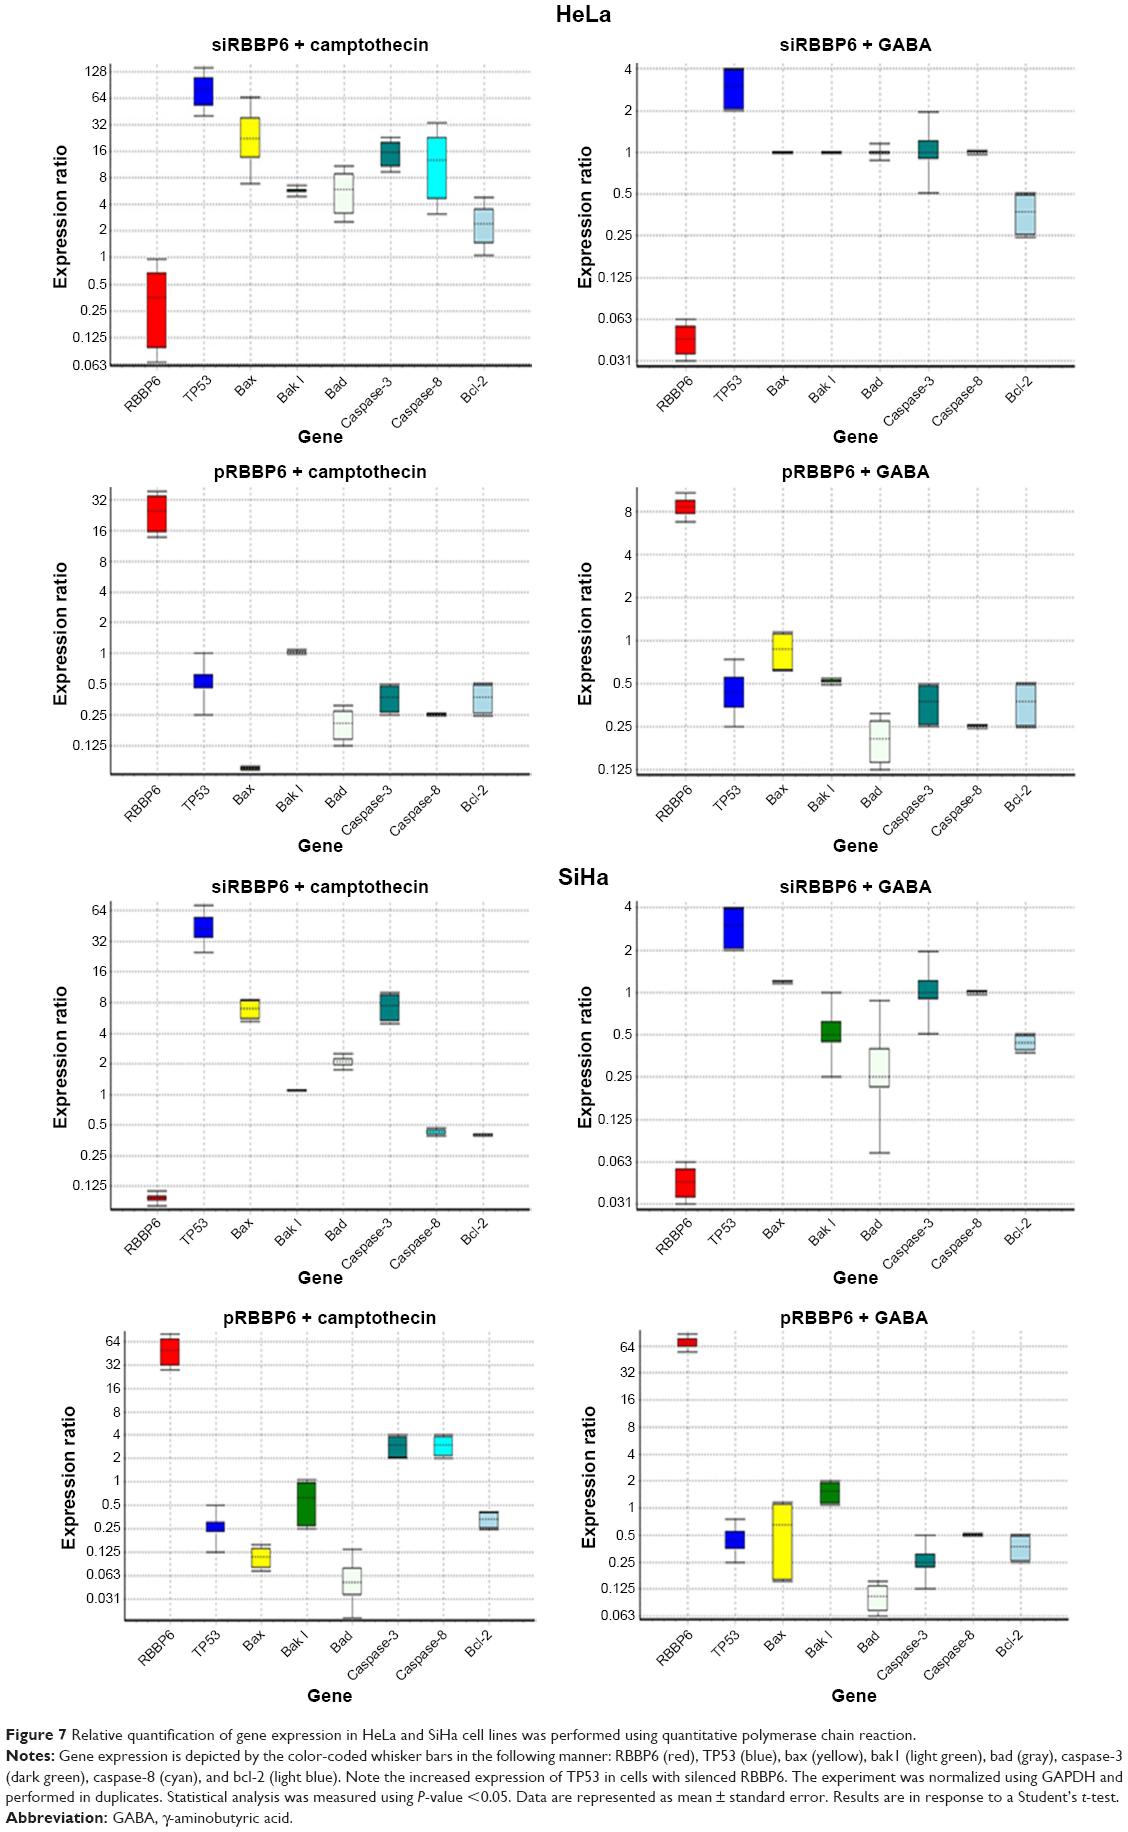 | Figure 7 Relative quantification of gene expression in HeLa and SiHa cell lines was performed using quantitative polymerase chain reaction. |
Analysis of cell cycle arrest
During cancer progression, cells evade the cell cycle checkpoints and continue to proliferate uncontrollably.10 In this study, we analyzed the induction of cell cycle arrest following treatment with our anticancer agents by measuring DNA content at G0/G1-, G2/M-, and S-phase using flow cytometry. In HeLa cells, siRBBP6 induced 67.25% of G0/G1 cell cycle arrest, whereas pRBBP6 induced ~48.65%; siRBBP6 + GABA induced 59.55% of G0/G1 cell cycle arrest, but pRBBP6 + GABA induced only 38.1% (Figure 4). For G2/M, there was no significant change following treatment with GABA and transfections. In SiHa cell line, GABA induced a significant amount of G0/G1 cell cycle arrest by 58.5%. SiHa cells treated with siRBBP6 + GABA showed no significant change in G0/G1 arrest (66.8%) relative to those treated with siRBBP6 only (70.25%; Figure 4).
Treatment with pRBBP6 and pRBBP6 + GABA induced G0/G1 arrest of 48.65% and 38.1%, respectively, in SiHa cells (Figure 4). G2/M arrest remained almost unchanged across all treatments – untreated (26.45%), GABA (27.1%), siRBBP6 (24.6%), siRBBP6 + GABA (18.9%), pRBBP6 (18.75%), and pRBBP6 + GABA (22.9%) (Figure 4). The combinational treatment with siRBBP6 and camptothecin showed an increase in G0/G1 phase by ~70%, which was just below the increase showed by siRBBP6-only treatment (67%). In SiHa, siRBBP6 + camptothecin showed an increase in G2/M phase than that seen in HeLa cells. In normal lung fibroblasts (MRC-5), induction of G0/G1 arrest was observed; however, there was no significant change following different treatments (Figure 4). G0/G1 arrest was recorded as 53.85% in untreated, 50.2% in GABA, 50.55% in siRBBP6, 50.95% in siRBBP6 + GABA, 55.5% in pRBBP6, and 57.6% in pRBBP6 + GABA.
Molecular effect of combinational treatments
In order to analyze the mRNA expression levels of most apoptotic genes to confirm if the cell death associated with the treatments was due to any molecular changes, quantitative real-time PCR was performed. In general, TP53, Bax, and caspase-3 and -8 together with bad were significantly increased in cells treated with siRBBP6 and siRBBP6 + camptothecin, while RBBP6, bcl-2, and bak1 were downregulated (Figure 7). In cells treated with GABA and siRBBP6 + GABA, most of the genes did not change as compared to standard. Similar results were also observed in cells treated with pRBBP6 + GABA, which also presented unchanged gene expression (Figure 7), whereas in cells treated with camptothecin and pRBBP6, there was an increase in TP53. The results suggest no mitochondrial involvement in activation of cell death.
RBBP6 and p53 expression: analysis of the relationship
The relationship between RBBP6, MDM2, and TP53 in cancer development continues to be the focus for the betterment of cancer drug discovery. We silenced and upregulated RBBP6 in order to evaluate its impact on p53 protein level. Western blot was used to analyze the results. In all treatments with siRBBP6 and camptothecin or both, p53 continued to be upregulated, while MDM2 remained unchanged (Figure 8).
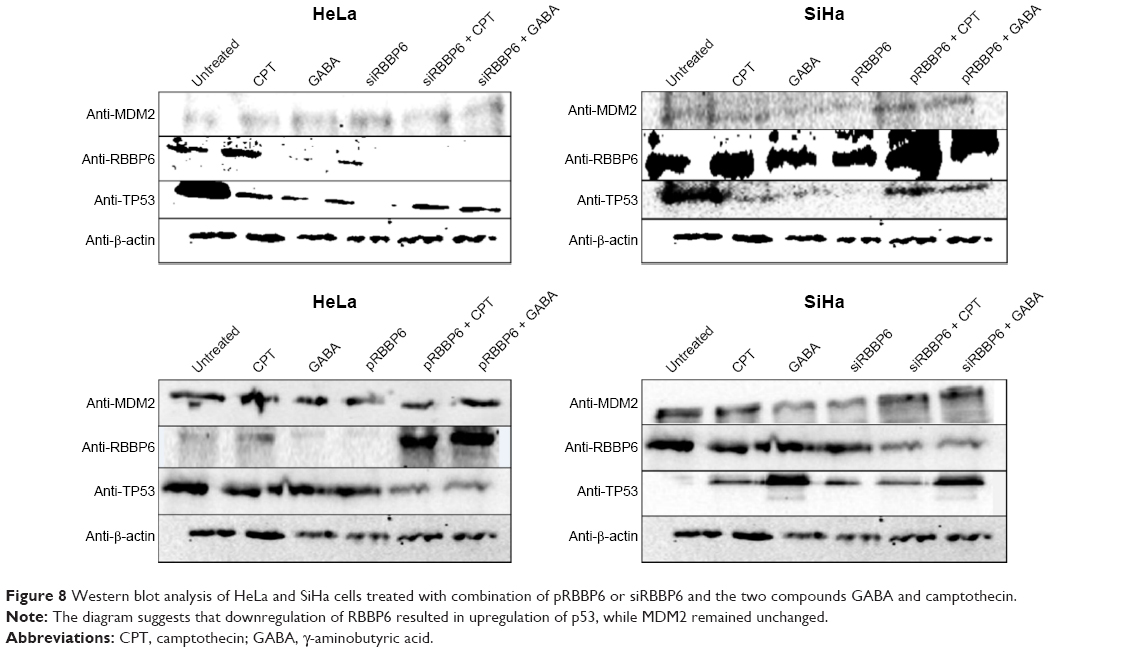 | Figure 8 Western blot analysis of HeLa and SiHa cells treated with combination of pRBBP6 or siRBBP6 and the two compounds GABA and camptothecin. |
Discussion
RBBP6 localization is widespread in a number of squamous cell carcinomas, including those of the lung, colon, and esophagus, suggesting that the protein may serve as an important diagnostic marker and a promising target for the treatment of cancer. In this manuscript, we describe how overexpression and silencing of RBBP6 combined with potential anticancer agents like GABA and camptothecin sensitize cervical cancer cells to apoptosis. The results of this study are the first to characterize the role of RBBP6 in cancer development and progression.
It is generally known that the main physiological mechanism by which cancer cells can be successfully targeted and eradicated is by induction of apoptosis or cell cycle arrest, yet the precise mechanisms behind failed apoptosis induction in cancer cells are still unclear.10–12 In cervical cancer, HPV is said to inactivate p53 through E6 ligase resulting in cancer progression.13 However, it remains unclear which other nonviral genes assist in degrading p53. It is also known that RBBP6 has both p53- and Rb-binding domains together with DWNN and RING finger domains, which are associated with protein degradation function. In order to clarify the role of RBBP6 in cervical cancer, immunolabeling staining was performed on paraffin-fixed tissues, the results of which are shown in Figure 1. Expression of RBBP6 was observed in all cancers from non-keratinized to keratinized and from adenocarcinoma to squamous carcinoma. The results further showed less expression of RBBP6 in the poorly differentiated tumors as compared to well-differentiated tissues suggesting that RBBP6 expression is higher in proliferating cells, which further supports our hypothesis that it is a cell-proliferating gene (Figure 1). Similar results were reported in our earlier research where we observed overexpression of RBBP6 in lung cancer and in a study by Chen et al14 who also reported overexpression of RBBP6 in colon cancer.
RBBP6 manipulation, both silencing and upregulation, was successful in which we reported a knockdown of up to 75% and an upregulation of up to 90% (Figure 2A–C). This was further confirmed by immunocytochemistry where GFP-expressing cells which are directly proportional to RBBP6 overexpression were identified (Figure 2D). Our study is the first to report the upregulation of RBBP6, while silencing has been done before in other laboratories including ours in MCF-7 breast cancer cell line.15–18 Silencing of RBBP6 halted both HeLa and SiHa cell progression as shown by xCELLigence (Figure 3A–C). All cancer cells treated with siRBBP6 at 24 hours posttreatment showed reduced CI, which is an indicator of live cells that are attached to the surface of the plate and proliferating. However, the same was not true for cells that had RBBP6 upregulation, since they continued to show a steady increase in CI (Figure 3). Interestingly, MRC-5 cells treated with pRBBP6 had a significant increase in CI suggesting that RBBP6 might be causing them to proliferate. The results suggest a role for RBBP6 in cancer progression and thus a potential biomarker.
We then went on to combine RBBP6 targeting with chemotherapeutic agents, camptothecin and GABA. GABA is a major inhibitory neurotransmitter in adult central nervous system and has been shown to inhibit tumor cell migration in liver cancer cells through binding to GABAB receptors.18–25 Activation of these receptors has been linked to inhibition of an enzyme called adenylate cyclase which plays a role in promoting cell migration via the protein kinase A signaling cascade.26–29 Camptothecin is a plant-derived natural compound that shows high potency in inducing apoptosis by interacting with DNA strand breaks, thus preventing the function of topoisomerase I during replication.30 Treatment with camptothecin and siRBBP6 + camptothecin halted cell proliferation, while cells treated with GABA continued to proliferate in a similar manner to those treated with pRBBP6 and pRBBP6 + GABA (Figure 3D–F). These results indicate that siRBBP6 together with camptothecin was able to prevent cell proliferation in cancer cells but did not have any impact on MRC-5 cell lines. These types of results are similar to those reported earlier in mouse cells.8 GABA, on the other hand, does not seem to play much role in cell growth inhibition in cancer cells.
In tumors expressing inactive p53, inhibition of RBBP6/MDM2 has been proposed as a biomarker of restoration of p53 activity.20,21 In this study, we combine silencing/upregulation of RBBP6 together with camptothecin and GABA to evaluate its potential to sensitize wild-type p53-expressing cervical cancer cell line to apoptosis-induced cell death. Through flow cytometry, we observed increased apoptosis rather than necrosis in cancer cells treated with siRBBP6 and those treated with siRBBP6 + camptothecin (Figure 4). However, GABA alone did not induce a significant amount of cell death, but in combination with siRBBP6, it showed a slight reduction in apoptosis perhaps playing antagonistic role for siRBBP6. Similar results were previously reported in MCF-7 treated with camptothecin and siRBBP6.15
pRBBP6, in combination or alone, induced minimum amount of apoptosis suggesting that it might be promoting cancer progression. Microscopic analysis showed disruption of nucleus and shrinkage of cells treated with siRBBP6, siRBBP6 + camptothecin, siRBBP6 + GABA, and GABA confirming that the cell death identified through CI and flow cytometry was a result of apoptosis induction rather than necrosis (Figure 4). And the observations by xCELLigence assay that suggested little cell growth inhibition by GABA might be because some of the cells were caught in between stages, especially early apoptosis. Of note is the 0.1% apoptosis induction in MRC-5 cells treated with pRBBP6, which correlates with the observed increase of CI in xCELLigence assay, thus suggesting and supporting our hypothesis that indeed RBBP6 promotes proliferation. The proliferation potential of RBBP6 was also shown in a study by Miotto et al25 in which cancer progression was associated with spontaneous breakage of common fragile sites which are otherwise stabilized by un-deregulated RBBP6.
The caspases are a family of cysteine proteases that are the main effectors of apoptosis or programmed cell death, and their activation leads to characteristic morphological changes in the cell such as shrinkage, chromatin condensation, DNA fragmentation, and plasma membrane blebbing.18 All these characteristics were identified using microscopy following treatment with siRBBP6, siRBBP6 + camptothecin, siRBBP6 + GABA, and to a lesser extent, with GABA (Figure 5). Further analysis of caspase activity also confirmed that caspase-3/7 was increased in cells treated with siRBBP6 and siRBBP6 + camptothecin. However, the same was not true in those treated with GABA or GABA + siRBBP6 (Figure 6). Upregulation of RBBP6 did not result in any significant increase in caspase activity (Figure 6). These types of results were also reported in a study by Moela et al in which camptothecin was reported to increase apoptosis in MCF-7 cancer cell line.15 In general, the overall apoptosis detection experiments support the idea that silencing RBBP6 in cancer cells and co-treating with camptothecin halt proliferation of cells by redirecting them via apoptosis.
A central checkpoint of apoptosis is the activation of caspase-9 by mitochondrial cytochrome c. The pro-survival proteins appear to protect mitochondria, since bcl-2 prevents the release of cytochrome c.22 Mitochondria are also a place of synthesis of ATP that is also required for induction of apoptosis.23 Decrease in mitochondrial ATP activity might mean that more and more ATP is utilized by cells to induce apoptosis. These are some results we observed in cells treated with siRBBP6 and siRBBP6 + camptothecin where, after 6 hours of treatment, ATP was reduced. These results correlate with all other results that we reported in this study that have shown siRBBP6 and siRBBP6 + camptothecin being responsible for cell death by apoptosis (Figure 7). pRBBP6 alone or in combination with GABA did not show any positive impact on cancer cell line except to keep cells proliferating. All these hallmarks of apoptosis were supported by an increase in bax, caspase-3, and caspase-8 gene expression in all cancer cells treated with siRBBP6 and siRBBP6 + camptothecin, whereas the Bcl-2 anti-apoptotic gene remained unchanged (Figure 7), thus resulting in an increased bax/bcl-2 ratio. However, mitochondrial activity assay suggested that the apoptotic pathway induced was not entirely dependent on mitochondria since bak1 remained unchanged. Bax oligomerizes with itself or with bak1 during apoptosis activation via mitochondria and allows them to release cytochrome c.24 On the other hand, TP53 was also increased in all siRBBP6 treatments suggesting that it might have played a role in translocating bax to the outer mitochondrial membrane in order to initiate intrinsic apoptosis.
Cell cycle control is a fundamental cellular process that governs cellular proliferation. The product of CDKN1A, p21, is an important regulatory protein within the cell cycle which is activated by p53, and when cells overexpress p21, the cell cycle is arrested in the G1 and G2 phases.25 In this study, we looked at the cell cycle induction following all the treatments and what we observed was that siRBBP6 alone was able to induce cell cycle arrest at G0/G1, while in combination with GABA, percentage of cell cycle arrest was slightly reduced (Figure 4). In camptothecin-only treatment and siRBBP6 + camptothecin combined treatment, most HeLa cells were arrested at G0/G1, which suggested that the cells did not progress through the cell cycle process but were rather redirected to apoptosis. In contrast, SiHa cell populations accumulated in the G2/M phase, which suggested that some of the cells might have escaped apoptosis following treatment and were instead directed to undergo what looks like mitotic apoptosis. GABA and camptothecin alone did induce cell cycle arrest in all cell lines except in MRC-5 but at a lower percentage. pRBBP6 showed an increase in S-phase which further suggested that DNA replication was increased and cells were allowed to proliferate. These results suggest that cell cycle arrest was not the preferred mechanism of anti-proliferation in this experiment but rather apoptosis. They further suggest that GABA, either alone or in combination with siRBBP6, has little or no impact on cancer progression, whereas camptothecin and siRBBP6 play a critical role in halting proliferation of cervical cancer cell lines (Figure 4).
Conclusion
Taken all together, we discovered that RBBP6 is markedly upregulated in squamous cervical carcinomas, including the less prevalent adenocarcinomas. And further investigations revealed that not only does it play a role in promoting cell proliferation but it is also associated with apoptosis. The fact that RBBP6-knockdown cells become sensitized to apoptosis induced by camptothecin coupled with cell cycle arrest implicates the gene as a potential target in cervical cancer management. The synergistic effect observed between siRBBP6 and camptothecin could be attributed to the mechanism of action of each. It is well known that camptothecin damages and prevents DNA replication, thus resulting in failed cell division, whereas RBBP6 is said to work alongside telomerase in promoting cell division and cell proliferation. Based on this, combination of siRBBP6 and camptothecin seems to be effective in preventing cell proliferation and inducing apoptosis in HeLa and SiHa cell lines. Accumulation of TP53 following RBBP6 silencing provides early insights into the possible interaction between RBBP6 and TP53 and whether or not RBBP6 plays a role in TP53 degradation, and therefore, this area of study leaves room for further investigations. The inability of GABA to show effectiveness in inducing apoptosis either on its own or in combination with RBBP6 targeting could be attributed to the fact that its mechanism of action focuses more on cell migration rather than apoptosis induction. Future investigations on the effects of GABA on cell migration and chemotaxis in cervical cancer would therefore be interesting. In conclusion, these observations suggest that RBBP6 is a promising biomarker of cervical cancer.
Acknowledgment
The authors would like to thank the South African Medical Research Council for funding this research.
Disclosure
The authors report no conflicts of interest in this work.
References
Ma X, Yu H. Global burden of cancer. Yale J Biol Med. 2006;79(3–4):85–94. | ||
Sankaranarayanan R, Nene S, Shastri K, et al. HPV screening for cervical cancer in India. N Engl J Med. 2009;360:1385–1394. | ||
Fernandes JV, Araujo JM, Fernandes TA. Biology and natural history of human papillomavirus infection. OAJCT. 2013;1:1–12. | ||
Denny L. Cervical cancer in South Africa: an overview of current status and prevention strategies. CME. 2010;28(2):70–73. | ||
Bosch FX, Lorincz A, Munoz N, Meijer CJ, Shah KV. The causal relation between human papilloma virus and cervical cancer. J Clin Pathol. 2002;55:244–265. | ||
Schiffman MH, Brinton LA. Epidemiology of cervical carcinogenesis. Cancer. 1995;76(10 Suppl):1888–1901. | ||
Munoz N, Bosch FX, DeSanjose S, et al. The causal link between human papillomavirus and invasive cervical cancer: a population-based case-control study in Columbia and Spain. Int J Cancer. 1992;52: 743–749. | ||
Pugh DJ, Ab E, Faro A, Lutya PT, Hoffmann E, Rees DJ. DWNN, a novel ubiquitin-like domain, implicates RBBP6 in mRNA processing and ubiquitin-like pathways. BMC Struct Biol. 2006;6:1–8. | ||
Motadi LR, Bhoola KD, Dlamini Z. Expression and function of retinoblastoma binding protein 6 (RBBP6) in human lung cancer. Immunobiology. 2011;216:1065–1073. | ||
Motadi LR, Misso NL, Dlamini Z, Bhoola KD. Molecular genetics and mechanisms of apoptosis in carcinomas of the lung and pleura: therapeutic targets. Int Immunopharmacol. 2007;7:1934–1947. | ||
Bianco R, Ciardiello F, Tortora G. Chemosensitization by antisense oligonucleotides targeting MDM2. Curr Cancer Drug Targets. 2005; 5(1):51–56. | ||
Zhang XD, Gillespie SK, Hersey P. Staurosporine induces apoptosis of melanoma by both caspases-dependent and caspases-independent apoptotic pathways. Mol Cancer Ther. 2004;3:187–197. | ||
Ajay AK, Meena AS, Bhat MK. Human papilloma virus 18 E6 inhibits phosphorylation of p53 expressed in HeLa cells. Cell Biosci. 2012;2:2–13. | ||
Chen J, Tang H, Wu Z, et al. Overexpression of RBBP6, alone or combined with mutant TP53, is predictive of poor prognosis in colon cancer. PLoS ONE. 2013;8(6):1–9. | ||
Moela P, Choene MS, Motadi LR. Silencing RBBP6 (retinoblastoma binding protein 6) sensitises breast cancer cells MCF-7 to staurosporine and camptothecin-induced cell death. Immunobiology. 2014;219:513–601. | ||
Pretorius A, Bankole HA, Meyer M, Februar F, Rees DJG. Silencing of mouse RBBP6 using interference RNA implicates it in apoptosis and the cell cycle. GSTF Int JBio. 2013;2(2):50–58. | ||
Selivanova G, Wiman KG. Reactivation of mutant p53: molecular mechanisms and therapeutic potential. Oncogene. 2007;26(15):2243–2254. | ||
Choene MS, Motadi LR. Anti-proliferative effects of methanolic extract of K. foetidissima in breast cancer cell lines MCF-7 and YMB1. Mol Biol. 2012;102:1–5. | ||
Lindsten T, Ross AJ, King A, et al. The combined functions of proapoptotic BCl-2 family members bak and bax are essential for normal development of multiple tissues. Mol Cell. 2000;6(6):1389–1399. | ||
Basset-Seguin N, Ibbotson SH, Emtestam L, et al. Topical methylaminolaevulinate photodynamic therapy versus cryotherapy for superficial basal cell carcinoma: a 5 year randomized trial. Eur J Dermatol. 2008;18(5):547–553. | ||
Boatright KM, Salvesen GS. Mechanisms of caspase activation. Curr Opin Cell Biol. 2003;15(6):725–731. | ||
Hansen EL, Sozer EB, Romeo S, Frandsen SK, Vernier PT, Gehl J. Dose-dependent ATP depletion and cancer cell death following calcium electroporation, relative effect of calcium concentration and electric field strength. PLoS ONE. 2015;10(4):1–12. | ||
Elmore S. Apoptosis: a review of programmed cell death. Toxicol Pathol. 2007;35(4):595–516. | ||
Wan CK, Wang C, Cheung HY, Yang M, Fong WF. Triptolide induces Bcl-2 cleavage and mitochondria dependent apoptosis in p53-deficient HL-60 cells. Cancer Lett. 2006;241(1):31–41. | ||
Miotto B, Chibi M, Xie P, et al. The RBBP6/ZBTB38/MCM10 axis regulates DNA replication and common fragile site stability. Cell Rep. 2014;7:575–587. | ||
Chen Z, Bao M, Xu Y. Suppression of human liver cancer cell migration and invasion via the GABAA receptor. Cancer Biol Med. 2012;9:90–98. | ||
Young SZ, Bordey A. GABA’s control of stem and cancer cell proliferation in adult neural and peripheral niches. Physiology (Bethesda). 2009;24:171–185. | ||
Zhang X, Zhang R, Zheng Y, et al. Expression of gamma-aminobutyric acid receptors on neoplastic growth and prediction of prognosis in non-small cell lung cancer. J Transl Med. 2013;11:102. | ||
Nemana J, Terminib J, Wilczynskic S. Human breast cancer metastases to the brain display GABAergic properties in the neural niche. PNAS. 2013;111(3):984–989. | ||
Liu FL. Mechanism of action of camptothecin. Ann N Y Acad Sci. 2000; 922:1–10. |
 © 2016 The Author(s). This work is published and licensed by Dove Medical Press Limited. The full terms of this license are available at https://www.dovepress.com/terms.php and incorporate the Creative Commons Attribution - Non Commercial (unported, v3.0) License.
By accessing the work you hereby accept the Terms. Non-commercial uses of the work are permitted without any further permission from Dove Medical Press Limited, provided the work is properly attributed. For permission for commercial use of this work, please see paragraphs 4.2 and 5 of our Terms.
© 2016 The Author(s). This work is published and licensed by Dove Medical Press Limited. The full terms of this license are available at https://www.dovepress.com/terms.php and incorporate the Creative Commons Attribution - Non Commercial (unported, v3.0) License.
By accessing the work you hereby accept the Terms. Non-commercial uses of the work are permitted without any further permission from Dove Medical Press Limited, provided the work is properly attributed. For permission for commercial use of this work, please see paragraphs 4.2 and 5 of our Terms.