")
Back to Journals » Drug Design, Development and Therapy » Volume 15
RASSF1A Enhances Chemosensitivity of NSCLC Cells Through Activating Autophagy by Regulating MAP1S to Inactivate Keap1-Nrf2 Pathway
Authors Wang J, Zhang X, Yang F, Yang Y, Wang T, Liu W, Zhou H, Zhao W
Received 28 June 2020
Accepted for publication 24 November 2020
Published 6 January 2021 Volume 2021:15 Pages 21—35
DOI https://doi.org/10.2147/DDDT.S269277
Checked for plagiarism Yes
Review by Single anonymous peer review
Peer reviewer comments 2
Editor who approved publication: Professor Manfred Ogris
Jincai Wang,1 Xufeng Zhang,1 Fang Yang,2 Yuguang Yang,1 Tianjiao Wang,1 Wenming Liu,1 Hongfeng Zhou,1 Wei Zhao3
1Department of Medical Oncology, Harbin Medical University Cancer Hospital, Harbin, Heilongjiang 150086, People’s Republic of China; 2Department of Medical Oncology, Boao Evergrande International Hospital, Qionghai, Hainan 571400, People’s Republic of China; 3Department of Neurobiology, Harbin Medical University, Heilongjiang Provincial Key Laboratory of Neurobiology, Harbin, Heilongjiang, 150086, People’s Republic of China
Correspondence: Wei Zhao
Department of Neurobiology, Harbin Medical University, Heilongjiang Provincial Key Laboratory of Neurobiology, No. 194, Harbin, Heilongjiang 150086, People’s Republic of China
Tel +86-13796666580
Email [email protected]
Objective: Cisplatin (DDP) is an effective first-line therapy for non-small cell lung cancer (NSCLC) treatment; however, it can cause resistance and thus pose an obstacle to the efficacy of chemotherapy in NSCLC. This study aims to detect the effect of RASSF1A on DDP resistance of NSCLC and the underlying mechanism.
Methods: The expression levels of RASSF1A and microtubule-associated protein 1S (MAP1S) were investigated by qRT-PCR and Western blot and their interaction was testified by co-immunoprecipitation (Co-IP) analysis. The IC50 value of DDP on A549 and A549/DDP cells (DDP-resistant cells) was measured. A549/DDP cells were transfected with pCDNA3.1-RASSF1A, pCDNA3.1-MAP1S, or si-RASSF1A, followed by treated with DDP. Cell counting kit-8 (CCK-8) and 5-ethynyl-2ʹ-deoxyuridine (EDU) were employed to measure cell survival rate. Western blot was applied to test the levels of autophagy-associated proteins p62, LC3II, and LC3I. Immunofluorescence staining was used to detect the green fluorescent protein (GFP)-LC3 puncta to evaluate the level of autophagy. Finally, a xenograft model in nude mice using A549/DDP cells was developed.
Results: RASSF1A and MAP1S were lowly expressed and positively correlated in NSCLC tissues. We observed that RASSF1A and MAP1S overexpression significantly enhanced DDP-induced effects in A549 and A549/DDP cells, including decreased cell viability, as well as increased autophagy levels. Besides, investigations into the mechanism between RASSF1A and MAP1S disclosed that RASSF1A could regulate MAP1S to inactivate the Keap1-Nrf2 pathway, thus activating autophagy to enhance chemosensitivity. Moreover, consistent results were confirmed in vivo experiments.
Conclusion: RASSF1A increases chemosensitivity in NSCLC by facilitating autophagy via MAP1S-mediated Keap1-Nrf2 pathway.
Keywords: RASSF1A, MAP1S, chemosensitivity, autophagy, Keap1-Nrf2, A549/DDP
Introduction
Lung cancer is the leading cause of cancer-related death, and around 80–85% of lung cancers are characterized as non-small cell lung cancer (NSCLC).1,2 Nowadays, chemotherapy is still widely used, and recent trials have combined traditional chemotherapy with newer agents.3 Cisplatin (DDP), cis-Diamineplatinum (II) dichloride, is currently one of the most frequent and effective chemotherapeutic agents for advanced NSCLC treatment.4–7 Unfortunately, the efficacy of CDDP is often limited by intrinsic or acquired resistance of cancer cells to its cytotoxicity, resulting in a dismal 5-year survival of less than 25% and high rates of local disease failure of approximately 50% of these patients,8 thus impeding its effectiveness in the management of NSCLC.9,10 Therefore, the identification of molecular mechanisms concerning chemoresistance may improve clinical outcomes.
Autophagy is an alternative cell death mechanism known as programmed cell death type II, which also suppresses the growth of tumor cells.11 Also, accumulating study has illustrated that autophagy is one of the important physiological activities that helps to control cell survival and influences the dynamics of cell death in the pathophysiology of NSCLC, supporting the notion that autophagy is necessary for NSCLC progression.12 However, the detailed mechanism and significance of autophagy in NSCLC chemoresistance remain largely unknown. Therefore, elucidation of autophagic signaling mechanisms with regards to specific types of cancer and therapies is required to develop more effective chemotherapeutic combinations for cancer treatment.
The Ras-association domain family 1 (RASSF1A), known as a tumor-suppressor protein, is abundantly inactivated in multiple human cancers.13 A previous study revealed that RASSF1A was expressed in all normal human tissues and verified to be downregulated in NSCLC.14 The role of RASSF1A as a tumor suppressor gene has been involved in diverse activities including modulation of autophagy.15,16 Furthermore, a recent study disclosed that RASSF1A interacts with Microtubule-associated protein 1S (MAP1S) that regulates autophagy initiation in hepatocellular carcinoma.17 However, the potential mechanism of RASSF1A participation in autophagy and NSCLC drug resistance has not been well documented. Therefore, this study is conducted to explore the role of RASSF1A-mediated autophagy in NSCLC chemotherapy and the underlying molecular mechanism.
In the present work, we concluded that RASSF1A contributes to chemotherapy resistance in NSCLC both in vivo and in vitro. Further analysis disclosed that RASSF1A could regulate MAP1S and increase the chemosensitivity of NSCLC by inducing autophagy. We propose here a novel mechanism in which RASSF1A increases DDP-induced chemoresistance in NSCLC by facilitating autophagy via MAP1S-mediated Keap1-Nrf2 pathway. These findings reported that RASSF1A may promote autophagy, acting as a promising therapeutic target for NSCLC patients with DDP-resistance.
Materials and Methods
Ethical Statement
The animal and tissue experiments were both approved by the Harbin Medical University Affiliated Tumor Hospital ethics committee. The animal experiments were conducted in strict accordance with the Measures for the Administration of Laboratory Animals in Harbin Medical University (Harbin, China). Written informed consent was obtained from all subjects and this work was ethically licensed by the local hospital ethics committee. All efforts have been made to minimize the pain of the animals.
Collection of Clinical Samples
A total of 56 cases of fresh NSCLC tissues and its adjacent normal tissues were obtained from Harbin Medical University. Tissue samples were immediately cooled in liquid nitrogen and stored at −80°C. In this study, 56 cases of NSCLC patients were adenocarcinoma. Only patients who met the following criteria were enrolled: (1) patients with primary NSCLC (recurrent cases were excluded); (2) no radiotherapy, chemotherapy, or other treatment before operation; (3) diagnosis by professional pathologists according to the histopathologic diagnostic criteria for NSCLC; (4) without other malignancy; and (5) complete clinicopathological data and detailed follow-up information.
Data in Public Database
The data related to RASSF1A expression levels in NSCLC patients from Gene Expression Profiling Interactive Analysis (GEPIA, http://gepia.cancer-pku.cn/#index) were collected. The parameters including RASSF1A and LUAD were input for data searching.
Cell Culture and Transfection
NSCLC A549 cells and A549/DDP cells (DDP-resistant cells) were obtained from the American Type Culture Collection (Manassas, VA, USA). All cells were fostered in RPMI-1640 containing 10% fetal bovine serum (FBS) and 100 μg/mL of penicillin-streptomycin. To maintain A549/DDP cell line’s drug-resistant phenotype, additional 1 μg/mL of DDP (Sigma-Aldrich, Merck KGaA, Darmstadt, Germany) was added into the culture medium for incubation in a humid atmosphere containing 5% CO2 at 37°C.
pCDNA3.1-RASSF1A, si-RASSF1A, pCDNA3.1-MAP1S, and their negative controls pCDNA3.1 and si-NC (Genepharma, Shanghai, China) were transfected/co-transfected in A549/DDP cells using Lipofectamine 2000 Transfection Reagent (Thermo Fisher Scientific, Waltham, MA, USA). Correspondingly, cells were grouped into the pCDNA3.1-RA group, si-RA group, pCDNA3.1-MA group, pCDNA3.1 group, si-NC group, DDP group (A549/DDP cells treated with 10 μg/mL DDP), pCDNA3.1 + DDP group (transfection with pCDNA3.1 and then treatment with DDP), pCDNA3.1-RA + DDP group (transfection with pCDNA3.1-RASSF1A and then treatment with DD), pCDNA3.1-MA + DDP group (transfection with pCDNA3.1-MAP1S and then treatment with DDP), pCDNA3.1-MA + si-RA group (co-transfection with pCDNA3.1-MAP1S and si-RASSF1A), pCDNA3.1-MA + si-RA + DDP group (co-transfection with pCDNA3.1-MAP1S and si-RASSF1A before DDP treatment), pCDNA3.1-MA + DDP + BM group (transfection with pCDNA3.1-MA before DDP and 1 μM of Nrf2 activator bardoxolone methyl co-treatment; Selleck, Shanghai, China). The Control group was set for negative control.
Cell Counting Kit-8 (CCK-8) Assay
Briefly, the cells (5 × 10³/well) were seeded into 96 well plates and incubated for 24 h. Afterward, cells were added to each well in the incubator for 4 h at 37°C. Finally, the absorbance value of each well was measured at 450 nm wavelength on a microplate reader. Each measurement was repeated thrice. Cell survival rate = (OD value in the experimental group/OD value in the control group) × 100%.
5-Ethynyl-2ʹ-Deoxyuridine (EdU) Fluorescent Staining Assay
Cells seeded into the 96-well plate at the density of 1 × 10⁵/well were cultured with 100 mL of 50 μM of EDU (Sigma-Aldrich, Merck KGaA, Darmstadt, Germany) for 2 h before cells were fixed in the buffer for 30 min at room temperature. After the buffer was removed, the cells were incubated with 50 mL of 2 mg/mL glycine for 5 min, followed by 100 μL of PBS washing. Permeabilization buffer (100 μL) was then added before cells were washed with 100 μL of PBS. Subsequently, cells were incubated with 100 μL of 1 × Apollo solution for 30 min in the dark at room temperature, followed by incubation with 100 μL of 1 × DAPI solution at room temperature, away from light, for 30 min. The staining of cells was examined using a fluorescence microscope (Olympus, Tokyo, Japan) after cells were rinsed in 100 μL of PBS.
Co-Immunoprecipitation (Co-IP) Assay
A549/DDP cells were lysed with RIPA buffer containing protease inhibitor at 4°C and centrifuged at 12,000 rpm for 15 min. Then, the supernatant was discarded and the protein concentration was detected using the BCA kit. Protein was diluted to 2 μg/μL with RIPA Buffer containing protease inhibitor (Merck, Shanghai, China). After that, proteins were incubated with 10 μL of antibody on a rotator overnight at 4°C and 10 μL of anti-IgG was added correspondingly in the control group. Then, 30 μL of Protein G Agarose was added for rotation on a 4°C rotator overnight. After centrifugation (14,000 g, 1 min) with supernatant discarded, the protein was washed 3 ~ 5 min with RIPA buffer and dissolved with 30 μL of 2 × Laemmli sample buffer in the pre-heated metal bath for 5 min at 100°C. The supernatant was collected after centrifugation for Western blot.
The used antibodies are as follows: RASSF1A (ab31369, Abcam, Cambridge, UK), MAP1S (sc-517,081, Santa Cruz, Dallas, USA), anti-IgG (Thermo Fisher Scientific, MA, USA).
Animals
The 4-week-old BALB/c-A nude mice were acquired from Hunan SJA Laboratory Animal Co., Ltd (Changsha, China) and housed in a specific pathogen-free animal’s facility on a 12:12 h light/dark cycle, with access to food and water ad libitum. Approximately a week later, A549/DDP cell lines (Hanheng, Shanghai, China) transfected with pCDNA3.1-RASSF1A or pCDNA3.1, or untreated A549/DDP cell lines were subcutaneously injected (1 × 10⁶ cells per injection) into the right back of nude mice. Six nude mice were used in each group. On the following day, after intraperitoneal injection of CDDP (3.0 mg/kg, 3 times/week) for 4 weeks, nude mice were sacrificed and the tumor tissues were weighted for further evaluation.
Quantitative Reverse Transcription-Polymerase Chain Reaction (qRT-PCR)
Total RNA from cells or tissues was extracted utilizing TRIzol reagent (Invitrogen, Carlsbad, CA, USA) in compliance with the manufacturer’s instructions. RNAs were reverse transcribed into cDNA using a cDNA synthesis kit (Toyobo, Osaka, Japan) and then quantified by spectrophotometer (Shimadzu, Kyoto, Japan). The cDNA was reverse transcribed using an SYBR Green PCR Kit (Toyobo, Osaka, Japan) and analyzed utilizing Prism 7300 sequence detector (Applied Biosystems, Foster City, CA). The experimental parameters were as follows: 5 min pre-denaturation at 95°C, 40 cycles of denaturing at 95°C for 10 s, annealing at 60°C for 10 s, and then extension at 72°C for 20 s. The data analysis was conducted by the 2−ΔΔCt method. The primer sequences are displayed in Table 1.
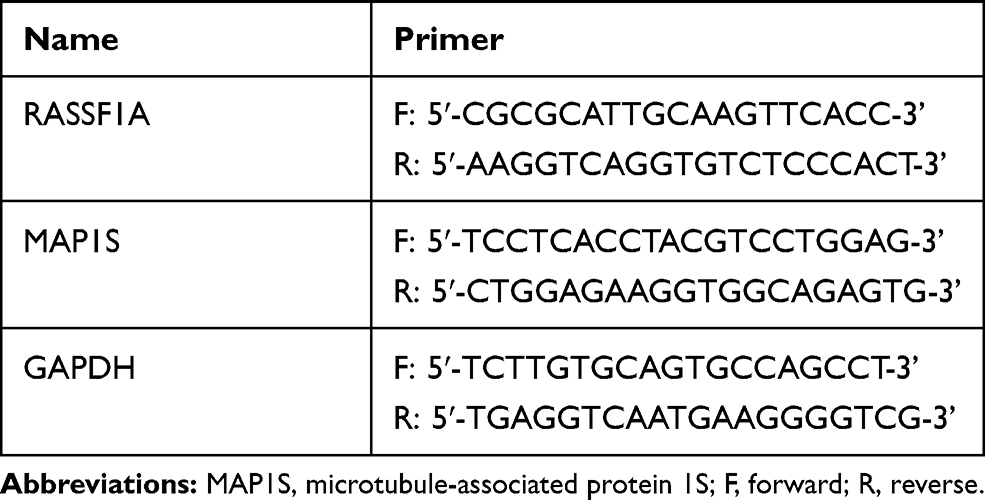 |
Table 1 Primer Sequence for Quantitative Reverse Transcription Polymerase Chain Reaction to Determine the Expression Levels of RASSF1A, MAP1S, and GAPDH |
Western Blot
The collected cells were mixed with RIPA buffer containing protease inhibitor and phosphatase inhibitor. Subsequently, the cells were centrifuged at 13,000 rpm for 30 min at 4°C. Meanwhile, the tumor tissues were homogenized and lysed for 30 min on ice in lysis buffer, then the cell lysate was transferred into 1.5 mL tube and centrifuged at 12,000 rpm, 4°C for 5 min. The supernatant was collected to determine protein concentration using a BCA protein assay kit and SDS-PAGE was performed to isolate protein. Then, the protein was transferred to membranes and cultured with primary antibody overnight at 4°C, followed by PBST wash for three times. Thereafter, the secondary antibody was added for incubation (30 min) at room temperature. After membranes were washed with PBST for four times, electrogenerated chemiluminescence (ECL) system (GE Healthcare, Beijing, China) was used for image observation.
The used antibodies are as follows: GAPDH (ab181602), RASSF1A (ab31369), p62 (ab109012), LC3I/LC3II (ab51520), Nrf2 (ab62352) (Abcam, Cambridge, UK); MAP1S (sc-517081, Santa Cruz, Dallas, USA); goat anti-rabbit IgG (Beijing ComWin Biotech Co., Ltd).
Immunofluorescence Staining
After fixation with 4% paraformaldehyde, cells were washed with PBS (3 × 5 min) and permeabilized with PBS containing 1% Triton X-100 for 25 min, followed by PBS washing for three times. Thereafter, cells were blocked with 5% bovine serum albumin for 45 min before incubation with the primary antibody at 4°C overnight. After washing with PBS (3 × 5 min), the cells were incubated with secondary goat anti-rabbit IgG antibody (Dy Light 488) for 2 h at room temperature. Then, the nucleus was stained with DAPI (Beyotime Institute of Biotechnology). Finally, the stained sections were visualized using a microscope (Nikon, Japan).
Immunohistochemistry
Paraffin sections of 4 μm thickness were prepared by fixing the isolated tumor tissues for 48 h in 4% paraformaldehyde after which the paraffin sections were baked in an oven for 20 min and then deparaffinized with xylene, followed by distilled water wash. After being washed for 3 times with PBS, sections were incubated with 3% H2O2 for 10 min at room temperature. Thereafter, sections were subjected to antigen retrieval after PBS washing for three times. Then, sections were sealed with normal goat serum at room temperature for 20 min, and the primary antibody of Ki-67 (ab16667, 1:200; Abcam, Cambridge, MA, USA) was added and cultured at 4°C overnight. Following three PBS washes, sections were cultured for 1 h with secondary antibody at room temperature before PBS washing for 3 times. Sections were incubated with diaminobenzidine (DAB) staining for 1–3 min. Nuclei were counterstained with hematoxylin for 3 min, and paraffin sections sequentially underwent dehydration, permeabilization, and sealing. The percentage of positive cells was determined.
TUNEL Staining
The sections, 4 μm thick, were dewaxed with xylene and dehydrated with graded ethanol series. Cell apoptosis was probed with TUNEL assay using an apoptosis detection kit (cat. no. ZK-8005; ZSJQB Co. Ltd., Beijing, China). Five fields were randomly selected from each section and observed under a microscope (Olympus Co., Tokyo, Japan). The brown or brownish yellow cells with apoptotic cell morphology were identified as apoptotic cells. The apoptosis index (AI) was used to reflect the degree of apoptotic cells according to the following formula: AI = (number of TUNEL positive cells/total number of cells) × 100%.
Statistical Analysis
Statistical analysis was conducted utilizing the Graphpad Prism 7 software. Values were summarized as mean ± standard deviation. Statistical difference was determined by t-test between two sets of data. One-way analysis of variance (ANOVA) was applied to monitor the differences among groups. Dunnett’s multiple comparisons test was used for multiple comparisons after ANOVA. Kaplan–Meier analysis was utilized to analyze the association of RASSF1A expression with overall survival of NSCLC patients. The relation of RASSF1A expression to pathological grade and KPS score was determined by the chi-square test and a Student’s t-test was used to detect the relation of NSCLC and age at diagnosis. A P < 0.05 was regarded as statistically significant.
Results
RASSF1A is Related with Clinical–Pathological Characteristics of NSCLC Patients
The levels of RASSF1A in tumor tissues of NSCLC patients were predicted using the GEPIA database. The results showed that as opposed to the Normal group, RASSF1A expression was dramatically dwindled in the Tumor group (Figure 1A, P < 0.05). In this regard, we examined the mRNA and protein levels of RASSF1A in NSCLC tissues and the corresponding adjacent normal tissues from patients (Figure 1B and C, P < 0.05). Compared with the Normal group, the levels of RASSF1A were markedly decreased in the Tumor group. Besides, we collected the pathological characteristics of each included patient, including age at diagnosis, size of tumor, grade, and KPS score. The expressions of RASSF1A of all included patients were collected and calculated for average expression levels. Of the 56 NSCLCs, 28 patients with RASSF1A expression below average were classified as RASSF1A Low group while the others were in RASSF1A High group. As depicted in Table 2, RASSF1A expression did not associate with sex (P = 0.7875) and age at diagnosis (P = 0.6289), but was significantly associated with size of tumor (P = 0.0151), pathological grade (P = 0.0135), KPS score (P = 0.0306), TNM staging (P = 0.0315), distant metastasis (P = 0.0143), and lymphatic metastasis (P = 0.0066). Patients in the RASSF1A Low group had larger tumor size and higher disease staging coupled with lower KPS score than in the RASSF1A High group. Further, we followed up the prognosis of the patients (n = 56) for 120 months. Kaplan-Meier analysis showed that the median survival of patients in the RASSF1A High group was 109.5 months while that in the RASSF1A Low group was 69.5 months (Figure 1D, P = 0.0116). The collective results suggest that lowly expressed RASSF1A in NSCLC patients was positively related to disease progression while negatively associated with the postoperative survival of NSCLC patients. Next, the levels of MAP1S in tumor tissues of patients both in the RASSF1A Low group and RASSF1A High group were measured (Figure 1E and F). The results revealed that MAP1S was lowly expressed in the RASSF1A Low group (vs RASSF1A High group) (P < 0.05). Collectively, the low expression of RASSF1A in NSCLC was negatively associated with the postoperative survival of patients, and RASSF1A expression was positively associated with MAP1S expression.
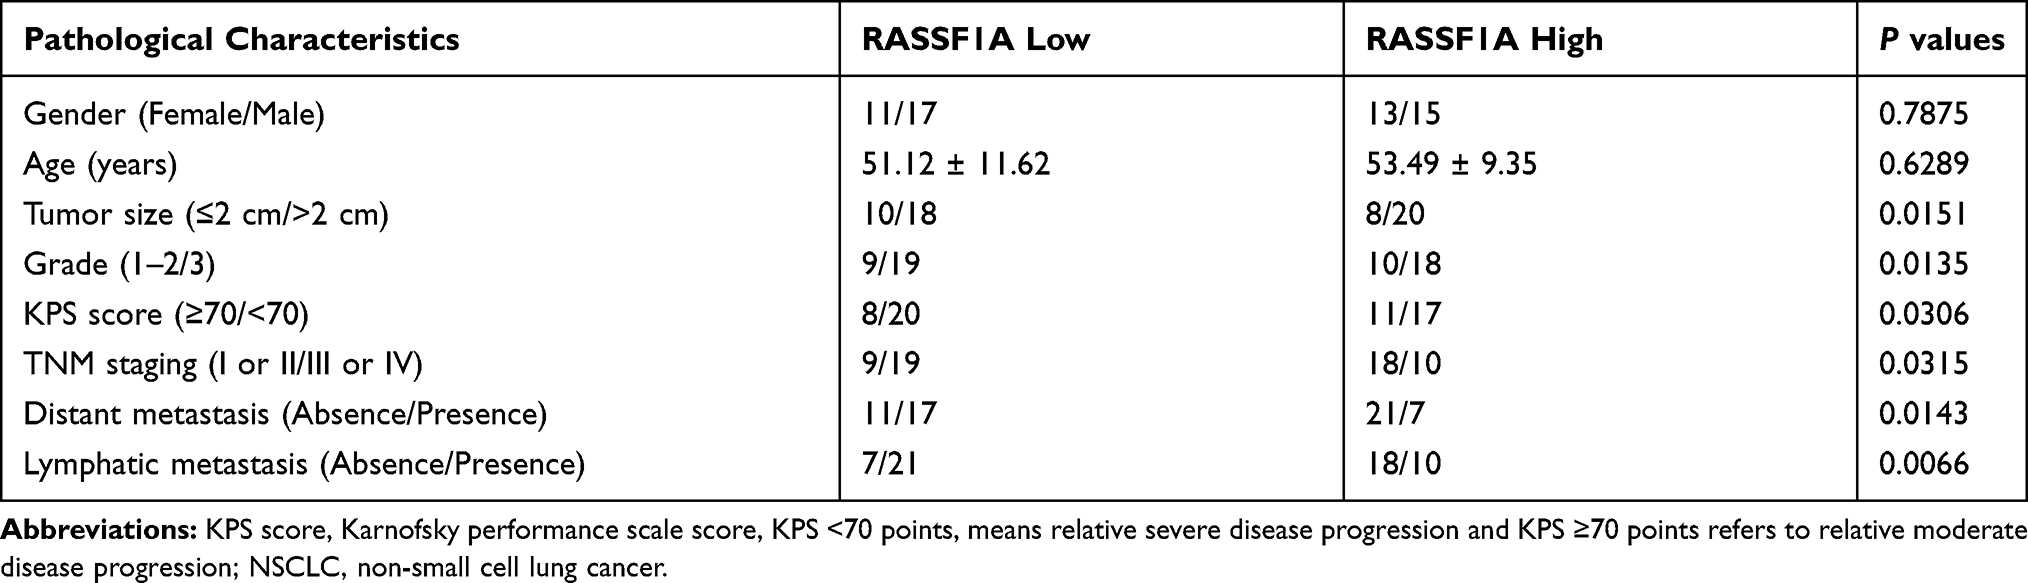 |
Table 2 The Association of RASSF1A Expressions with Clinical Pathological Characteristics of NSCLC Patients |
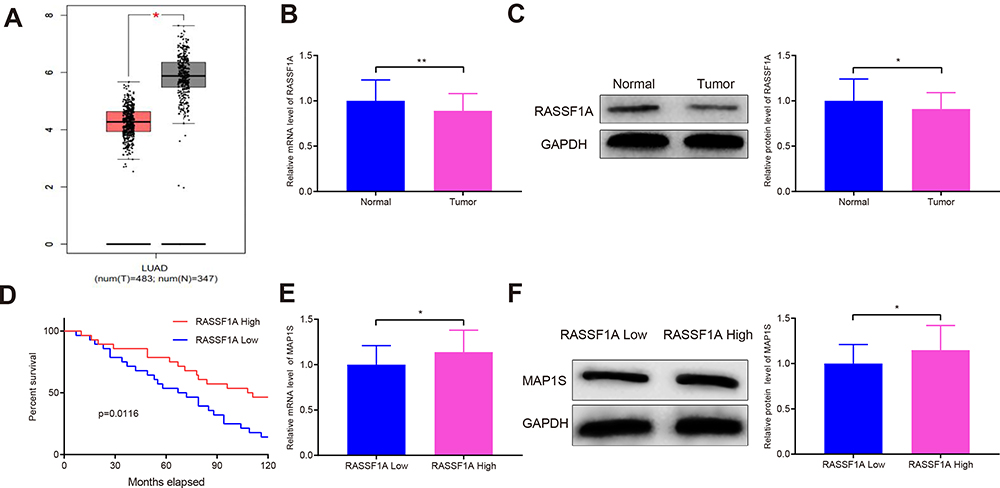 |
Figure 1 RASSF1A is associated with overall survival of NSCLC patients. Abbreviations: NSCLC, non-small cell lung cancer; MAP1S, microtubule-associated protein 1S. Notes: The GEPIA database predicted the levels of RASSF1A in tumor tissues of patients with NSCLC (A). The levels of RASSF1A were detected by qRT-PCR and Western blot (B and C). Expressions of RASSF1A and overall survival in patients with NSCLC were analyzed by Kaplan-Meier analysis (D). qRT-PCR and Western blot were employed to measure MAP1S expressions (E and F). Data were presented as mean ± standard deviation, *P < 0.05, **P < 0.01. |
RASSF1A Restores Chemosensitivity of A549/DDP Cells by Promoting Autophagy
A549 and A549/DDP cells were separately treated with 10 μg/mL of DDP. The detection manifested that in contrast to the Control group, the survival rate of A549 cells was significantly reduced, but no detectable change in the survival rate of A549/DDP cells was observed (Figure 2A and B). Then, the inhibition rates on A549 and A549/DDP cells were monitored in response to different concentrations of DDP treatment. As shown in Figure 2C, the IC50 value of DDP to A549 cells was 17.61 while DDP to A549/DDP cells was 46.72. The IC50 value of A549 cells to DDP was obviously smaller than that of A549/DDP cells. Next, the mRNA and protein levels of RASSF1A were detected in A549 and A549/DDP cells, respectively. The detection revealed that the levels of RASSF1A in A549/DDP cells were clearly inhibited than that in A549 cells (Figure 2D and E, P < 0.05).
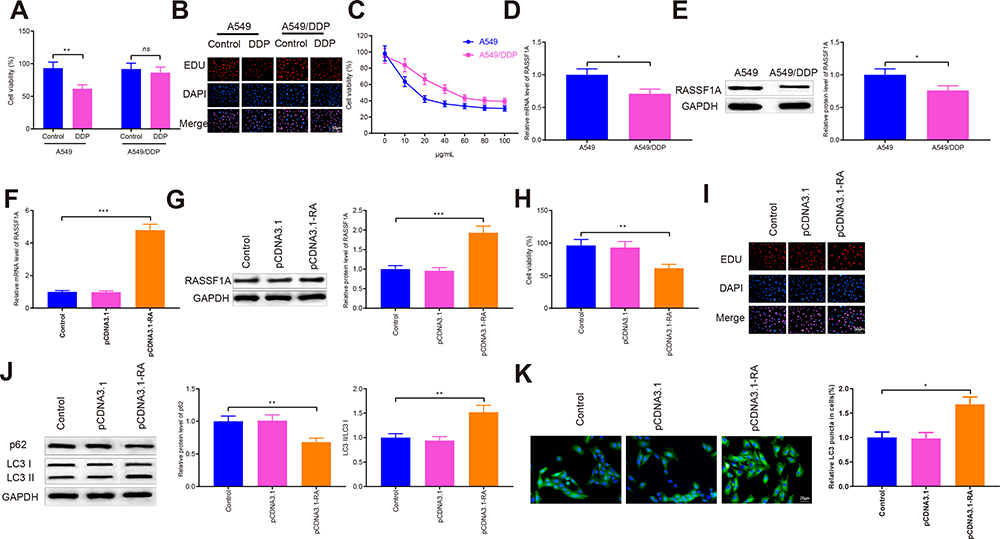 |
Figure 2 RASSF1A can trigger autophagy to improve chemosensitivity in A549/DDP cells. Abbreviations: DDP, cisplatin; MAP1S, microtubule-associated protein 1S; GFP, green fluorescent protein. Notes: After A549/DDP cells were transfected with pCDNA3.1-RASSF1A and then treated with DDP, cell viability was measured by CCK-8 and EDU (A and B). The IC50 value of DDP on A549 and A549/DDP cells was measured (C). qRT-PCR and Western blot were employed to measure RASSF1A levels (D and E). The mRNA and protein levels of RASSF1A were detected (F–G). Cell viability was measured by CCK-8 and EDU (H and I). The levels of p62, LC3II, and LC3I were probed with Western blot (J). The GFP-LC3 was measured by immunofluorescence staining (K). Data were presented as mean ± standard deviation, *P < 0.05, **P < 0.01, ***P < 0.001. |
To ascertain the effects of RASSF1A in NSCLC, pCDNA3.1-RASSF1A was transfected in A549/DDP cells. The detection of transfection efficiency applied by qRT-PCR (Figure 2F) and Western blot (Figure 2G) manifested that RASSF1A was successfully overexpressed in A549/DDP cells (P < 0.001). Subsequently, cell viability determined by CCK-8 (Figure 2H) and EDU (Figure 2I) showed that pCDNA3.1-RA group had lower survival rate compared with Control group (P < 0.01), and there was no notable difference between the pCDNA3.1 and the Control groups (P > 0.05), indicating that RASSF1A could suppress the growth of A549/DDP cells.
To gain an insight into the mechanism by which RASSF1A hinders the growth of A549/DDP cells, the levels of autophagy-associated proteins (p62, LC3II, and LC3I) were then explored (Figure 2J, P < 0.01). The detection revealed that compared with the Control group, pCDNA3.1-RA group had suppressed p62 level and increased LC3II/LC3I protein ratio, suggesting an upregulated autophagy response in A549/DDP cells by RASSF1A overexpression. Moreover, detection on green fluorescent protein (GFP)-LC3 puncta by immunofluorescence staining showed that PCDNA3.1-RA group had significantly increased GFP-LC3 puncta in A549/DDP cells (vs Control group) (Figure 2K, P < 0.05).
Cells with overexpressed RASSF1A were then treated with DDP to detect cell viability (Figure 3A and B). The results showed that there was no obvious difference in cell survival rate between the DDP + pCDNA3.1 and the DDP groups (P > 0.05), and the cell survival rate of the DDP + pCDNA3.1-RA group was distinctly lower than that of the DDP group (P < 0.01). Further, the levels of p62, LC3II, and LC3I were measured by Western blot (Figure 3C). There was no distinct difference of p62 expression or LC3II/LC3I protein ratio between the DDP + pCDNA3.1 group and DDP group (P > 0.05). While DDP + pCDNA3.1-RA group had a lower protein level of p62 and a higher LC3II/LC3I protein ratio compared with the DDP group (P < 0.01). Immunofluorescence staining showed that the levels of GFP-LC3 were upregulated in the pCDNA3.1-RA + DDP group of A549/DDP cells in contrast to the DDP group (Figure 3D, P < 0.01). These data indicated that RASSF1A could potentiate the chemosensitivity of A549/DDP cells to DDP.
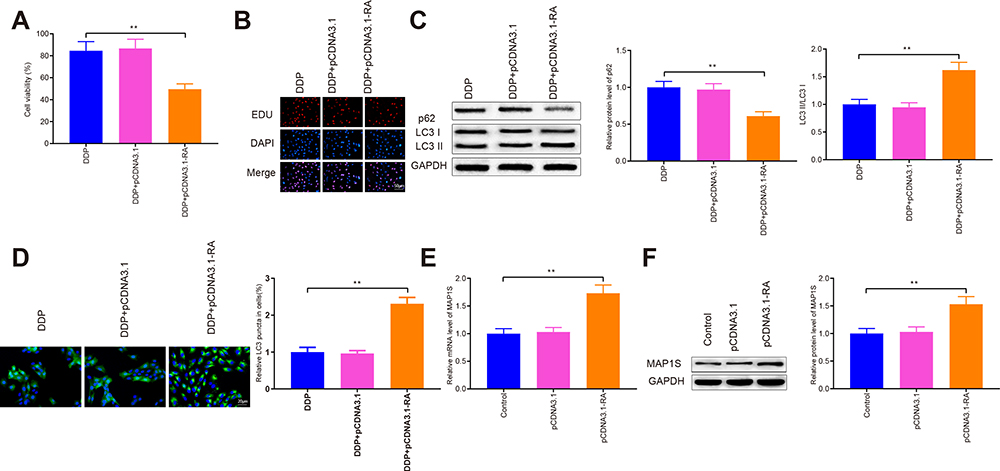 |
Figure 3 RASSF1A potentiates autophagy to improve chemosensitivity in A549/DDP cells. Abbreviations: GFP, green fluorescent protein; DDP, cisplatin. Notes: Cell viability was evaluated by CCK-8 and EDU (A and B). The levels of p62, LC3II, and LC3I were tested by Western blot (C). The GFP-LC3 was determined by immunofluorescence staining (D). The levels of MAP1S were assessed by qRT-PCR and Western blot (E and F); **P < 0.01. |
Additionally, the level of MAP1S was then assessed (Figure 3E and F), pCDNA3.1-RA group had a significantly higher level of MAP1S than that in the Control group (P < 0.01), while no obvious difference was found regarding MAP1S expression between pCDNA3.1 group and Control group (P > 0.05). The aforementioned data implicated that RASSF1A was a potential therapeutic target to restore chemosensitivity in DDP-resistant A549/DDP by eliciting autophagy.
MAP1S Restores Chemosensitivity of A549/DDP Cells by Eliciting Autophagy
Measurement of the levels of MAP1S in A549 and A549/DDP cells are depicted in Figure 4A and B. The data disclosed that MAP1S was expressed less abundantly in cells of the A549/DDP group (vs A549 group) (P < 0.05). To deeply investigate the function of MAP1S in NSCLC, pCDNA3.1-MAP1S was then transfected in A549/DDP cells. Transfection efficiency employed by qRT-PCR (Figure 4C) and Western blot (Figure 4D) showed that MAP1S was successfully overexpressed in A549/DDP cells (P < 0.001). Thereafter, CCK-8 (Figure 4E) and EDU (Figure 4F) assays were applied to measure cell viability following overexpressing MAP1S. Cells in the pCDNA3.1-MA group had lower cell viability than that in the Control group (P < 0.01), while there was no detectable change of cell viability in both pCDNA3.1 and Control groups, which supported the inhibition effects of MAP1S on A549/DDP cells. Then, the levels of autophagy-associated proteins p62, LC3II, and LC3I were monitored by Western blot. As shown in Figure 4G, p62 was lowly expressed and LC3II/LC3I protein ratio was enhanced in the pCDNA3.1-MA group in comparison with the Control group (P < 0.01), suggesting MAP1S could facilitate chemosensitivity of A549/DDP cells by enhancing autophagy. Immunofluorescence staining revealed that the levels of GFP-LC3 in the pCDNA3.1-MA group of A549/DDP cells were evidently enhanced compared with the Control group (Figure 4H, P < 0.01).
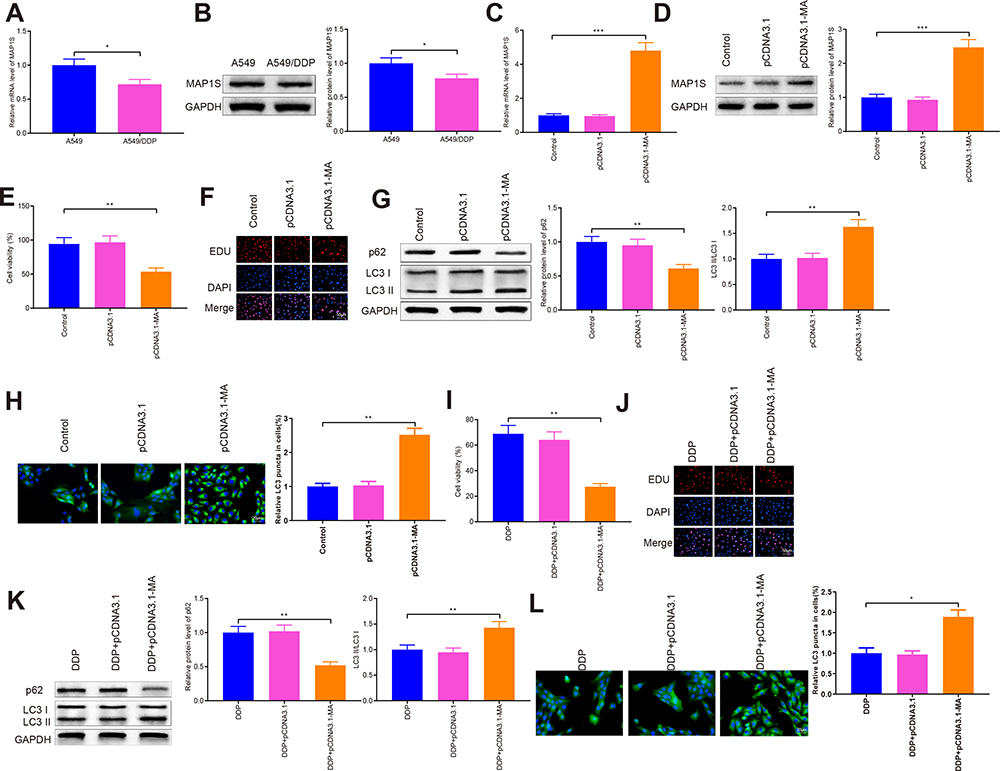 |
Figure 4 MAP1S can induce autophagy to improve chemosensitivity in A549/DDP cells. Abbreviations: DDP, cisplatin; MAP1S, microtubule-associated protein 1S; GFP, green fluorescent protein. Notes: mRNA and protein levels of MAP1S in A549 and A549/DDP cells were determined by qRT-PCR and Western blot (A and B). After A549/DDP cells were transfected with pCDNA3.1-MAP1S followed by DDP treatment, qRT-PCR and Western blot were applied to test the levels of MAP1S (C and D). Cell viability was determined by CCK-8 and EDU (E and F). Western blot was used to detect the protein level of p62, LC3II, and LC3I (G). The GFP-LC3 was probed with immunofluorescence staining (H). CCK-8 and EDU were conducted to detect cell viability (I and J). The levels of p62, LC3II, and LC3I were determined by Western blot (K). Immunofluorescence staining was operated to measure the GFP-LC3 (L). Data were presented as mean ± standard deviation, *P < 0.05, **P < 0.01, ***P < 0.001. |
Next, MAP1S was overexpressed in cells and then treated with DDP to detect cell viability. The finding revealed that pCDNA3.1-MA + DDP group had decreased cell viability (vs DDP group) (Figure 4I and J, P < 0.01). Western blot uncovered that p62 expression was distinctly lowed while LC3II/LC3I protein ratio was strikingly heightened in the pCDNA3.1-MA + DDP group compared with the DDP group (Figure 4K, P < 0.01). Immunofluorescence staining disclosed that as against the DDP group, the levels of GFP-LC3 were greatly increased in the pCDNA3.1-MA + DDP group of A549/DDP cells (Figure 4L, P < 0.05), indicating MAP1S could restore chemosensitivity of A549/DDP cells. The aforementioned data demonstrated that MAP1S enhanced chemosensitivity in A549/DDP cells by promoting autophagy.
RASSF1A Activates Autophagy by MAP1S to Restore Chemosensitivity
The correlation between RASSF1A and MAP1S expressions in clinical samples was analyzed. Correlation analysis displayed that RASSF1A was positively correlated with MAP1S in NSCLC (Figure 5A, P < 0.05). Moreover, CO-IP analysis showed RASSF1A could bind to MAP1S (P < 0.001), as depicted in Figure 5B. Then, A549/DDP cells were transfected with si-RASSF1A, and both qRT-PCR and Western blot presented that RASSF1A and MAP1S levels were reduced strikingly in the si-RA group (vs Control group) (Figure 5C–F, P < 0.01). After A549/DDP cells were co-transfected with si-RASSF1A and pCDNA3.1-MAP1S, CCK-8 and EDU manifested that pCDNA3.1-MA + si-RA group exhibited heightened cell viability than that in the pCDNA3.1-MA group (Figure 5G and H, P < 0.05). Thereafter, Western blot was applied to measure the level of autophagy-associated proteins. As shown in Figure 5I, pCDNA3.1-MA + si-RA group had a higher level of p62 and lower level of LC3II in addition to a decreased level of LC3II/LC3I protein ratio (vs pCDNA3.1-MA group) (P < 0.05). Immunofluorescence staining unraveled that the levels of GFP-LC3 were considerably repressed in the pCDNA3.1-MA + si-RA group of A549/DDP cells (vs pCDNA3.1-MA group) (Figure 5J, P < 0.05); indicating RASSF1A induced autophagy by regulating MAP1S expression.
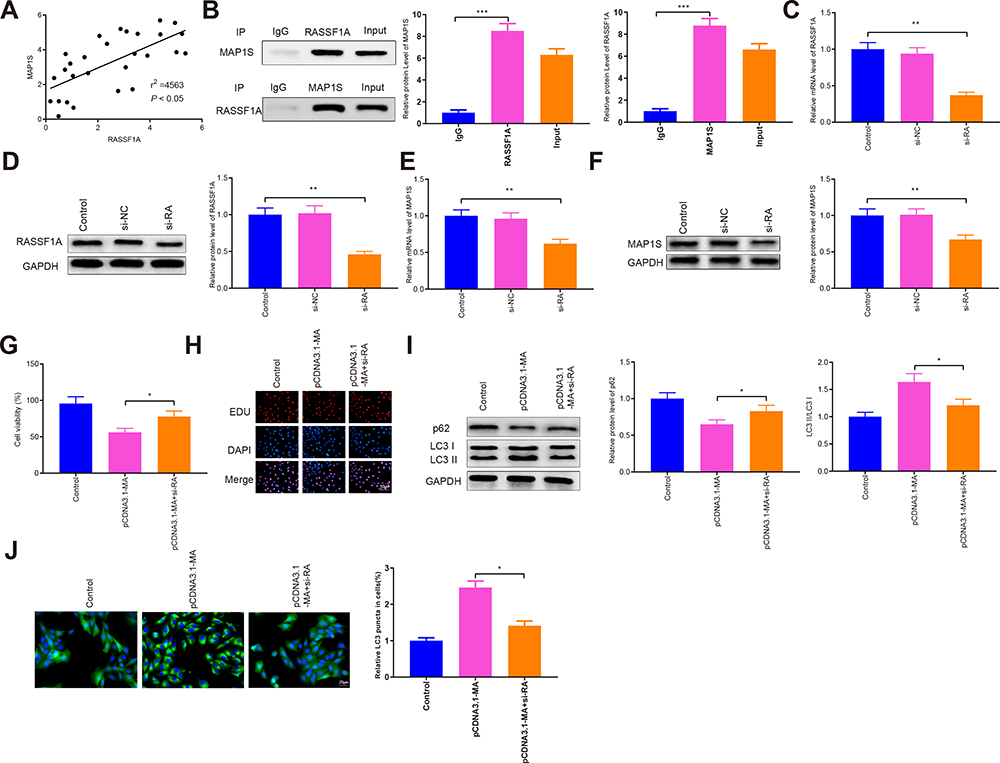 |
Figure 5 RASSF1A activates autophagy by MAP1S to restore chemosensitivity of A549/DDP cells. Abbreviations: NSCLC, non-small cell lung cancer; MAP1S, microtubule-associated protein 1S; GFP, green fluorescent protein. Notes: The association of RASSF1A and MAP1S expressions in NSCLC tissues was analyzed (A). CO-IP assay was used to detect the interaction between RASSF1A and MAP1S (B). The levels of RASSF1A were determined by qRT-PCR and Western blot (C and D). qRT-PCR and Western blot were employed to measure MAP1S expressions (E and F). CCK-8 and EDU were applied to analyze cell viability (G and H). Western blot was employed to measure the levels of p62, LC3II, and LC3I (I). The GFP-LC3 was monitored by immunofluorescence staining (J). Data were presented as mean ± standard deviation, *P < 0.05, **P < 0.01; ***P < 0.001. |
Next, cells were co-transfected with si-RASSF1A and pCDNA3.1-MAP1S, followed by DDP treatment to measure cell viability (Figure 6A and B, P < 0.05). The detection revealed that cell viability in the pCDNA3.1-MA + si-RA + DDP group was significantly heightened (vs pCDNA3.1-MA + DDP group). Then, Western blot disclosed an increased level of p62 and decreased LC3II/LC3I protein ratio in the pCDNA3.1-MA + si-RA + DDP group, as compared to that in the pCDNA3.1-MA + DDP group (Figure 6C, P < 0.05). Immunofluorescence staining presented that pCDNA3.1-MA + si-RA + DDP group had effectively attenuated levels of GFP-LC3 in A549/DDP cells (vs pCDNA3.1-MA + DDP group) (Figure 6D, P < 0.05). The aforementioned results implicated that RASSF1A interacted with MAP1S to activate autophagy, thus enhancing chemosensitivity of A549/DDP cells.
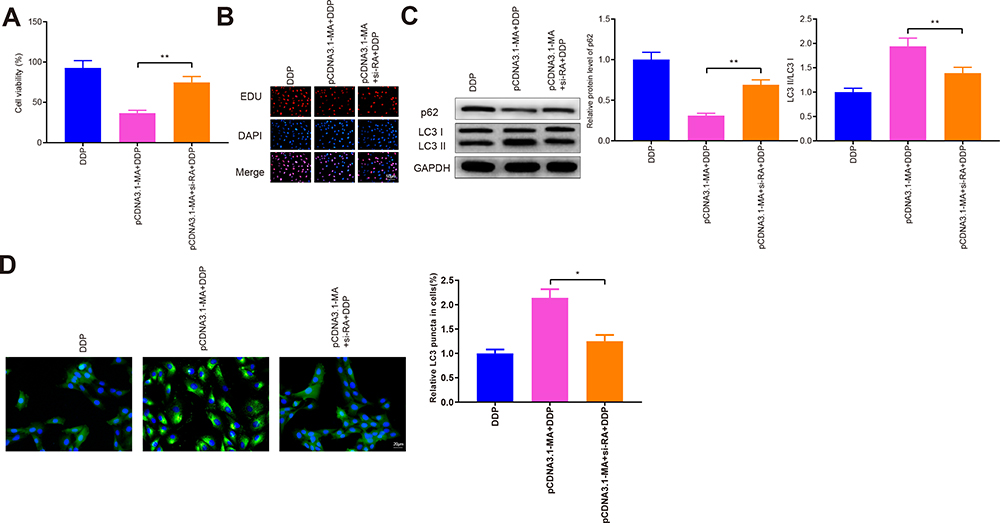 |
Figure 6 RASSF1A interacts with MAP1S to stimulate autophagy and restore chemosensitivity. Abbreviation: GFP, green fluorescent protein. Notes: Cell viability was determined by CCK-8 and EDU (A and B). Western blot was conducted to test the levels of p62, LC3II, and LC3I (C). The GFP-LC3 were evaluated by immunofluorescence staining (D); *P < 0.05, **P < 0.01. |
MAP1S Enhances Autophagy of A549/DDP Cells via the Keap1-Nrf2 Pathway
To further explore the mechanism of MAP1S in promoting autophagy, we detected the level of Nrf2 in the Keap1-Nrf2 pathway (Figure 7A). The protein level of Nrf2 in the pCDNA3.1-RA and pCDNA3.1-MA groups was markedly suppressed (vs Control group). Nrf2 protein in the pCDNA3.1-MA + si-RA group was significantly heightened compared with the pCDNA3.1-MA group (P < 0.05). Collective data indicated that RASSF1A inactivated the Keap1-Nrf2 pathway by regulating MAP1S expression.
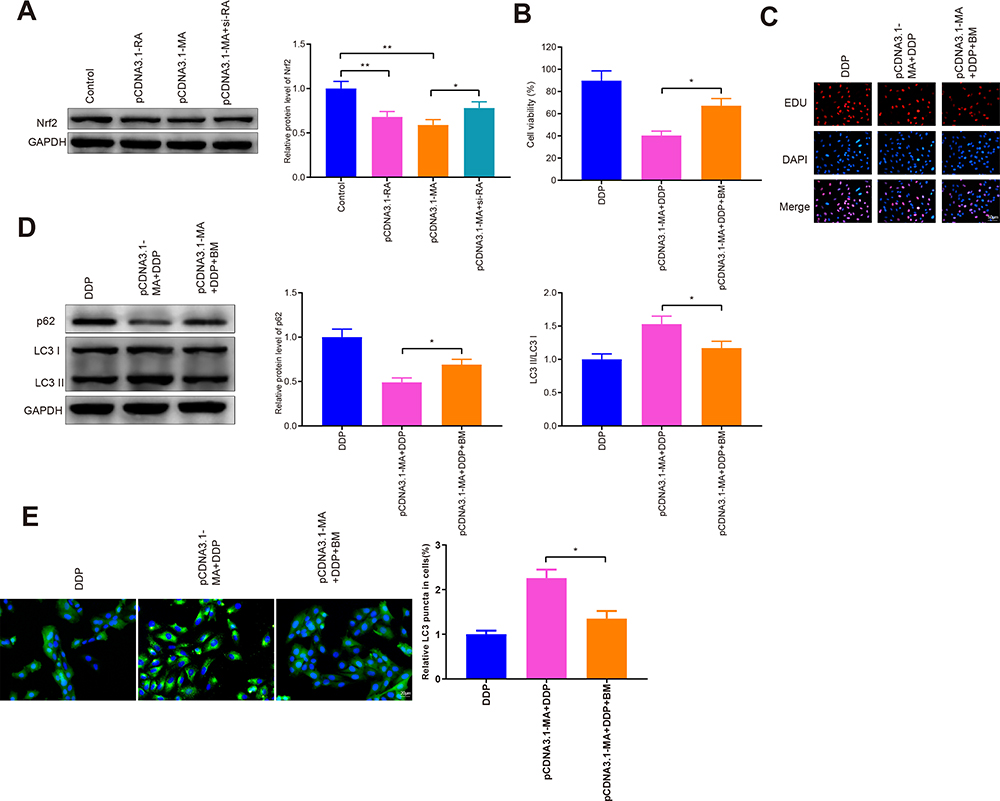 |
Figure 7 MAP1S restores chemosensitivity of A549/DDP cells by inhibiting Nrf2 pathway. Abbreviations: DDP, cisplatin; MAP1S, microtubule-associated protein 1S; GFP, green fluorescent protein. Notes: A549/DDP cells were transfected with pCDNA3.1-MAP1S and then co-treated with DDP and Nrf2 activator bardoxolone methyl. The protein level of Nrf2 was detected by Western blot (A). CCK-8 and EDU were employed to measure cell viability (B and C). The levels of p62, LC3-II, and LC3I were assessed by Western blot (D). The GFP-LC3 was assessed by immunofluorescence staining (E). Data were presented as mean ± standard deviation, *P < 0.05, **P < 0.01. |
Next, cells were co-treated with Nrf2 activator bardoxolone and DDP to measure cell viability by CCK-8 (Figure 7B) and EDU (Figure 7C). The detection revealed that the cell viability was significantly heightened in the pCDNA3.1-MA + DDP + BM group (vs pCDNA3.1-MA + DDP group) (P < 0.05).
Then, Western blot detected the levels of p62, LC3II, and LC3I and the results showed that cells in the pCDNA3.1-MA + DDP + BM group had significantly higher p62 expression and lower LC3II/LC3I protein ratio (vs pCDNA3.1-MA + DDP group) (Figure 7D, P < 0.05). Immunofluorescence staining noted that the levels of GFP-LC3 were observably refrained in the pCDNA3.1-MA + DDP + BM group of A549/DDP cells (vs pCDNA3.1-MA + DDP group) (Figure 7E, P < 0.05), indicating MAP1S potentiated chemosensitivity of A549/DDP cells by Nrf2 pathway.
RASSF1A Suppresses Tumor Growth in vivo and Increases Chemosensitivity
A xenograft model in nude mice using A549/DDP cells was developed. Specifically, A549/DDP cells with overexpression of RASSF1A were injected into nude mice. We applied qRT-PCR and Western blot (Figure 8A–D) to detect the levels of RASSF1A and MAP1S in tumor tissues. The result showed that levels of RASSF1A and MAP1S in tumor tissues of nude mice were elevated strikingly in the pCDNA3.1-RASSF1A group (vs Blank group) (P < 0.01), indicating satisfactory transfection efficiency of RASSF1A and MAP1S in tumors of nude mice.
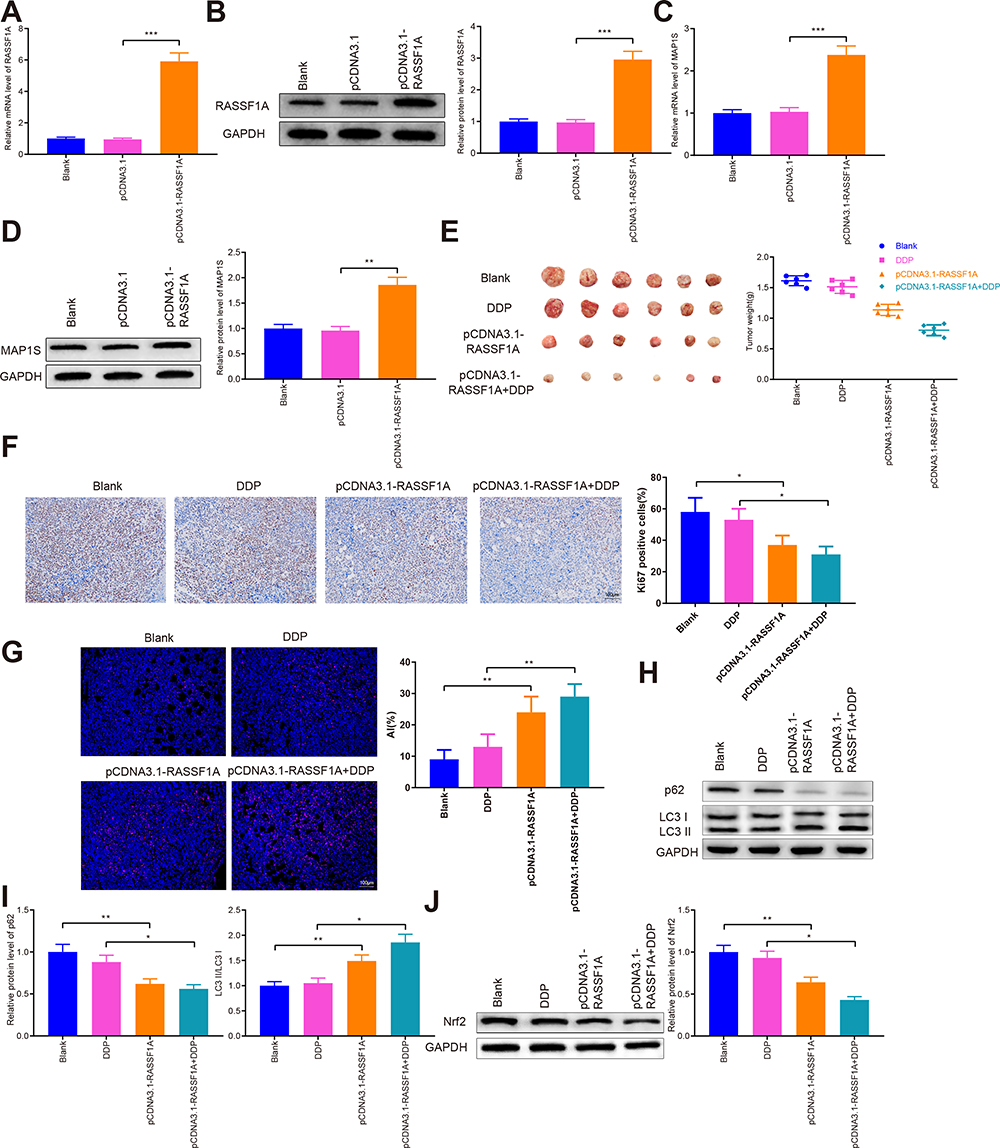 |
Figure 8 RASSF1A inhibits tumor growth and increases chemosensitivity in vivo. Abbreviations: DDP, cisplatin; MAP1S, microtubule-associated protein 1S. Notes: After nude mice were subcutaneously injected with A549/DDP cells that overexpressed RASSF1A before DDP injection, the levels of RASSF1A were surveyed by qRT-PCR and Western blot in tumor tissues (A and B). qRT-PCR and Western blot were separately detected the mRNA and protein expressions of MAP1S (C–D). Tumor tissues of nude mice were weighted (E). The tumor tissues in nude mice were analyzed by Ki-67 immunohistochemistry (F). TUNEL staining was used to detect apoptosis (G). p62, LC3II, and LC3I protein expression were measured by Western blot (H and I). The expression of Nrf2 in tumor tissues was verified by Western blot (J). Data were presented as mean ± standard deviation, *P < 0.05, **P < 0.01, ***P < 0.001. |
The measurement of tumor weight in nude mice indicated that the tumor weight of nude mice in the pCDNA3.1-RASSF1A group was much smaller than in the Blank group. After treatment with DDP, the weight of nude mice in the pCDNA3.1-RASSF1A + DDP group was decreased strikingly (vs DDP group) (Figure 8E, P < 0.05). Furthermore, Ki-67 immunohistochemistry showed that the number of Ki-67 positive cells in the pCDNA3.1-RASSF1A group was significantly lower than that of the Blank group (Figure 8F, P < 0.05). Interestingly, the number of Ki-67 positive cells was dramatically lowered in the pCDNA3.1-RASSF1A + DDP group (vs DDP group) (P < 0.05). TUNEL staining showed that the AI in the pCDNA3.1-RASSF1A group was significantly higher than that in the Blank group (P < 0.01). We also observed a concomitant elevation in AI following treatment with pCDNA3.1-RASSF1A and DDP, compared to that following DDP treatment alone (Figure 8G, P < 0.01). These results suggested that RASSF1A could block tumor growth, promote apoptosis, and enhance chemosensitivity in vivo.
Additionally, Figure 8H and I represents the levels of p62, LC3II, and LC3I in tumor tissues. The p62 expression was significantly repressed, whilst the ratio of LC3II/LC3I was increased effectively in the pCDNA3.1-RASSF1A group (vs Blank group) (P < 0.05). Consistent results were observed in the pCDNA3.1-RASSF1A + DDP group (vs DDP group) (P < 0.05). Western blot was employed to inspect Nrf2 expression in tumor tissues (Figure 8J). The detection manifested that Nrf2 expression was obviously inhibited in the pCDNA3.1-RASSF1A group (vs Blank group), while pCDNA3.1-RASSF1A + DDP group had obviously lower Nrf2 expression than that in the DDP group (P < 0.05). The aforementioned data indicated that RASSF1A suppressed tumor growth in vivo and potentiated chemosensitivity of A549/DDP cells.
Discussion
Autophagy can promote or suppress tumorigenesis, and NSCLC cells are characterized by increased autophagy and dependence on autophagy for growth. In the present study, we have identified that RASSF1A triggers autophagy in NSCLC cells, thus promoting the sensitivity of NSCLC cells in response to chemotherapeutic agents. Specifically, we have dissected the mechanism by which RASSF1A activates autophagy to improve the chemosensitivity of NSCLC cells via MAP1S to inhibit the Keap1-Nrf2 pathway. These findings present a potential role of RASSF1A in autophagy regulation and the chemoresistance of NSCLC cells.
Autophagy has been recognized as a potential mechanism for the chemoresistance of cancer cells.18–20 Thus, targeting autophagy-related regulators could be an underlying strategy for ameliorating therapeutic resistance in NSCLC. Recently, mounting evidences have corroborated that RASSF1A may be an inducer of autophagy.17,21 Besides, tumor suppressor RASSF1A is known to play a crucial role in chemosensitivity in various types of cancers,22–24 nevertheless no researches have concentrated on the association between RASSF1A and chemosensitivity in NSCLC. Herein, we detected the function of RASSF1A on chemosensitivity in NSCLC cells. Initially, we chose A549 cells and their DDP-resistant counterparts, A549/DDP cells, as an in vitro model to explore the mechanism of RASSF1A on DDP resistance of NSCLC. We found that RASSF1A expressions markedly decreased in A549/DDP cells compared with the parental cells, and also negatively associated with postoperative survival of NSCLC patients. Furthermore, CCK-8 and EDU presented that treatment with overexpressed RASSF1A and DDP possessed a distinctly lower cell survival rate than that treated with DDP alone. Additionally, detection of autophagy-associated proteins p62, LC3II, and LC3I revealed that RASSF1A could induce cell autophagy in A549/DDP cells. These findings indicate that RASSF1A expression may involve in the molecular mechanisms of DDP-based chemotherapy resistance in NSCLC, although the precise biologic function remains unclear.
MAP1S is an autophagy activator that promotes the biogenesis and degradation of autophagosomes.25 Also, MAP1S is a recently identified autophagy protein, and previous data indicate a mechanism of autophagy protein MAP1S on the inhibition of breast cancer cells.26,27 Previously, MAP1S could enhance autophagy to inhibit tumorigenesis.28 Besides, the suppression of MAP1S on the onset of hepatocellular carcinoma by promoting the autophagic event has also been determined.29,30 Consistently, the results of our serial experiments confirmed that MAP1S restores chemosensitivity in A549/DDP cells by enhancing autophagy.
Moreover, previous report disclosed that MAP1S is one of the major RASSF1A-interacting proteins.31 The RASSF1A-MAP1S interaction prompted us to suppose that RASSF1A impedes NSCLC via inducing autophagy by MAP1S. Indeed, the results of correlation analysis showed that RASSF1A was positively correlated with MAP1S in clinical NSCLC tissues and their interaction was confirmed by CO-IP analysis. Besides, CCK-8 and EDU manifested that cells co-treated with silenced RASSF1A and overexpressed MAP1S showed higher cell viability than treated with highly expressed RASSF1A alone. Both MAP1S and RASSF1A affect autophagosomal biogenesis and suppress genome instability and tumorigenesis.17,26,32 Further, detection on the level of autophagy-associated proteins further verified that RASSF1A induces autophagy by modulating MAP1S expression. Additionally, cells were co-transfected with RASSF1A silencing and MAP1S overexpression, followed by DDP treatment. The results showed that cell viability in the pCDNA3.1-MA + si-RA + DDP group was significantly heightened (vs pCDNA3.1-MA + DDP group). Additionally, Western blot revealed that pCDNA3.1-MA + si-RA + DDP group had an increased level of p62 while decreased LC3II/LC3I protein ratio as compared to the pCDNA3.1-MA + DDP group. Collectively, these results implicated that RASSF1A could regulate MAP1S to activate autophagy, thus enhancing chemosensitivity of NSCLC cells.
Next, the mechanism by which RASSF1A regulates MAP1S to trigger autophagy and enhance the chemosensitivity of NSCLC cells was then investigated. The Keap1-Nrf2 pathway is a cytoprotective and pro-survival pathway in mammalian cells, which may contribute to both intrinsic and acquired chemoresistance.33,34 Autophagy is intimately associated with the NRF2 pathway and MAP1S accelerates p62-dependent degradation of KEAP1 by the autophagy pathway.35 Here, we reported that Nrf2 protein was significantly inhibited and therefore we elucidated a potential mechanism underlying NSCLC chemoresistance by which RASSF1A increases autophagy by regulating MAP1S to inhibit the Keap1-Nrf2 pathway. Intriguingly, these findings were confirmed in vivo in a xenograft mouse model that RASSF1A increased the effect of chemosensitivity of NSCLC cells on decreasing tumor growth by enhancing autophagy.
In conclusion, a series of gain and loss of function experiments showed that RASSF1A promotes chemosensitivity in NSCLC by enhancing autophagy. Further analysis illustrated that RASSF1A positively targets MAP1S to enhance autophagy via the Keap1-Nrf2 pathway, thereby increasing the chemosensitivity of NSCLC cells in vitro and in vivo. These results elucidate a potential strategy of RASSF1A to increase the chemosensitivity of NSCLC cells.
Acknowledgment
Thanks for all the contributors and participants.
Funding
This research was funded by the grants from Heilongjiang Postdoctoral Foundation (Grant No. LBH-Z18158); Reseach Fund of Postdoctor in Heilongjiang Province (LBH-Q15094), Health and Family Planning Commission Research Foundation of Heilongjiang Province (Grant No. 2016-091) and Natural Science Foundation of Heilongjiang Province (Grant No. H2016005).
Disclosure
The authors declare that they have no competing interests.
References
1. Chen X, Wu Q, Chen Y, et al. Diosmetin induces apoptosis and enhances the chemotherapeutic efficacy of paclitaxel in non-small cell lung cancer cells via Nrf2 inhibition. Br J Pharmacol. 2019;176(12):2079–2094. doi:10.1111/bph.14652
2. Feng B, Zhang K, Wang R, Chen L. Non-small-cell lung cancer and miRNAs: novel biomarkers and promising tools for treatment. Clin Sci (Lond). 2015;128(10):619–634. doi:10.1042/CS20140530
3. Lazzari C, Karachaliou N, Bulotta A, et al. Combination of immunotherapy with chemotherapy and radiotherapy in lung cancer: is this the beginning of the end for cancer? Ther Adv Med Oncol. 2018;10:1758835918762094. doi:10.1177/1758835918762094
4. Dasari S, Tchounwou PB. Cisplatin in cancer therapy: molecular mechanisms of action. Eur J Pharmacol. 2014;740:364–378. doi:10.1016/j.ejphar.2014.07.025
5. Fennell DA, Summers Y, Cadranel J, et al. Cisplatin in the modern era: the backbone of first-line chemotherapy for non-small cell lung cancer. Cancer Treat Rev. 2016;44:42–50. doi:10.1016/j.ctrv.2016.01.003
6. Nakashima K, Murakami H, Omori S, et al. Doublet chemotherapy with cisplatin and pemetrexed is associated with a favorable outcome in patients with advanced non-squamous non-small-cell lung cancer who are eligible for bevacizumab and maintenance therapy. Mol Clin Oncol. 2016;5(5):575–578. doi:10.3892/mco.2016.1001
7. Zhang YQ, Jiang LJ, Jiang SX, et al. Gefitinib with or without transarterial infusion chemotherapy (Cisplatin) for large nonsmall cell lung cancer with epidermal growth factor receptor mutations. J Vasc Interv Radiol. 2019;30(7):1004–1012. doi:10.1016/j.jvir.2018.12.705
8. Chaudhary KR, Yan SX, Heilbroner SP, et al. Effects of beta-adrenergic antagonists on chemoradiation therapy for locally advanced non-small cell lung cancer. J Clin Med. 2019;8(5):575. doi:10.3390/jcm8050575
9. MacDonagh L, Gallagher MF, Ffrench B, et al. Targeting the cancer stem cell marker, aldehyde dehydrogenase 1, to circumvent cisplatin resistance in NSCLC. Oncotarget. 2017;8(42):72544–72563. doi:10.18632/oncotarget.19881
10. Makarova KS, Wolf YI, Alkhnbashi OS, et al. An updated evolutionary classification of CRISPR-Cas systems. Nat Rev Microbiol. 2015;13(11):722–736. doi:10.1038/nrmicro3569
11. Kim M, Jung JY, Choi S, et al. GFRA1 promotes cisplatin-induced chemoresistance in osteosarcoma by inducing autophagy. Autophagy. 2017;13(1):149–168. doi:10.1080/15548627.2016.1239676
12. Wang S, Xu X, Hu Y, Lei T, Liu T. Sotetsuflavone induces autophagy in non-small cell lung cancer through blocking PI3K/Akt/mTOR signaling pathway in vivo and in vitro. Front Pharmacol. 2019;10:1460. doi:10.3389/fphar.2019.01460
13. Dubois F, Bergot E, Zalcman G, Levallet G. RASSF1A, puppeteer of cellular homeostasis, fights tumorigenesis, and metastasis-an updated review. Cell Death Dis. 2019;10(12):928. doi:10.1038/s41419-019-2169-x
14. Chen T, Yang Z, Liu C, et al. Circ_0078767 suppresses non-small-cell lung cancer by protecting RASSF1A expression via sponging miR-330-3p. Cell Prolif. 2019;52(2):e12548. doi:10.1111/cpr.12548
15. Del Re DP. Hippo signaling in the heart- non-canonical pathways impact growth, survival and function. Circ J. 2016;80(7):1504–1510. doi:10.1253/circj.CJ-16-0426
16. Donninger H, Schmidt ML, Mezzanotte J, Barnoud T, Clark GJ. Ras signaling through RASSF proteins. Semin Cell Dev Biol. 2016;58:86–95. doi:10.1016/j.semcdb.2016.06.007
17. Li W, Yue F, Dai Y, et al. Suppressor of hepatocellular carcinoma RASSF1A activates autophagy initiation and maturation. Cell Death Differ. 2019;26(8):1379–1395. doi:10.1038/s41418-018-0211-7
18. He J, Yu JJ, Xu Q, et al. Downregulation of ATG14 by EGR1-MIR152 sensitizes ovarian cancer cells to cisplatin-induced apoptosis by inhibiting cyto-protective autophagy. Autophagy. 2015;11(2):373–384. doi:10.1080/15548627.2015.1009781
19. Huang Z, Zhou L, Chen Z, Nice EC, Huang C. Stress management by autophagy: implications for chemoresistance. Int J Cancer. 2016;139(1):23–32. doi:10.1002/ijc.29990
20. Shteingauz A, Boyango I, Naroditsky I, et al. Heparanase enhances tumor growth and chemoresistance by promoting autophagy. Cancer Res. 2015;75(18):3946–3957. doi:10.1158/0008-5472.CAN-15-0037
21. Li W. Autophagy Enhanced by RASSF1A Suppresses Diethylnitrosamine (DEN)-Induced Hepatocarcinogenesis. 2017.
22. Guan HG, Xue WJ, Qian HX, Zhou XJ, Qin L, Lan J. RASSF1A expression inhibits cell growth and enhances cell chemosensitivity to mitomycin in BEL-7402 hepatocellular carcinoma cells. Chin Med J (Engl). 2009;122(11):1328–1332.
23. Khandelwal M, Anand V, Appunni S, et al. Decitabine augments cytotoxicity of cisplatin and doxorubicin to bladder cancer cells by activating hippo pathway through RASSF1A. Mol Cell Biochem. 2018;446(1–2):105–114. doi:10.1007/s11010-018-3278-z
24. Li K, Yang J, Han X. Lidocaine sensitizes the cytotoxicity of cisplatin in breast cancer cells via up-regulation of RARbeta2 and RASSF1A demethylation. Int J Mol Sci. 2014;15(12):23519–23536. doi:10.3390/ijms151223519
25. Xu G, Yue F, Huang H, et al. Defects in MAP1S-mediated autophagy turnover of fibronectin cause renal fibrosis. Aging (Albany NY). 2016;8(5):977–985. doi:10.18632/aging.100957
26. Xie R, Wang F, McKeehan WL, Liu L. Autophagy enhanced by microtubule- and mitochondrion-associated MAP1S suppresses genome instability and hepatocarcinogenesis. Cancer Res. 2011;71(24):7537–7546. doi:10.1158/0008-5472.CAN-11-2170
27. Shi M, Yao Y, Han F, Li Y, Li Y, Guan X-Y. MAP1S controls breast cancer cell TLR5 signaling pathway and promotes TLR5 signaling-based tumor suppression. PLoS One. 2014;9(1):e86839. doi:10.1371/journal.pone.0086839
28. Liu L, McKeehan WL, Wang F, Xie R. MAP1S enhances autophagy to suppress tumorigenesis. Autophagy. 2012;8(2):278–280.
29. Liu J, Zheng L, Ma L, et al. Oleanolic acid inhibits proliferation and invasiveness of Kras-transformed cells via autophagy. J Nutr Biochem. 2014;25(11):1154–1160. doi:10.1016/j.jnutbio.2014.06.006
30. Yue F, Li W, Zou J, et al. Spermidine prolongs lifespan and prevents liver fibrosis and hepatocellular carcinoma by activating MAP1S-mediated autophagy. Cancer Res. 2017;77(11):2938–2951. doi:10.1158/0008-5472.CAN-16-3462
31. Dallol A, Cooper WN, Al-Mulla F, Agathanggelou A, Maher ER, Latif F. Depletion of the Ras association domain family 1, isoform A-associated novel microtubule-associated protein, C19ORF5/MAP1S, causes mitotic abnormalities. Cancer Res. 2007;67(2):492–500. doi:10.1158/0008-5472.CAN-06-3604
32. Xie R, Nguyen S, McKeehan K, Wang F, McKeehan WL, Liu L. Microtubule-associated protein 1S (MAP1S) bridges autophagic components with microtubules and mitochondria to affect autophagosomal biogenesis and degradation. J Biol Chem. 2011;286(12):10367–10377. doi:10.1074/jbc.M110.206532
33. Jaramillo MC, Zhang DD. The emerging role of the Nrf2-Keap1 signaling pathway in cancer. Genes Dev. 2013;27(20):2179–2191. doi:10.1101/gad.225680.113
34. Kensler TW, Wakabayashi N, Biswal S. Cell survival responses to environmental stresses via the Keap1-Nrf2-ARE pathway. Annu Rev Pharmacol Toxicol. 2007;47:89–116. doi:10.1146/annurev.pharmtox.46.120604.141046
35. Liu P, de la Vega MR, Dodson M, et al. Spermidine confers liver protection by enhancing NRF2 signaling through a MAP1S-mediated noncanonical mechanism. Hepatology. 2019;70(1):372–388.
 © 2021 The Author(s). This work is published and licensed by Dove Medical Press Limited. The full terms of this license are available at https://www.dovepress.com/terms.php and incorporate the Creative Commons Attribution - Non Commercial (unported, v3.0) License.
By accessing the work you hereby accept the Terms. Non-commercial uses of the work are permitted without any further permission from Dove Medical Press Limited, provided the work is properly attributed. For permission for commercial use of this work, please see paragraphs 4.2 and 5 of our Terms.
© 2021 The Author(s). This work is published and licensed by Dove Medical Press Limited. The full terms of this license are available at https://www.dovepress.com/terms.php and incorporate the Creative Commons Attribution - Non Commercial (unported, v3.0) License.
By accessing the work you hereby accept the Terms. Non-commercial uses of the work are permitted without any further permission from Dove Medical Press Limited, provided the work is properly attributed. For permission for commercial use of this work, please see paragraphs 4.2 and 5 of our Terms.