")
Back to Journals » International Journal of Nanomedicine » Volume 16
Rapid Detection Method for Pathogenic Candida Captured by Magnetic Nanoparticles and Identified Using SERS via AgNPs+
Authors Hu S, Kang H, Gu F, Wang C , Cheng S, Gong W, Wang L, Gu B, Yang Y
Received 5 October 2020
Accepted for publication 19 January 2021
Published 11 February 2021 Volume 2021:16 Pages 941—950
DOI https://doi.org/10.2147/IJN.S285339
Checked for plagiarism Yes
Review by Single anonymous peer review
Peer reviewer comments 2
Editor who approved publication: Dr Mian Wang
Shan Hu,1– 3,* Haiquan Kang,4,* Feng Gu,2,* Chongwen Wang,1,5 Siyun Cheng,3 Wenjing Gong,1 Liping Wang,1 Bing Gu,3,4 Ying Yang1
1Department of Biotechnology, Beijing Institute of Radiation Medicine, Beijing Key Laboratory of New Molecular Diagnosis Technologies for Infectious Diseases, Beijing, 100850, People’s Republic of China; 2Department of Laboratory Medicine, Xuzhou Tumor Hospital, Xuzhou, 221005, People’s Republic of China; 3Xuzhou Key Laboratory of Laboratory Diagnostics, Medical Technology School of Xuzhou Medical University, Xuzhou, 221004, People’s Republic of China; 4Department of Laboratory Medicine, The Affiliated Hospital of Xuzhou Medical University, Xuzhou, 221006, People’s Republic of China; 5College of Life Sciences, Anhui Agricultural University, Hefei, 230036, People’s Republic of China
*These authors contributed equally to this work
Correspondence: Ying Yang; Bing Gu Email [email protected]; [email protected]
Purpose: Candidemia infection is common in the clinic and has a high mortality rate. Candida albicans, Candida tropicalis, and Candida krusei are very important and common pathogenic species. Candida is difficult to isolate from clinical samples and culture, and immunological detection cannot distinguish these related strains. Furthermore, Candida has a complex cell wall, which causes difficulties in the extraction of DNA for nucleic acid detection. The purpose of this study was to establish a protocol for the direct identification of Candida from serum.
Materials and Methods: We synthesized Fe3O4@PEI (where PEI stands for polyethylenimine) magnetic nanoparticles to capture Candida and prepared positively charged silver nanoparticles (AgNPs+) as the substrate for surface-enhanced Raman scattering (SERS). Candida was directly identified from serum by SERS detection.
Results: Orthogonal partial least squares discriminant analysis (OPLS-DA) was used as the multivariate analysis tool. Principal component analysis confirmed that this method can clearly distinguish common Candida. After 10-fold cross-validation, the accuracy of training data in this model was 100% and the accuracy of test data was 99.8%, indicating that the model has good classification ability.
Conclusion: The detection could be completed within 40 minutes using Fe3O4@PEI and AgNPs+ prepared in advance. This is the first time that Fe3O4@PEI was used in the detection of Candida by SERS. We report the first rapid method to identify fungi directly from serum without breaking the cell wall to extract DNA from the fungi.
Keywords: capture, surface-enhanced Raman scattering, positively charged silver nanoparticles, orthogonal partial least squares discriminant analysis, 10-fold cross-validation
Introduction
Broad-spectrum antibiotics and immune inhibitors are widely used, especially in cancer patients after radiotherapy and chemotherapy. The rate of Candida infection has recently increased; it now has the highest mortality of the invasive fungal infections.1 Candidemia is the most common type of invasive Candida infection. It mainly refers to a bloodstream infection caused by Candida. Candida albicans, Candida tropicalis, and Candida krusei have high incidence rates in the clinic.2 The incidence rate of C. albicans is the highest among Candida species; however, a 5-year study by Barchiesi et al in Italy showed that the mortality rate of non-C. albicans and that of C. albicans are similar. It even tends to exceed the mortality of C. albicans.3 Candidemia has a high fatality rate, with an all-cause in-hospital mortality rate of up to 30%. As such, it has a worse therapeutic response than bacteremia.4
Early diagnosis of invasive fungi disease and timely drug treatment are critical to reducing candidemia mortality. However, candidemia has no specific clinical manifestations, and it is difficult to make an early diagnosis based on clinical symptoms; thus, candidemia must be confirmed by clinical laboratory results.4 Candida has been cultured in vitro for a long time and is difficult to grow.
Biochemical and matrix-assisted laser desorption ionization time-of-flight mass spectrometry (MALDI-TOF MS) methods for the identification of Candida in the clinic are still based on culture methods.5,6 There are some rapid detection methods without culturing in the clinic such as 1-3-β-D glucan (G test), mannose lgG, polymerase chain reaction (PCR), and metagenomics next-generation sequencing (mNGS). The G test and mannose lgG cannot determine the Candida species.7 For PCR and mNGS, it is required to break the cell wall to extract DNA; however, the fungal cell wall is complex and difficult to break.8,9 Thus, it is difficult to extract DNA that can be identified under non-culture conditions.10 Therefore, a rapid detection method based on impure culture without breaking the cell wall is urgently needed.
It has been reported that it is possible to detect pathogens using the fingerprints of whole organisms via surface-enhanced Raman scattering (SERS).11 In recent years, SERS has been applied to the detection of bacteria, but there are still few reports on the detection of fungi. SERS has a strong specificity, requires no contact with samples, has low temperature and pressure requirements, involves fast spectral imaging, and has a high resolution. This is especially true for samples that can be tested in a non-destructive manner. Moreover, the SERS spectrometer is stable with low maintenance costs, and the operation is simple.12,13
In this study, we tested the zeta potential of Candida and found that the surfaces of C. albicans, C. tropicalis, and C. krusei were all negatively charged. Thus, we selected AgNPs+ as the SERS-enhanced substrate.14,15 We identified and distinguished three common Candida species through the following steps: We detected the SERS spectrum of three common Candida species with AgNPs+ as standard spectrum.14,16 Then magnetic microspheres (Fe3O4) were modified by polyethylenimine (PEI) to form Fe3O4@PEI. Fe3O4@PEI was mixed with the candidemia samples to form the Fe3O4@PEI@Candida mixture. We have used Fe3O4@PEI for the first time in the detection of Candida by SERS. The supernatant of the mixture was discarded and mixed with SERS-enhanced materials, and the sample was evaluated on silicon wafers.17 When the mixture dried, the SERS spectrum of the mixture was measured and compared with the standard spectrum. The resulting spectrum was consistent with the standard spectrum. Finally, orthogonal partial least squares discriminant analysis (OPLS-DA) was used to analyze the spectral data of three Candida species.18
Materials and Methods
Chemicals
Ferric oxide hexahydrate (FeCl3·6H2O), ethylene glycol (CH2OH)2), and sodium acetate (NaOAc) were purchased from the Beijing Sinopharm group. PEI, cetyl trimethyl ammonium bromide (CTAB), and sodium borohydride (NaBH4) were purchased from Sigma-Aldrich (Shanghai Trading Co., Ltd.), the 99% purity silver nitrate (AgNO3) came from Beijing Modern Oriental Co., and ammonium hydroxide (NH4OH) was supplied by the Xilong Chemical Group Co. Monocrystalline silicon sheets were purchased from Zhejiang Lijing Group Co., Ltd. The culture medium for Candida was provided by Shanghai Comaga Biotechnology Co., Ltd., and pure water was purchased from Hangzhou Wahaha Co., Ltd. The above reagent materials were all produced in China and are standardized commercial reagents that can be directly used in experiments without further purification. Clinical samples of Candida used in this experiment were provided by the Affiliated Hospital of Xuzhou Medical University.
Instrumentation
An Ht-7700 transmission electron microscope (TEM) was purchased from Hitachi (Japan) and a Shimadzu 2600 UV-visible spectrophotometer was purchased from Shimadzu. The Raman spectrometer was an i-Raman Pro Raman spectrometer (B&W Tek, USA). The zncl-bs230 *230 heating electromagnetic stirrer was purchased from Beijing Century Huake Co., Ltd. (China). The constant temperature fungal incubator was from Beijing Fuyi Electric Co., Ltd. (China).
Strain Collection and Identification
Candida was collected from samples with positive culture results. After 24 hours of constant temperature culture, the strains were identified by MALDI-TOF MS (Bruker Daltonics, Bremen, Germany). Fifteen samples of patient serum and cultured strains of each of the three Candida species required in this study were collected and stored at −80°C for later use. The serum was collected from participants in the experiment.
Preparation of Fe3O4@PEI Magnetic Nanoparticles
First, 5.4 g FeCl3·6H2O was added to 160 mL (CH2OH)2 and stirred for 30 min. Next, 4 g PEG6000 and 10.8 g NaAc was added to the solution and completely dissolved. The solution was then poured into a high-pressure reactor and heated for 16 h at a temperature of 210°C. When the reaction finished, the product was washed with ethanol and pure water. We then used a magnet to adsorb the supernatant. The residual product was dried at 60°C for 6 hours in a vacuum to obtain magnetic Fe3O4 (300–500 nm). We next dispersed 500 mg of magnetic Fe3O4 in PEI solution (0.5 g/100 mL) in an ultrasonic environment, and the PEI gradually bound to the magnetic Fe3O4. This process requires one hour to form Fe3O4@PEI.19,20 Finally, the Fe3O4@PEI was washed with ultra-pure water five times to remove excess PEI.
Preparation of SERS Substrates
We prepared positive AgNPs+ as an enhanced substrate with CTAB as the stabilizer.18 We then prepared two solutions. Solution 1 was 10.96 mg AgNO3 with a purity of 99%; 3.65 mg of CTAB and 0.5 mL of NH4OH were added at a concentration of 25% to 19.5 mL ultra-pure water. Solution 2 was prepared by adding 3.65 mg CTAB and 6.05 mg NaBH4 to 20 mL ultra-pure water. Solution 1 and solution 2 were placed in an ice bath for 10 min. After 10 min, solution 1 was poured into a conical flask. The conical flask was then heated on an electromagnetic stirrer and ice bath with intense stirring. During the stirring process, we used a sterile syringe to add solution 2 dropwise into solution 1. The solution gradually turned from colorless to dark yellow, indicating the formation of a colloidal dispersion system. This process lasted for four hours.
Silver can easily combine with oxygen and H2S in the air, and the bottle mouth should be covered during stirring. After 4 hours, stirring was stopped, and the sample was heated for 10 minutes to remove the residual NH3 and NaBH4 in the solution. We began stirring again at the end of the heating. When the sample cooled to room temperature, we removed it from the heated electromagnetic stirrer, added ultra-pure water, and diluted it to 40 mL. The sample was sealed and stored at 4°C.
Establishment of Standard Raman Spectrum
Candida were grown on Sabouraud Agar medium at 25°C for 72 h; three strains of each Candida species were selected to collect standard Raman spectra. We prepared a Candida solution at 10 CFU mL–1 and mixed 10 μL of Candida solution with 10 μL of the nanoparticles. Two microliters of the mixture was dropped onto a monocrystalline silicon wafer and left until the mixture dried. The Raman spectrometer (i-Raman Pro) analyzed the sample at 785 nm with a maximum laser power of 275 mW. The light spot diameter was 105 μm, the integration time was 30 s, and the excitation power was 10% of the maximum power. Five sites were averaged from each species of Candida to collect one Raman spectrum.
Fe3O4@PEI Capture Candida Test
The Fe3O4@PEI@Candida complex was formed after adding the volume of Fe3O4@PEI with the highest capture efficiency to serum containing Candida in a 1 mL Eppendorf tube. The complex was concentrated in the bottom of the tube with a magnet. The supernatant was discarded, and the AgNPs+ were resuspended and rotated for 15 minutes.21 We then concentrated the particles with a magnet in a small volume. The Raman spectrum of the precipitate was detected similarly as above and compared to the standard spectrum. If the spectrum could be matched, then the spectrum of the detected precipitate was Candida.
Statistical Analysis
SIMCA 14.1 (Umetrics, Umea, Sweden) software is the most commonly used software for the analysis of spectral data. We used this software for OPLS-DA analysis. OPLS-DA is a supervised discriminant analysis statistical method and was used to establish the relationship model between metabolite expression and Candida species to predict the different species of Candida. The parameters R2X and R2Y in the model represent the interpretation rate of the established model to the X and Y matrices, respectively. Q2 indicates the prediction ability of the model. As the values of R2 and Q2 approach 1, the model theoretically becomes better with worse fitting accuracy. In general, R2 and Q2 values higher than 0.5 are good, higher than 0.4 is acceptable, and the difference between the two should not be too large. A 10-fold cross-validation can be used to evaluate the OPLS-DA model’s accuracy for the classification of samples. For example, the data set is divided into 10 parts, of which 9 parts are the training data and 1 part is the test data. Each test gets a correct rate (or error rate). Generally, a 10-fold cross-validation is required, and the accuracy of the algorithm is then estimated via the average accuracy (or error rate).22
Results
A Technical Route for Rapid Identification of Candida
Figure 1A shows the production process of Fe3O4@PEI. We improved the method of Liu et al.19,21 and synthesized Fe3O4 microspheres sized 300–500 nm. In an ultrasonic bath, PEI is mixed with Fe3O4. The cationic PEI will be adsorbed on the surface of Fe3O4, resulting in Fe3O4@PEI.
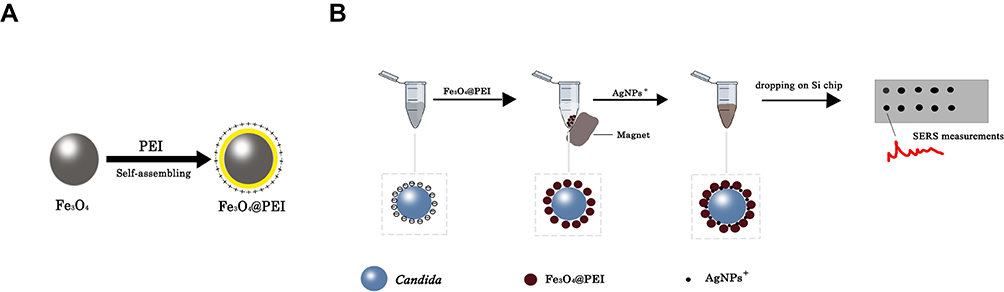 |
Figure 1 A technical route for the rapid identification of Candida. (A) PEI is adsorbed on the surface of Fe3O4 to form Fe3O4@PEI. (B) Candida is adsorbed on the surface of Fe3O4@PEI to form Fe3O4@PEI@Candida. Fe3O4@PEI enriched Candida from the solution after placing magnets outside the Eppendorf tube. The AgNPs+ are then adsorbed on the surface of the complex to form Fe3O4@PEI@Candida@AgNPs+. Candida species were identified via a SERS fingerprint spectrum. |
Figure 1B shows the rapid identification of Candida by Fe3O4@PEI. First, Fe3O4@PEI is adsorbed on the surface of Candida to form Fe3O4@PEI@Candida after placing magnets outside the Eppendorf tube to adsorb the contents of the Eppendorf tube. The Fe3O4@PEI can enrich Candida from the solution in seconds. The AgNP+ substrate is also adsorbed on the surface of the complex to form Fe3O4@PEI@Candida@AgNPs+. We identified Candida species via a SERS fingerprint spectrum.
Characterization of Nanomaterials
Figure 2A shows a TEM image of spherical AgNPs+. Figure 2B shows that the zeta potential of the AgNPs+ is positive. Figure 2C shows that the particle size of the AgNPs+ is more than 100 nm. The UV absorption spectrum of the AgNPs+ is shown in Figure 2D, and the ultraviolet absorption peak is 404 nm.
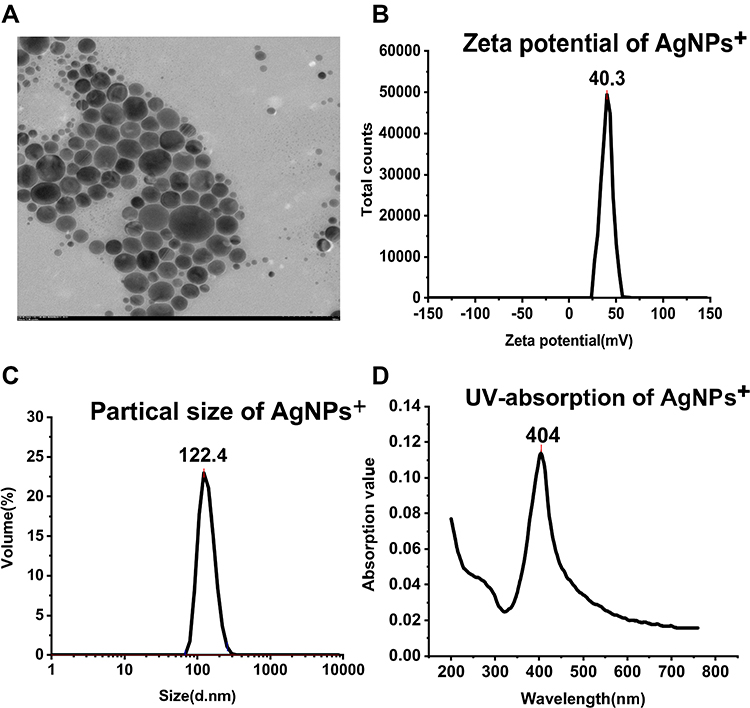 |
Figure 2 Characterization of AgNPs+. (A) TEM image of spherical AgNPs+. (B) The zeta potential of AgNPs+ is +40.3 mV. (C) The particle size of AgNPs+ is 122.4 nm. (D) The ultraviolet absorption peak of AgNPs+ is found at 404 nm. |
Figure 3A is a TEM image of Fe3O4@PEI, which shows PEI attached to the surface of the Fe3O4 forming a film. Monodisperse Fe3O4@PEI is uniform in size, spherical in shape, and 300–500 nm in diameter. Figure 3B shows Fe3O4 particles with a zeta potential of −47.8 mV. The Fe3O4@PEI has a zeta potential of +38.1 mV. C. albicans, C. tropicalis, and C. krusei have zeta potentials of −12.2 mV, −19.9 mV, and −13.7 mV, respectively. Figure 3C shows that Fe3O4@PEI and AgNPs+ are adsorbed on the surface of the Candida to form Fe3O4@PEI@Candida@AgNPs+.17,18
 |
Figure 3 Characterization of Fe3O4@PEI. (A) TEM image of a Fe3O4@PEI that is uniform, spherical, and 300–500 nm in diameter. (B) The zeta potential of Fe3O4 is −47.8 mV, and the zeta potential of Fe3O4@PEI is +38.1 mV. The zeta potentials of C. albicans, C. tropicalis, and C. krusei are −12.2 mV, −19.9 mV, and −13.7 mV, respectively. (C) Fe3O4@PEI and Candida adsorb AgNPs+ on the surface. |
Capture Efficiency of Fe3O4@PEI for Candida
We investigated the ability of Fe3O4@PEI to capture three Candida species from 1 mL of serum. The Candida titer in the serum samples was 1 × 10⁶ cells mL–1. After treatment, the residual Candida in the supernatant was counted to calculate the capture rate.20 The volume of Fe3O4@PEI (1, 2, 3, 4, and 5 μL) was used as a variable to study the optimal capture efficiency. According to Figure 4, when the volume of Fe3O4@PEI ≥ 4 μL, the capture efficiency of Fe3O4@PEI in the serum samples of different Candida concentrations reached equilibrium. The capture efficiencies of C. albicans, C. tropicalis, and C. krusei were 95.9%, 98.0%, and 79.6%, respectively.
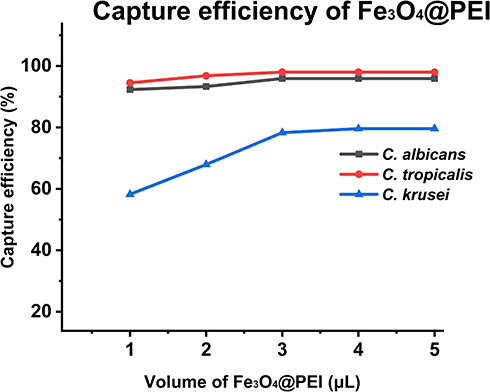 |
Figure 4 The capture efficiency of C. albicans, C. tropicalis, and C. krusei (incubation time was 15 min). |
SERS Spectrum
The SERS spectrum is the Candida species’ average spectrum; the x-coordinate is the Raman shift, and the y-coordinate is the Raman intensity. Figure 5 compares the average SERS spectrum of a standard spectrum and the capture spectrum. The black line is the average standard SERS spectrum of the three species of Candida, and the red line is the average captured SERS spectrum of the three species of Candida. The captured spectrum is consistent with the standard spectrum.
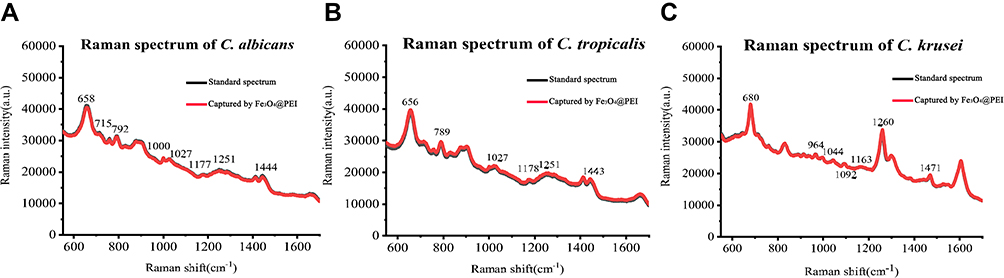 |
Figure 5 Average standard and captured SERS spectrum of C. albicans, C. tropicalis, and C. krusei. (A) Average standard and captured SERS spectrum of C. albicans. The Raman shifts at 658, 715, 792, 1000, 1027, 1177, 1251, and 1444 cm−1 were significantly enhanced. (B) Average standard and captured SERS spectrum of C. tropicalis. The Raman shifts at 656, 789, 1027, 1178, 1251, and 1443 cm−1 were significantly enhanced. (C) Average standard and captured SERS spectrum of C. krusei. The Raman shifts at 680, 964, 1044, 1092, 1163, 1260, and 1471 cm−1 were significantly enhanced. |
Major spectral bands observed in C. albicans, C. tropicalis, and C. krusei are shown in Table 1. For C. albicans, the Raman shifts at 658, 715, 792, 1000, 1027, 1177, 1251, and 1444 cm−1 were significantly enhanced. The Raman data for C. albicans and C. tropicalis were similar, but they have different Raman shifts. The Raman shifts of C. tropicalis are at 656, 789, 1027, 1178, 1251, and 1443 cm−1. The Raman data for C. krusei are different from those of C. albicans and C. tropicalis. The Raman shifts of C. krusei are at 680, 964, 1044, 1092, 1163, 1260, and 1471 cm−1. Furthermore, the peaks of C. albicans, C. tropicalis, and C. krusei are all located at 640–675, 1022–1060, 1150–1186, 1215–1295, and 1440–1475 cm−1.23
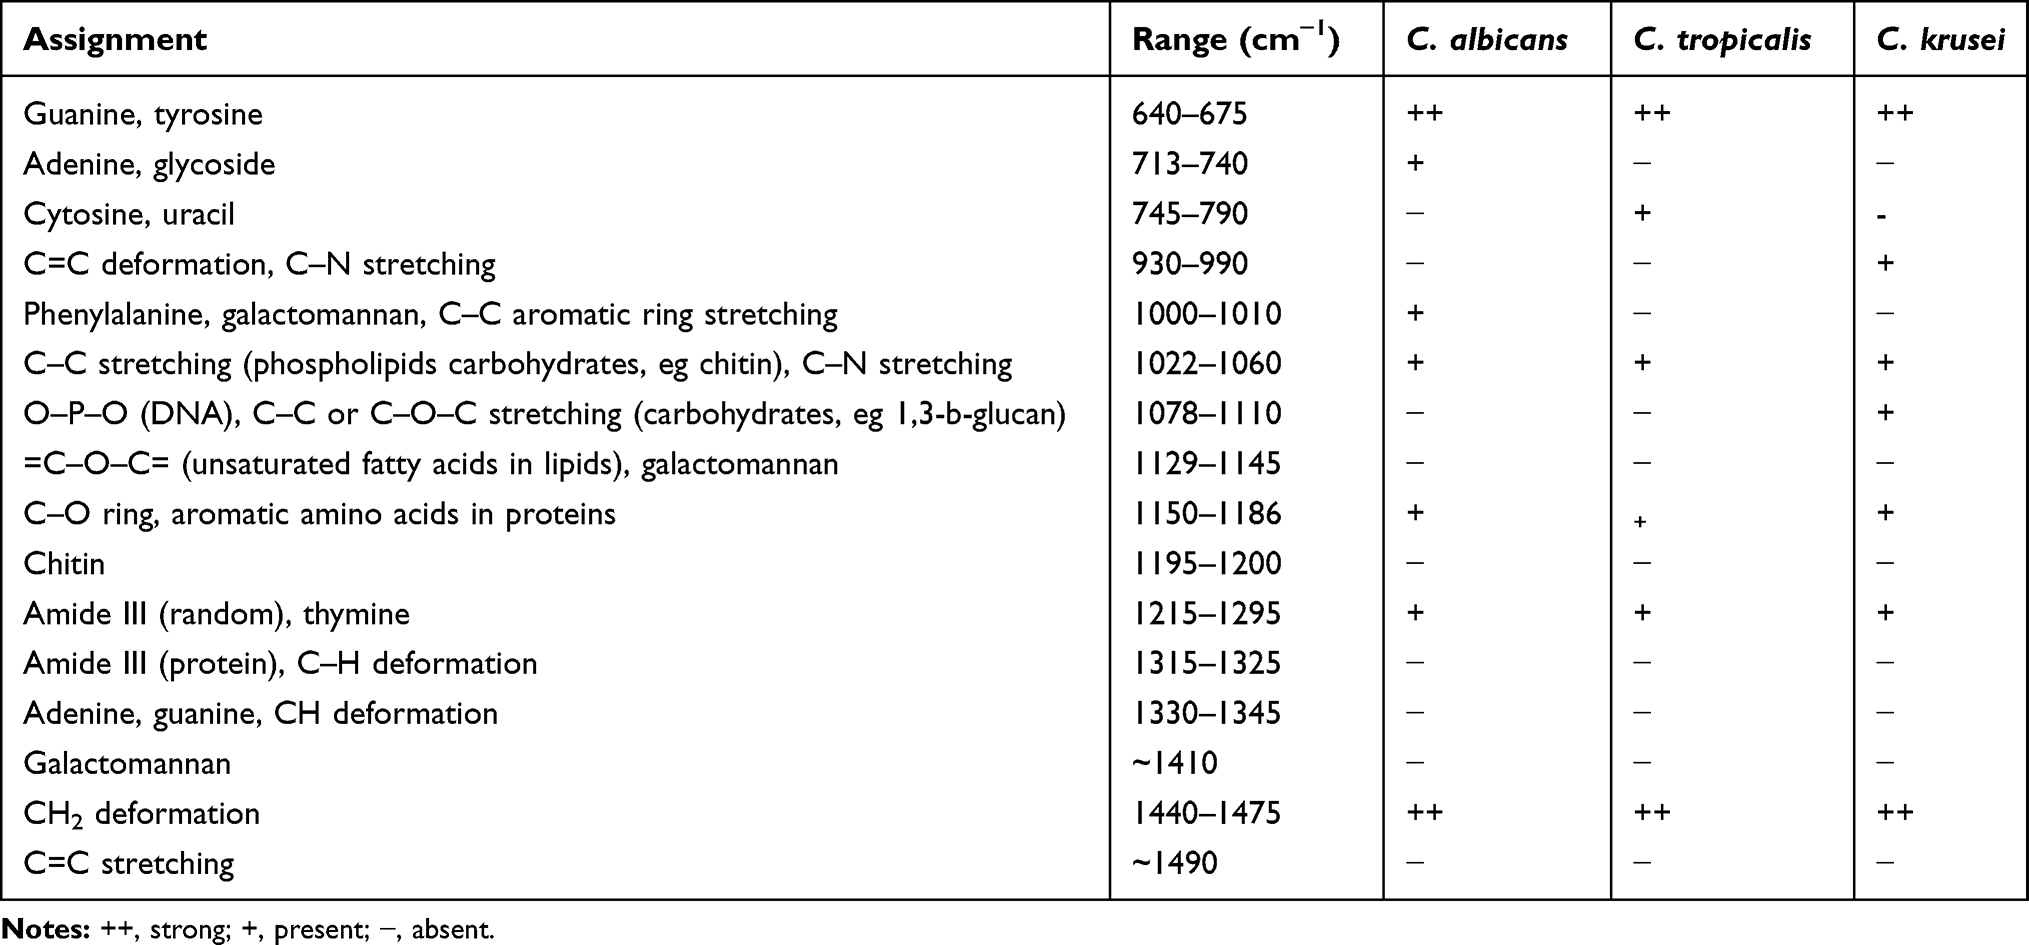 |
Table 1 Major Spectrum Bands Observed in C. albicans, C. tropicalis, and C. krusei |
Multivariate Statistical Analysis
OPLS-DA was used to compare the SERS spectrum of Candida captured from serum by Fe3O4@PEI containing C. albicans, C. tropical, and C. krusei (15 serum samples each). One point represents one sample (Figure 6). At the 95% confidence interval, the sample analysis results in an ellipse. The three Candida species can be nicely separated. R2X (cum) = 0.997, R2Y (cum) = 0.93, Q2 (cum) = 0.924, so R2X, R2Y, and Q2 are all above 0.7, indicating that the model is well established and has good predictive ability. We also conducted a 10-fold cross-validation to evaluate the accuracy of the model classification. The average accuracy of the training data and the data set were 100% and 99.8%, respectively, indicating that the classification ability of the model is good. Table 2 shows specific information on the 10-fold cross-validation of the OPLS-DA model.
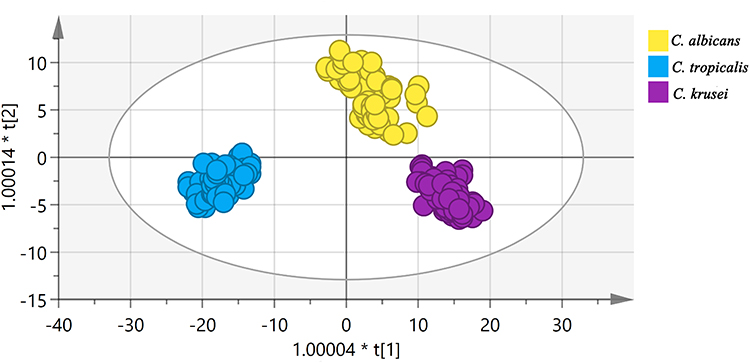 |
Figure 6 OPLS-DA of C. albicans, C. tropicalis, and C. krusei via SERS where one point represents one sample. The data points are nicely separated. |
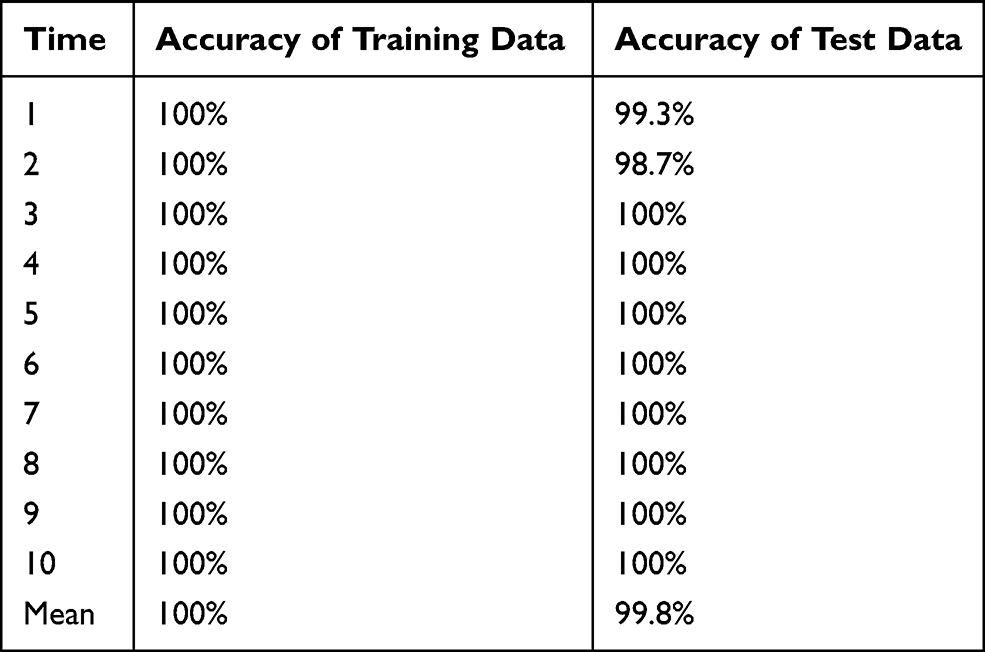 |
Table 2 Results of the 10-Fold Cross-Validation of C. albicans, C. tropicalis, and C. krusei Based on Orthogonal Partial Least Squares Discriminant Analysis |
Discussion
This study first established a method that can identify and distinguish Candida in impure cultures in a non-destructive and rapid manner. This method combined the SERS spectrum and OPLS-DA multivariate statistical analysis. The detection could be completed within 40 minutes using Fe3O4@PEI and AgNPs+ prepared in advance.
Blood culture is currently the golden standard for the diagnosis of candidemia, but it has a long reporting time that can delay treatment.6 The G test is common for early diagnosis of candidemia, but it cannot determine the species and has a high false positive rate.7 Mannose IgG is easily cleared in the blood and requires continuous monitoring; thus, the clinical applications of this project require further research.7 Some new techniques have also been applied to the clinical detection of fungi. MALDI-TOF MS is extremely accurate in identifying yeast, but it must be done with pure samples; the mass spectrometry cost is very high.5 PCR can quickly detect a variety of clinical specimens with fungal infection at a high specificity. However, PCR requires extraction of DNA, and Candida has cell walls that are difficult to lyse.8 mNGS also requires DNA extraction. In addition, the cost of detection is relatively high and needs further improvement for clinical applications.9 SERS can detect fungi non-destructively, which is a major advantage over PCR and mNGS.24,25
The material capture on Fe3O4@PEI in serum samples containing Candida was analyzed by SERS. After enrichment, the Fe3O4@PEI@Candida was combined with AgNPs+ for SERS detection and compared with a standard spectrum. The three Candida species were identified and distinguished by combining the resulting Candida spectrum with the stoichiometry of OPLS-DA. The process did not require the destruction of Candida cell walls and was fast. Fe3O4@PEI nanoparticles could capture Candida in a broad spectrum because its surface has a positive charge, and the Candida surface carries a negative charge. The negative charge on the PEI led to electrostatic attraction and Candida interactions, thus obtaining good capture efficiency (95.9% for C. albicans, 98.0% for C. tropicalis, and 79.6% for C. krusei). Moreover, the surface of AgNPs+ carries a positive charge, and it does not combine with Fe3O4@PEI, but only with Candida. Therefore, AgNPs+ are a good choice as the SERS-enhanced substrate in this study.
OPLS-DA can easily distinguish the differences between groups and improve the validity and analytical capability of the model. The OPLS-DA score graph of the model established in this study showed a clear separation trend (Figure 6). R2X (cum) = 0.997, R2Y (cum) = 0.93, and Q2 (cum) = 0.924, indicating that the model was built with good quality parameters.26,27 We also estimated the classification efficiency of the model by performing a 10-fold cross-validation. The accuracy of the training data and test data of this model was 100% and 99.8%, respectively; the model has good classification ability.28
Our study shows SERS can be used for rapid and non-destructive detection of Candida under non-culture conditions. The equipment cost is relatively low. Candida is difficult to culture and has a cell wall unlike other pathogens, which makes it difficult to detect fungi quickly and non-destructively.29,30 This highlights the advantages of SERS in detecting pathogenic fungi. Superior to others’ former selection of materials,17,21 we selected and prepared materials of Fe3O4@PEI (300–500 nm) and AgNPs+ based on the characteristics of large diameter and negative charge of fungi. Compared with the latest method of detecting fungi SERS, our method does not require pure cultures18 and does not require lysis of the fungal cell wall.31 After trapping pathogenic fungi with magnetic beads, they were directly detected instead of cultured, which greatly improved the detection speed of pathogenic fungi and provided a beginning for solving the problem of long detection time of pathogenic fungi in the clinic. OPLS-DA data indicated that SERS could clearly distinguish these common Candida, and the method is suitable of further exploration and clinical application.
Conclusion
We report a new method for the direct detection of Candida under impure culture conditions. Fe3O4@PEI can capture Candida, and AgNPs+ can be used as a substrate to enhance the SERS spectrum intensity. The detection could be completed within 1 hour, and it has been reported that the detection speed of fungi is the fastest among the non-culture detection methods that do not require wall lysis, thus indicating that the diagnostic tool based on SERS might be a powerful technique for the early diagnosis of candidemia.
Ethical Statement
This study has been approved by the ethics review committee of the Affiliated Hospital of Xuzhou Medical University, China. Comply with the World Medical Association Declaration of Helsinki, the relevant Chinese laws and regulations, and other ethical principles to protect the rights and interests of the subjects, as well as the regulations of the ethics committee of Jiangsu (accession number: XXYFY2019-KL141-01). The informed consent of the patient was exempted.
Acknowledgments
This research was supported by the Ministry of Science and Technology of the People’s Republic of China (2018ZX10101003 and 2018ZX10712001), the National Natural Science Foundation of China (81871734 and 81471994), and the Jiangsu Provincial Medical Talent (ZDRCA2016053).
Author Contributions
Y.Y. and B.G. conceived and designed the study. S.H. and F.G. did the experiments. H.K. provided clinical samples. C.W., S.C., W.G., and L.W. did the analysis of surface-enhanced Raman scattering spectrum data. S.H., H.K., and F.G. drafted the manuscript. All authors played a significant role in data collection and analysis. All authors made substantial contributions to conception and design, acquisition of data, or analysis and interpretation of data; took part in drafting the article or revising it critically for important intellectual content; agreed to submit to the current journal; gave final approval of the version to be published; and agree to be accountable for all aspects of the work.
Disclosure
The authors report no conflicts of interest in this work.
References
1. von Lilienfeld-toa M, Wagener J, Eisnele H, Cornely OA, Kurzai O. Invasive pilzinfektionen. Dtsch Arztebl Int. 2019;116(16):271–278. doi:10.3238/arztebl.2019.0271
2. Bassetti M, Vena A, Meroi M, et al. Factors associated with the development of septic shock in patients with candidemia: a post hoc analysis from two prospective cohorts. Crit Care. 2020;24(1):1–9. doi:10.1186/s13054-020-2793-y
3. Barchiesi F, Orsetti E, Gesuita R, Skrami E, Manso E, Group CS. Epidemiology, clinical characteristics, and outcome of candidemia in a tertiary referral center in Italy from 2010 to 2014. Infection. 2016;44(2):205–213. doi:10.1007/s15010-015-0845-z
4. Toda M, Williams SR, Berkow EL, et al. Population-based active surveillance for culture-confirmed candidemia—four sites, United States, 2012–2016. MMWR Surveill Summ. 2019;68(8):1. doi:10.15585/mmwr.ss6808a1
5. Cassagne C, Normand AC, L’Ollivier C, Ranque S, Piarroux R. Performance of MALDI‐TOF MS platforms for fungal identification. Mycoses. 2016;59(11):678–690. doi:10.1111/myc.12506
6. Maldonado I, Cataldi S, Garbasz C, et al. Identification of Candida yeasts: conventional methods and MALDI-TOF MS. Rev Iberoam Micol. 2018;35(3):151–154. doi:10.1016/j.riam.2018.02.002
7. Chibabhai V, Fadana V, Bosman N, Nana T. Comparative sensitivity of 1, 3 beta‐D‐glucan for common causes of candidaemia in South Africa. Mycoses. 2019;62(11):1023–1028. doi:10.1111/myc.12982
8. Enoch DA, Yang H, Aliyu SH, Micallef C. The changing epidemiology of invasive fungal infections. In: Human Fungal Pathogen Identification. Springer; 2017:17–65.
9. Simner PJ, Miller S, Carroll KC. Understanding the promises and hurdles of metagenomic next-generation sequencing as a diagnostic tool for infectious diseases. Clin Infect Dis. 2018;66(5):778–788. doi:10.1093/cid/cix881
10. Kidd SE, Chen SC-A, Meyer W, Halliday CL. A new age in molecular diagnostics for invasive fungal disease: are we ready? Front Microbiol. 2020;10:2903. doi:10.3389/fmicb.2019.02903
11. Magee J. Whole-organism fingerprinting. Handbook New Bacterial Syst. 1993:383–427.
12. Weiss R, Palatinszky M, Wagner M, et al. Surface-enhanced Raman spectroscopy of microorganisms: limitations and applicability on the single-cell level. Analyst. 2019;144(3):943–953. doi:10.1039/C8AN02177E
13. Camerlingo C, Di Meo G, Lepore M, et al. Graphene-based and surface-enhanced Raman spectroscopy for monitoring the physio-chemical response of thermophilic bacterial spores to low temperatures exposure. Sensors. 2020;20(15):4150. doi:10.3390/s20154150
14. Chen X, Tang M, Liu Y, et al. Surface-enhanced Raman scattering method for the identification of methicillin-resistant Staphylococcus aureus using positively charged silver nanoparticles. Microchim Acta. 2019;186(2):102. doi:10.1007/s00604-018-3150-6
15. Shanmuganathan R, Karuppusamy I, Saravanan M, et al. Synthesis of Silver nanoparticles and their biomedical applications-a comprehensive review. Curr Pharm Des. 2019;25(24):2650–2660. doi:10.2174/1381612825666190708185506
16. Pugazhendhi A, Edison TNJI, Karuppusamy I, Kathirvel B. Inorganic nanoparticles: a potential cancer therapy for human welfare. Int J Pharm. 2018;539(1–2):104–111. doi:10.1016/j.ijpharm.2018.01.034
17. Wang C, Gu B, Liu Q, Pang Y, Xiao R, Wang S. Combined use of vancomycin-modified Ag-coated magnetic nanoparticles and secondary enhanced nanoparticles for rapid surface-enhanced Raman scattering detection of bacteria. Int J Nanomedicine. 2018;13:1159. doi:10.2147/IJN.S150336
18. Hu S, Gu F, Chen M, et al. A novel method for identifying and distinguishing Cryptococcus neoformans and Cryptococcus gattii by surface-enhanced Raman scattering using positively charged silver nanoparticles. Sci Rep. 2020;10(1):1–9. doi:10.1038/s41598-019-56847-4
19. Liu J, Che R, Chen H, et al. Microwave absorption enhancement of multifunctional composite microspheres with spinel Fe3O4 cores and anatase TiO2 shells. Small. 2012;8(8):1214–1221. doi:10.1002/smll.201102245
20. Dai X, Yao J, Zhong Y, et al. Preparation and characterization of Fe3O4@ MTX magnetic nanoparticles for thermochemotherapy of primary central nervous system lymphoma in vitro and in vivo. Int J Nanomedicine. 2019;14:9647. doi:10.2147/IJN.S205456
21. Li J, Wang C, Shi L, et al. Rapid identification and antibiotic susceptibility test of pathogens in blood based on magnetic separation and surface-enhanced Raman scattering. Microchim Acta. 2019;186(7):475. doi:10.1007/s00604-019-3571-x
22. Ma Q, Chen X, Zhang K, et al. Chemical fingerprint analysis for discovering markers and identifying saussurea involucrata by HPLC coupled with OPLS-DA. J Anal Methods Chem. 2020;2020:2020. doi:10.1155/2020/7560710
23. Witkowska E, Jagielski T, Kamińska A, Kowalska A, Hryncewicz-Gwóźdź A, Waluk J. Detection and identification of human fungal pathogens using surface-enhanced Raman spectroscopy and principal component analysis. Anal Methods. 2016;8(48):8427–8434. doi:10.1039/C6AY02957D
24. Wu J, Zhang L, Huang F, Ji X, Dai H, Wu W. Surface enhanced Raman scattering substrate for the detection of explosives: construction strategy and dimensional effect. J Hazard Mater. 2020;387:121714. doi:10.1016/j.jhazmat.2019.121714
25. Jalal M, Ansari MA, Alzohairy MA, et al. Anticandidal activity of biosynthesized silver nanoparticles: effect on growth, cell morphology, and key virulence attributes of Candida species. Int J Nanomedicine. 2019;14:4667. doi:10.2147/IJN.S210449
26. Li X, Yin M, Gu J, Hou Y, Tian F, Sun F. Metabolomic profiling of plasma samples from women with recurrent spontaneous abortion. Med Sci Monit. 2018;24:4038. doi:10.12659/MSM.907653
27. Nikas JB, Mitanis NT, Nikas EG. Whole exome and transcriptome RNA-sequencing model for the diagnosis of prostate cancer. ACS Omega. 2019;5(1):481–486. doi:10.1021/acsomega.9b02995
28. Crimi A, Bakas S, Kuijf H, Menze B, Reyes M. Brainlesion: Glioma, Multiple Sclerosis, Stroke and Traumatic Brain Injuries: Third International Workshop, BrainLes 2017, Held in Conjunction with MICCAI 2017, Quebec City, QC, Canada, September 14, 2017, Revised Selected Papers. Springer; 2018.
29. Duvenage L, Walker L, Bojarczuk A, et al. Inhibition of classical and alternative modes of respiration in candida albicans leads to cell wall remodeling and increased macrophage recognition. mBio. 2019;10(1):e02535–02518. doi:10.1128/mBio.02535-18
30. Chaffin WL. Candida albicans cell wall proteins. Microbiol Mol Biol Rev. 2008;72(3):495–544. doi:10.1128/MMBR.00032-07
31. Macdonald D, Smith E, Faulds K, Graham D. DNA detection by SERS: hybridisation parameters and the potential for asymmetric PCR. Analyst. 2020;145(5):1871–1877. doi:10.1039/C9AN01732A
 © 2021 The Author(s). This work is published and licensed by Dove Medical Press Limited. The full terms of this license are available at https://www.dovepress.com/terms.php and incorporate the Creative Commons Attribution - Non Commercial (unported, v3.0) License.
By accessing the work you hereby accept the Terms. Non-commercial uses of the work are permitted without any further permission from Dove Medical Press Limited, provided the work is properly attributed. For permission for commercial use of this work, please see paragraphs 4.2 and 5 of our Terms.
© 2021 The Author(s). This work is published and licensed by Dove Medical Press Limited. The full terms of this license are available at https://www.dovepress.com/terms.php and incorporate the Creative Commons Attribution - Non Commercial (unported, v3.0) License.
By accessing the work you hereby accept the Terms. Non-commercial uses of the work are permitted without any further permission from Dove Medical Press Limited, provided the work is properly attributed. For permission for commercial use of this work, please see paragraphs 4.2 and 5 of our Terms.