")
Back to Journals » Cancer Management and Research » Volume 13
Rapamycin Inhibits Glioma Cells Growth and Promotes Autophagy by miR-26a-5p/DAPK1 Axis
Authors Wang Z, Wang X, Cheng F, Wen X, Feng S, Yu F, Tang H, Liu Z , Teng X
Received 23 December 2020
Accepted for publication 25 February 2021
Published 22 March 2021 Volume 2021:13 Pages 2691—2700
DOI https://doi.org/10.2147/CMAR.S298468
Checked for plagiarism Yes
Review by Single anonymous peer review
Peer reviewer comments 3
Editor who approved publication: Dr Eileen O'Reilly
Zheng Wang,1,* Xiaoxi Wang,2,* Fei Cheng,2 Xue Wen,2 Shi Feng,2 Fang Yu,2 Hui Tang,2 Zhengjin Liu,3 Xiaodong Teng2
1Department of Neurology, Hangzhou Seventh People’s Hospital, Hangzhou, People’s Republic of China; 2Department of Pathology, The First Affiliated Hospital, College of Medicine, Zhejiang University, Hangzhou, People’s Republic of China; 3Department of Pathology, Zhongshan Hospital, Xiamen University, Xiamen, People’s Republic of China
*These authors contributed equally to this work
Correspondence: Zhengjin Liu
Department of Pathology, Zhongshan Hospital, Xiamen University, 201 Hubin South Road, Xiamen, Fujian, 361004, People’s Republic of China
Email [email protected]
Xiaodong Teng
Department of Pathology, The First Affiliated Hospital, College of Medicine, Zhejiang University, No. 79 Qingchun Road, Hangzhou, 310000, People’s Republic of China
Email [email protected]
Background: Glioma is a common intracranial malignant tumor with high rates of invasiveness and mortality. This study aimed to investigate the mechanism of rapamycin in glioma.
Methods: U118-MG cells were treated with and without rapamycin in vivo and then collected for RNA sequencing. Differentially expressed miRNAs (DEMs) were screened and verified. MiR-26a-5p was selected for functional verification, and the target gene of miR-26a-5p was identified. The effects of miR-26a-5p on cell proliferation, cell cycle, apoptosis, and autophagy were also investigated.
Results: In total, 58 up-regulated and 41 down-regulated DEMs were identified between rapamycin-treated and untreated U118-MG cells. MiR-26-5p levels were up-regulated in U118-MG cells treated with 12.5 μM rapamycin, and death-associated protein kinase 1 (DAPK1) expression, a direct miR-26a-5p target gene, was down-regulated. Rapamycin substantially inhibited cell proliferation and cell percentage in the S phase and promoted cell apoptosis; miR-26a-5p inhibitor increased cell proliferation and cell cycle and decreased cell apoptosis; DAPK1 overexpression further induced cell proliferation, increased the cell number in the S phase, and inhibited apoptosis in glioma cells. Notably, rapamycin increased the autophagy-related Beclin1 protein expression levels and the LC3 II/I ratio.
Conclusion: Rapamycin exerts anti-tumor effects by promoting autophagy in glioma cells, which was dependent on the miR-26a-5p/DAPK1 pathway activation by rapamycin.
Keywords: rapamycin, autophagy, RNA sequencing, glioma cells, miR-26a-5p, death-associated protein kinase 1
Introduction
As a common intracranial malignant tumor, glioma, caused by the carcinogenesis of glial cells originating in the neuroectoderm, has a high mortality.1 Early diagnosis and effective treatment are effective approaches to prevent further glioma deterioration.2 Recent studies have reported intensive progress in glioma treatment, including immunotherapy, sophisticated surgical resection and advanced chemoradiation.2,3 However, due to complex pathogenesis and higher recurrence, unsatisfactory prognosis and poor survival still exist.2 Therefore, it is essential to identify novel diagnostic and prognostic biomarkers and therapeutic targets, and to further elucidate the underlying molecular mechanisms of glioma.
The DAPK family contains five kinases, namely DAPK1, DAPK 2, ZIPK, DRAK1, and DRAK2, among which DAPK1 is a Ca2/CaM-dependent Ser/Thr protein kinase.4 In 1995, Deiss et al discovered the DAPK1 gene through functional gene cloning technology when Hela cell death was induced with interferon-γ.5 This gene, located at chromosome 9q34.1, with a protein molecular weight of 160 kD, participates in many pathologic and physiologic processes including cell necrosis, apoptosis, and autophagy and is related to the biological activity of tumors.6–8
It is well-known that the continuous updating of high-throughput sequencing and computer algorithms has revealed a large number of non-coding RNAs involved in various biological functions, including cell differentiation, apoptosis, migration, invasion, and proliferation in human diseases.9 MicroRNAs (miRNAs) are endogenous non-coding small-molecule RNAs that widely exist in several conditions.10 A growing number of studies have focused on and explored the functions of miRNAs in cancers.11 Previous studies have reported the abnormal expression of miRNAs in glioma and identified several miRNAs, including miRNA-204-5p,12 miRNA-637,13 miRNA-155,14 and miRNA-485-5p as diagnostic and prognostic biomarkers.15
Rapamycin, also known as sirolimus, is a common inhibitor of mammalian target of rapamycin (mTOR).16 Hyperactivation of mTOR kinase usually occurs in various cancers and plays a critical role in cell growth, proliferation, autophagy and metabolism.17 Previous studies have demonstrated the tumor-inhibiting effect of rapamycin on glioma/glioblastoma.18–22 Rapamycin induces glioma stem/progenitor cell differentiation by activating autophagy.23 Yang et al showed suppressed growth and proliferation of human U87MG glioma cells by rapamycin combined with nimuatine, with cells arrested in the G1 phase.24 Moreover, rapamycin has been shown to promote autophagy and Beclin1 gene expression, increase the LC3 II/I ratio, and decrease P62 gene expression.25
This study determined the effects of rapamycin on the proliferation, cell cycle, apoptosis, and autophagy of glioma cells, and whether the inhibitory effect of rapamycin on glioma cell growth may be related to the miR-26a-5p/DAPK1 pathway, which provides evidence for future studies of the mechanisms of action of rapamycin.
Materials and Methods
Cell Culture
Four glioma cell lines (U87, U118-MG, U251 and A172) were obtained from Shanghai Obio Technology Co., Ltd., and then maintained in complete DMEM medium (Hyclone) at 37 °C and 5% CO2.
CCK8 Assay
U87, U118-MG, U251, and A172 cells (5 × 10³/each well) were grown in 96-well plates, respectively, and then exposed to rapamycin (Sigma) at different concentrations (0, 12.5, 50, 100, 150, 200, and 250 μM) for 12, 24, 48, and 72 h followed by the addition of 100 μL of CCK8 (Biosharp) for 1 h. Microplate spectrophotometer was used to evaluate cell viability based on the absorbance at 450 nm.
Western Blotting
U118-MG cells were exposed to 10 and 100 μM rapamycin for 0, 0.5, 1, 2, 4, 6, 12, 24, 48, and 72 h.
Cells were then lysed by RIPA lysis buffer (Gibco), and proteins extracted using commercial kit (Pierce, Rockford, IL, USA). After being resolved visa SDS PAGE, protein samples were transferred to a PVDF membrane, which was blocked and reacted with DAPK1, LC3, Beclin1, or β-actin primary antibody (1:800, Abcam) overnight at 4 °C. After incubation with secondary antibody (1:5000, Abcam), protein levels were detected via enhanced chemiluminescence (Millipore, USA).
RNA Extraction and Sequencing
U118-MG cells were treated with 12.5 μM of rapamycin for 48 h. Cells were then collected, and total RNA isolated using RNAiso Plus (Takara, Shiga, Japan). RNA detection was carried out using a spectrophotometer (NanoDrop Technologies, Wilmington, Delaware, USA), and RNA with 2.0 < A260/A280 < 2.2 was used for subsequent RNA sequencing. Subsequently, TruSeq® Small RNA Library Prep Kit for Illumina® (New England Biolabs Inc., Beverly, MA, USA) was used to construct the RNA-seq library, with the Illumina Hiseq 2500 platform (Illumina, San Diego, CA, USA) used for sequencing.
Data Analysis
Data preprocessing was performed use the Oligo package (version 1.36.1, http://bioconductor.org/packages/release/bioc/html/oligo.html) of R software, which mainly consisted of background correction, normalization and expression calculation. The classical Bayes method provided by the Limma package was employed to screen DEMs between control cells and cells treated with rapamycin. The p-value was estimated with the adjusted p-value (adj.p.value) was then determined based on the Benjamini & Hochberg method. Notably, the DEMs in this study were defined according to the cutoffs of p < 0.05 and |log fold change (FC)| > 0.5. Meanwhile, a Venn diagram was generated based on the obtained DEMs.
qRT-PCR Analysis
Total RNA was obtained using Trizol (Invitrogen) following the manufacturer’s instructions. ReverAid First Strand cDNA Synthesis Kit (Invitrogen) was used to obtain cDNA by RNA reverse transcription. qRT-PCR was carried out using SYBR Green qPCR Master Mix (Roche). PCR primers were: miR-143 sense primer 5ʹ-GGG GTG AGA TGA AGC ACT GTA GCT C-3ʹ and antisense primer 5ʹ-GGG GTA AGG CAC GCG GTG AAT GCC AA-3ʹ; miR-26a-5p sense primer 5ʹ-GGG GTT CAA GTA ATC CAG GA-3ʹ and antisense primer 5ʹ-TGC GTG TCG TGG AGT C-3ʹ; and U6 sense primer 5ʹ-CTC ACT TCG GCA GCA CAT A-3ʹ and antisense primer 5ʹ-AAC TCT TCA CGA TTT TGT CTG TC-3ʹ; U6 served as the internal control. Finally, miRNA expression data was evaluated by the 2−ΔΔCt method.
Luciferase Reporter Assay
Dual-luciferase activity assays were used to identify the targeted relationship between miR-26a-5p and DAPK1. The DAPK1 3ʹ-UTR-wild-type (WT) or mutant (MUT) were cloned into a pGL3 vector, and named DAPK1-WT, and DAPK1-MUT, respectively. MiR-26a-5p mimic or mimic control was co-transfected with DAPK1-WT or DAPK1-MUT into 293T cells, respectively, for 48 h using Lipofectamine 2000. Luciferase activity measurements were carried out using the Dual-Glo Luciferase Assay System (Promega).
Cell Transient Transfection and Treatment
MiR-26a-5p inhibitor, inhibitor NC, DAPK1 overexpression vector (pc-DAPK1), and pcDNA3.1 were provided by Jirui Technology CO., Ltd. (Shanghai, China). To evaluate the effect of miR-26a-5p on rapamycin-treated U118-MG cells, U118-MG cells were grown in 6-well plates for 24 h, and then transiently transfected with the above vectors using Lipofectamine 3000 (Thermo). Following 24 h of transfection, cells were treated with 12.5 μM rapamycin for 48 h.
Ethynyldeoxyuridine (EdU) Assay
The EdU kit (Invitrogen) was used for cell proliferation detection. Specifically, transfected U118-MG cells were incubated with 12.5 μM rapamycin and 10 μM EdU for 48 h, followed by cell collection and rinsing with PBS. Following treatment with 4% paraformaldehyde to fix cells for 15 min away from light, cells were incubated with working solution for 30 min. A flow cytometer (BD, CA, USA) was used to calculate the percentage of EdU-positive cells.
Flow Cytometry Assay
Cell cycle and apoptosis were evaluated by flow cytometry. Cells from various treatments were digested with trypsin and harvested. For cell cycle assays, cells were incubated on ice in 70% ethanol for 2 h and then stained with propidium iodide (PI) for 30 min at 37 °C in the dark. Apoptosis was detected according to instructions of the FITC-Annexin V Apoptosis kit (BD, CA, USA). A flow cytometer (BD, CA, USA) was used to measure the cell cycle and calculate the apoptotic cells numbers.
Statistical Analysis
Values are expressed as mean ± SD from three independent experiments. And the SPSS software was used for one-way analysis of variance followed by multiple comparisons, and p < 0.05 and P < 0.01 were considered the threshold for significant difference and very significant difference, respectively.
Results
Effect of Rapamycin on Different Glioma Cell
Four glioma cells (U87, U118-MG, U251, and A172 cells) were exposed to different rapamycin concentrations. CCK8 assay showed that rapamycin inhibited the cell viability of U118-MG and U87 cells at 24, 48 and 72 hours, and at 48 and 72 hours, respectively, (Figure 1A). A172 and U251 cell viability was not dose-dependent upon rapamycin treatment (Supplementary Figure S1A). U87 and U118-MG cell treatment with different concentrations of rapamycin (10 and 100 μM), respectively, and Western blotting showed that rapamycin treatment decreased DAPK1 and P62 expression, and elevated the LC3 II/I ratio in U118-MG and U87 cells (Supplementary Figure S1B). Furthermore, for U118-MG cells treated with increased rapamycin concentration for 72 h, results showed that 150–250 μM rapamycin treatment caused massive cell death, with P62 expression was obviously reduced after treatment with 12.5 μM rapamycin (Figure 1B). The 12.5 μM rapamycin concentration was selected to treat U118-MG cells for 48 h for microRNA second-generation sequencing.
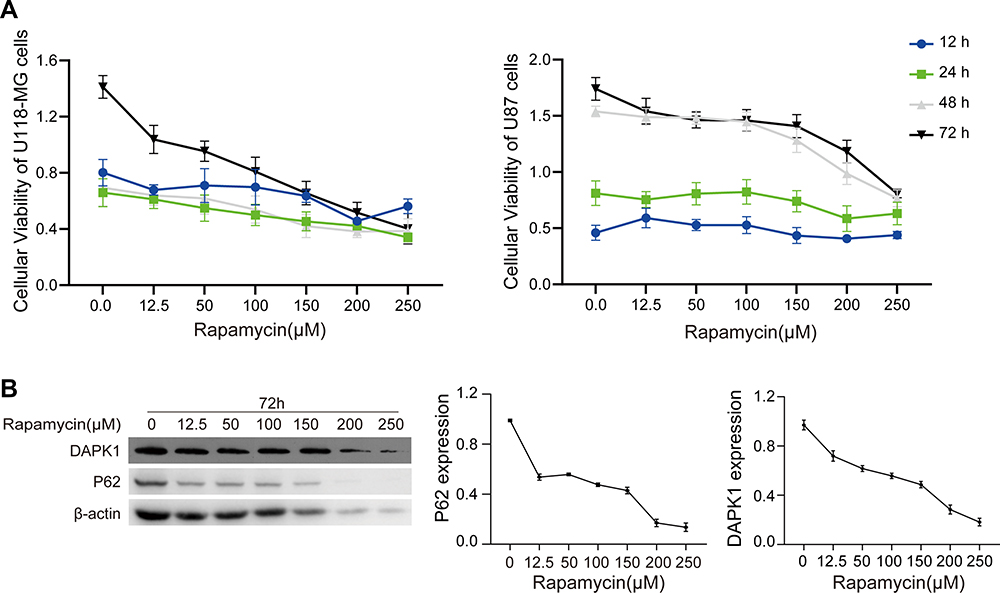 |
Figure 1 Rapamycin effect on U118-MG and U87 cells. (A) Viability of U118-MG and U87 cells treated with different rapamycin for 12, 24, 48, and 72 h assessed via CCK-8 assay. (B) DAPK1 and P62 expression in U118-MG cells treated with different rapamycin concentrations analyzed via Western blotting. |
Sequencing Data Analysis and Verification
As shown in the Venn diagram (Figure 2A), 99 DEMs between U118-MG cells treated with and without 12.5 μM rapamycin, including 58 up-regulated DEMs and 41 down-regulated DEMs, were screened according to the methods described above. Hsa-mir-143-3p, hsa-miR-124-3p, and hsa-miR-26a-5p were then selected for verification via RT-qPCR. Results revealed that after 12.5 μMrapamycin treatment for 48 h, hsa-miR-143-3p and hsa-miR-26a-5p levels were up-regulated, however, hsa-miR-124-3p could not be detected (Figure 2B). Hsa-miR-26-5p was selected for functional verification in subsequent experiments.
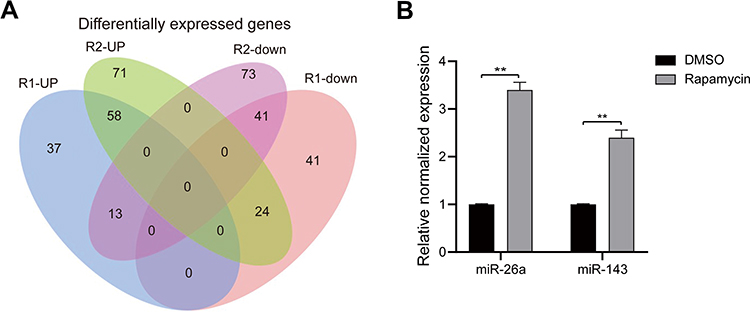 |
Figure 2 Bioinformatics analysis and verification. (A) Venn diagram showing differentially expressed miRNAs between U118-MG cells treated with and without 12.5 μM rapamycin. (B) Hsa-mir-143-3p and hsa-miR-26a-5p levels in U118-MG cells treated with or without 12.5 μM rapamycin analyzed via RT-qPCR. At least three repeats were conducted, and the mean ± SD is presented, **P<0.01. |
DAPK1 Was Verified as a Functional Target of miR-26a-5p
DAPK1 was considered a potential target gene of miR-26a-5p according to TargetScan databases (Figure 3A). Luciferase receptor assay showed that after co-transfection with DAPK1-WT and miR-26a-5p mimic, the luciferase activity was reduced compared to co-transfection with mimic control, where no significant difference was found after DAPK1-MUT treatment (Figure 3B), suggesting that DAPK1 is a direct miR-26a-5p target gene.
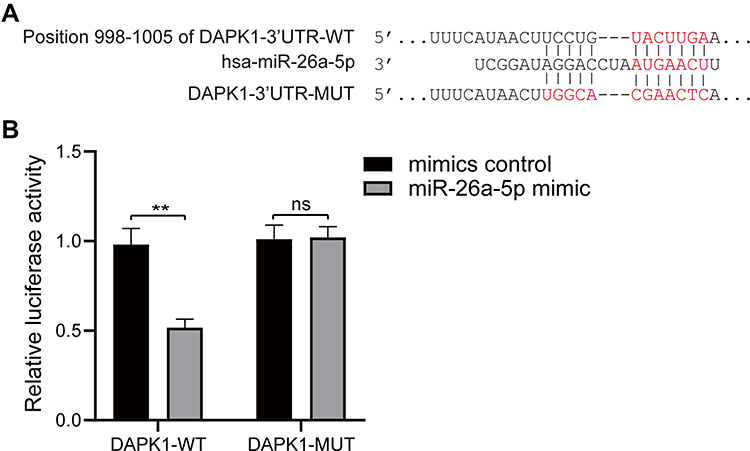 |
Figure 3 MiR-26a-5p target gene identification. (A) Prediction of the binding site of miR-26a-5p and death associated protein kinase 1 (DAPK1) using the TargetScan database; (B) target regulation of miR-26a-5p to DAPK1 proved by luciferase reporter system. At least three repeats were conducted, and the mean ± SD is presented, **P<0.01. |
Effect of Rapamycin on Cell Proliferation, Cell Cycle and Apoptosis in Glioma Cells
The Edu assay showed that rapamycin significantly inhibited cell proliferation, and the addition of a miR26a inhibitor increased cell proliferation, whereas the addition of pc-DAPK1 significantly promoted cell proliferation (Figure 4A). Cell cycle analysis results showed that rapamycin significantly inhibited the number of S phase cells, whereas the addition of pc-DAPK1 significantly increased the number of S phase cells (Figure 4B). Additionally, rapamycin treatment promoted apoptosis, while the addition of miR-26a-5p inhibitor inhibited apoptosis, and the overexpression of DAPK1 further decreased the number of apoptotic cells (Figure 4C).
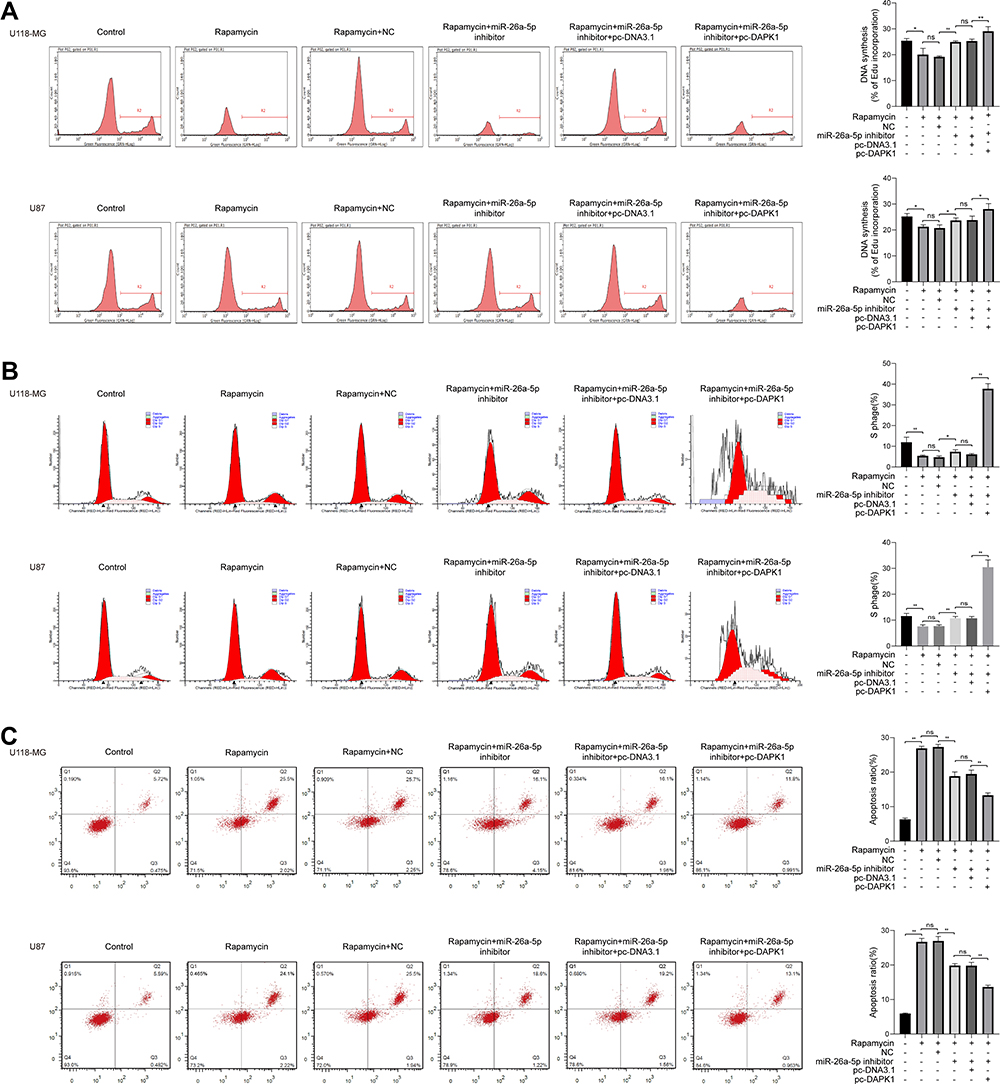 |
Figure 4 Rapamycin effect on cell proliferation, cell cycle and apoptosis in glioma cells. (A) Cell proliferation in U118-MG and U87 cells co-treated with rapamycin, miR-26a-5p inhibitor, and/or pc-DAPK1 assessed via Ethynyldeoxyuridine assay. (B) Cell cycle of U118-MG and U87 cells co-treated with rapamycin, miR-26a-5p inhibitor, and/or pc-death associated protein kinase 1 (DAPK1) analyzed via flow cytometry assay. (C) Apoptosis of U118-MG and U87 cells co-treated with rapamycin, miR-26a-5p inhibitor, and/or pc-DAPK1 detected using flow cytometry assay. At least three repeats were conducted, and the mean ± SD is presented, *P<0.05, **P<0.01. |
Effect of Rapamycin on Cell Autophagy in Glioma Cells
When U118-MG cells were treated with rapamycin, miR-26a-5p inhibitor and/or pc-DAPK1 for 48 h, RT-qPCR showed that miR-26a-5p levels were significantly increased after treatment with rapamycin, whereas miR-26a-5p levels were significantly inhibited by the miR-26a-5p inhibitor (Figure 5A). However, DAPK1 mRNA expression levels decreased significantly after rapamycin treatment, increasing significantly with the addition of miR-26a-5p inhibitor and pc-DAPK1 (Figure 5B). Additionally, Western blotting showed that after treatment with rapamycin, DAPK1 protein expression levels decreased significantly, whereas Beclin1 protein expression levels and LC3 II/I ratio increased significantly (Figure 5C). Additionally, to further verify that rapamycin can promote glioma cell autophagy, an immunofluorescence assay was used to detect LC3 expression. Results showed that rapamycin promoted glioma cell autophagy through the miR-26a-5p/DAPK1 signaling pathway (Figure 5D).
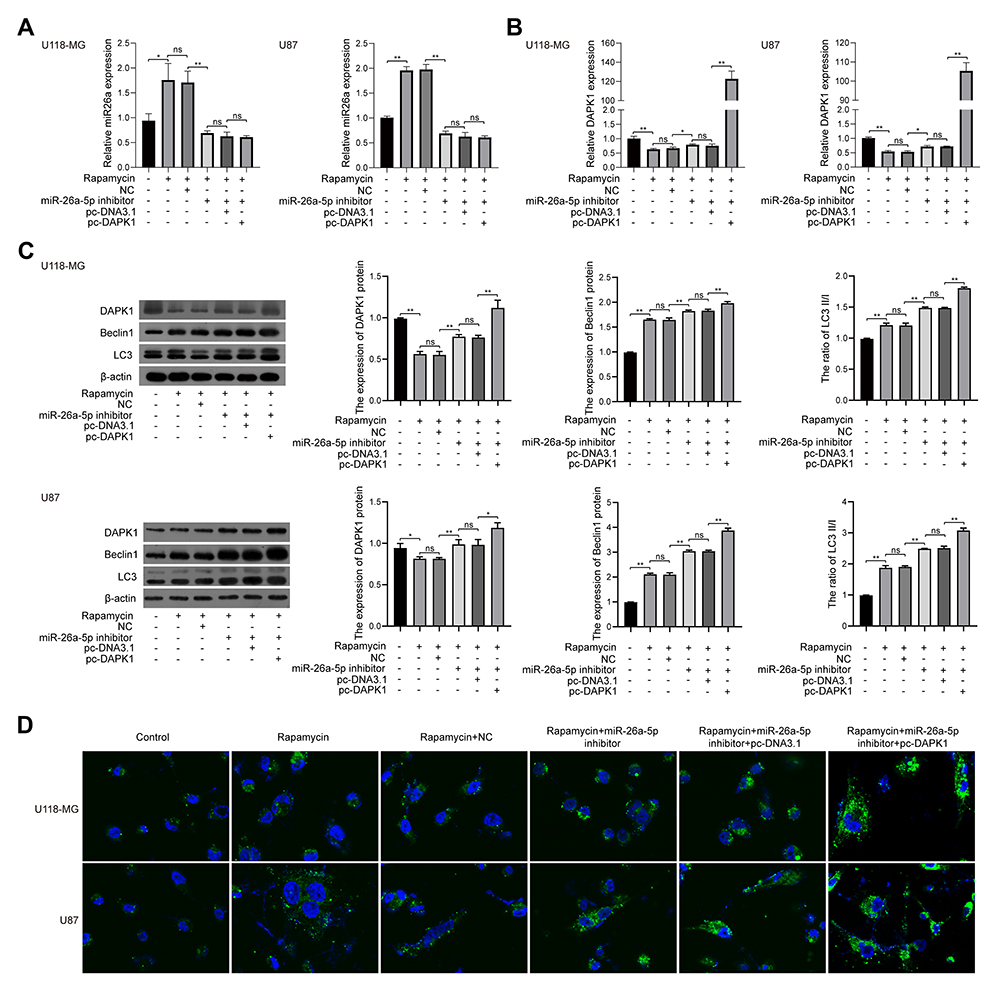 |
Figure 5 Rapamycin effect on cell autophagy in glioma cells. (A) MiR-26a-5p levels in U118-MG and U87 cells co-treated with rapamycin, miR-26a-5p inhibitor, and/or pc-DAPK1 for 48 h detected using RT-qPCR. (B) DAPK1 mRNA levels in U118-MG and U87 cells co-treated with rapamycin, miR-26a-5p inhibitor, and/or pc-DAPK1 for 48 h detected using RT-qPCR. (C) DAPK1 protein expression, Beclin1, and LC3 levels in U118-MG and U87 cells co-treated with rapamycin, miR-26a-5p inhibitor, and/or pc-DAPK1 detected using Western blotting. (D) Immunofluorescence detection of LC3 protein expression. At least three repeats were conducted, and the mean ± SD is presented, *P<0.05, **P<0.01. |
Discussion
Glioma is a primary brain tumor that seriously affects human health. DAPK1 has been confirmed to be related to glioma cell activity, meaning DAPK1 may be a target for glioma therapy. DAPK1, calcium/calmodulin-regulated serine/threonine kinase, plays key roles in mediating cell apoptosis and autophagy.26 Autophagy is a lysosomal-mediated process involved in cell growth, differentiation, viability and other pathological and physiological processes.27 It degrades damaged intracellular organelles, abnormal protein and other substances deposition, and maintains cellular homeostasis.28 Therefore, autophagy is a conservative in vivo system that plays a dual role in tumor occurrence and development.29
Few studies have focused on the illuminating mechanism of action of rapamycin in glioma cell via bioinformatics analyses. Additionally, accumulating evidence has indicated a generally low miR-26a-5p expression in several cancers, including bladder cancer,30 colorectal carcinoma,31 prostate cancer,32 and lung cancer,33 whereas high miR-26a-5p expression levels can inhibit tumor growth. In the present study, we found that 58 DEMs were up-regulated and 41 DEMs were down-regulated in rapamycin-treated U118-MG cells based on bioinformatics analysis. MiR-26-5p was proved to be highly expressed in U118-MG cells treated with 12.5 μM rapamycin. Additionally, studies have shown that rapamycin can inhibit cell proliferation, arrest the cell cycle in the G1 phase, and promote apoptosis.20–22 In this study, rapamycin inhibited cell proliferation and the number of cells in S phase and promoted apoptosis; the addition of miR-26a-5p inhibitor reduced the rapamycin effect on inhibiting cell proliferation, stagnated the cell cycle in S phase, promoting apoptosis, and increased Beclin1 protein expression levels and LC3 II/I ratio. Therefore, rapamycin may inhibit glioma cell growth by up-regulating miR-26a-5p expression.
Studies have confirmed that Beclin1 and LC3 II/I ratio are indices of autophagy activity.34 This study demonstrated that rapamycin could regulate Beclin1 and LC3 expression. Generally, more than 30 autophagy-related (ATG) genes are involved in every step of this process.34 Among them, microtubule associated protein1 light chain 3, a mammalian homolog of yeast Atg8, is considered a key regulator of autophagy, participating in several steps, including the growth of autophagic membranes, recognition of autophagic cargoes, and fusion of autophagosomes with lysosomes.35–37 LC3 is synthesized as a precursor form cleaved by the protease ATG4B, resulting in the cytosolic isoform LC3-I. In turn, LC3-I is conjugated to phosphatidylethanolamine to form LC3-II upon autophagy induction.38–40 LC3-II binds to the autophagosome membrane and remains bound to it until it is degraded in the autolysosomes. LC3-II is an important marker for assessing autophagy activity and is the only reliable autophagy marker to date.41 Therefore, in this study, LC3 protein expression was detected via immunofluorescence. Results showed that rapamycin increased LC3 expression, which further revealed that rapamycin could promote autophagy.
Furthermore, DAPK1 was confirmed as the direct target gene of miR-26a-5p. MiR-26a-5p could reduce DAPK1expression, which could be attenuated by the addition of the miR-26a-5p inhibitor. Furthermore, rapamycin could up-regulate miR-26a-5p expression. Notably, rapamycin could also reduce DAPK1 expression and promote autophagy-related protein expression. Rapamycin treatment increased Beclin1 and LC3 II/I expression levels.
Conclusions
In this study, we found that miR-26a-5p was overexpressed in rapamycin-treated glioma cells, whereas DAPK1 expression was inhibited. Additionally, rapamycin may exert its antitumor effect by promoting autophagy depending on miR-26a-5p/DAPK1 pathway activation by rapamycin.
Abbreviations
DEMs, expressed miRNAs; mTOR, mammalian target of rapamycin; DAPK1, death associated protein kinase 1; pc-DAPK1, DAPK1 overexpression vector; PI, propidium iodide; HCAECs, human coronary artery endothelial cells; HDMECs, human skin microvascular endothelial cells.
Data Sharing Statement
All data generated or analyzed during this study is included in this published article.
Consent for Publication
All of the authors have agreed to publish this article in your journal if it is accepted.
Author Contributions
All authors have read and approved the manuscript. All authors contributed to data analysis, drafting or revising the article, have agreed on the journal to which the article will be submitted, gave final approval of the version to be published, and agree to be accountable for all aspects of the work.
Funding
This work was supported by the National Natural Science Foundation of China under Grant 81502158, the Foundation for Zhejiang Medical and Health Science, and Technology under Grant 2018KY376 and Zhejiang Province Natural Science Foundation under Grant LQ20H1600036.
Disclosure
Zheng Wang and Xiaoxi Wang are co-first authors for this study. The authors declare that they have no competing interests.
References
1. Weller M, Wick W, Aldape K, et al. Glioma. Nat Rev Dis Primers. 2015;1(1):15017. doi:10.1038/nrdp.2015.17
2. Bush NAO, Chang SM, Berger MS. Current and future strategies for treatment of glioma. Neurosurg Rev. 2017;40(1):1–14. doi:10.1007/s10143-016-0709-8
3. Suryadevara CM, Verla T, Sanchez-Perez L, et al. Immunotherapy for malignant glioma. Surg Neurol Int. 2015;6(Suppl 1):S68. doi:10.4103/2152-7806.151341
4. Geering B. Death-associated protein kinase 2: regulator of apoptosis, autophagy and inflammation. Int J Biochem Cell Biol. 2015;65:151–154. doi:10.1016/j.biocel.2015.06.001
5. Deiss LP, Feinstein E, Berissi H, Cohen O, Kimchi A. Identification of a novel serine/threonine kinase and a novel 15-kD protein as potential mediators of the gamma interferon-induced cell death. Genes Dev. 1995;9(1):15–30. doi:10.1101/gad.9.1.15
6. Bialik S, Bresnick AR, Kimchi A. DAP-kinase-mediated morphological changes are localization dependent and involve myosin-II phosphorylation. Cell Death Differ. 2004;11(6):631–644. doi:10.1038/sj.cdd.4401386
7. Wang S, Shi X, Li H, et al. DAPK1 signaling pathways in stroke: from mechanisms to therapies. Mol Neurobiol. 2017;54(6):4716–4722. doi:10.1007/s12035-016-0008-y
8. Yuan W, Chen J, Shu Y, et al. Correlation of DAPK1 methylation and the risk of gastrointestinal cancer: a systematic review and meta-analysis. PLoS One. 2017;12(9):e0184959. doi:10.1371/journal.pone.0184959
9. Beermann J, Piccoli M-T, Viereck J, Non-coding TT. RNAs in development and disease: background, mechanisms, and therapeutic approaches. Physiol Rev. 2016;96(4):1297–1325. doi:10.1152/physrev.00041.2015
10. Acunzo M, Romano G, Wernicke D, Croce CM. MicroRNA and cancer–a brief overview. Adv Biol Regul. 2015;57:1–9. doi:10.1016/j.jbior.2014.09.013
11. Shah MY, Ferrajoli A, Sood AK, Lopez-Berestein G, Calin GA. MicroRNA therapeutics in cancer—an emerging concept. EBioMedicine. 2016;12:34–42. doi:10.1016/j.ebiom.2016.09.017
12. Xia Z, Liu F, Zhang J, Liu L, Kyprianou N. Decreased expression of MiRNA-204-5p contributes to glioma progression and promotes glioma cell growth, migration and invasion. PLoS One. 2015;10(7):e0132399. doi:10.1371/journal.pone.0132399
13. Que T, Song Y, Liu Z, et al. Decreased miRNA-637 is an unfavorable prognosis marker and promotes glioma cell growth, migration and invasion via direct targeting Akt1. Oncogene. 2015;34(38):4952. doi:10.1038/onc.2014.419
14. Gu J, Lu Z, Ji C, et al. Melatonin inhibits proliferation and invasion via repression of miRNA-155 in glioma cells. Biomed Pharmacother. 2017;93:969–975. doi:10.1016/j.biopha.2017.07.010
15. Yu J, Wu S-W, Wu W-P. A tumor-suppressive microRNA, miRNA-485-5p, inhibits glioma cell proliferation and invasion by down-regulating TPD52L2. Am J Transl Res. 2017;9(7):3336.
16. Blagosklonny MV. Does rapamycin slow down time? Oncotarget. 2018;9(54):30210. doi:10.18632/oncotarget.25788
17. Lamming DW. Inhibition of the mechanistic target of rapamycin (mTOR)–rapamycin and beyond. Cold Spring Harb Perspect Med. 2016;6(5):a025924. doi:10.1101/cshperspect.a025924
18. Petővári G, Hujber Z, Krencz I, et al. Targeting cellular metabolism using rapamycin and/or doxycycline enhances anti-tumour effects in human glioma cells. Cancer Cell Int. 2018;18(1):211. doi:10.1186/s12935-018-0710-0
19. Escalona-Rayo O, Fuentes-Vázquez P, Jardon-Xicotencatl S, García-Tovar CG, Mendoza-Elvira S, Quintanar-Guerrero D. Rapamycin-loaded polysorbate 80-coated PLGA nanoparticles: optimization of formulation variables and in vitro anti-glioma assessment. J Drug Deliv Sci Technol. 2019;52:488–499. doi:10.1016/j.jddst.2019.05.026
20. Hjelmeland AB, Lattimore KP, Fee BE, et al. The combination of novel low molecular weight inhibitors of RAF (LBT613) and target of rapamycin (RAD001) decreases glioma proliferation and invasion. Mol Cancer Ther. 2007;6(9):2449–2457. doi:10.1158/1535-7163.MCT-07-0155
21. Tanaka K, Sasayama T, Mizukawa K, et al. Specific mTOR inhibitor rapamycin enhances cytotoxicity induced by alkylating agent 1-(4-amino-2-methyl-5-pyrimidinyl)methyl-3-(2-chloroethyl)-3-nitrosourea (ACNU) in human U251 malignant glioma cells. J Neurooncol. 2007;84(3):233–244. doi:10.1007/s11060-007-9371-x
22. Guo Y, Ren G. Effect of rapamycin on proliferation and apoptosis in human glioblastoma cell. J Shantou Univ Med Coll. 2015;28(2):
23. Zhuang W-Z, Long L-M, Ji W-J, Liang Z-Q. Rapamycin induces differentiation of glioma stem/progenitor cells by activating autophagy. Chin J Cancer. 2011;30(10):712–720. doi:10.5732/cjc.011.10234
24. Yang P, Zhang J, Li Q, Ding Y, Ren J. Rapamycin combined with nimuatine suppresses growth and proliferation of human U87MG glioma cells. Acta Acad Med Militaris Tertlae. 2010;32(14):1529–1533.
25. Lin X, Han L, Weng J, Wang K, Chen T. Rapamycin inhibits proliferation and induces autophagy in human neuroblastoma cells. Biosci Rep. 2018;38(6). doi:10.1042/BSR20181822
26. Singh P, Ravanan P, Talwar P. Death associated protein kinase 1 (DAPK1): a regulator of apoptosis and autophagy. Front Mol Neurosci. 2016;9:46. doi:10.3389/fnmol.2016.00046
27. Zhang L, Tong X, Li J, et al. Apoptotic and autophagic pathways with relevant small-molecule compounds, in cancer stem cells. Cell Prolif. 2015;48(4):385–397. doi:10.1111/cpr.12191
28. Karsli-Uzunbas G, Guo JY, Price S, et al. Autophagy is required for glucose homeostasis and lung tumor maintenance. Cancer Discov. 2014;4(8):914–927. doi:10.1158/2159-8290.CD-14-0363
29. Levy JMM, Towers CG, Thorburn A. Targeting autophagy in cancer. Nat Rev Cancer. 2017;17(9):528. doi:10.1038/nrc.2017.53
30. Miyamoto K, Seki N, Matsushita R, et al. Tumour-suppressive miRNA-26a-5p and miR-26b-5p inhibit cell aggressiveness by regulating PLOD2 in bladder cancer. Br J Cancer. 2016;115(3):354. doi:10.1038/bjc.2016.179
31. Ghanbari R, Mosakhani N, Asadi J, et al. Downregulation of plasma MiR-142-3p and MiR-26a-5p in patients with colorectal carcinoma. Iran J Cancer Prev. 2015;8(3):3. doi:10.17795/ijcp2329
32. Guo K, Zheng S, Xu Y, Xu A, Chen B, Wen Y. Loss of miR-26a-5p promotes proliferation, migration, and invasion in prostate cancer through negatively regulating SERBP1. Tumour Biol. 2016;37(9):12843–12854. doi:10.1007/s13277-016-5158-z
33. Song Q, Liu B, Li X, et al. miR-26a-5p potentiates metastasis of human lung cancer cells by regulating ITGβ8-JAK2/STAT3 axis. Biochem Biophys Res Commun. 2018;501(2):494–500. doi:10.1016/j.bbrc.2018.05.020
34. Mizushima N. Autophagy: process and function. Genes Dev. 2007;21(22):2861–2873. doi:10.1101/gad.1599207
35. Ichimura Y, Kirisako T, Takao T, et al. A ubiquitin-like system mediates protein lipidation. Nature. 2000;408(6811):488–492. doi:10.1038/35044114
36. Nakatogawa H, Ichimura Y, Ohsumi YJC. Atg8, a ubiquitin-like protein required for autophagosome formation, mediates membrane tethering and hemifusion. Cell. 2007;130(1):165–178. doi:10.1016/j.cell.2007.05.021
37. Noda N, Ohsumi Y, Inagaki F. Atg8-family interacting motif crucial for selective autophagy. FEBS Lett. 2010;584(7):1379–1385. doi:10.1016/j.febslet.2010.01.018
38. Kabeya Y, Mizushima N, Ueno T, et al. LC3, a mammalian homologue of yeast Apg8p, is localized in autophagosome membranes after processing. EMBO J. 2000;19(21):5720–5728. doi:10.1093/emboj/19.21.5720
39. Kuma A, Matsui M, Mizushima NJA. LC3, an autophagosome marker, can be incorporated into protein aggregates independent of autophagy: caution in the interpretation of LC3 localization. Autophagy. 2007;3(4):323–328. doi:10.4161/auto.4012
40. Kimura S, Fujita N, Noda T, Yoshimori T. Monitoring autophagy in mammalian cultured cells through the dynamics of LC3. Methods Enzymol. 2009;452:1–12.
41. Klionsky DJ, Abdelmohsen K, Abe A, et al. Guidelines for the use and interpretation of assays for monitoring autophagy (3rd edition). Autophagy. 2016;12(1):1–222.
 © 2021 The Author(s). This work is published and licensed by Dove Medical Press Limited. The full terms of this license are available at https://www.dovepress.com/terms.php and incorporate the Creative Commons Attribution - Non Commercial (unported, v3.0) License.
By accessing the work you hereby accept the Terms. Non-commercial uses of the work are permitted without any further permission from Dove Medical Press Limited, provided the work is properly attributed. For permission for commercial use of this work, please see paragraphs 4.2 and 5 of our Terms.
© 2021 The Author(s). This work is published and licensed by Dove Medical Press Limited. The full terms of this license are available at https://www.dovepress.com/terms.php and incorporate the Creative Commons Attribution - Non Commercial (unported, v3.0) License.
By accessing the work you hereby accept the Terms. Non-commercial uses of the work are permitted without any further permission from Dove Medical Press Limited, provided the work is properly attributed. For permission for commercial use of this work, please see paragraphs 4.2 and 5 of our Terms.