")
Back to Journals » International Journal of General Medicine » Volume 16
Radiomics Nomogram Model Based on TOF-MRA Images: A New Effective Method for Predicting Microaneurysms
Authors Kong D, Li J, Lv Y, Wang M, Li S, Qian B, Yu Y
Received 17 November 2022
Accepted for publication 9 March 2023
Published 27 March 2023 Volume 2023:16 Pages 1091—1100
DOI https://doi.org/10.2147/IJGM.S397134
Checked for plagiarism Yes
Review by Single anonymous peer review
Peer reviewer comments 2
Editor who approved publication: Dr Scott Fraser
Delian Kong,1,* Junrong Li,1,* Yingying Lv,1,* Man Wang,2,* Shenghua Li,1 Baoxin Qian,3 Yusheng Yu2
1Department of Neurology, The Affiliated Jiangning Hospital with Nanjing Medical University, Nanjing, Jiangsu, 211100, People’s Republic of China; 2Department of Radiology, The Affiliated Jiangning Hospital with Nanjing Medical University, Nanjing, Jiangsu, 211100, People’s Republic of China; 3Huiying Medical Technology (Beijing); Huiying Medical Technology Co., Ltd, Beijing City, 100192, People’s Republic of China
*These authors contributed equally to this work
Correspondence: Delian Kong; Yusheng Yu, Email [email protected]; [email protected]
Objective: To develop a radiomics nomogram model based on time-of-flight magnetic resonance angiography (TOF-MRA) images for preoperative prediction of true microaneurysms.
Methods: 118 patients with Intracranial Aneurysm Sac (40 positive and 78 negative) were enrolled and allocated to training and validation groups (8:2 ratio). Findings of clinical characteristics and MRA features were analyzed. A radiomics signature was built on the basis of reproducible features by using the least absolute shrinkage and selection operator (LASSO) regression algorithm in the training group. The radiomics nomogram model was constructed by combining clinical risk factors and radiomics signature. In order to compare the classification performance of clinical models, radiomics model and radiomics nomogram model, AUC was used to evaluate them. The performance of the radiomics nomogram model was evaluated by calibration curve and decision curve analysis.
Results: Eleven features were selected to develop radiomics model with AUC of 0.875 (95% CI 0.78– 0.97), sensitivity of 0.84, and specificity of 0.68. The radiomics model achieved a better diagnostic performance than the clinic model (AUC = 0.75, 95% CI: 0.53– 0.97) and even radiologists. The radiomics nomogram model, which combines radiomics signature and clinical risk factors, is effective too (AUC = 0.913, 95% CI: 0.87– 0.96). Furthermore, the decision curve analysis demonstrated significantly better net benefit in the radiomics nomogram model.
Conclusion: Radiomics features derived from TOF-MRA can reliably be used to build a radiomics nomogram model for effectively differentiating between pseudo microaneurysms and true microaneurysms, and it can provide an objective basis for the selection of clinical treatment plans.
Keywords: machine learning, radiomics, microaneurysms, nomogram
Introduction
Intracranial aneurysm (IA) is an acquired cerebrovascular disorder characterized by thinning and localized dilation of the wall of the intracranial artery due to weakness of the inner cortex. The incidence of intracranial aneurysm is 2–5%.1 The etiology of intracranial aneurysms is still unclear. A large number of clinical studies have found that this may be related to an increase in local intraluminal pressure of intracranial arterial walls or congenital defects, as well as the occurrence and development of cerebral arteriosclerosis, hypertension, aneurysm and vasculitis. The prevalence of unruptured cerebral aneurysms in the adult population is about 1–6%, and in the asymptomatic population with the average age of 50, the prevalence of unruptured cerebral aneurysms is about 3%.1 There is no obvious discomfort when the intracranial aneurysm is not ruptured in its early stages. It is easy to be ignored by the patient and will lead to missed diagnosis or misdiagnosis. Once the intracranial aneurysm ruptures, it will cause death, disability and other serious consequences, which will seriously threaten the patients’ life. The incidence of intracranial aneurysm rupture is 25–50%, with high mortality and disability rate.
The concept of tiny intracranial aneurysms (TIA) was first proposed by Yasargil and Fox,2 which refers to aneurysms with diameter ≤3 mm, also known as infant aneurysms, accounting for 13.2–15.1% of all intracranial aneurysms.3,4 RTIA (ruptured tiny intracranial aneurysms) account for 6–7% of all ruptured intracranial aneurysms.5,6
A prospective study in China shows that there is a high incidence rate and risk of rupture of intracranial microaneurysms. And there are more common anterior communicating artery aneurysms of ruptured microaneurysms, indicating that tiny anterior communicating artery aneurysms have a high risk of rupture.
Therefore, even microaneurysms have a high risk of rupture (especially anterior communicating microaneurysms). So early and accurate diagnosis of intracranial aneurysms (including microaneurysms) and guidance of clinical treatment are particularly important for improving the prognosis of patients.
At present, the clinical diagnostic methods for intracranial aneurysms are computed tomography (CT), magnetic resonance (MR) and digital subtraction angiography (DSA). DSA is the most reliable method for the diagnosis of intracranial aneurysms as the gold standard. However, its clinical application is limited due to its high technical requirements, relatively complex operation, high cost and invasive examination.
MRA is safer and simpler because it does not need to inject contrast agents, so it becomes the first choice for most patients. However, microaneurysms are difficult to detect in general MRA examination not only because of the tiny diameter and different shape and size of microaneurysms but also because they are located on intracranial vessels with complex vascular morphology, which will be prone to lead to missed diagnosis and misdiagnosis. Therefore, there is an urgent need for an accurate, comprehensive and non-invasive analysis method for the early differential diagnosis of intracranial microaneurysms. Time-of-flight magnetic resonance angiography (TOF-MRA) technology has become one of the most commonly used image modes in routine physical examination and outpatient screening due to its characteristics of non-invasive imaging and without contrast agent.
However, the traditional artificial feature design cannot fully reflect the focus characteristics of intracranial microaneurysms. In recent years, the emerging artificial intelligence methods, including imaging omics and deep learning technology, can accurately detect and segment the focus area and extract the high-throughput features contained in the image and describe the heterogeneity of aneurysms. Compared with traditional medical images, it has the advantages of high-throughput, quantification, fast calculation speed and high precision, which makes it possible for accurate quantitative analysis of intracranial microaneurysm images.
In this study, non-invasive TOF-MRA images were used as the basic input information, and imaging omics technology was used as a new auxiliary analysis method to conduct standardized in-depth mining and dynamic quantitative analyses of image features for small intracranial aneurysms, so as to reveal the relationship of lesion properties corresponding to different imaging manifestations. We explored the dominant features highly correlated with intracranial microaneurysms and built a differential diagnosis model for intracranial microaneurysm based on imaging features. We established and compared the predictive effects of clinical risk factors, radiomics characteristics, and radiomics nomogram models, and selected the best method for predicting microaneurysms to help develop treatment strategies and prolong patient survival.
Materials and Methods
Patient Population and Data Acquisition
A retrospective analysis was performed on the data of patients who met the following inclusion and exclusion criteria and were enrolled between June 2019 and December 2020. Inclusion criteria: (1) Chemotherapy, radiotherapy, surgical resection and aneurysm embolization were not performed before MRA examination of intracranial aneurysms. (2) Digital silhouette angiography (DSA) is performed. (3) Image quality, shooting angle and environment are in line with diagnostic standards. Exclusion criteria: (1) No DSA examination; (2) The image quality is poor, and the shooting is unqualified.
Based on the inclusion and exclusion criteria, a total of 118 patients (46 men and 72 women; mean age: 60.2 years ± 11.5; range: 46–82 years) were included in this study. According to the results of DSA, 118 microaneurysms were divided into 40 true microaneurysms and 78 pseudo microaneurysms. The patient recruitment workflow is shown in Figure 1.
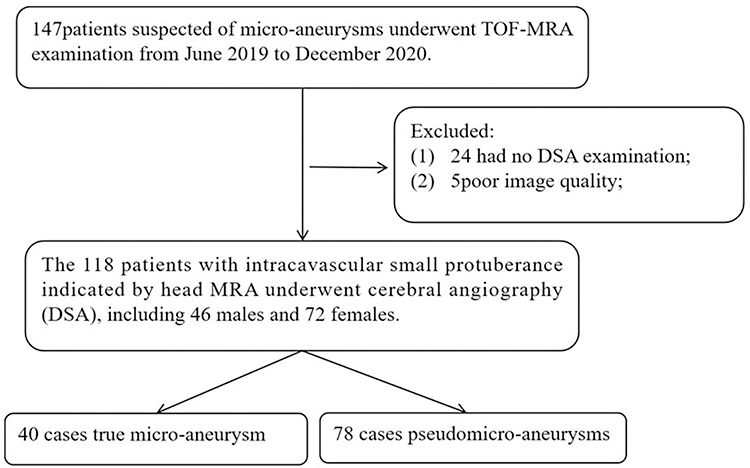 |
Figure 1 Patient recruitment workflow. In total, 118 out of 147 patients were included according to the inclusion and exclusion criteria. The included patients had complete clinical information needed for the study. |
Data Acqusition and Image Segmentation
3.0T MR equipment was used for examination, including T1, T2, DWI, T2 dark fluid and TOF MRA sequences. The TOF MRA sequence was included as basic input information, and its parameters were as follows: tr:22ms, te:3.69ms, td:0ms, fa:20, voxel size: 0.3*0.3*0.6ms.
All the images were exported from the PACS system and imported into a radiomics cloud platform V.3.1.0. Only one typical microaneurysm lesion was labeled for each patient. The lesions were manually delineated on the reconstructed images with a slice of 1mm by two independent radiologists (approximately 3 and 5 years of experience in radiology, respectively). Regions of interest (ROIs) were manually depicted along the margin of lesion on MRA sequence by two radiologists independently (Figure 2). Inter- and intra-class correlation coefficients (ICCs) were used to assess the intra-observer reproducibility and inter-observer reliability of feature extraction. There was a good agreement with the feature extraction if the ICC value >0.8.
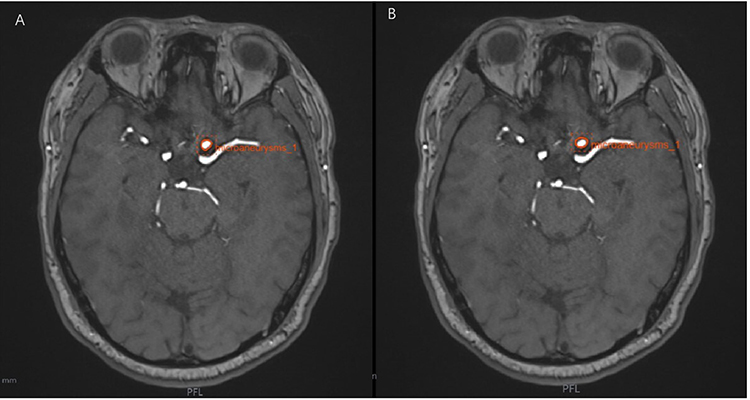 |
Figure 2 Regions of interest (ROIs) manually depicted along the margin of lesion on MRA sequence by two radiologists independently. The case is a 54-year-old woman with true microaneurysms. ROIs manually depicted along the margin of tumor on MRA sequences by two different radiologists with 3 years’ (A) and 5 years’ experiences (B) in radiology diagnosis independently. |
Radiomics Feature Extraction and Feature Selection
Radiomics feature extraction was performed on the Radcloud platform for the lesion ROI. The radiomics features were divided into four groups: (a) Shape features, (b) first-order statistics features, (c) texture-based features, and (d) high-order features.
Radiomics features in the training group were selected using the subsequent process. Variance is used to evaluate the divergence of features. The larger the variance, the more dispersed a feature is, and the more useful it is for sample classification. First, according to the threshold value, features with a variance value of >0.8 were selected. In SelectKBest analysis, Chi-square test was used for categorical variables, and variance analysis (f_classif) was used for continuous variables. Then, since features were continuous variables, we selected features with a P value less than 0.05 based on variance analysis method. Finally, the least absolute shrinkage and selection operator (LASSO) method was used to identify the best alpha (α) and obtain the most useful radiomics features for the differentiation of true microaneurysms from pseudo microaneurysms. The LASSO method was used to obtain useful radiomics features for developing radiomics models. The useful radiomics signatures and their corresponding coefficients were used to calculate the radiomics score (Rad-score) for each patient. The formula can be seen in Supplementary Formula 1.
After feature selection, considering the correlation between features, since our features did not obey binary normal distribution, so spearman feature correlation analysis was used to conduct the correlation analysis of the last radiomics features, and the optimal image radiomics features were selected to construct the radiomics model.
Construction of the Radiomics Signature
The cases were randomly assigned to the training group and the validation group at a ratio of 8:2. The training group was used to establish the diagnostic model, and the validation group was used to verify the efficacy of the model in the diagnosis of true and pseudo microaneurysms. Two classification models based on Support Vector Machine (SVM) and Logistic Regression (LR) classifiers were constructed to assess the multivariate performance of the optimal features in the training of validation group. The Receiver Operating Curve (ROC) analysis was used to illustrate the classification performance. The area under the ROC curve (AUC), accuracy, sensitivity, and specificity were calculated. The workflow for radiomics analysis included tumor segmentation, feature extraction, feature selection, model construction, model analysis, and evaluation (Figure 3).
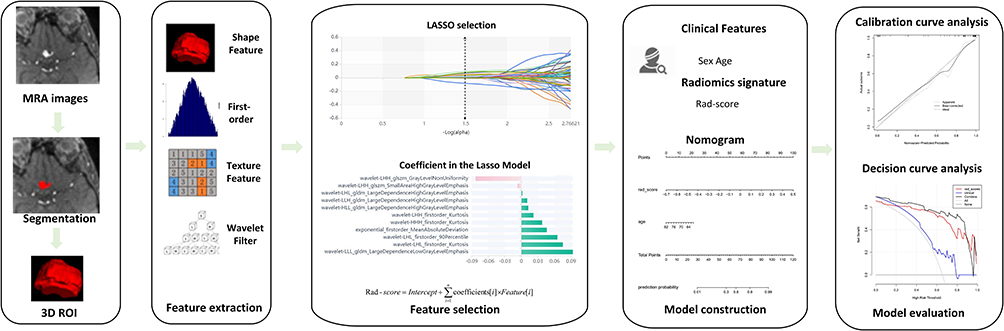 |
Figure 3 Study flowchart of the radiomics analysis. |
Development of a Radiomics Nomogram Model and Assessment of the Performance of Different Models
The significant variables of both the clinical risk factors and the Rad-score were employed to develop a radiomics nomogram model. A calibration plot was performed to assess the calibration and goodness-of-fit of the radiomics nomogram model. The prediction performance of the clinical model, radiomics model and the radiomics nomogram for prognosis was estimated based on the C-index in both the training and validation groups. The decision curve analysis (DCA) was conducted to assess the net benefits for a range of threshold probabilities in the training and validation groups.
Statistical Analysis
Statistical tests were performed using SPSS (version 25.0, IBM) and R statistical software (version 4.1.2, https://www.r-project.org). The R script can be seen in Supplementary Formula 1. The Kolmogorov–Smirnov statistical test was used to test for the normality in all continuous variables. Analysis of variance was used for normally distributed variables, and the Mann Whitney test was used for non-normally distributed variables. To evaluate associations between clinical characteristics and malignant risk of tumors, univariate analysis was applied to compare the differences of the clinical risk factors between training and validation groups by using the chi-square test or Fisher's exact test for categorical variables, and the independent sample T-test Mann–Whitney U-test for continuous variables, were appropriate. The “glmnet” package was used to perform the LASSO regression model analysis. Radiomics nomogram development and calibration plots were performed using the “rms” package, and the Hosmer-Leme show test was performed using the “generalhoslem” package. The DCA was performed using the “dca.R.” package. All tests were two-tailed tests, and P < 0.05 was considered statistically significant.
Results
Participant Characteristics
Totally 40 pseudomicroaneuysm patients and 78 true microaneurysm patients were included in this study. There was no significant difference in age and sex between the training and validation groups (p = 0.431), which indicated that the data was randomly distributed. The difference in sex between pseudo microaneuysms and true microaneuysms was no distinct (p = 0.732). There was a significant difference in age between pseudomicroaneurysm group and true microaneurysm group (Training goup: p < 0.001, Validation goup: p < 0.001), but sex was not significantly different between pseudomicroaneurysm group and true microaneurysm group (Training goup: p = 0.230. Validation goup: p = 0.140) whether in the training groups or the validation groups. Table 1 shows values of clinical factors between different groups.
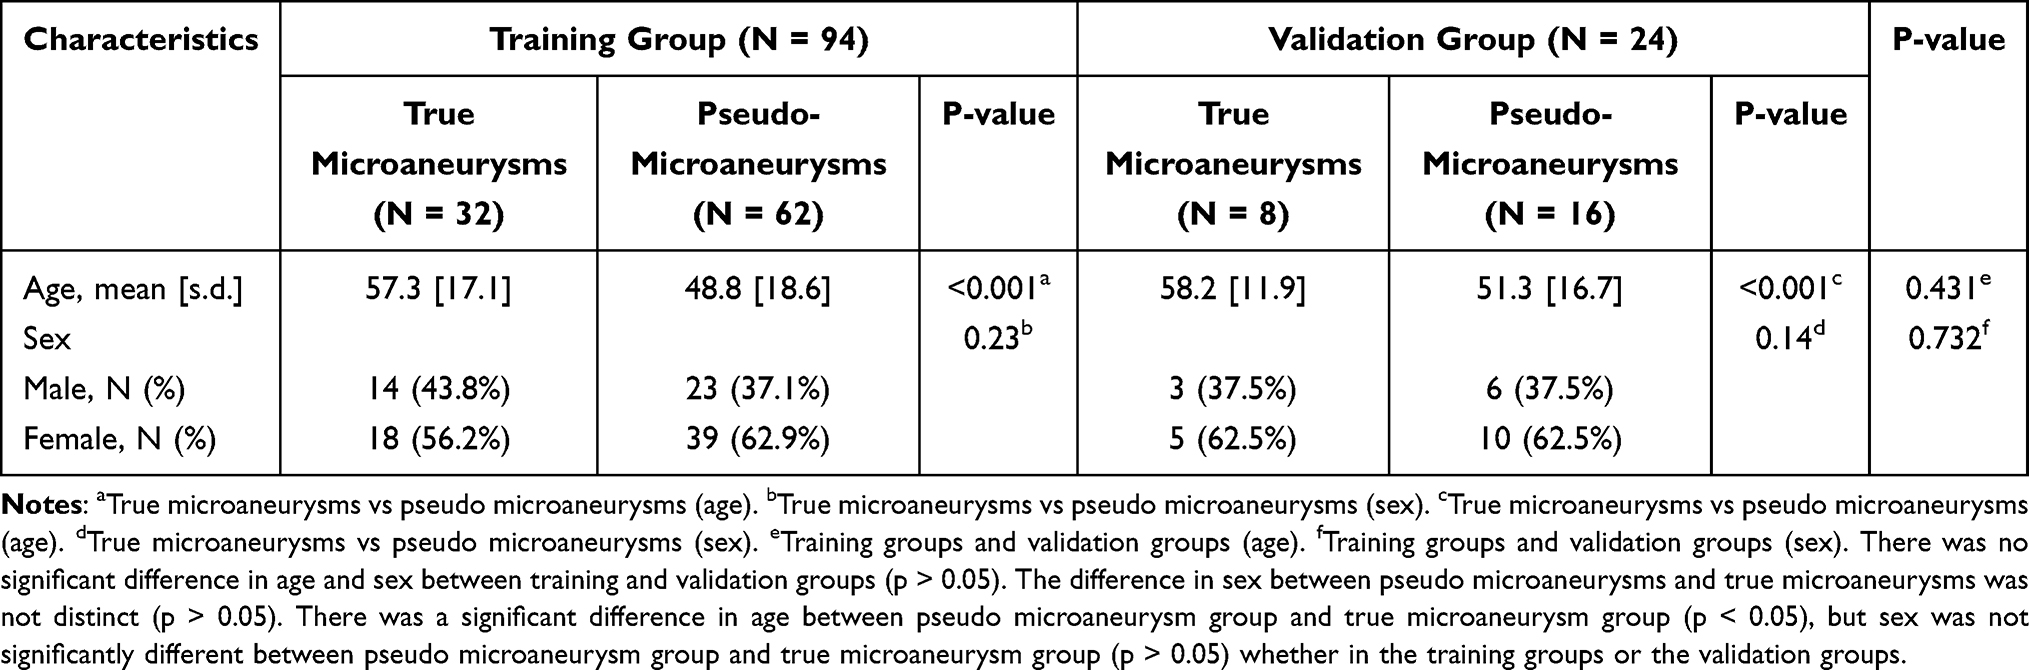 |
Table 1 Clinical Factors of the Training Groups and Validation Groups |
Optimal Radiomics Features in the Training Group
We initially extracted 1409 radiomics features from the MRA sequence, and then inter- and intra-class correlation coefficients (ICCs) were used to assess the intra-observer reproducibility and inter-observer reliability of feature extraction. There was a good agreement with the feature extraction if the ICC value >0.8. We selected 118 features with the select K best methods after 1185 radiomics features were saved. Finally, we selected 11 optimal features. Table 2 shows descriptions of the selected radiomics features with their associated feature group and filter.
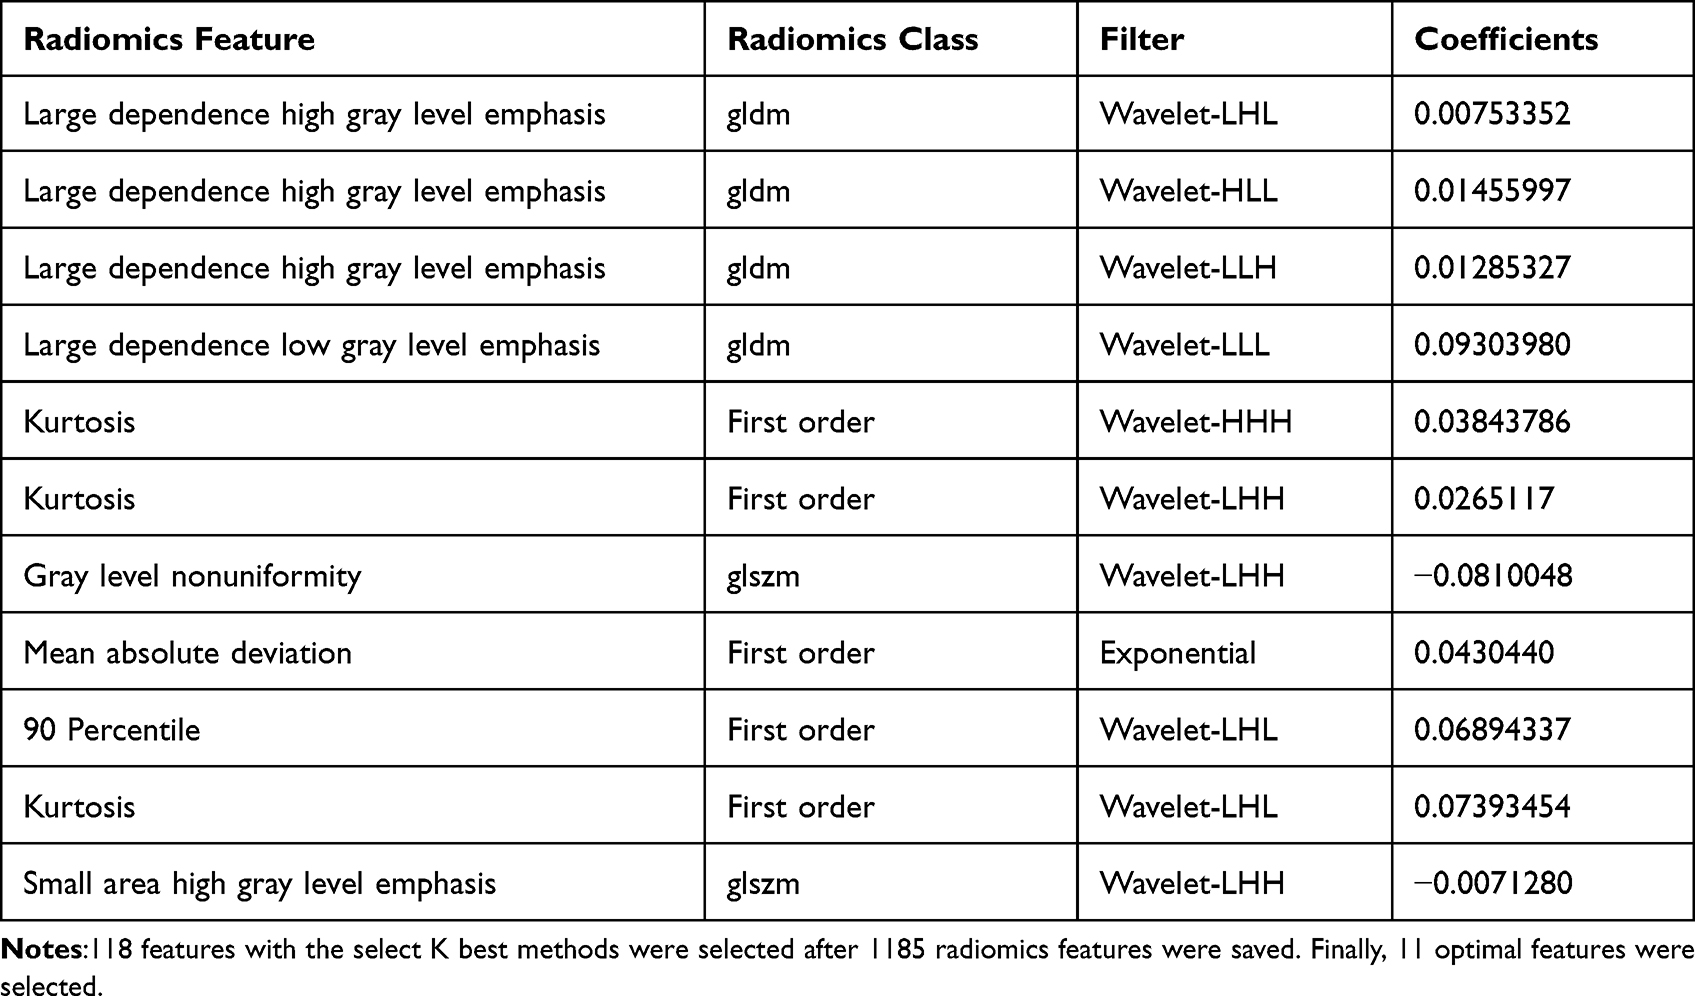 |
Table 2 Description of the Selected Radiomics Features with Their Associated Feature Group and Filter |
Figure 4A shows the mean square error (MSE) of the LASSO algorithm in the feature screening process.
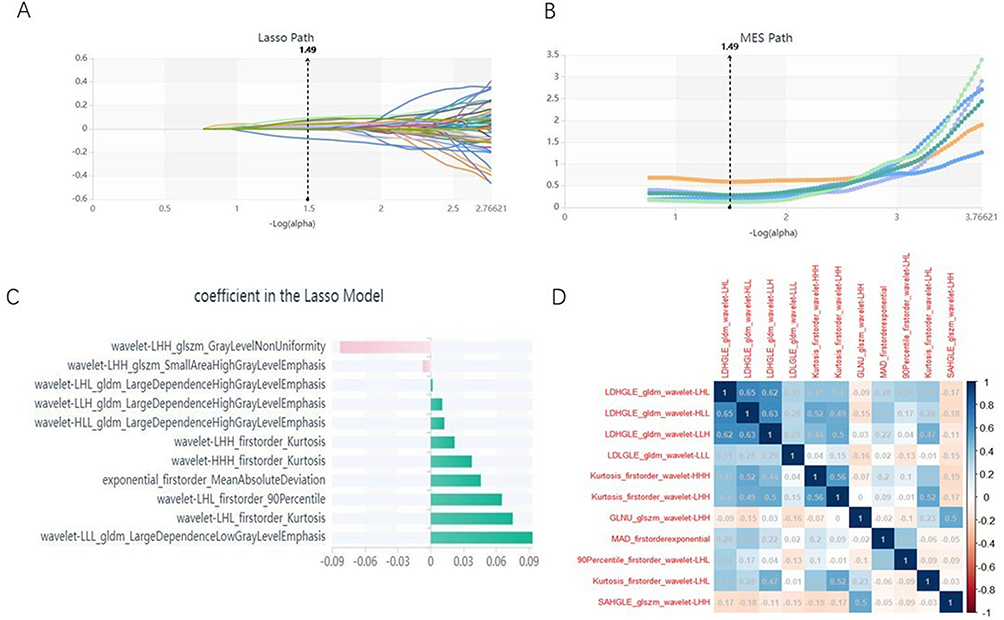 |
Figure 4 The LASSO algorithm on feature select. (A) MSE path; (B) LASSO path; (C) Coefficients in LASSO model. Using LASSO model, 11 features which are correspond to the optimal alpha value were selected. (D) Correlation analysis heat map. |
The LASSO regression model adopted 10x cross validation to select the best tuning parameter alpha. Figure 4B shows that 11 non-zero coefficient features were obtained by the optimal tuning parameter alpha, and each color line represented the change trajectory of each characteristic coefficient. The weight of each feature was provided by LASSO, and the coefficient weight of 11 features is shown in Figure 4C and Table 2. The radiomics heat maps for the final selected features from the MRA sequence are displayed in Figure 4D.
Classification Models Performance in the Training Group and the Validation Group
The machine learning (ML) classifiers used in this study are LR and SVM. For each classifier, MRA images were constructed based on their selected imaging features. Table 3 summarizes the results of the ML-based MRA radiomics analysis for discriminating true microaneurysms findings in the training and validation groups. Compared to the SVM model, the LR classifier achieved a satisfying performance. The AUC of LR model for diagnose microaneurysm accuracy ranged from 0.78 to 0.97 in the validation group compared with 0.42 to 0.86 based on SVM model (AUC: 0.875 vs 0.641, respectively, p = 0.02). The ROC curves between SVM and LR are shown in Figure 5.
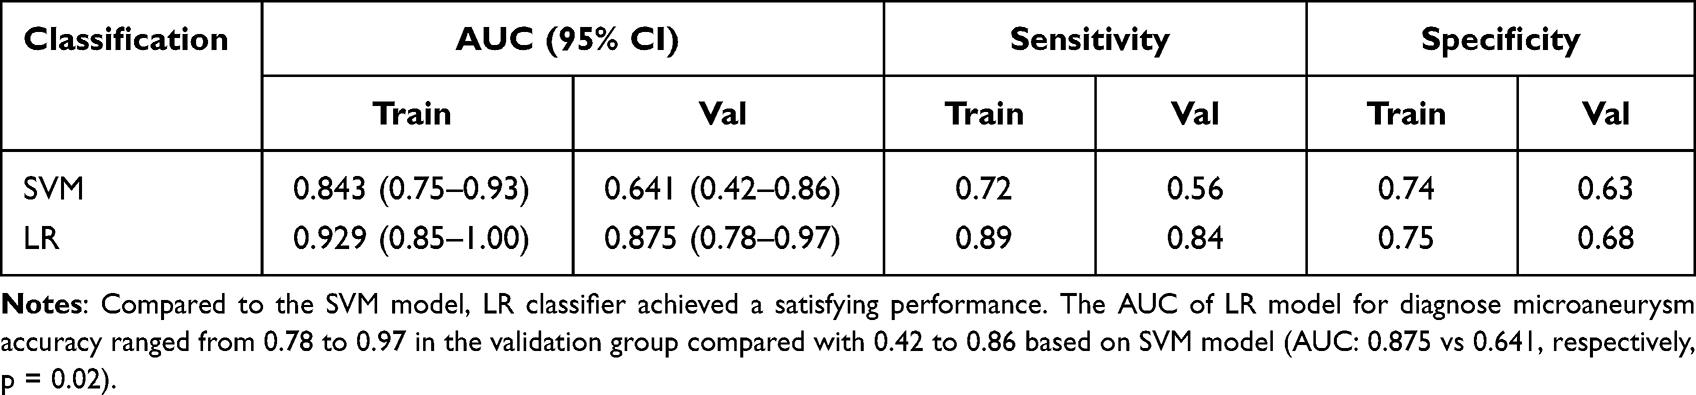 |
Table 3 Performance of the SVM and LR Classifiers for the Differential Diagnosis of Microaneurysms |
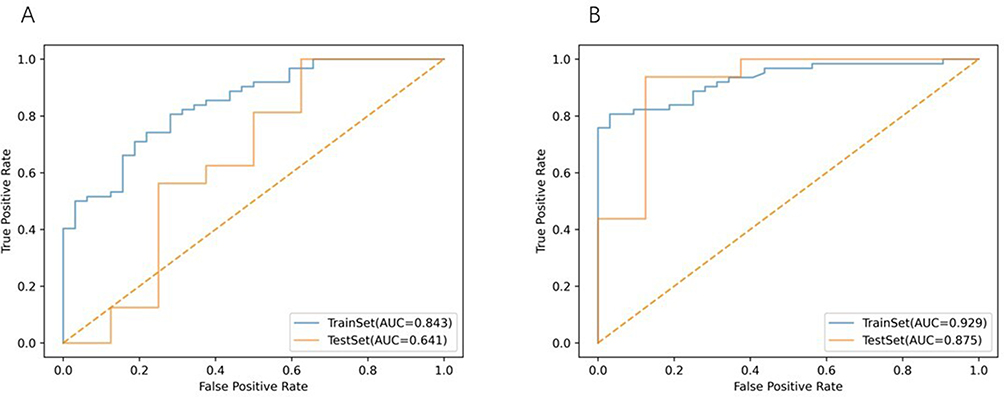 |
Figure 5 ROC curves. (A) ROC curves based on SVM; (B) ROC curves based on LR. |
Correlations Between Radiomics Features and Clinical Risk Factors
The logistic regression model was constructed based on the age and Rad-score, after which these two factors from the logistic regression model were integrated into the radiomics nomogram. (Figure 6A). The calibration curves for radiomics nomogram are shown in Figure 6B and C. Hosmer-Leme show tests indicating good agreement between predicted probability and actual occurrence in both the training and validation groups. The decision curve (Figure 6D and E) analysis showed that the radiomics nomogram (M3) had a higher overall net benefit in differentiating true microaneurysm from pseudo microaneurysm than the clinical model (M1) and the radiomics signature (M2) across the majority of the range of reasonable threshold probabilities. There were significant differences among the clinical, radiomics and nomograms models in validation group (P = 0.025 and 0.014 for M1 vs M2 and M1 vs M3, respectively).
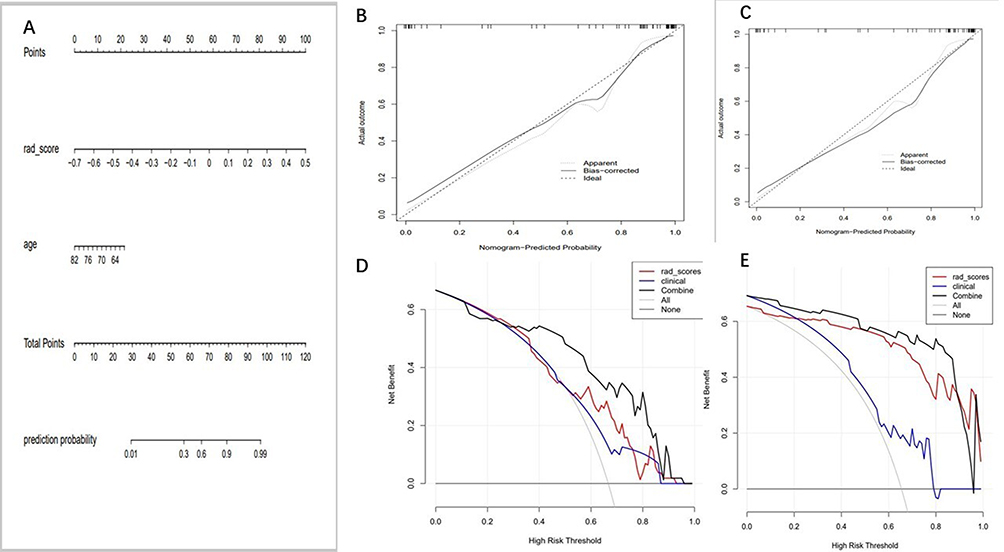 |
Figure 6 The radiomics nomogram and calibration curves for the radiomics nomogram. (A)The radiomics nomogram, combining age and Rad-score, developed in the training group. Calibration curves for the radiomics nomogram between training group (B) and validation group (C). Decision curve for the nomogram in the training (D) and validation group (E). |
Diagnostic Performance Compared with Radiologists
In the validation group, the M1, M2 and M3 were used to compare with one radiologists with 3 years of experience. The radiologists’ diagnostic performance is listed in Table 4. The radiomics model was better than the simple clinical model (p = 0.014), and the nomogram model was better than the single clinical model (p = 0.025), too. There was no significant difference between the radiomics model and the radiomics nomogram model in differentiating true and pseudomicroaneurysms (p = 0.33). However, the AUC of the nomogram model and the radiomics nomogram model was 0.875 and 0.913, respectively.
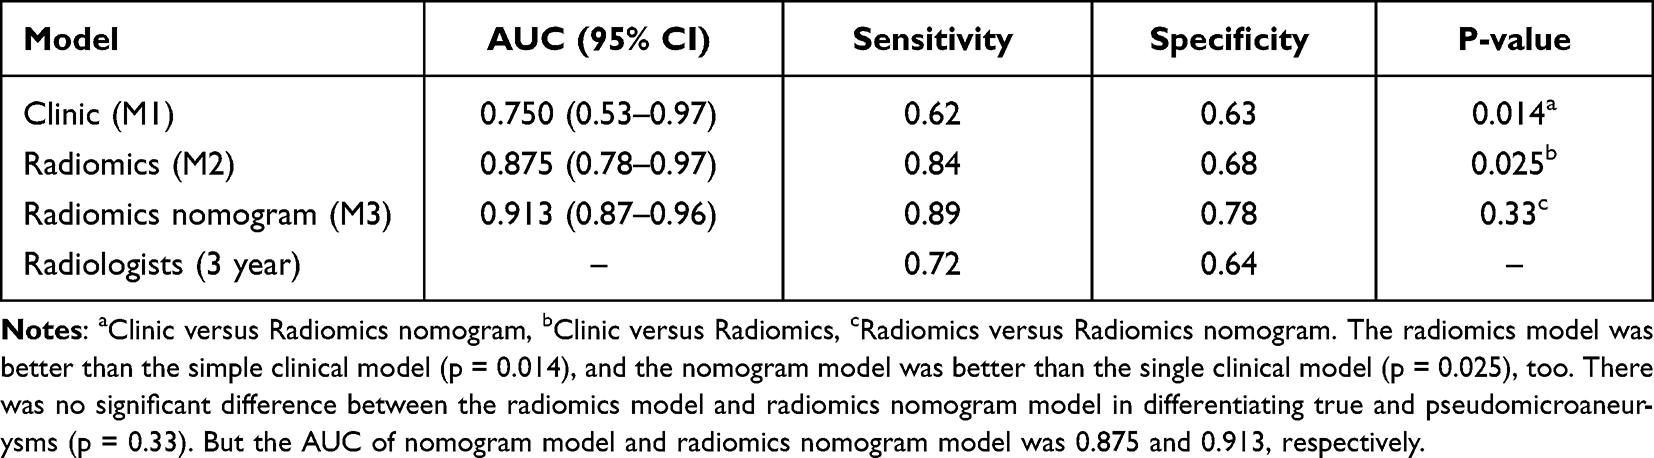 |
Table 4 Diagnostic Performance of Models and Radiologists in Validation Group |
Discussion
In this study, the MRA images of 40 cases of true microaneurysms and 78 cases of pseudo microaneurysms confirmed by DSA results were collected. The features were extracted from the images. The LASSO method was used to select and reduce the dimensions of 1409 image omics feature groups, and three groups of models were constructed. The first is to use a logistic regression classifier to build the rad score model, and the second is to build the clinical model. The third is to construct a radiomics nomogram model which combines the clinical risk factors and radiomics signature. AUC was used to evaluate the classification performance of the three models: clinical model, radiomics model and radiomics nomogram model. The results showed that the model constructed by the features extracted from the radiomics was better than the simple clinical model (p = 0.014), and the nomogram model (combining the radiomics signature and clinical risk factors) was better than the single clinical model (p = 0.025). However, there was no significant difference between the radiomics model (AUC = 0.875) and nomogram model (AUC = 0.913) in differentiating true and pseudo microaneurysms (p = 0.33) when we compared with AUC of the two groups, but the decision curve analysis demonstrated significantly better net benefit in the radiomics nomogram model than the radiomics model, which indicated that radiomics nomogram model was more effectively in differentiating pseudo microaneurysms and complicated true microaneurysms than radiomics model, so it has better clinical practicability in identifying patients with true microaneurysms.
The sensitivity of TOR-MRA in detecting aneurysms is considered to be related to the size of aneurysms. Some studies have shown that for intracranial aneurysms with a diameter greater than 3 mm, the sensitivity can reach 89.0%7 under the interpretation of experienced doctors, while for aneurysms with a diameter less than 3 mm, the sensitivity of MRA is only 74.1%.8 Imaging omics is a new analytical technique, which has been applied to the detection, risk management and treatment planning of intracranial aneurysms. At present, a number of experiments have shown that the model constructed by imaging omics can successfully automatically segment cystic aneurysms and peripheral vessels in DSA images,9 which can significantly improve the prediction performance of aneurysm rupture.10 At the same time, the imaging omics features based on HR-MRI can be used to establish an imaging omics model reliably that can effectively distinguish DA (Dissecting Aneurysm) from complex SA (Saccular Aneurysm).11
There are some deficiencies in this study. First of all, fewer experimental cases were enrolled. And these cases are all from the same equipment, so there is a certain sampling error. Second, we only evaluated the performance of radiologic features in microaneurysms, which may lead to poor recognition ability of radiologic features compared with semantic features. Future studies should evaluate whether peritumoral radiomics should be added to further improve diagnostic performance. Thirdly, with regard to clinical factors, only age and gender were included. The past disease history of patients (such as hypertension, diabetes, hyperlipidemia, coronary heart disease, smoking and drinking history, etc.) should be included in future studies to increase the identification performance of the model.
In this study, TOF-MRA images were used as the basic input information, DSA results were used as the gold standard for the existence of aneurysms, and image omics technology was used as a new auxiliary analysis method to carry out standardized in-depth mining and dynamic quantitative analysis of image features of intracranial microaneurysms. The predictive effects of radiomics model, radiomics nomogram model and clinical model were established and compared. The results showed that radiomics (AUC = 0.875) and radiomics nomogram model (AUC = 0.913) had good clinical practicability in differentiating true microaneurysms, and radiomics nomogram model was more effective compared with the radiomics model. By providing a second assessment of the images, our model could not only help radiologists to detect intracranial microaneurysms but also help clinicians formulate treatment strategies for patients, thereby prolonging their survival time.
Ethics Approval and Consent to Participate
The study was approved by the Institutional Ethical Committee of Jiangning Hospital Affiliated to Nanjing Medical University, and the patient gave written informed consent prior to obtaining the data. The study complied with the Declaration of Helsinki.
Consent for Publication
Written informed consent for publication was obtained from all participants.
Acknowledgments
The authors would like to express their heartfelt thanks to their mentor for his unconditional trust and support.
Disclosure
The authors declare no conflicts of interest in this work.
References
1. Vlak MH, Algra A, Brandenburg R, Rinkel GJ. Prevalence of unruptured intracranial aneurysms, with emphasis on sex, age, comorbidity, country, and time period: a systematic review and meta-analysis. Lancet Neurol. 2011;10(7):626–636.
2. Yasargil MG, Fox JL. The microsurgical approach to intracranial aneurysms. Surg Neurol. 1975;3(1):7–14.
3. Li J, Su L, Ma J, Kang P, Ma L, Ma L. Endovascular coiling versus microsurgical clipping for patients with ruptured very small intracranial aneurysms: management strategies and clinical outcomes of 162 cases. World Neurosurg. 2017;99:763–769. doi:10.1016/j.wneu.2015.11.079
4. Anokwute MC, Braca JA, Bohnstedt B, et al. Endovascular treatment of ruptured tiny (≤3mm) intracranial aneurysms in the setting of subarachnoid hemorrhage: a case series of 20 patients and literature review. J Clin Neurosci. 2017;40:52–56. doi:10.1016/j.jocn.2017.01.011
5. Weir B, Disney L, Karrison T. Sizes of ruptured and unruptured aneurysms in relation to their sites and the ages of patients. J Neurosurg. 2002;96(1):64–70. doi:10.3171/jns.2002.96.1.0064
6. Gupta V, Chugh M, Jha AN, Walia BS, Vaishya S. Coil embolization of very small (2 mm or smaller) berry aneurysms: feasibility and technical issues. AJNR Am J Neuroradiol. 2009;30(2):308–314. doi:10.3174/ajnr.A1374
7. Li MH, Cheng YS, Li YD, et al. Large-cohort comparison between three-dimensional time-of-flight magnetic resonance and rotational digital subtraction angiographies in intracranial aneurysm detection. Stroke. 2009;40(9):3127–3129. doi:10.1161/STROKEAHA.109.553800
8. Mine B, Pezzullo M, Roque G, David P, Metens T, Lubicz B. Detection and characterization of unruptured intracranial aneurysms: comparison of 3T MRA and DSA. J Neuroradiol. 2015;42(3):162–168. doi:10.1016/j.neurad.2014.08.002
9. Podgorsak AR, Rava RA, Shiraz Bhurwani MM, et al. Automatic radiomic feature extraction using deep learning for angiographic parametric imaging of intracranial aneurysms. J Neurointerv Surg. 2020;12(4):417–421. doi:10.1136/neurintsurg-2019-015214
10. Ou C, Chong W, Duan CZ, Zhang X, Morgan M, Qian Y. A preliminary investigation of radiomics differences between ruptured and unruptured intracranial aneurysms. Eur Radiol. 2021;31(5):2716–2725. doi:10.1007/s00330-020-07325-3
11. Cao X, Xia W, Tang Y, et al. Radiomic model for distinguishing dissecting aneurysms from complicated saccular aneurysms on high-resolution magnetic resonance imaging. J Stroke Cerebrovasc Dis. 2020;29(12):105268. doi:10.1016/j.jstrokecerebrovasdis.2020.105268
 © 2023 The Author(s). This work is published and licensed by Dove Medical Press Limited. The full terms of this license are available at https://www.dovepress.com/terms.php and incorporate the Creative Commons Attribution - Non Commercial (unported, v3.0) License.
By accessing the work you hereby accept the Terms. Non-commercial uses of the work are permitted without any further permission from Dove Medical Press Limited, provided the work is properly attributed. For permission for commercial use of this work, please see paragraphs 4.2 and 5 of our Terms.
© 2023 The Author(s). This work is published and licensed by Dove Medical Press Limited. The full terms of this license are available at https://www.dovepress.com/terms.php and incorporate the Creative Commons Attribution - Non Commercial (unported, v3.0) License.
By accessing the work you hereby accept the Terms. Non-commercial uses of the work are permitted without any further permission from Dove Medical Press Limited, provided the work is properly attributed. For permission for commercial use of this work, please see paragraphs 4.2 and 5 of our Terms.