")
Back to Journals » Cancer Management and Research » Volume 11
Radiomic signature: a non-invasive biomarker for discriminating invasive and non-invasive cases of lung adenocarcinoma
Authors Yang B, Guo L , Lu G, Shan W, Duan L, Duan S
Received 31 May 2019
Accepted for publication 30 July 2019
Published 19 August 2019 Volume 2019:11 Pages 7825—7834
DOI https://doi.org/10.2147/CMAR.S217887
Checked for plagiarism Yes
Review by Single anonymous peer review
Peer reviewer comments 2
Editor who approved publication: Professor Bilikere Dwarakanath
Bin Yang,1,* Lili Guo,2,* Guangming Lu,1,* Wenli Shan,2 Lizhen Duan,2 Shaofeng Duan3
1Department of Medical Imaging, Jinling Hospital, Medical School of Nanjing University, Nanjing 210002, People’s Republic of China; 2Department of Radiology, The Affiliated Huaian No.1 People’s Hospital of Nanjing Medical University, Huai’an 223300, People’s Republic of China; 3GE Healthcare China, Shanghai 210000, People’s Republic of China
Correspondence: Lili Guo
Department of Radiology, The Affiliated Huaian No.1 People’s Hospital of Nanjing Medical University, Huai’an 223300, People’s Republic of China
Email [email protected]
Guangming Lu
Department of Medical Imaging, Jinling Hospital, Medical School of Nanjing University, Nanjing 210002, People’s Republic of China
Tel +86 13 95 160 8346
Fax +86 2 58 480 4659
Email [email protected]
*These authors contributed equally to this work
Purpose: We aimed to assess the classification performance of a computed tomography (CT)-based radiomic signature for discriminating invasive and non-invasive lung adenocarcinoma.
Patients and Methods: A total of 192 patients (training cohort, n=116; validation cohort, n=76) with pathologically confirmed lung adenocarcinoma were retrospectively enrolled in the present study. Radiomic features were extracted from preoperative unenhanced chest CT images to build a radiomic signature. Predictive performance of the radiomic signature were evaluated using an intra-cross validation cohort. Diagnostic performance of the radiomic signature was assessed via receiver operating characteristic (ROC) analysis.
Results: The radiomic signature consisted of 14 selected features and demonstrated good discrimination performance between invasive and non-invasive adenocarcinoma. The area under the ROC curve (AUC) for the training cohort was 0.83 (sensitivity, 0.84 ; specificity, 0.78; accuracy, 0.82), while that for the validation cohort was 0.77 (sensitivity, 0.94; specificity, 0.52 ; accuracy, 0.82).
Conclusion: The CT-based radiomic signature exhibited good classification performance for discriminating invasive and non-invasive lung adenocarcinoma, and may represent a valuable biomarker for determining therapeutic strategies in this patient population.
Keywords: lung adenocarcinoma, radiomics, biomarker, computed tomography
Introduction
Adenocarcinoma is the most common pathological type of lung cancer, and epidemiological studies have reported that adenocarcinoma accounts for approximately 40% of lung cancer cases.1,2 Adenocarcinoma is also the most common type of lung cancer among non-smokers, with a high incidence in women and younger patients.3,4 Subtypes of adenocarcinoma differ according to pathology, biology, imaging, and clinical manifestations. In 2011, the International Association for the Study of Lung Cancer/American Thoracic Society/European Respiratory Society (IASLC/ATS/ERS) proposed a new international classification of lung adenocarcinoma follow:5,6 (a) pre-invasive lesions, including atypical adenomatous hyperplasia (AAH) and adenocarcinoma in situ (AIS); (b) minimally invasive adenocarcinoma (MIA); (c) invasive adenocarcinoma(IAC), which is classified as lepidic predominant adenocarcinoma (LPA), acinar predominant adenocarcinoma(APA),papillary predominant adenocarcinoma (PPA), micropapillary predominant adenocarcinoma (MPA), or solid predominant adenocarcinoma (SPA). AAH refers to a localized, proliferative lesion of the lung with a diameter <5 mm. AIS refers to a localized adenocarcinoma with a diameter of ≤30 mm in the lung. The tumor cells grow along the alveolar wall without pulmonary interstitial, vascular, or pleural infiltration. The prognosis of AIS is good, and the 5-year disease-free survival rate after complete resection can reach 100%.7 MIA is based on AIS with a diameter ≤3 cm and the presence of infiltrating lesions with a diameter ≤5 mm.
There is a significant difference in the prognosis of adenocarcinoma among subtypes. While patients with LPA often experience good prognosis, MPA and SPA are strongly invasive, prone to early metastasis, and are associated with poor prognosis. When compared with other subtypes, the 5-year survival rate for patients with MPA is only 40%, while that for patients with non-micropapillary predominant adenocarcinoma is 81%. Some studies have reported different 3- and 5-year survival rates8–11 for different pathological subtypes of lung adenocarcinoma. The 5-year disease-free survival rate for patients with AIS and MIA is 100%, which is significantly higher than that for IAC. Due to their good prognosis, AIS and MIA are considered low-grade malignant tumors.12 However, since most patients with lung cancer exhibit middle- or late-stage disease at the initial visit, early detection, early diagnosis, and correct staging play an extremely important role in improving their survival rate.Therefore, non-invasive, preoperative differentiation of preinvasive adenocarcinoma or MIA from IAC is essential in guiding the clinical management of these patients.13
The new classification system places special emphasis on the value of thin-layer computed tomography (CT) in the diagnosis of lung adenocarcinoma. In recent years, more early occult lung cancers such as AIS and MIA have been discovered, due to the extensive development of thin-layer CT screening for lung cancer. Quantitative volume histogram analysis of non-solid nodules and partially solid nodules based on CT is considered effective for identifying AAH, AIS, MIA, and invasive adenocarcinoma. However, the imaging performance for AAH, AIS, and MIA overlaps. While AAH is characterized by single or multiple densities due to purely ground glass-like lesions (diameter <5 mm) on CT, imaging findings for AIS, MIA, or invasive lung adenocarcinoma can be expressed as ground glass-like, partially solid, or solid nodules. Therefore, the quantitative CT parameters are not entirely appropriate for differentiating non-invasive from invasive lung adenocarcinoma.
Radiomics refers to the extraction of high-throughput quantitative imaging features from CT images,14 wherein statistical and/or machine learning methods are used to select the most valuable features to combine with clinical information for the diagnosis and management of various diseases.15–18 At present, radiomic research regarding different tumor types is rapidly expanding, and several studies have indicated that such methods may be particularly advantageous in patients with lung tumors.19,20 In the present study, we aimed to determine whether a CT-based radiomic signature could be used as a biomarker in the differentiation of invasive lung adenocarcinoma and non-invasive lung adenocarcinoma.
Patients and methods
Patients
The institutional review board of Huai’an First People’s Hospital approved this retrospective study and waived the requirement for informed consent, due to the nature of the study. We abide by patient data confidentiality and compliance with the declaration of Helsinki. All images were anonymized prior to inclusion to avoid personal information misuse. Data were collected from 192 consecutive patients with subsequent histologic confirmation of lung adenocarcinoma at Huai’an First People’s Hospital between January 2015 and July 2018. Inclusion criteria were as follows: histologically confirmed incident pulmonary lesion with complete chest CT imaging data. Patients who had received radiotherapy and chemotherapy were excluded, as were those with poor image quality and lung metastases. According to pathological results (including AAH, AIS, MIA, IAC), AAH, AIS, and MIA were regarded as non-invasive lesions. Patients were divided into a non-IAC group (n=59; 31%) and IAC (n=133; 69%).
Radiomic method
The radiomic method included the following steps (Figure 1).
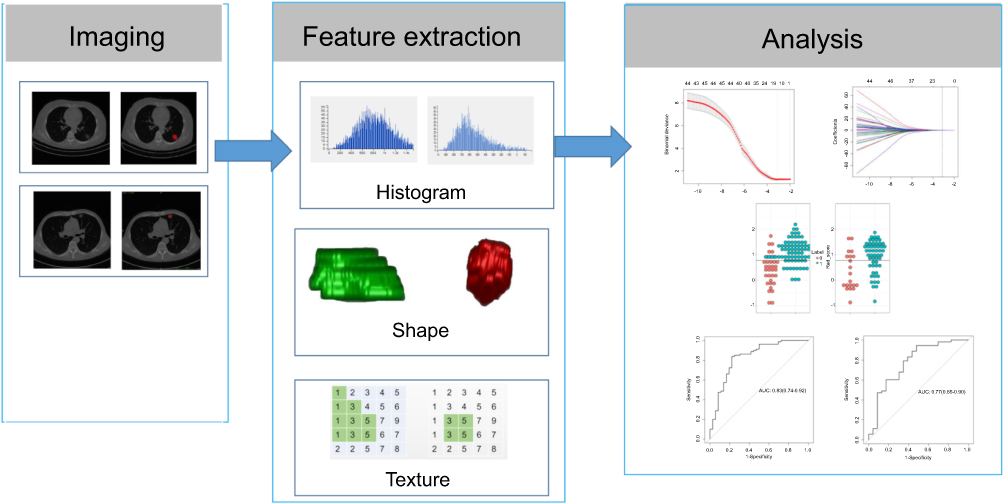 |
Figure 1 Radiomic method. Original images from patients with non-small-cell lung cancer. Experienced radiologists segmented the tumor region of interest (ROI) on all computed tomography slices to extract the radiomic features. Features such as tumor shape, intensity, and texture features were extracted from the ROI to discriminate invasive lung adenocarcinoma from non-invasive lung adenocarcinoma.Abbreviations: AUC, the area under the ROC curve; ROC, receiver operating characteristic. |
Image acquisition
Imaging was performed using a 64-detector row dual-source CT scanner (SIEMENS SOMATOM Definition Flash, Germany) with the following parameters: acquisition field-of-view (FOV): 500 mm; beam pitch: 1.35 or 1.375; matrix: 512 x 512; gantry speed: 0.6 seconds per rotation; tube voltage: 100 kV. The scanning areas ranged from the apex to the bottom of the lung under Care Dose 4D mode. The currents of the tube were automatically adjusted. The section thickness for each transverse image was 5 mm. Additional sagittal and coronal images were then reconstructed.
Segmentation
Two experienced radiologists (Radiologist 1, 10 years of experience, Radiologist 2, 5 years of experience) manually drew the ROIs on the CT images using ITK-SNAP
Software vesion 3.6.0 (www.itksnap.org). Radiologist 1 drew the ROIs twice in a 1-week period, while Radiologist 2 drew the ROIs only once. Each ROI was also examined by two clinical students.
Extraction and selection of radiomic features
The histogram, texture, and geometric features of ROIs from three sources (two from Radiologist 1, one from Radiologist 2) were extracted using A.K. software (AnalysisKit, GE Healthcare). Inter-observer and intra-observer agreement were examined in order to select features with low sensitivity to ROI segmentation, following which the features based on segmentation by Radiologist 1 were used for subsequent analyses. The feature sets were divided into a training set and a test set according to a ratio of 6:4. The training set was used to select features and build the diagnostic model, while the test set was used to validate the model. Two feature selection methods were adopted here, spearman correlation test and the least absolute shrinkage and selection operator (LASSO) method, which is suitable for regression of high-dimensional data. The spearman correlation test filtered the redundant features with correlation coefficient larger than 0.75. LASSO was used to obtain the most useful predictive features and build the radiomic signature. In LASSO, a 10-fold cross-validation was performed to choose the optimal hyperparameter λ with binomial deviance as criterion (The smaller, the better). The radiomic signature (Rad-score) was calculated based on the sum of selected features weighted by their corresponding coefficients.The 10-fold cross-validation in training cohort were also performed to evaluate the performance and reliability of our model.
Statistical analysis
R software (version3.5.0, www.Rproject.org) was used for statistical analyses. Differences in clinical characteristics between the IAC and non-IAC groups were examined using Student’s t-tests for continuous variables and Fisher’s exact tests for categorical variables. The level of statistical significance was set at P<0.05. Intraclass correlation coefficients (ICCs) were calculated to determine inter-observer and intra-observer agreement and features with ICC values >0.75 were retained. LASSO methods were performed using the “glmnet” package, ROC analyses were performed using “pROC”,while Calibration curve and Hosmer-Lemeshow test were conducted using “ModelGood” and “DescTools” repsectively. Finally, decision curve analysis was conducted using “rmda” package to determine the clinical usefulness of radiomic signature.
Results
Clinical data
The present retrospective analysis included 192 patients (male: 103, female: 89; age range: 34–79 years; average age: 56.5±22.5 years). There were no significant differences in age or sex between the IAC and non-IAC groups (P>0.05) (Table 1).
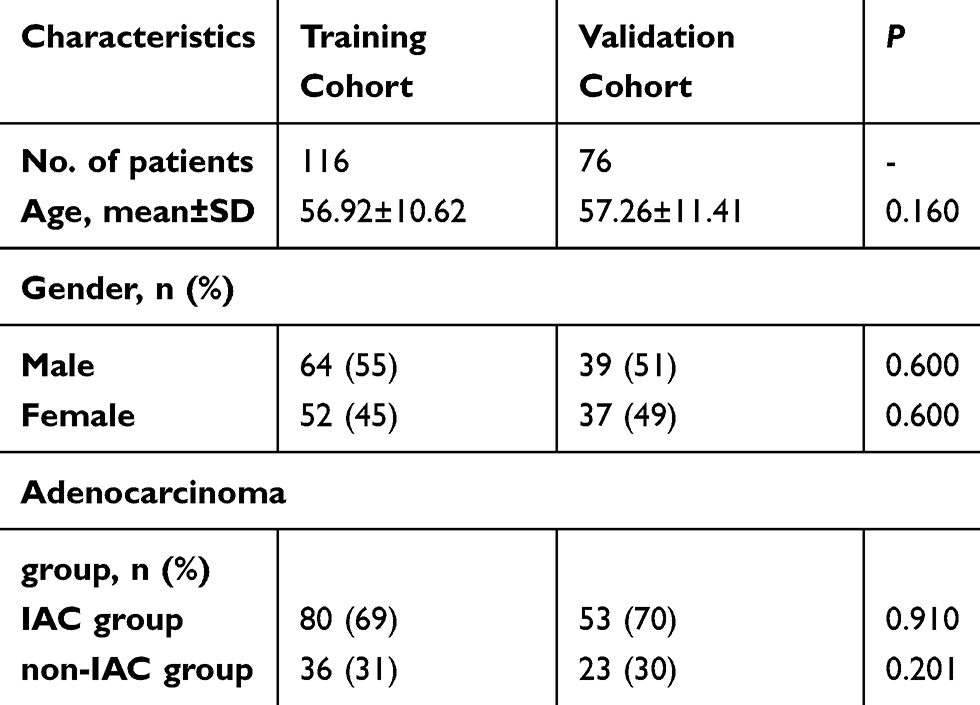 |
Table 1 Analysis of patients in the training and validation cohorts |
Feature extraction and selection
In total, 396 radiomic features were extracted from the ROIs. In intra-observer and inter-observer agreement test, all features’ ICCs were larger than 0.75 so that no feature was eliminated. The LASSO algorithm and 10-fold cross-validation were used to consolidate all features into 14 potential predictors based on 116 patients in the training cohort, which were implemented to develop the LASSO regression model (Figure 2A and B). The features used in the model and a description of the rad-score calculation are presented in Figure 3A and B.
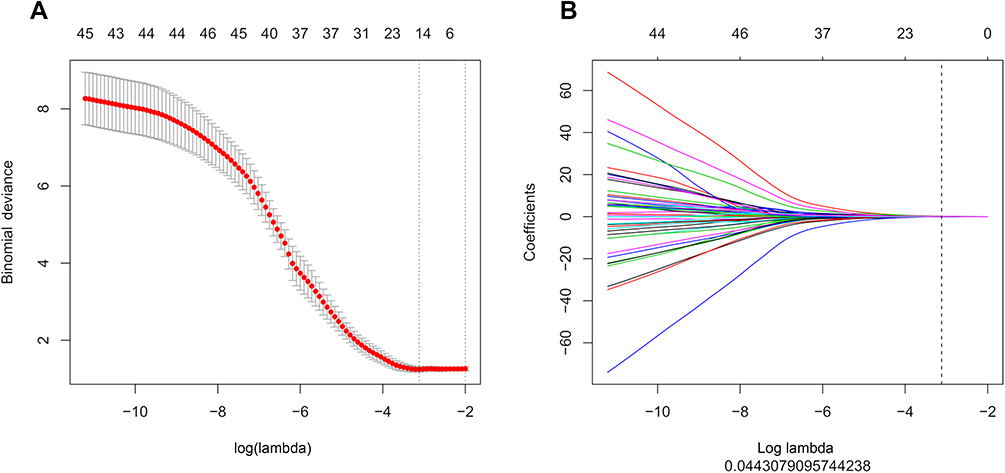 |
Figure 2 (A and B) The least absolute shrinkage and selection operator (LASSO) binary logistic regression model for feature selection. The features retained in the previous step were introduced into the LASSO regression model. First, a 10-fold cross-validation method was used to screen the LASSO regression model hyperparameter (λ) and select the model with the smallest error (λ). The retention (not equal to 0) was used to calculate the rad-score, which represents the sum of the product of the feature and the corresponding coefficient. Receiver operating characteristic analysis was used to discriminate the ability of the rad-score to identify invasive and non-invasive adenocarcinoma in the training and validation sets. |
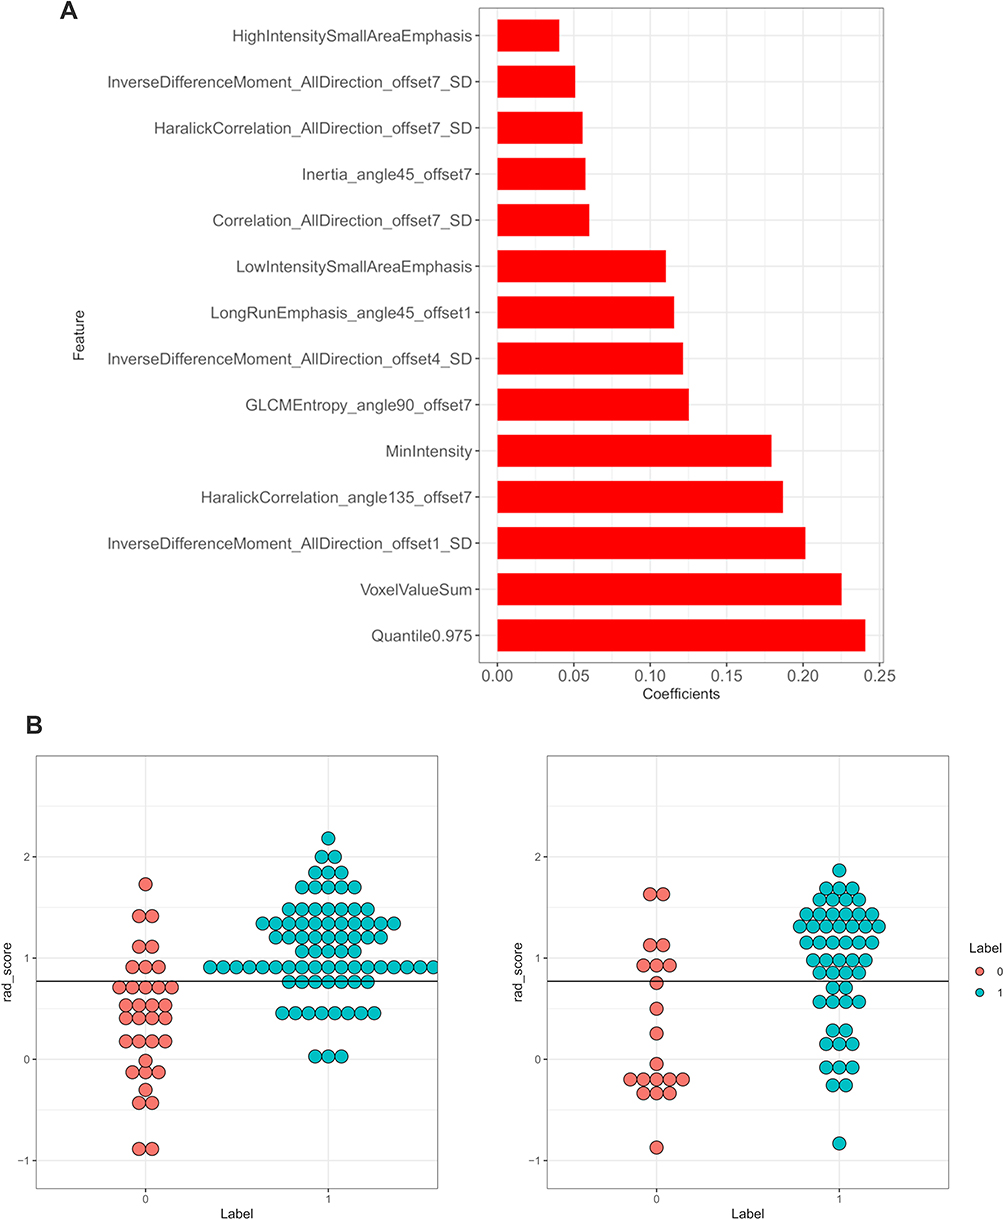 |
Figure 3 (A and B) Features used in the model and a description of the rad-score calculation. The least absolute shrinkage and selection operator (LASSO) logistic regression analysis identified 14 suitable radiomic features for building the prediction model (A). On the left is the training cohort, on the right is the validation cohort, and red and blue represent the real group. The middle black line represents the cut-off value. If the black line can separate the red point from the blue point, it means that the model identification ability is better (B). |
Development of the prediction model and ROC curve analysis
Our LASSO regression analysis identified 14 suitable radiomic features for building the prediction model for the preoperative discrimination of IAC and non-IAC in the training cohort (n=116).These features included MinIntensity, Quantile0.975, VoxelValueSum, Correlation_AllDirection_offset7_SD,GLCMEntropy_angle90_offset7,HaralickCorrelation_AllDirection_offset7_SD,HaralickCorrelation_angle135_offset7 (P=0.690),Inertia_angle45_offset7,InverseDifferenceMoment_AllDirection_offset1_SD,InverseDifferenceMoment_AllDirection_offset4_SD,InverseDifferenceMoment_AllDirection_offset7_SD,LongRunEmphasis_angle45_offset1,HighIntensitySmallAreaEmphasis(P=0.748),LowIntensitySmallAreaEmphasis (Figure 3A, Table 2). To validate the discrimination ability of the model, we also used a validation cohort consisting of 76 patients. In addition, we simultaneously calculated and compared the sensitivity, specificity, positive predictive value, negative predictive value, and accuracy of the radiomic and clinical factor (Mean CT value) (Table 3).
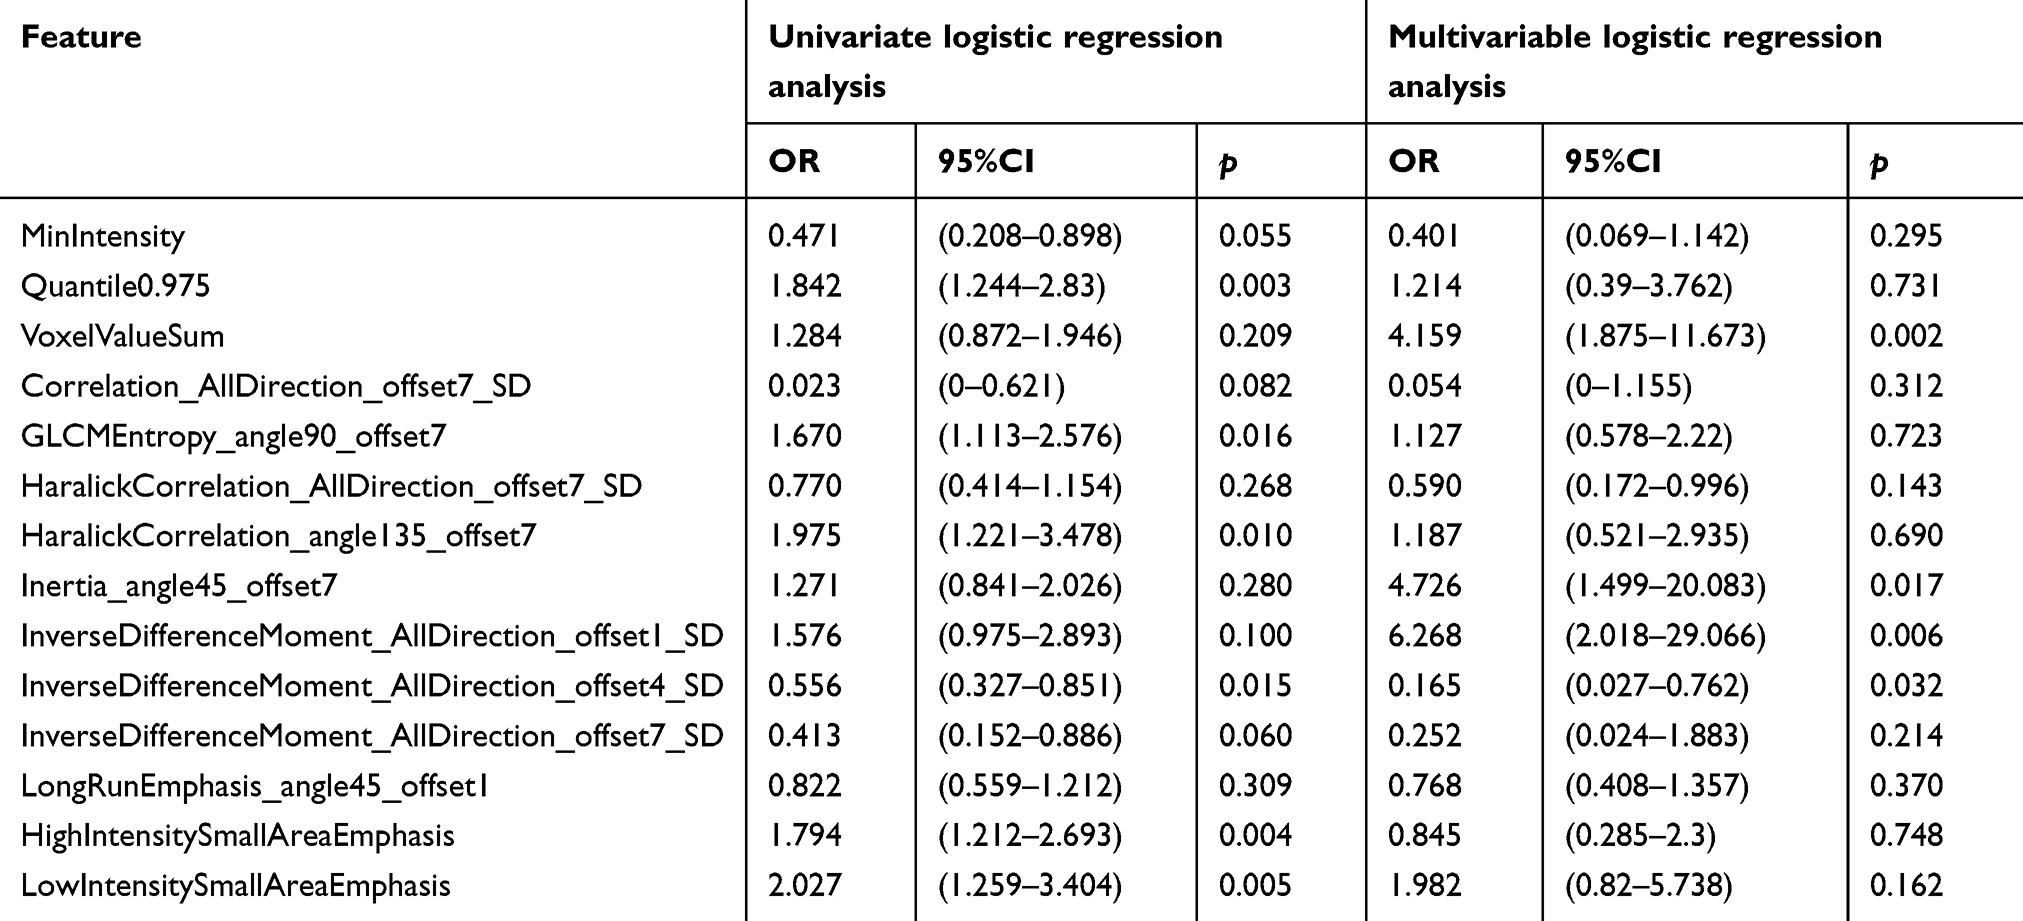 |
Table 2 Univariate logistic regression analysis and multivariable logistic regression analysis of 14 selected features |
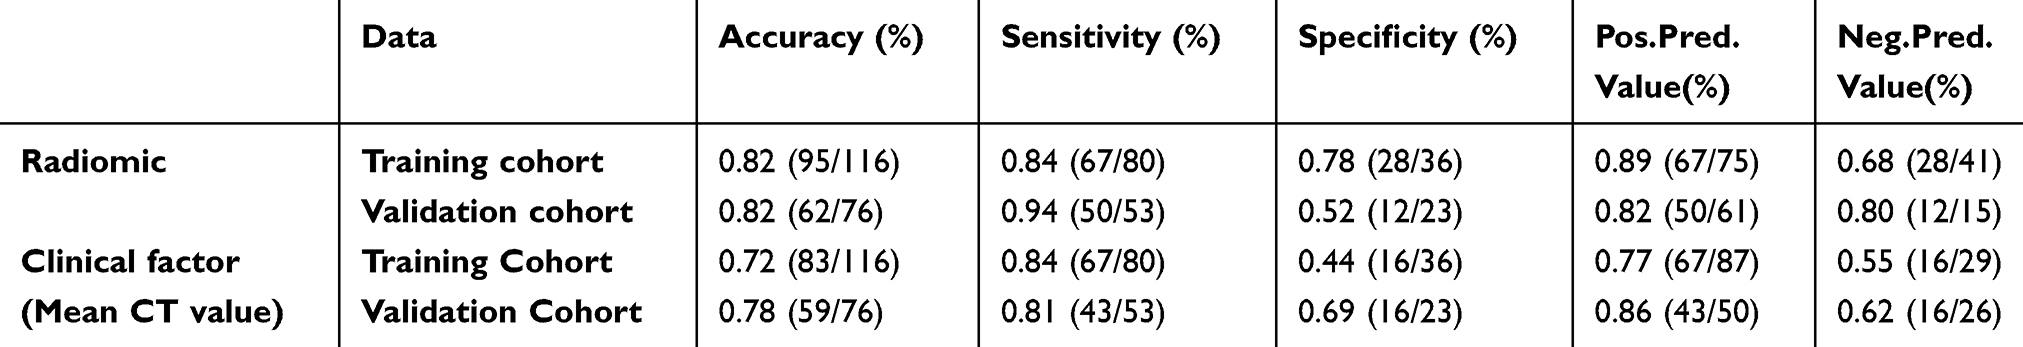 |
Table 3 Diagnostic accuracy in the training and validation cohorts |
Validation of the radiomic signature
The ROC curves showed the good performance and generalization for the model built by 14 radiomics features. AUC for radiomics model was 0.83 in the training cohort and 0.77 in the validation cohort, which was shown the good classification performance for discriminating invasive and non-invasive lung adenocarcinoma (Figure 4A and B).The calibration curves demonstrated the IAC probabilities had a good agreement between the prediction and observation in both training cohort and validation cohort (Figure 5A and B). Meanwhile, the Hosmer-Lemeshow test found radiomic model was close to perfect fit due to no-significant statistics (P=0.56 in training cohort, P=0.07 in validation cohort).
 |
Figure 4 (A and B) Receiver operating characteristic (ROC) curves for the training and validation cohorts. Radiomic features had the potential ability to predict the preoperative discrimination of invasive and non-invasive lung adenocarcinoma. (The area under the ROC curve [AUC] for the training cohort was 0.83. The AUC for the validation cohort was 0.77). |
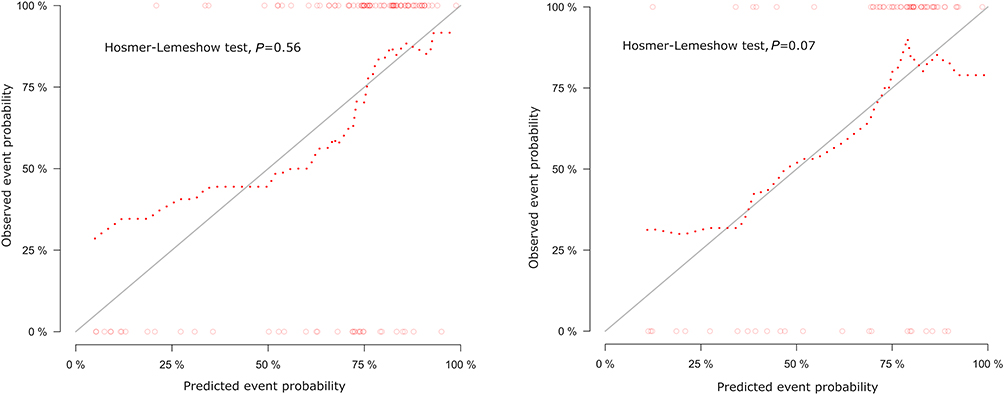 |
Figure 5 Calibration curves of radiomics model in training cohort (A) and validation cohort (B). Calibration curve evaluated the correspondence between the predicted probabilities and observed probabilities. The closer the dot line to the grey solid line, the better prediction of the model was. Besides, according to Hosmer-Lemeshow test, the predicted probabilities have no significantly difference with observed probabilities with p>0.05. |
Decision curve analysis for radiomic signature
To determine the clinical usefulness of radiomic signature, decision curve analysis was performed. As shown in Figure 6, the radiomic signature has higher standard net benefit at the threshold from 0.1 to 0.9 than the all positive prediction and all negative prediction.(Figure 6)
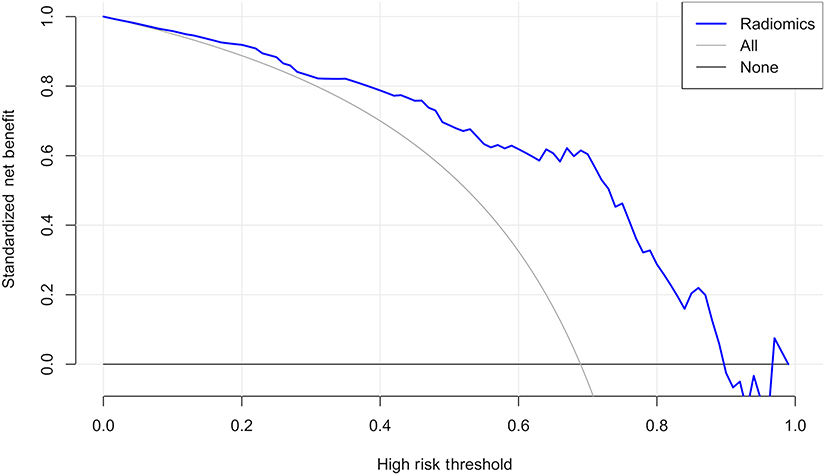 |
Figure 6 Decision curve analysis for radiomic signature. The radiomic signature has higher standard net benefit at the threshold from 0.1 to 0.9 than the all positive prediction (Line Labeled All) and all negative prediction (Line labeled None). |
Discussion
In the present study, we extracted radiomic features from CT images in order to establish a radiomics model for classifying IAC and non-IAC. In order to improve the generalization ability and optimize the model, we used the LASSO method in conjunction with 10-fold cross-validation to build the regression model. Our findings indicated that this method can be used to effectively distinguish between invasive and non-invasive lung adenocarcinoma. The AUC for the training cohort was 0.83, while that for the validation cohort was 0.77.The sensitivity, specificity, and accuracy of radiomics are higher than the clinical factor (Mean CT value).
Nodular morphological features and mean CT values are the most common parameters used for differential diagnosis in clinical practice. However, we did not analyze morphological nodule features such as lobulated, spiculate, or pleural indentation signs, mainly because the morphological features of early-stage lung cancer are usually atypical. Moreover, the imaging manifestations of AAH, AIS, and MIA may overlap. Furthermore, identification of the morphological signs of nodules may depend on the radiologist’s experience and ability to recognize these signs, which renders the differential diagnosis of pathological subtypes of adenocarcinoma more difficult.21–23
Some studies24,25 have suggested that quantitative imaging data can be used to identify the pathological invasiveness of lung adenocarcinoma. The most commonly used quantitative imaging parameters are the mean CT value and CT histogram. The cut-off mean CT values differ based on the pathological subtype of adenocarcinoma.26 Quantitative volume histogram analysis based on CT density is considered effective for identifying AAH, AIS, MIA, and significantly invasive adenocarcinoma. The presence of non-solid nodules identified via subjective visual assessments of CT images suggests that increased mass (mean volume multiplied by density) may help to confirm early invasiveness/growth, in which increases in the extent of solid components correspond to the progression of local malignant infiltration. Nomori et al27 analyzed the histogram of CT pixels, reporting that the CT number-based histographic pattern can be used to distinguish between atypical adenomatous hyperplasia and bronchioloalveolar carcinoma. Son et al28 used quantitative CT parameters to distinguish between invasive adenocarcinoma and pre-invasive or microinvasive adenocarcinoma. In accordance with our findings, their results indicated that quantitative parameters can better distinguish between invasive and preinvasive/microinvasive adenocarcinoma (AUC: 0.78). However, they did not use quantitative CT parameters to measure the mean CT value of nodules because their study included patients mainly presenting with sub-solid or solid nodules, and differences between such patients may not be obvious. In addition, our study mainly investigated whether a single radiomics model exhibited good classification performance.We measured the mean CT value and found that its sensitivity, specificity, and accuracy were not as good as radiomics, which was consistent with previous literature.13
Recent advancements have highlighted the potential of radiomics in the diagnosis of lung cancer.29,30 The radiomic model is expected to provide a non-invasive method for quantifying the accuracy of diagnosing pathological subtypes of lung cancer. As different pathological subtypes of lung cancer are treated differently, such methods may allow for more precise, personalized treatment of these patients. Some previous studies have investigated the use of radiomics to predict pathological subtypes of lung adenocarcinoma. Li et al31 utilized CT texture features of pulmonary ground-glass opacity nodules to distinguish preinvasive lesions, IPA, and MIA. Their results indicated that CT texture features were associated with improved classification performance, with an AUC value up to 0.761. Chae et al32 utilized three-layered artificial neural networks (ANNs) with a back-propagation algorithm and ROC analysis to build a discrimination model based on texture features. The ANN model exhibited excellent accuracy in the differentiation of preinvasive lesions from IPA (AUC: 0.981). ANNs are useful tools for two-category problems.However, due to the complexity of the structures and parameters involved and the possible over-fitting problems that may follow, there are always barriers to the widespread use of any given model. In the present study, our model utilized 14 radiomic features to discriminate between the IAC and non-IAC groups, with an AUC of 0.77. The radiomic signature had the better discriminative performance when compared with the most commonly used clinical parameters, such as mean CT value.
This present study possesses some limitations of note, including its retrospective nature, which may have resulted in selection bias. In addition, we did not analyze the morphological features of the nodules or perform quantitative comparisons of the mean CT values of the nodules. Moreover, we did not establish a clinical model in this study. Combined such a model with the radiomic mode may improve predictive performance. Furthermore, additional studies are required for external validation of the model.
In conclusion, our findings indicated that the radiomic signature represents a non-invasive, low-cost, and repeatable method for the preoperative differentiation of IAC from non-IAC. Such findings suggest that radiomics-based methods can be used to hasten the development of personalized medicine, particularly in the treatment of patients with lung tumors.
Ethics approval and informed consent
The institutional review board of Huai’an First People’s Hospital approved this retrospective study and waived the need to obtain informed consent from the patients.
Data availability
The raw data supporting the conclusions of this manuscript will be made available by the authors, without undue reservation, to any qualified researcher.
Abbreviations
NSCLC, non-small cell lung cancer; CT, computed tomography; LASSO, least absolute shrinkage and selection operator; IAC, invasive adenocarcinoma; AAH, atypical adenomatous hyperplasia; AIS, adenocarcinoma in situ; MIA, minimally invasive adenocarcinoma; ROC, receiver operating characteristic; IASLC/ATS/ERS, International Association for the Study of Lung Cancer/American Thoracic Society/European Respiratory Society.
Acknowledgments
We thank the Department of Radiology, The Affiliated Huaian No.1 People’s Hospital of Nanjing Medical University, Huai’an for collection of the data. This project is supported by the Key Research and Development Plan of the Ministry of Science and Technology (2017YFC0113400).
Author contributions
BY conceived the idea of the study. BY, LG, WS, and LD collected the data. BY and LG performed image analysis. BY wrote the manuscript. SD performed the statistical analysis. LG and GL edited and reviewed the manuscript. All authors contributed to data analysis, drafting and revising the article, gave final approval of the version to be published, and agree to be accountable for all aspects of the work.
Disclosure
Shaofeng Duan was employed by GE Healthcare at the time when this study was conducted. The authors report no other conflicts of interest in this work.
References
1. Siegel R, Naishadham D. Cancer statistics, 2013. CA Cancer J Clin. 2013;63(1):11–30.
2. de Groot P. Lung cancer epidemiology, risk factors, and prevention. Radiol Clin North Am. 2012;50(5):863–876.
3. Gazdar AF, Thun MJ. Lung cancer: smoke exposure and sex. Clin Oncol. 2007;25(5):469–471.
4. Rudin CM, Avila-Tang E, Harris CC, et al. Lung cancer in never smokers:molecular profiles and therapeutic implications. Clin Cancer Res. 2009;15(18):5646–5661.
5. Travis WD, Brambilla E, Noguchi M, et al. International association for the study of lung cancer/american thoracic society/european respiratory society international multidisciplinary classification of lung adenocarcinoma. J Thorac Oncol. 2011;6(2):244–285.
6. Travis WD, Brambilla E, Noguchi M, et al. International association for the study of lung cancer/American thoracic society/European respiratory society: international multidisciplinary classification of lung adenocarcinoma: executive summary. Proc Am Thorac Soc. 2011;8(5):381–385.
7. Yoshizawa A, Motoi N, Riely GJ, et al. Impact of proposed IASLC/ATS/ERS classification of lung adenocarcinoma: prognostic subgroups and implications for further revision of staging based on analysis of 514 stage I cases. Mod Pathol. 2011;24(5):653–664.
8. Russell PA, Wainer Z, Wright GM, et al. Does lung adenocarcinoma subtype predict patient survival?: A clinicopathologic study based on the new international association for the study of lung cancer/American thoracic society/European respiratory society international multidisciplinary lung adenocarcinoma classification. J Thorac Oncol. 2011;6(9):1496–1504.
9. Luo J, Huang Q, Wang R, et al. Prognostic and predictive value of the novel classification of lung adenocarcinoma in patients with stage IB. J Cancer Res Clin Oncol. 2016;142(9):2031–2040.
10. Yanagawa N, Shiono S, Abiko M, et al. New IASLC/ATS/ERS classification and invasive tumor size are predictive of disease recurrence in stage I lung adenocarcinoma. J Thorac Oncol. 2013;8(5):612–618.
11. Yoshiya T, Mimae T, Tsutani Y, et al. Prognostic role of subtype classification in small-sized pathologic N0 invasive lung adenocarcinoma. Ann Thorac Surg. 2016;102(5):1668–1673.
12. Song Z, Zhu H, Guo Z, et al. Prognostic value of the IASLC/ATS/ERS classification in stage I lung adenocarcinoma patients–based on a hospital study in China. Eur J Surg Oncol. 2013;39(11):1262–1268.
13. Fan L, Fang M, Li Z, et al. Radiomics signature: a biomarker for the preoperative discrimination of lung invasive adenocarcinoma manifesting as a ground-glass nodule. Eur Radiol. 2019;29(2):889–897.
14. Dou TH, Coroller TP, van Griethuysen JJM, et al. Peritumoral radiomics features predict distant metastasis in locally advanced NSCLC. PLoS One. 2018;13(11):e0206108.
15. Kumar V, Gu Y, Basu S, et al. Radiomics: the process and the challenges. Magn Reson Imaging. 2012;30(9):1234–1248.
16. Gillies RJ, Kinahan PE. Radiomics: images are more than pictures, they are data. Radiology. 2016;278(2):563–577.
17. Lambin P, Leijenaar RTH, Deist TM, et al. Radiomics: the bridge between medical imaging and personalized medicine. Nat Rev Clin Oncol. 2017;14(12):749–762.
18. Keek SA, Leijenaar RT, Jochems A. A review on radiomics and the future of theranostics for patient selection in precision medicine. Br J Radiol. 2018;91(1091):20170926.
19. Lee G, Lee HY, Park H, et al. Radiomics and its emerging role in lung cancer research, imaging biomarkers and clinical management: state of the art. Eur J Radiol. 2017;86:297–307.
20. Nair VS, Gevaert O, Davidzon G, Plevritis SK, West R. NF-κB protein expression associates with (18)F-FDG PET tumor uptake in non-small cell lung cancer: a radiogenomics validation study to understand tumor metabolism. Lung Cancer. 2014;83(2):189–196.
21. Austin JH, Garg K, Aberle D, et al. Radiologic implications of the 2011 classification of adenocarcinoma of the lung. Radiology. 2013;266(1):62–71.
22. Song Z, Zhu H, Guo Z, et al. Prognostic value of the IASLC/ATS/ERS classification in stage I lung adenocarcinoma patients--based on a hospital study in China. Eur J Surg Oncol. 2013;39(11):1262–1268
23. Ohtaki Y, Yoshida J, Ishii G, et al. Prognostic significance of a solid component in pulmonary adenocarcinoma. Ann Thorac Surg. 2011;91(4):1051–1057.
24. Sakakura N, Inaba Y, Yatabe Y, et al. Estimation of the pathological invasive size of pulmonary adenocarcinoma using high-resolution computed tomography of the chest: a consideration based on lung and mediastinal window settings. Lung Cancer. 2016;95:51–56.
25. Saji H, Matsubayashi J, Akata S, et al. Correlation between whole tumor size and solid component size on high-resolution computed tomography in the prediction of the degree of pathologic malignancy and the prognostic outcome in primary lung adenocarcinoma. Acta Radiol. 2015;56(10):1187–1195.
26. Kitami A, Sano F, Hayashi S, et al. Correlation between histological invasiveness and the computed tomography value in pure ground-glass nodules. Surg Today. 2016;46(5):593–598.
27. Nomori H, Ohtsuka T, Naruke T. Differentiating between atypical adenomatous hyperplasia and bronchioloalveolar carcinoma using the computed tomography number histogram. Ann Thorac Surg. 2003;76(3):867–871.
28. Son JY, Lee HY, Lee KS, et al. Quantitative CT analysis of pulmonary ground-glass opacity nodules for the distinction of invasive adenocarcinoma from pre-invasive or minimally invasive adenocarcinoma. PLoS One. 2014;9(8):e104066.
29. Wu W, Parmar C, Grossmann P, et al. Exploratory study to identify radiomics classifiers for lung cancer histology. Front Oncol. 2016;6:71.
30. Haga A, Takahashi W, Aoki S, et al. Classification of early stage non-small cell lung cancers on computed tomographic images into histological types using radiomic features: interobserver delineation variability analysis. Radiol Phys Technol. 2018;11(1):27–35.
31. Li W, Wang X, Zhang Y, et al. Radiomic analysis of pulmonary ground-glass opacity nodules for distinction of preinvasive lesions, invasive pulmonary adenocarcinoma and minimally invasive adenocarcinoma based on quantitative texture analysis of CT. Chin J Cancer Res. 2018;30(4):415–424.
32. Chae HD, Park CM, Park SJ, et al. Computerized texture analysis of persistent part-solid ground-glass nodules: differentiation of preinvasive lesions from invasive pulmonary adenocarcinomas. Radiology. 2014;273(1):285–293.
 © 2019 The Author(s). This work is published and licensed by Dove Medical Press Limited. The full terms of this license are available at https://www.dovepress.com/terms.php and incorporate the Creative Commons Attribution - Non Commercial (unported, v3.0) License.
By accessing the work you hereby accept the Terms. Non-commercial uses of the work are permitted without any further permission from Dove Medical Press Limited, provided the work is properly attributed. For permission for commercial use of this work, please see paragraphs 4.2 and 5 of our Terms.
© 2019 The Author(s). This work is published and licensed by Dove Medical Press Limited. The full terms of this license are available at https://www.dovepress.com/terms.php and incorporate the Creative Commons Attribution - Non Commercial (unported, v3.0) License.
By accessing the work you hereby accept the Terms. Non-commercial uses of the work are permitted without any further permission from Dove Medical Press Limited, provided the work is properly attributed. For permission for commercial use of this work, please see paragraphs 4.2 and 5 of our Terms.