")
Back to Journals » International Journal of Nanomedicine » Volume 11
Radiolabeling, whole-body single photon emission computed tomography/computed tomography imaging, and pharmacokinetics of carbon nanohorns in mice
Authors Zhang M , Jasim D, Ménard-Moyon C, Nunes A, Iijima S, Bianco A, Yudasaka M, Kostarelos K
Received 25 December 2015
Accepted for publication 4 March 2016
Published 22 July 2016 Volume 2016:11 Pages 3317—3330
DOI https://doi.org/10.2147/IJN.S103162
Checked for plagiarism Yes
Review by Single anonymous peer review
Peer reviewer comments 3
Editor who approved publication: Dr Thomas Webster
Minfang Zhang,1,2 Dhifaf A Jasim,1 Cécilia Ménard-Moyon,3 Antonio Nunes,1 Sumio Iijima,2 Alberto Bianco,3 Masako Yudasaka,2 Kostas Kostarelos1
1Nanomedicine Laboratory, Faculty of Medical and Human Sciences and National Graphene Institute, University of Manchester, Manchester, United Kingdom; 2Institute of Advanced Science and Industrial Technology (AIST), Tsukuba, Ibaraki, Japan; 3CNRS, Institute of Molecular and Cellular Biology, Laboratory of Immunopathology and Therapeutic Chemistry, Strasbourg, France
Abstract: In this work, we report that the biodistribution and excretion of carbon nanohorns (CNHs) in mice are dependent on their size and functionalization. Small-sized CNHs (30–50 nm; S-CNHs) and large-sized CNHs (80–100 nm; L-CNHs) were chemically functionalized and radiolabeled with [111In]-diethylenetriaminepentaacetic acid and intravenously injected into mice. Their tissue distribution profiles at different time points were determined by single photon emission computed tomography/computed tomography. The results showed that the S-CNHs circulated longer in blood, while the L-CNHs accumulated faster in major organs like the liver and spleen. Small amounts of S-CNHs- and L-CNHs were excreted in urine within the first few hours postinjection, followed by excretion of smaller quantities within the next 48 hours in both urine and feces. The kinetics of excretion for S-CNHs were more rapid than for L-CNHs. Both S-CNH and L-CNH material accumulated mainly in the liver and spleen; however, S-CNH accumulation in the spleen was more prominent than in the liver.
Keywords: biodistribution, excretion, functionalization, nano-carbon, nanomedicine
Introduction
Carbon nanomaterials such as carbon nanotubes (CNTs),1–2 carbon nanohorns (CNHs),3 and graphene-related materials4,5 have attracted tremendous interest in the past decade due to their unique physicochemical properties. Carbon nanomaterials can find potential applications in various fields, including medical imaging and therapeutics.5–11 Their large available surface area, nanoscale dimensions, and possibility of multiple surface functionalization strategies make them unique materials with a lot of promise for the design of drug delivery systems.12–22 In addition, they offer high conversion efficiency of near-infrared radiation energy into heat, which enables them to be agents for photothermal therapy.22–24 Determination of the long-term fate of these carbon nanomaterials after administration into a living body is crucially important to allow the possibility for clinical translation.
To date, intensive efforts have been devoted toward assessment of safety issues related to carbon nanomaterials. In particular, several investigations aimed to evaluate the biodistribution of various functionalized CNTs and any potential adverse reaction.25–31 Some of us previously reported that the surface functionalization of multiwalled CNTs determines the tissue distribution and excretion profile after intravenous administration.29 The modifications with polyethylene glycol (PEG) or PEG-derived polymers have been reported to significantly extend blood circulation time of CNTs, reducing the risk of organ accumulation.25–26 Adequately functionalized multiwalled CNTs radiolabeled with [111In] are retained in the reticuloendothelial system organs, such as the liver and spleen, but are also rapidly cleared from systemic blood circulation through the renal excretion route.27,28 The influence of type and degree of functionalization on the fate of injected CNTs has also been evaluated.29 However, the effect of other structural parameters like the particle size (ie, short versus long) and shape (ie, small versus large diameter) has not been fully understood. The main reason is likely due to the difficulties of obtaining uniform different-sized CNTs in large quantities.
CNHs are considered good candidates for drug carriers due to the fact that they have a large surface area (1,464 m2/g) but also a wide inner-tube and inter-tube space in each individual horn (0.69 mL/g) after hole-opening.32 Another advantage is that the CNHs are produced without catalysts3 and therefore they are devoid of any toxic risks associated with residual metallic impurities. Recent studies have also shown that CNHs can be separated into different controlled sizes,33,34 and small-sized CNHs (S-CNHs) with uniform sizes ~20–50 nm can be easily obtained in large quantity by an oxidative disaggregation method.34 S-CNHs are highly hydrophilic and remarkably resistant to cellular uptake by macrophages.34 Histological observations following intravenous administration have shown that S-CNHs accumulate in the liver and spleen more slowly than large-sized CNHs (L-CNHs) of 80–120 nm in diameter.35 This suggested that the biodistribution of CNHs may be size-dependent and it can eventually be further controlled by chemical functionalization.
To quantitatively and dynamically study the biodistribution of CNHs in vivo, we previously used Gd2O3 as label.36,37 Unfortunately, this type of labeling is based on annealing processes at high temperature resulting in S-CNH reaggregation into larger nanoparticles. To further analyze the fate of CNHs of different sizes and to perform a more detailed quantitative investigation, we utilized radioactive indium in this study (In-111) to label CNHs and to follow their tissue distribution and whole-body excretion after intravenous administration. For this purpose, the labeling process was performed by an amidation reaction of oxidized CNHs with the chelating agent diethylenetriaminepentaacetic acid (DTPA), an approach that has been successfully used to investigate the pharmacokinetic profiles of CNTs.27–29 By using this functionalization strategy, we can directly visualize the dynamic distribution of CNHs in whole body using single-photon emission computed tomography/computed tomography (SPECT/CT) and quantitatively calculate the organ distribution using gamma scintigraphy. The data allowed comparison of the differences between S-CNHs and L-CNHs in organ accumulation as well as in their excretion profiles.
Experimental
Materials
CNHs were synthesized by CO2 laser ablation of graphite at room temperature in Ar gas without a metal catalyst.3 S- and L-CNHs were prepared by oxidation as described in the following sections.
S-CNHs
Pristine CNHs (40 mg) were dispersed in 30 mL H2SO4 (98%; Wako Pure Chemical Industries, Ltd., Osaka, Japan) and stirred for 4 hours at room temperature.34 After cooling the suspension at 5°C, 10 mL HNO3 solution (67%; Wako Pure Chemical Industries, Ltd.) was slowly added, followed by sonication for 4 hours in a bath-type sonicator (~100 W) at 20°C. After sonication, the suspension was filtered (membrane filter, pore size 0.2 μm), the S-CNHs on the filtration paper were washed with water and re-dispersed in water. The filtration and re-dispersion in water was repeated until the pH of the filtrate became neutral. The obtained S-CNHs were re-dispersed in water (100 mL), sonicated at approximately 20°C with a tip-type sonicator (~300 W) for 30 minutes, and centrifuged at 10,000 rpm for 30 minutes. S-CNHs were collected from the upper 80% of supernatant. The concentration of the S-CNHs in the suspension was estimated from the absorbance at 700 nm measured with a ultraviolet-visible-near-infrared radiation spectrometer (Lambda 19; PerkinElmer Inc., Waltham, MA, USA). From the volume of the supernatant (~80 mL) and the concentration of S-CNHs (~0.1 mg/mL), the yield of S-CNHs was estimated to be ~20%. The size of the S-CNHs was estimated by dynamic light scattering (FPAR-1000; Otsuka Electronic Co., Ltd., Osaka, Japan). To observe the morphologies of S-CNHs using transmission electron microscopy (TEM) (120 kV, 36 μA; 002B HRTEM; Topcon Corporation, Tokyo, Japan), one drop of S-CNH dispersion was placed on a Cu grid with ultrathin carbon film and dried at room temperature. Thermogravimetric analysis (TGA) of as-grown CNHs was performed in He using a TGA Q500 (TA Instruments, New Castle, USA) with a heating rate of 10°C·min−1, while the other analyses were done using a TGA1 (Mettler Toledo, Schwerzenbach, Switzerland) apparatus from 30°C to 900°C with a ramp of 10°C·min−1 under N2 using a flow rate of 50 mL·min−1 and platinum pans.
L-CNHs
The pristine CNHs were treated by light-assisted oxidation38 to render them hydrophilic by generating oxygenated groups such as carboxylic groups. Briefly, pristine CNHs (40 mg) were dispersed in an aqueous solution of H2O2 (30%, 60 mL) and heated at 70°C–80°C for 2 hours under irradiation using an Xe lamp. The resultant dispersion was filtered (membrane filter, pore size 0.2 μm), and the L-CNHs on the filter paper were washed and re-dispersed in water. The washing and re-dispersion were repeated four times. The obtained L-CNHs were re-dispersed in water (100 mL) by sonication in a water bath for 5 minutes. Their characteristics were similarly examined using the techniques described earlier. Cu grids with holey carbon were used for TEM observation of L-CNHs.
Chemical functionalization and labeling with 111In
L-CNHs or S-CNHs were first treated with an amino-DTPA derivative39 (see “Supplementary materials” for description of the synthesis of amino-DTPA, Figure S1) to allow chelation of 111In (Figure 1). For this purpose, the CNHs (2.8 mg) were dispersed in oxalyl chloride (10 mL) using a water bath sonicator 20 W, 40 kHz (Transsonics Digitals Elma, Singen, Germany). The suspension was heated at reflux for 16 hours. After evaporation of excess oxalyl chloride under reduced pressure, the CNHs were dispersed in anhydrous tetrahydrofuran (THF) (1.9 mL) using water bath sonication. A solution of amino-DTPA (28 mg) and N, N-diisopropylethylamine (50 μL) in anhydrous dimethylformamide (DMF) (2.8 mL) was added. The suspension was sonicated in a water bath for 2 minutes and then heated at 65°C for 2 days. After cooling to room temperature, the solvents were evaporated under reduced pressure. Ammonium acetate buffer (0.2 M, pH 5.5, 30 mL) was added to the residue. The suspension was dispersed using water bath sonication and centrifuged at 4,500 rpm for 10 minutes. The supernatant was discarded and the precipitate was redispersed in ammonium acetate buffer. This sequence was repeated five times with ammonium acetate buffer and three times with deionized water. The precipitate was dispersed in deionized water using water bath sonication and the suspension was dialyzed in deionized water using 12–14 kDa molecular weight cut off (MWCO) dialysis membrane (Spectrum Laboratories, Inc., CA, USA) for 2 days.
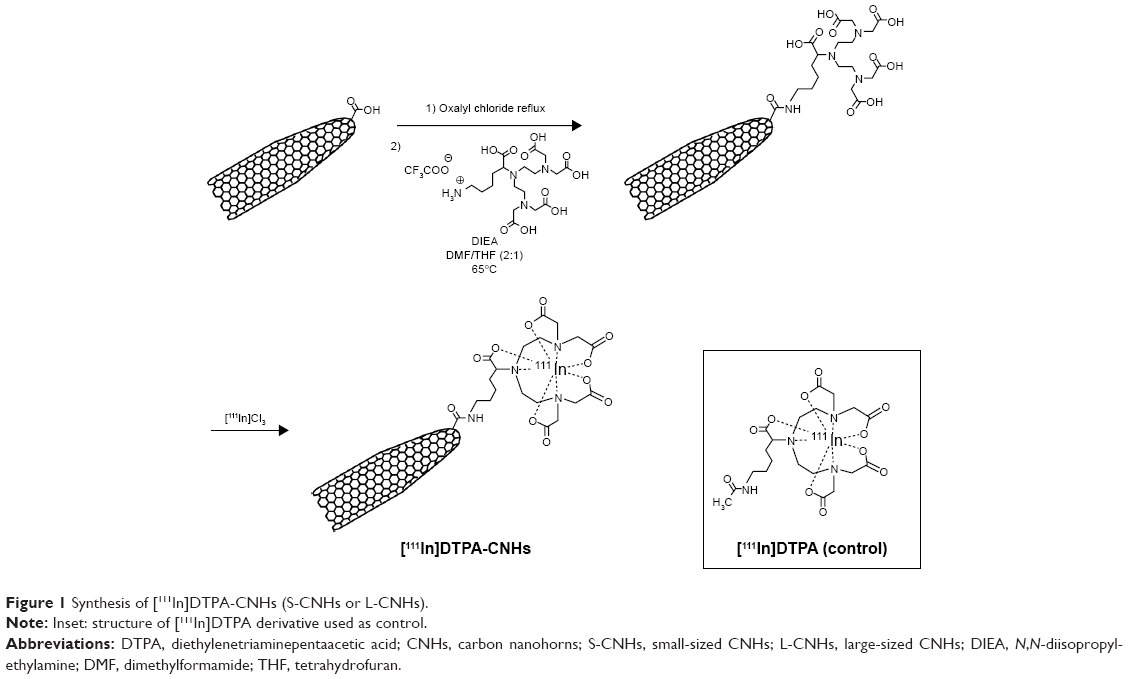 | Figure 1 Synthesis of [111In]DTPA-CNHs (S-CNHs or L-CNHs). |
For radiolabeling of the DTPA-S-CNHs or DTPA-L-CNHs, equal volumes of 0.2 mg/mL solutions in water of each was mixed with 0.2 M ammonium acetate buffer (pH 5.5) to which 2–20 MBq of [111In]Cl3 was added. The indium was left to react with the DTPA-S-CNHs or DTPA-L-CNHs for 30 minutes at room temperature. The excess 111In was treated with ethylenediaminetetraacetic acid (EDTA) (0.1 M) and removed by centrifugation (13,000 rpm for 30 minutes). To determine the labeling efficiency, aliquots of each final product were diluted five times in phosphate-buffered saline (PBS), and then 1 μL of the sample was spotted on silica gel impregnated glass fiber sheets (Pall Corporation, Port Washington, NY, USA). The strips were developed with a mobile phase of 50 mM EDTA in 0.1 M ammonium acetate and allowed to dry. They were then developed for the quantitative counting of radioactivity using a Cyclone phosphor detector (PerkinElmer Inc., Waltham, MA, USA). The immobile spot on the thin-layer chromatography strips indicated the percentage of radiolabeled [111In]DTPA-S-CNH or [111In]DTPA-L-CNH conjugates, while [111In]EDTA or [111In]DTPA corresponds to the migrated spots. After centrifugation, the pellets of [111In]DTPA-S-CNHs or [111In]DTPA-L-CNHs were resuspended in 5% dextrose. The final concentrations of CNHs were adjusted to 0.2 mg/mL. For evaluating the radiolabeling stability of [111In]DTPA-S-CNHs or [111In]DTPA-L-CNHs, aliquots of each final product were diluted fivefold either in PBS or mouse serum and then incubated at 37°C over 24 hours. At different time points (0, 1, and 24 hours), 1 μL of the aliquots was spotted on silica gel impregnated glass fiber sheets and then developed, and quantified as described earlier. A control sample [111In]DTPA was prepared by chelation of an acetylated DTPA ligand39 with [111In] (Figure 1, inset).
In vivo experiments
All animal procedures were performed in compliance with the UK Home Office Code of Practice for the Housing and Care of Animals used in Scientific Procedures. They were conducted following approval by the Institutional Ethical Review Committee, according to the UKCCCR Guidelines (1998) and under Project License 70/7763 granted by the UK Home Office. Six to 8-week-old C57/BL/6 mice (15–20 g), were purchased from Harlan (Oxfordshire, UK). Mice were housed in groups of five with free access to water and kept at a temperature of 19°C–22°C and relative humidity of 45%–65%. Prior to performing the experiments, all animals were allowed to acclimatize for at least 7 days. The radiolabeled S-CNHs or L-CNHs (50 μg, 3–5 MBq) were injected via the tail vein of mice after anesthetization by isoflurane inhalation. Immediately after injection (t=0.5 hours) and at t=3.5 hours, t=24 hours, and t=48 hours, mice were imaged using the Nano-SPECT/CT scanner (Bioscan, Washington, D.C., USA). CT scans were performed at the beginning of each SPECT acquisition. SPECT images were obtained in 24 projections over 40–60 minutes using a four-head scanner with 1.4 mm pinhole collimators. All images were reconstructed with MEDISO software (Medical Imaging Systems, Budapest, Hungary). Fusion of SPECT and CT images was carried out using the PMOD software (PMOD Technologies, Zurich, Switzerland). For quantitative assessment of tissue distribution of [111In]DTPA-S-CNHs or [111In]DTPA-L-CNHs, mice were injected via the tail vein with 250 μL containing 50 μg of [111In]DTPA-S-CNHs or [111In]DTPA-L-CNHs labeled with approximately 0.5–2 MBq. Mice were then sacrificed at 1, 4, and 24 hours after injection, and blood and all major organs and tissues were collected, including: heart, lungs, liver, spleen, kidneys, muscle, skin, and bone. Urine and feces were pooled and collected after 24 hours. Each sample was weighed and counted on a gamma Counter (PerkinElmer Inc.), together with a dilution of the injected dose with dead time limit below 60%. The percentage injected dose per gram tissue was calculated, using four different mice for each time point.
Results and discussion
Characterization of S-CNHs and L-CNHs, and their 111In labeling
The morphologies of S-CNHs and L-CNHs were shown in Figure 2A and 2B, respectively. S-CNHs contained individual nanohorns and small-sized aggregates (Figure 2A), and their size was between 30 and 50 nm as estimated from dynamic light scattering (Figure 2C), in agreement with previous results.34 L-CNHs maintain the original spherical form of aggregates (Figure 2B) with size range of ~80–120 nm (Figure 2C). TGA of as-grown CNHs, L-CNHs, and S-CNHs performed in an inert atmosphere is shown in Figure 2D. The weight loss observed for L-CNHs and S-CNHs is mainly caused by the emission of CO and CO2 as a result of the thermal decomposition of oxygenated groups.40 The concentration of carboxyl groups in the buffer solutions was estimated to be 6 μmol for S-CNHs and 2.5 μmol for L-CNHs per milligram of material, taking into account the quantities of carboxyl groups assessed from the weight loss at 400°C, which is due to the decomposition of carboxyl groups.40 The COOH functions of both L-CNHs and S-CNHs were derivatized by amidation with the amino-DTPA derivative, via pre-activation of the carboxyl groups using oxalyl chloride. TGA performed in an inert atmosphere confirmed the successful functionalization of L-CNHs and S-CNHs with DTPA (Figure 2D). Indeed, the weight loss of DTPA-L-CNHs and DTPA-S-CNHs was higher compared to the L-CNHs and S-CNHs, respectively.
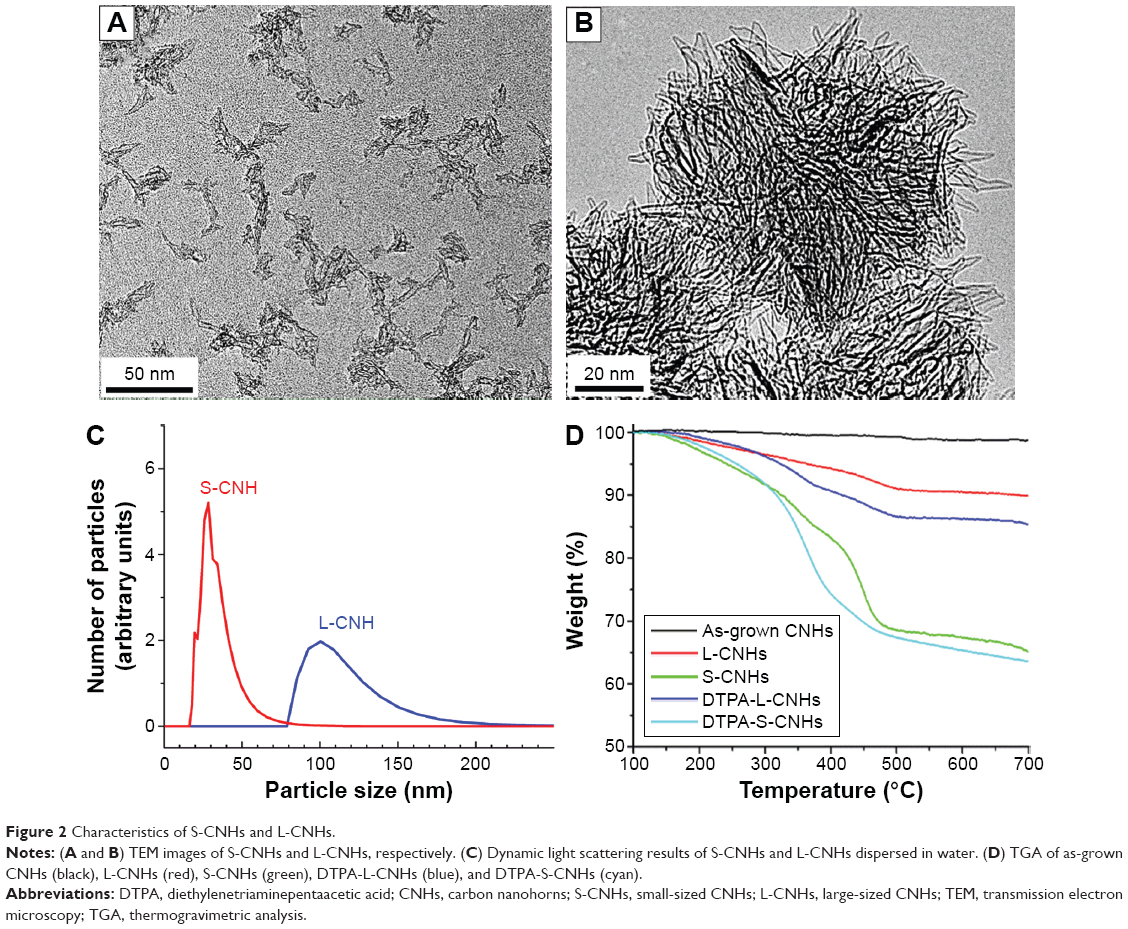 | Figure 2 Characteristics of S-CNHs and L-CNHs. |
DTPA-amidated S-CNHs and L-CNHs were then labeled with 111In, and the labeling efficiencies directly after the radiolabeling reaction corresponded to 64.6% and 95.2%, respectively (Figure S2). None or very little traces of free [111In]DTPA molecules were confirmed by thin-layer chromatography before injecting the material in mice. The 111In atoms were not released from the chelating function in PBS or in serum at 37°C for 24 hours (Figures S3 and S4).
CNH tissue distribution
Three-dimensional SPECT/CT reconstruction images of mice whole-bodies after injection of [111In]DTPA-S-CNHs, [111In]DTPA-L-CNHs, and [111In]DTPA are shown in Figures 3 and S5. The quantities are indicated with colors. [111In]DTPA-S-CNHs or [111In]DTPA-L-CNHs accumulated mainly in the liver and spleen. They were also observed in the kidney or bladder at early time points. After 24 hours and 48 hours postinjection, the signals were still persistent only in the liver and spleen. SPECT/CT images of S-CNHs showed relatively weaker signal intensities than those of L-CNHs because of the relatively lower labeling efficiency (Figure S2). Signals in the bladder of [111In]DTPA-L-CNHs remained even after 4 hours compared to [111In]DTPA-S-CNHs. The control sample [111In]DTPA was almost completely excreted within the first hour (Figure S5).
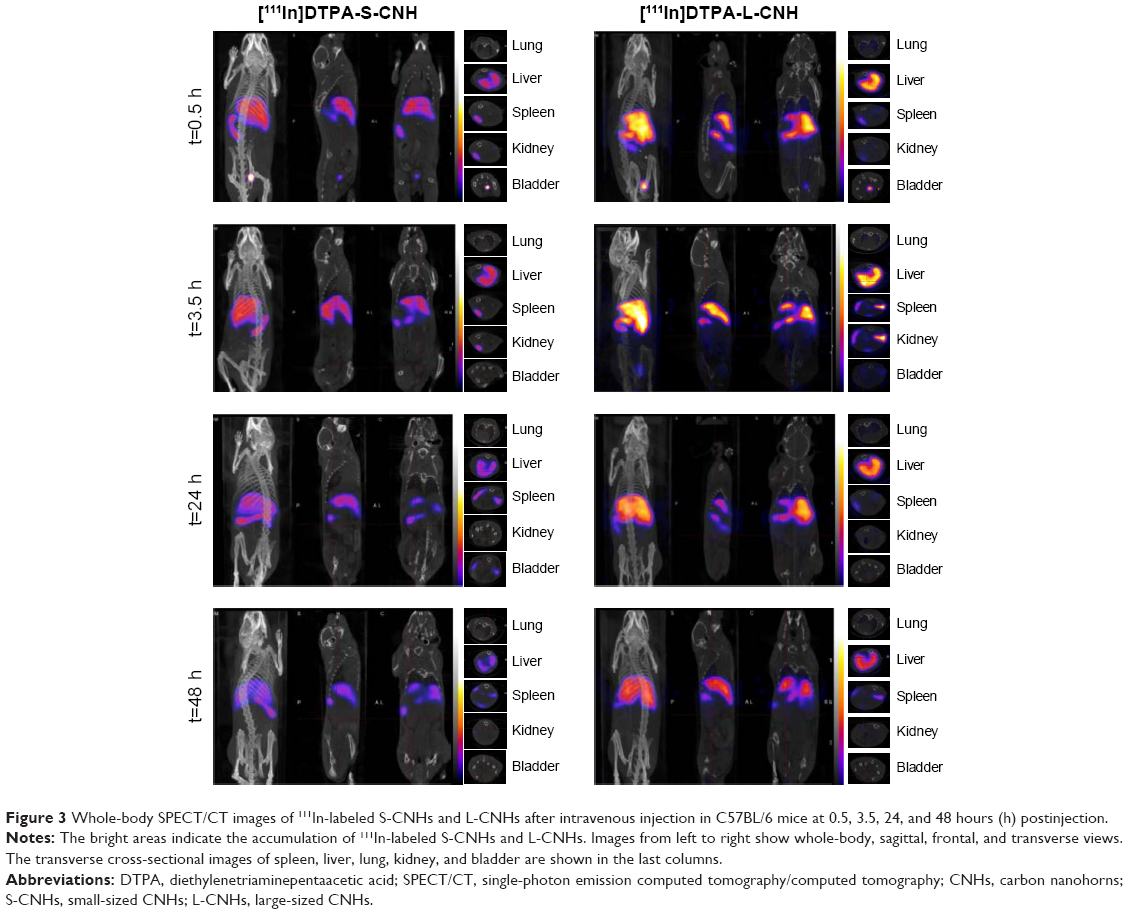 | Figure 3 Whole-body SPECT/CT images of 111In-labeled S-CNHs and L-CNHs after intravenous injection in C57BL/6 mice at 0.5, 3.5, 24, and 48 hours (h) postinjection. |
Gamma scintigraphy was then used for the quantification of S-CNHs and L-CNHs in blood and the major organs and tissues like skin, liver, spleen, kidney, heart, lung, muscle, bone, stomach, and intestine at different time points (ie, 1, 4, and 24 hours) (Figure 4 and Table 1). The control sample [111In]DTPA was used for comparison (Figure S6 and Table 1). Both types of CNH signals in blood reduced rapidly within the first hour. However, low levels of the smaller [111In]DTPA-S-CNHs remained constantly circulating in blood, with 2.5 μg/mL (1.3% injected dose [ID]) remaining in blood after 24 hours. Levels of the larger [111In]DTPA-L-CNHs reduced more rapidly in blood and only 0.82 μg/mL (0.4%) remained after 24 hours (Figure 4A and B). This suggests that the smaller CNHs were able to circulate longer, and their uptake by tissues was delayed. This behavior is common in the smaller nanoparticles which tend to reenter the blood stream.41 The larger [111In]DTPA-L-CNHs were taken up by the organs very rapidly at the first time points.
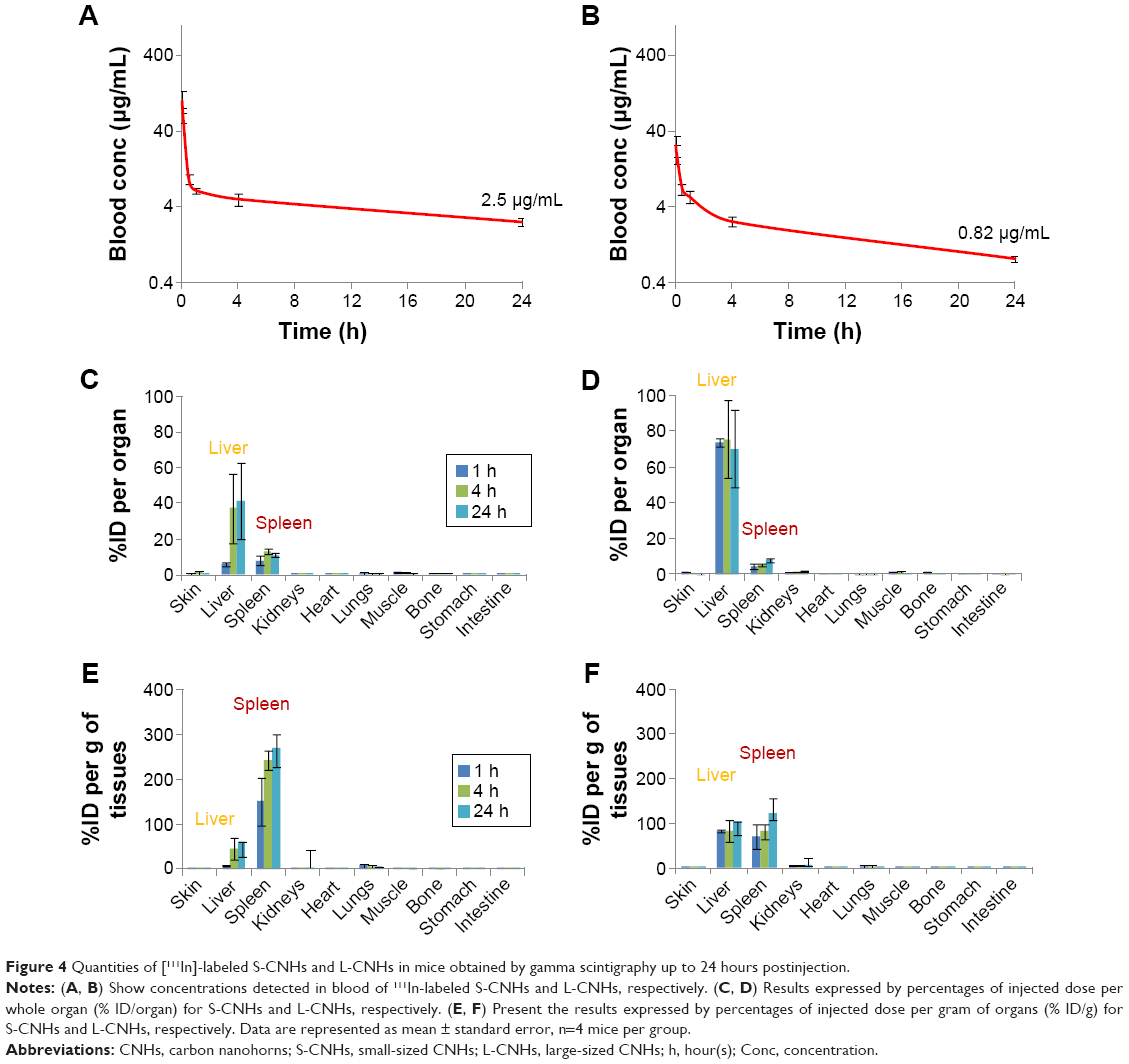 | Figure 4 Quantities of [111In]-labeled S-CNHs and L-CNHs in mice obtained by gamma scintigraphy up to 24 hours postinjection. |
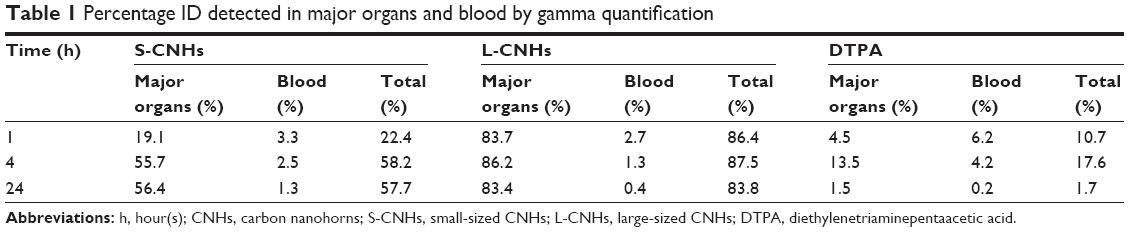 | Table 1 Percentage ID detected in major organs and blood by gamma quantification |
The S-CNH quantity in the liver (% ID/organ) was ~6.1% at 1 hour and increased significantly after 4 hours to 37.4%, remaining high at 24 hours (41.5%). The S-CNH quantity in the spleen was ~8.2% and increased a little with time (Figure 4C). The larger [111In]DTPA-L-CNHs were taken up by the organs very rapidly at the first time point. The L-CNH quantity in the liver was 73.7% (% ID/organ) at 1 hour, remaining unchanged at 4 and 24 hours (Figure 4D). The L-CNH quantity in the spleen was less than 5% at 1 hour, increasing a little with time. In other organs, quantities of S- and L-CNHs were very low, <2% (Figure 4).
A more accurate analysis of the data is given by measuring the accumulation as percentage of the injected dose per gram of tissue (% ID/gram of tissue) (Figure 4E and F), to better express the affinity of CNH material for each tissue. The preferential accumulation of CNHs in the liver and spleen was again evident. However, the accumulation of [111In]DTPA-S-CNHs in the spleen became more prominent, while the larger [111In]DTPA-L-CNHs expressed almost equal affinity to both organs. The size, sphericity, and deformability play a central role in accumulation of nanoparticles in tissues. Larger nanoparticles (150–200 nm) with spherical shapes tend to be trapped by the liver fenestra and recognized by Kupffer cells.42 Smaller particles (of ~100 nm in diameter) with elongated shapes may be sequestered by the spleen, unless being deformable enough to cross the spleen reticular network. The control sample [111In]DTPA showed rapid elimination from blood and only high kidney signals at early time points with no accumulation in other organs, with almost complete elimination after 24 hours (Figure S7, and Table 1).
CNH excretion
The values of % ID of S-CNHs or L-CNHs in the organs reported in Table 1 correspond to the quantities of materials detected in the body at different time points. The total amount of both S-CNHs and L-CNHs after 4 hours was 58.2% and 87.5%, respectively. Liberation of 111In atoms from S-CNHs or L-CNHs was likely not happening because no decomplexation occurred in PBS and in serum at 37°C for 24 hours (Figure S3). Thus, it is inferred that a certain amount of S-CNHs or L-CNHs was excreted mainly in urine within the first few hours, followed by the small/trace amount excretions in urine and feces continuing for 48 hours (Figures 3 and S7). The excreted quantity of S-CNHs was more than that of L-CNHs, detected by quantities in urine, with 8% of S-CNHs excreted compared to only approximately 5% of the L-CNHs (Figure S7). This may have been the case because the smaller sized S-CNHs could avoid phagocytotic uptake more effectively than the larger L-CNHs, as has been observed in a previous in vitro study.35 Also, small-sized nano-carbons were able to cross the glomerular filtration slits (40 nm)28 more comfortably than L-CNHs.
Urinary excretion was further confirmed by semi-quantification of the SPECT bladder signal. S- and L-CNH quantities detected in the bladder after 1 hour were ~3.50 and 2.16% of ID, respectively (Table S1). Both SPECT/CT and gamma scintigraphy data showed that overall small quantities of S-CNHs and L-CNHs (less than 10% ID) were detected in urine and feces at later time points of 24 and 48 hours (Table S1 and Figure S7). Although the preferential accumulation of S-CNHs and L-CNHs in the liver and spleen has been reported in our previous histological observations,35 the results obtained in this study by SPECT quantitatively confirmed that the biodistribution of nano-carbons in vivo is size-dependent. In addition, the excretion profile of CNHs functionalized by [111In]DTPA was different from Gd2O3-labeled CNHs (100 nm aggregates) coated with DSPE-PEG 1,2-distearoyl-sn-glycero-3-phosphoethanolamine-N-[amino(PEG)] (5 kDa),37 that were mainly excreted via the liver–bile duct–duodenum route.37 The similar results from single-wall carbon nanotubes (SWNTs) and graphene oxide also indicated that DTPA-functionalized SWNTs27–29 or graphene oxide43 exhibited faster clearance from the body than PEG-modified CNTs or graphene.44 Therefore, we think that the surface functionalization of CNHs with non-bulky functional groups, like DTPA, can lead to a different biodistribution and excretion kinetic profile. This is effective in avoiding the uptake by phagocytes that may further facilitate excretion via both the urinary and liver–bile duct routes.
In addition, we did not find any signs of weakness, illness, or weight loss by visual inspection of the mouse and their organs after imaging.
Conclusion
We have studied the size-/shape-effect of CNHs on the biodistribution and excretion profile by using two types of CNHs (S-CNH: 30 nm and L-CNH: 100 nm). These CNHs were covalently functionalized with [111In]DTPA and intravenously injected in mice. Their whole-body biodistribution profiles and excretion rates were studied by SPECT/CT and gamma scintigraphy. Both S-CNHs and L-CNHs accumulated mainly in the liver and spleen; however, S-CNHs exhibited higher affinity for the spleen. The larger, spherical L-CNHs accumulated in the liver and spleen to the same extent. A small amount of S-CNHs and L-CNHs was excreted within the first few hours after injection, followed by much slower excretion rates obtained after 48 hours. The excretion of S-CNHs was slightly faster than L-CNHs. Compared with the previous results for CNHs coated with phospholipid-PEG, the tissue distribution profile and kinetics of excretion determined for CNHs here were significantly different, most likely due to the differences in the material surface functionalization.
Acknowledgments
The authors thank Dr Kasuya and Dr Azami for synthesis of CNHs. MZ thanks Grants-in-Aid for Scientific Research C (22510119) from the Japan Society for the Promotion of Science. This work was supported by the Centre National de la Recherche Scientifique (CNRS), the International Center for Frontier Research in Chemistry (icFRC). AB wishes to thank JSPS (Japanese Society for the Promotion of Science) for the Invitation Fellowship in Japan (ID number L15526). The authors would like to also thank Dr Jane Sosabowski and Professor Stephen Mather from the Barts Cancer Institute, Queen Mary University of London, for their advice with SPECT/CT imaging and analysis.
Disclosure
The authors report no conflicts of interest in this work.
References
Iijima S. Helical microtubules of graphitic carbon. Nature. 1991;354(56): 56–58. | ||
Iijima S, Ichihashi T. Single-shell carbon nanotubes of 1-nm diameter. Nature. 1993;363:603–605. | ||
Iijima S, Yudasaka M, Yamada R, et al. Nano-aggregates of single-walled graphitic carbon nano-horns. Chem Phys Lett. 1999;309(3–4): 165–170. | ||
Kosynkin DV, Higginbotham AL, Sinitskii A, et al. Longitudinal unzipping of carbon nanotubes to form graphene nanoribbons. Nature. 2009;458:872–876. | ||
Jiao L, Zhang L, Wang X, Diankov G, Dai H. Narrow graphene nanoribbons from carbon nanotubes. Nature. 2009;458:877–880. | ||
De la Zerda A, Zavaleta C, Keren S, et al. Carbon nanotubes as photoacoustic molecular imaging agents in living mice. Nat Nanotechnol. 2008;3(9):557–562. | ||
Welsher K, Liu Z, Sherlock SP, et al. A route to brightly fluorescent carbon nanotubes for near-infrared imaging in mice. Nat Nanotechnol. 2009;4(11):773–780. | ||
Welsher K, Liu Z, Daranciang D, Dai H. Selective probing and imaging of cells with single walled carbon nanotubes as near-infrared fluorescent molecules. Nano Lett. 2008;8(2):586–590. | ||
Liu Z, Tabakman S, Welsher K, Dai H. Carbon nanotubes in biology and medicine: in vitro and in vivo detection, imaging and drug delivery. Nano Res. 2009;2(2):85–120. | ||
Kostarelos K, Bianco A, Prato M. Promises, facts and challenges for carbon nanotubes in imaging and therapeutics. Nat Nanotechnol. 2009;4(10):627–633. | ||
Liu Z, Robinson J, Tabakman S, Yang K, Dai H. Carbon materials for drug delivery & cancer therapy. Mater Today. 2011;14(7–8): 316–323. | ||
Kam NW, Dai H. Carbon nanotubes as intracellular protein transporters: generality and biological functionality. J Am Chem Soc. 2005;127(16): 6021–6026. | ||
Bianco A, Kostarelos K, Prato M. Applications of carbon nanotubes in drug delivery. Curr Opin Chem Biol. 2005;9(6):674–679. | ||
Bhirde A, Patel V, Gavard J, et al. Targeted killing of cancer cells in vivo and in vitro with EGF-directed carbon nanotube-based drug delivery. ACS Nano. 2009;3(2):307–316. | ||
Liu Z, Chen K, Davis C, et al. Drug delivery with carbon nanotubes for in vivo cancer treatment. Cancer Res. 2008;68(16):6652–6660. | ||
Robinson J, Hong G, liang Y, Zhang B, Yaghi O, Dai H. In vivo fluorescence imaging in the second near-infrared window with long circulating carbon nanotubes capable of ultrahigh tumor uptake. J Am Chem Soc. 2012;134(25):10664–10669. | ||
Smith BR, Ghosn EE, Rallapalli H, et al. Selective uptake of single-walled carbon nanotubes by circulating monocytes for enhanced tumour delivery. Nat Nanotechnol. 2014;9:481–487. | ||
Menard-Moyon C, Ali-Boucetta H, Fabbro C, Chaloin O, Kostarelos K, Bianco A. Controlled chemical derivatisation of carbon nanotubes with imaging, targeting, and therapeutic capabilities. Chemistry. 2015; 21(42):14886–14892. | ||
Murakami T, Ajima K, Miyawaki J, Yudasaka M, Iijima S, Shiba K. Drug-loaded carbon nanohorns: adsorption and release of dexamethasone in vitro. Mol Pharm. 2004;1(6):399–405. | ||
Ajima K, Yudasaka M, Murakami T, Maigné A, Shiba K, Iijima S. Carbon nanohorns as anticancer drug carriers. Mol Pharm. 2005;2(6): 475–480. | ||
Ajima K, Murakami T, Mizoguchi Y, et al. Enhancement of in vivo anticancer effects of cisplatin by incorporation inside single–wall carbon nanohorns. ACS Nano. 2008;2(10):2057–2064. | ||
Zhang M, Murakami T, Ajima K, et al. Fabrication of ZnPc/protein nanohorns for double photodynamic and hyperthermic cancer phototherapy. Proc Natl Acad Sci U S A. 2008;105(39):14773–14778. | ||
Kam NW, O’Connell M, Wisdom JA, Dai H. Carbon nanotubes as multifunctional biological transporters and near-infrared agents for selective cancer cell destruction. Proc Natl Acad Sci U S A. 2005;102(33): 11600–11605. | ||
Yang K, Zhang S, Zhang G, Sun X, Lee S, Liu Z. Graphene in mice: ultrahigh in vivo tumor uptake and efficient photothermal therapy. Nano Lett. 2010;10(9):3318–3323. | ||
Liu Z, Davis C, Cai W, He L, Chen X, Dai H. Circulation and long-term fate of functionalized, biocompatible single-walled carbon nanotubes in mice probed by Raman spectroscopy. Proc Natl Acad Sci U S A. 2007; 105(5):1410–1415. | ||
Liu Z, Cai W, He L, et al. In vivo biodistribution and highly efficient tumour targeting of carbon nanotubes in mice. Nat Nanotechnol. 2007; 2(1):47–52. | ||
Singh R, Pantarotto D, Lacerda L, et al. Tissue biodistribution and blood clearance rates of intravenously administered carbon nanotube radiotracers. Proc Natl Acad Sci U S A. 2005;103(9):3357–3362. | ||
Lacerda L, Soundararajan A, Singh R, et al. Dynamic imaging of functionalized multi-walled carbon nanotube systemic circulation and urinary excretion. Adv Mater. 2008;20(2):225–230. | ||
Al-Jamal KT, Nunes A, Methven L, et al. Degree of chemical functionalization of carbon nanotubes determines tissue distribution and excretion profile. Angew Chem Int Ed Engl. 2012;51(26):6389–6393. | ||
Ali-Boucetta H, Kostarelos K. Pharmacology of carbon nanotubes: toxicokinetics, excretion and tissue accumulation. Adv Drug Deliv Rev. 2013;65(15):2111–2119. | ||
Jasim D, Menard-Moyon C, Begin D, Bianco A, Kostarelos K. Tissue distribution and urinary excretion of intravenously administered chemically functionalized graphene oxide sheets. Chem Sci. 2015; 6:3952–3964. | ||
Yang C, Nouchi H, Murata K, et al. Highly ultramicroporous single-walled carbon nanohorn assemblies. Adv Mater. 2005;17(7): 866–870. | ||
Zhang M, Yamaguchi T, Iijima S, Yudasaka M. Individual single-wall carbon nanohorns separated from aggregates. J Phys Chem C. 2009; 113(26):11184–11186. | ||
Zhang M, Zhou X, Iijima S, Yudasaka M. Small-sized carbon nanohorns enabling cellular uptake control. Small. 2012;8(16):2524–2531. | ||
Zhang M, Yamaguchi T, Iijima S, Yudasaka M. Size-dependent biodistribution of carbon nanohorns in vivo. Nanomedicine. 2013;9(5): 657–664. | ||
Miyawaki J, Matsumura S, Yuge R, et al. Biodistribution and ultrastructural localization of single-walled carbon nanohorns determined in vivo with embedded Gd2O3 labels. ACS Nano. 2009;3(6): 1399–1406. | ||
Zhang M, Tahara Y, Yang M, Zhou X, Iijima S, Yudasaka M, Quantification of whole body and excreted carbon nanohorns intravenously injected into mice. Adv Healthc Mater. 2014;3(2):239–244. | ||
Zhang M, Yudasaka M, Ajima K, Miyawaki J, Iijima S. Light-assisted oxidation of single-wall carbon nanohorns for abundant creation of oxygenated groups that enable chemical modifications with proteins to enhance biocompatibility. ACS Nano. 2007;1(4):265–272. | ||
Marangon I, Ménard-Moyon C, Kolosnjaj-Tabi J, et al. Covalent functionalization of multi-walled carbon nanotubes with a gadolinium chelate for efficient T1-weighted magnetic resonance imaging. Adv Funct Mater. 2014;24(45):7173–7186. | ||
Figueiredo JL, Pereira MF, Freitas MM, Orfao JJ. Modification of the surface chemistry of activated carbons. Carbon. 1999;37:1379–1389. | ||
Duan X, Li Y. Physicochemical characteristics of nanoparticles affect circulation, biodistribution, cellular internalization, and trafficking. Small. 2013;9(9–10):1521–1532. | ||
Wisse E, De Zanger RB, Charels K, Van Der Smissen P, McCuskey RS. The liver sieve: considerations concerning the structure and function of endothelial fenestrae, the sinusoidal wall and the space of Disse. Hepatology. 1985;5(4):683–692. | ||
Fazaeli Y, Akhavanb O, Rahighi R, Aboudzadeh MR, Karimi E, Afarideha H. In vivo SPECT imaging of tumors by 198,199Au-labeled graphene oxide nanostructures. Mater Sci Eng C Mater Biol Appl. 2014;45:196–204. | ||
Akhavan O, Ghaderi E. Graphene nanomesh promises extremely efficient in vivo photothermal therapy. Small. 2013;9(21):3593–3601. |
Supplementary materials
Materials and methods
All reagents and solvents were purchased from different commercial suppliers and used as received. 1H and 13C nuclear magnetic resonance (NMR) spectra were recorded on a Bruker 300 MHz instrument (Bruker Corporation, Billerica, MA, USA). The peak values were obtained as ppm (δ) and referenced to the solvent. The resonance multiplicity is indicated as s (singlet), t (triplet), m (multiplet), and br (broad). Liquid chromatography–mass spectrometry analyses were performed on a Thermo Fisher Finnigan LCQ Advantage Max system (Thermo Fisher Scientific, Waltham, MA, USA). Thermogravimetric analysis was performed using a Thermogravimetric analysis 1 (Mettler Toledo, Schwerzenbach, Switzerland) apparatus from 100°C to 900°C with a ramp of 10°C min−1 under N2 (flow rate of 50 mL·min−1) and platinum pans.
The amino-diethylenetriaminepentaacetic acid derivative was synthesized from the t-Bu-protected diethylenetriaminepentaacetic acid ligand reported in Marangon et al.1 The latter (665 mg) was stirred in trifluoroacetic acid (TFA) (8 mL) and deionized water (0.89 mL) for 17 hours. Then, the reaction mixture was evaporated under vacuum to give a beige solid in a quantitative yield. 1H NMR (300 MHz, dimethyl sulfoxide-d6 as a TFA salt, the signal of TFA was not included) δ=1.42–1.64 (m, 4 H), 1.74–1.92 (m, 2 H), 2.72–2.85 (m, 2 H), 2.98–3.15 (m, 4 H), 3.25–3.40 (m, 4 H), 3.60 (s, 8 H), 4.45 ppm (t, J=6.5 Hz, 1 H), 7.84 (br s, 3 H). 13C NMR (75 MHz, dimethyl sulfoxide-d6 as a TFA salt, the signal of TFA was not included) δ=23.1, 26.3, 26.9, 38.3, 49.9, 50.1, 54.1, 63.7, 170.5, 172.2 ppm. Liquid chromatography–mass spectrometry [molecular weight (ammonium) 465]: m/z 465 [M]+.
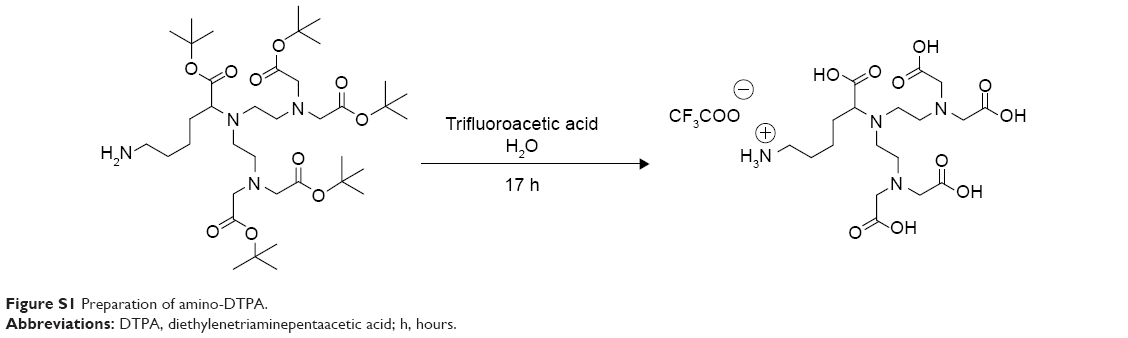 | Figure S1 Preparation of amino-DTPA. |
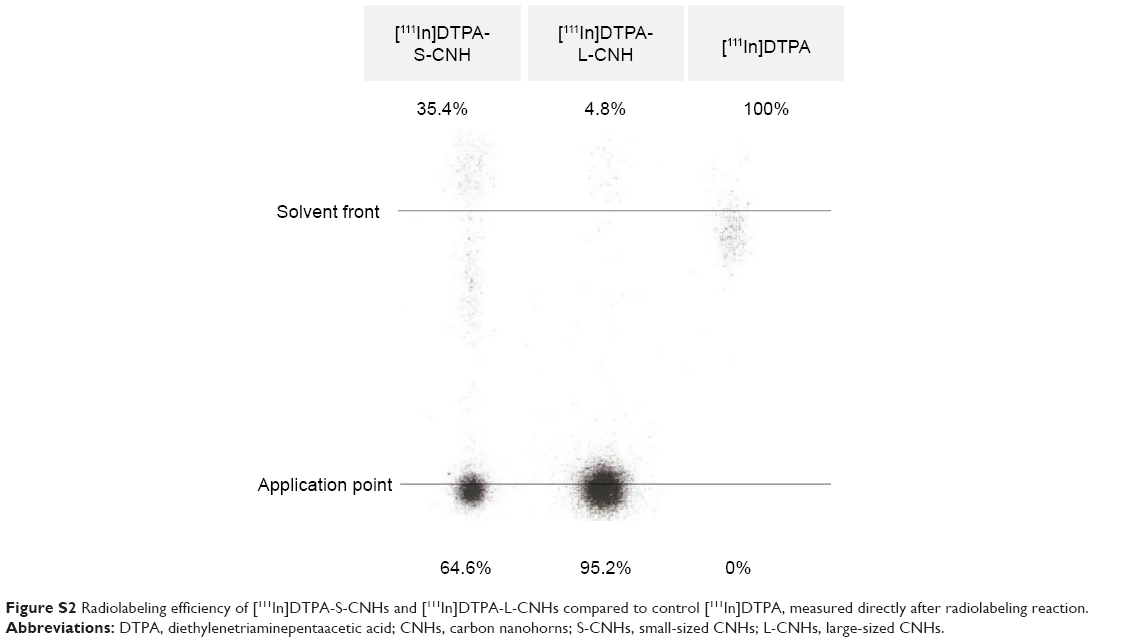 | Figure S2 Radiolabeling efficiency of [111In]DTPA-S-CNHs and [111In]DTPA-L-CNHs compared to control [111In]DTPA, measured directly after radiolabeling reaction. |
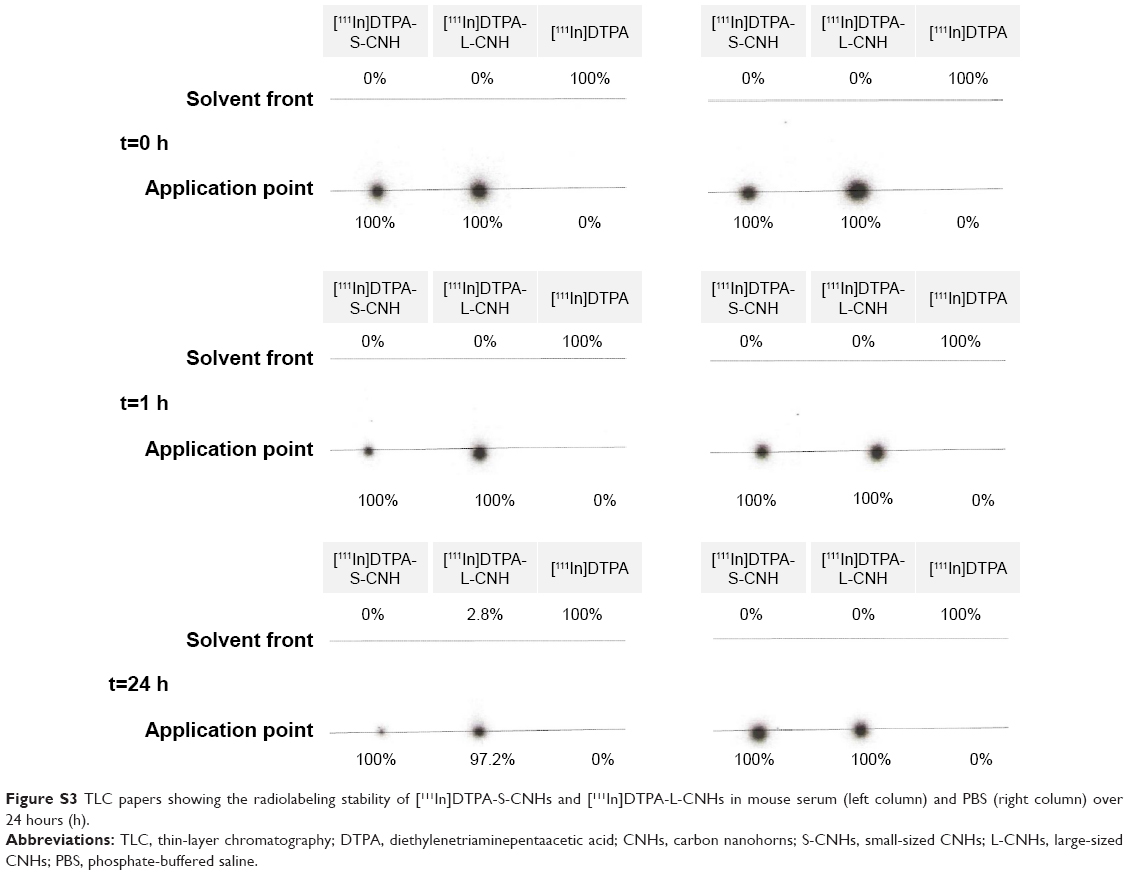 | Figure S3 TLC papers showing the radiolabeling stability of [111In]DTPA-S-CNHs and [111In]DTPA-L-CNHs in mouse serum (left column) and PBS (right column) over 24 hours (h). |
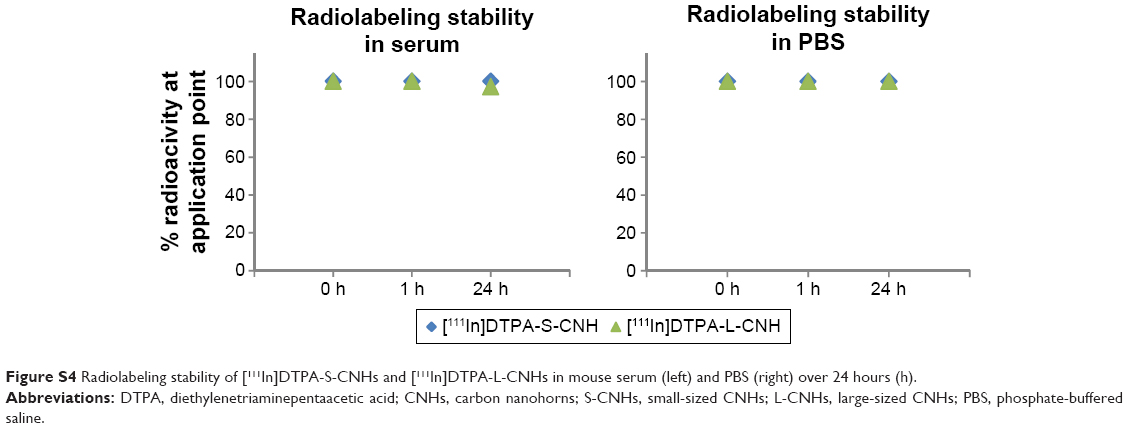 | Figure S4 Radiolabeling stability of [111In]DTPA-S-CNHs and [111In]DTPA-L-CNHs in mouse serum (left) and PBS (right) over 24 hours (h). |
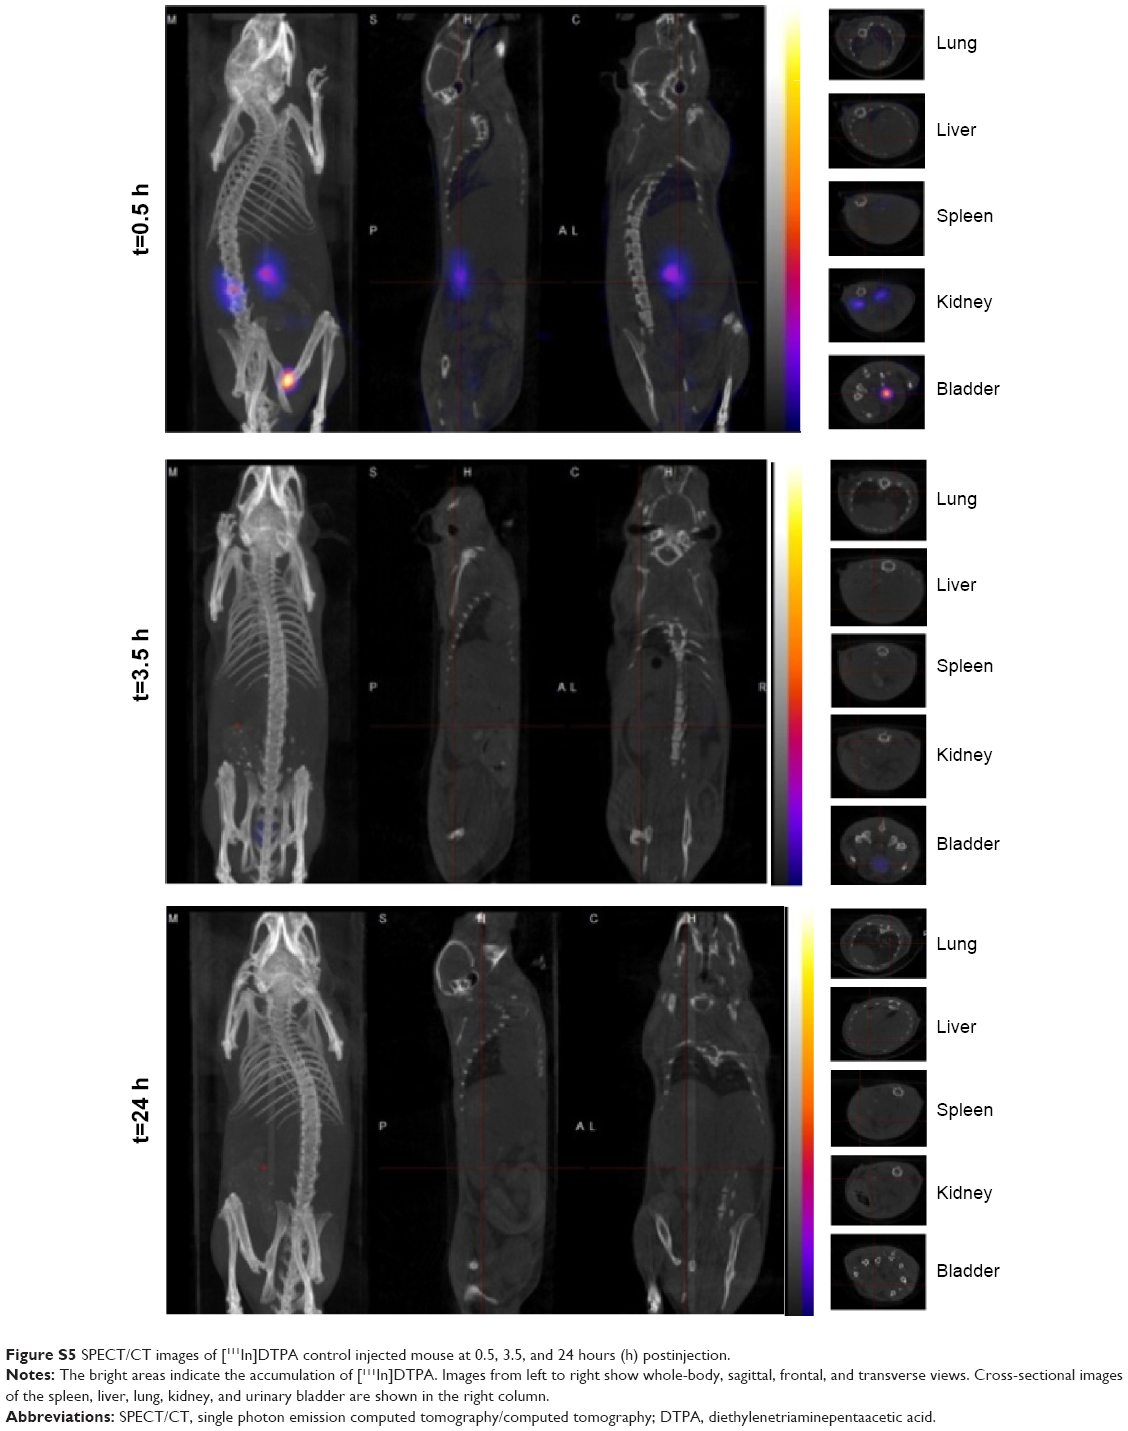 | Figure S5 SPECT/CT images of [111In]DTPA control injected mouse at 0.5, 3.5, and 24 hours (h) postinjection. |
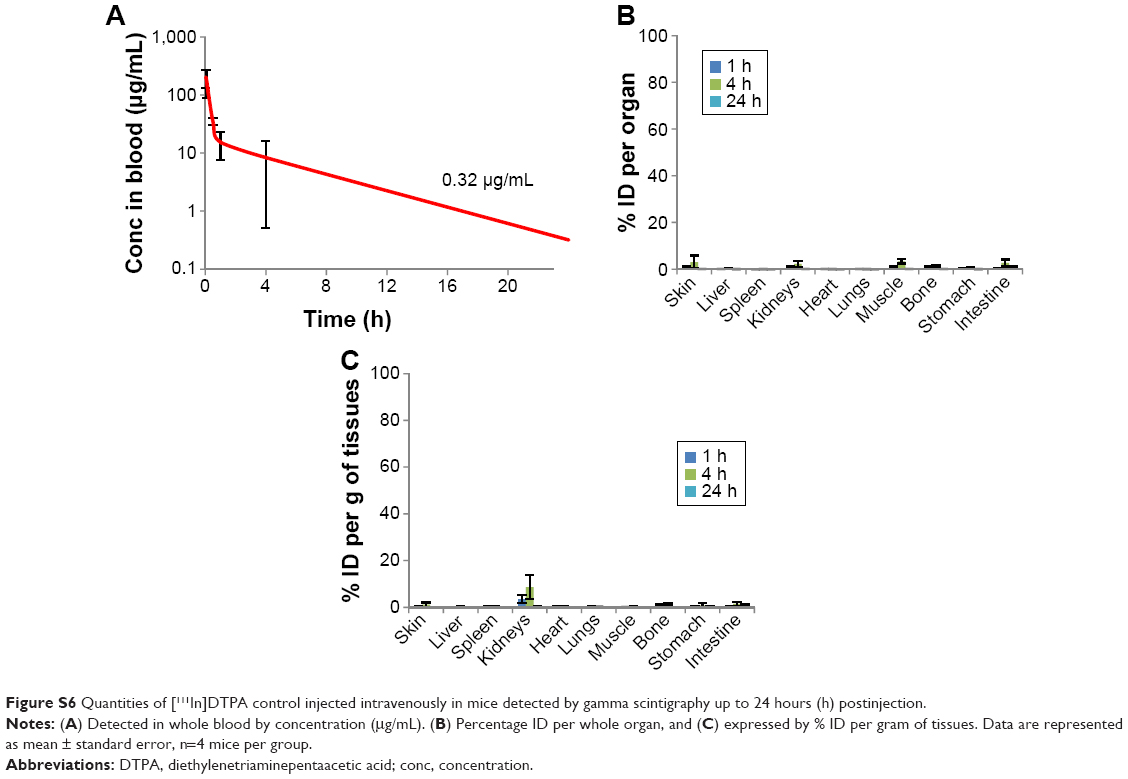 | Figure S6 Quantities of [111In]DTPA control injected intravenously in mice detected by gamma scintigraphy up to 24 hours (h) postinjection. |
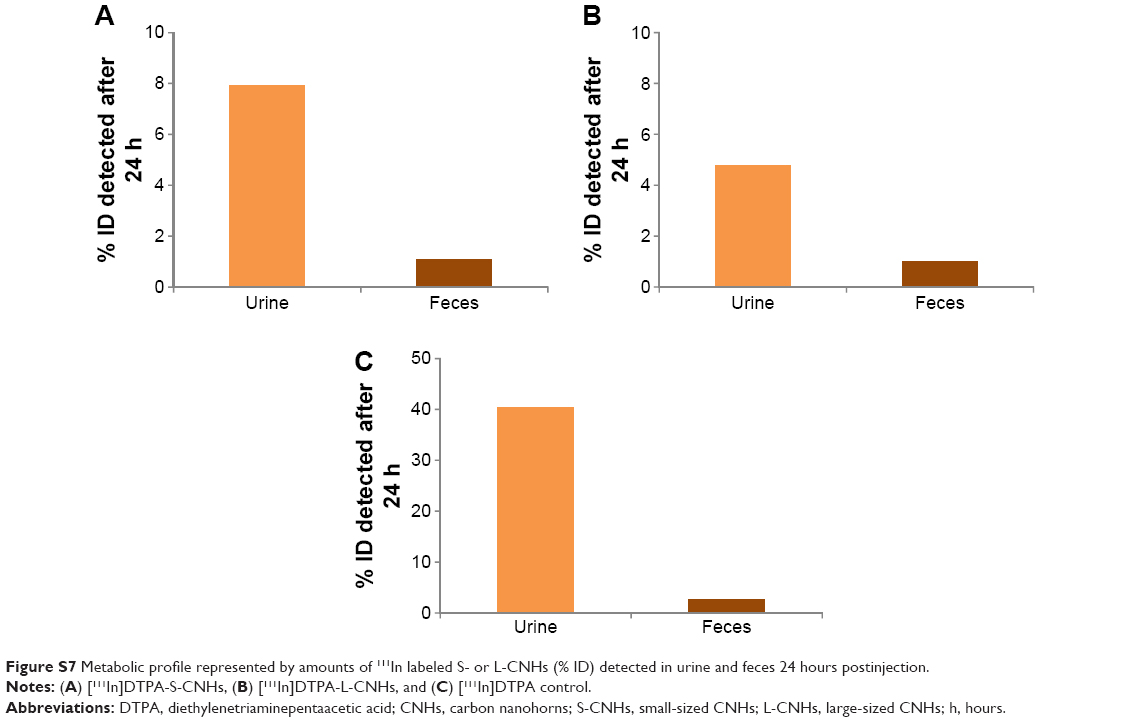 | Figure S7 Metabolic profile represented by amounts of 111In labeled S- or L-CNHs (% ID) detected in urine and feces 24 hours postinjection. |
 | Table S1 Percentage ID detected in bladder by single-photon emission computed tomography/computed tomography semi-quantification |
Reference
Marangon I, Ménard-Moyon C, Kolosnjaj-Tabi J, et al. Covalent functionalization of multi-walled carbon nanotubes with a gadolinium chelate for efficient T1-weighted magnetic resonance imaging. Adv Funct Mater. 2014;24(45):7173–7186. |
 © 2016 The Author(s). This work is published and licensed by Dove Medical Press Limited. The full terms of this license are available at https://www.dovepress.com/terms.php and incorporate the Creative Commons Attribution - Non Commercial (unported, v3.0) License.
By accessing the work you hereby accept the Terms. Non-commercial uses of the work are permitted without any further permission from Dove Medical Press Limited, provided the work is properly attributed. For permission for commercial use of this work, please see paragraphs 4.2 and 5 of our Terms.
© 2016 The Author(s). This work is published and licensed by Dove Medical Press Limited. The full terms of this license are available at https://www.dovepress.com/terms.php and incorporate the Creative Commons Attribution - Non Commercial (unported, v3.0) License.
By accessing the work you hereby accept the Terms. Non-commercial uses of the work are permitted without any further permission from Dove Medical Press Limited, provided the work is properly attributed. For permission for commercial use of this work, please see paragraphs 4.2 and 5 of our Terms.