")
Back to Journals » OncoTargets and Therapy » Volume 13
Quiescin Sulfhydryl Oxidase 1 Regulates the Proliferation, Migration and Invasion of Human Glioblastoma Cells via PI3K/Akt Pathway
Authors Geng Y , Xu C, Wang Y, Zhang L
Received 1 April 2020
Accepted for publication 27 May 2020
Published 17 June 2020 Volume 2020:13 Pages 5721—5729
DOI https://doi.org/10.2147/OTT.S255941
Checked for plagiarism Yes
Review by Single anonymous peer review
Peer reviewer comments 2
Editor who approved publication: Dr William C. Cho
Yibo Geng,1 Cheng Xu,1 Yi Wang,1 Liwei Zhang1,2
1Department of Neurosurgery, Beijing Tiantan Hospital, Capital Medical University, Beijing, People’s Republic of China; 2China National Clinical Research Center for Neurological Disease, Beijing, People’s Republic of China
Correspondence: Liwei Zhang
Department of Neurosurgery, Beijing Tiantan Hospital, Capital Medical University, Nan Si Huan Xi Lu 119, Fengtai District, Beijing 100070, People’s Republic of China
Tel +86 15101181174
Fax +86 010 59976611
Email [email protected]
Background: Quiescin sulfhydryl oxidase 1 (QSOX1) involves in the formation of disulfide bonds and participates in the protein folding process. In recent years, accumulating evidences have shown that QSOX1 is a biomarker for tumor development and prognosis. However, the biological function of QSOX1 in glioblastoma (GBM) remains unclear.
Materials and Methods: QSOX1 expression in glioma and overall survival of glioma patients were analyzed through The Cancer Genome Atlas (TCGA) and the Chinese Glioma Genome Atlas (CGGA) databases. shRNAs were used to decrease the expression of QSOX1 in U87 and U251 cells. Celltiter-Glo and colony formation assays were used to assess cell proliferation. Transwell and scratch assays were utilized to determine cell migration and invasion, the xenograft mouse models were established to evaluate the effect of QSOX1 knockdown in vivo. Western blot assays were used to detect the changes of E-cadherin/N-cadherin/vimentin and PI3K/Akt pathway.
Results: We found that QSOX1 was upregulated in glioma, especially in GBM. Upregulation of QSOX1 was correlated with poor prognosis in glioma patients. We discovered for the first time that suppression of QSOX1 expression inhibited proliferation, migration and invasion, as well as epithelial-mesenchymal transition (EMT) in GBM cell lines. In addition, phosphorylated PI3K and Akt were downregulated in the QSOX1-knockdown groups. Moreover, QSOX1 knockdown-impaired cell growth was partially rescued by Akt activator.
Conclusion: Our findings revealed that QSOX1 was a novel biomarker for GBM patients and QSOX1 promoted cell proliferation, migration and invasion through regulating PI3K/Akt pathway in GBM.
Keywords: QSOX1, glioblastoma, xenograft, epithelial-mesenchymal transition, PI3K/Akt pathway
Introduction
Glioblastoma (GBM) is a highly malignant intracranial brain tumor and has a high mortality rate.1 Despite the multimodal treatment procedure including surgery, chemotherapy and radiotherapy, the median survival time remains only 15–18 months.2 The poor prognosis of GBM patients is mainly attributed to the rapid growth, high invasiveness and heterogeneity of tumor.3 Thus, there is an urgent need for exploring the biomarker and underlying mechanism of GBM progression.
Based on Verhaak classification in 2010, GBM can be separated into four subtypes, namely classical, proneural, mesenchymal (MES) and neural subtypes according to different gene set signature.4 In general, the major differences of each type include the epidermal growth factor receptor (EGFR) amplification and loss of heterozygosity (LOH) 10q in the classical subtype. Downregulation of neurofibromatosis type 1 (NF1) and upregulation of chitinase 3 like 1 (CHI3L1) and mesenchymal genes was observed in the MES subtype. Next, abundant platelet‐derived growth factor alpha receptor (PDGFRA) and mutated IDH1 in the proneural subtype were observed. Finally, expression of neuron markers, TP53 mutation and CDKN2A deletion was correlated with the neural subtype. The difference subtypes showed the heterogeneity of GBM and inspired us to investigate the underlying mechanism of GBM.
QSOX1 has been well elucidated as an enzyme which plays a crucial role in protein folding. Several studies have demonstrated the invasive phenotype caused by QSOX1 overexpression in tumor tissues, including renal, hepatocellular and lung cancers.5–7 The high level of QSOX1 also correlates to tumor progression.8,9 Moreover, integrated analysis has revealed that the upregulation of QSOX1 is associated with poor overall survival of GBM patients.10 However, QSOX1 expression and biological functions in GBM, as well as its specific molecular mechanism remain unclear.
PI3K/Akt pathway could be activated in EGFR amplification or mutation GBM,11 which drives and regulates many cellular processes, including proliferation and migration.12 Inhibition of the PI3K/Akt pathway is considered as a promising therapeutic target for the treatment of different subtypes of GBM.13,14 Particularly, several PI3K/Akt pathway inhibitors combined with chemoradiotherapy have been proved to be beneficial for GBM patients in clinical trials.15–18
The present study analyzed the QSOX1 expression in glioma tissues and the correlation between QSOX1 expression and GBM patients’ survival outcomes through The Cancer Genome Atlas (TCGA) and the Chinese Glioma Genome Atlas (CGGA) databases. Furthermore, our research indicated for the first time that QSOX1 knockdown inhibited cell proliferation, migration, invasion and EMT in GBM. Moreover, the inhibitory effect of cell growth could be partially reversed by PI3K/Akt activator, which suggested that QSOX1 regulated malignant behavior via PI3K/Akt pathway.
Materials and Methods
Bioinformatic Analysis
Differential expression and prognosis of QSOX1 in glioma tissues were assessed by analyzing Gene Expression Profiling Interactive Analysis (GEPIA) database (http://GEPIA.cancer-pku.cn/index.html) and CGGA database (http://cgga.org.cn/).
Cell Culture
The human high-grade glioma (HGG) cell lines (U87, U251 and U343) were kind gifts from Dr. Xin Chen in Capital Medical University, while HEB astrocytes were purchased from Beijing winter song Boye Biotechnology (Beijing, China). Our acquisition and protocol for these cell lines were approved by the Ethic Committee of Beijing Tiantan Hospital, Capital Medical University, Beijing, China (No. KY201902043). U87 cells were authenticated by STR profile. U87, U251, U343 and HEB cell lines were cultured in Dulbecco’s modified Eagle’s medium (DMEM, Corning, NY, USA) containing 10% fetal bovine serum (HyClone, Logan, UT, USA) and 1% penicillin and streptomycin (Gibco, Rockville, MD, USA) in a 5% carbon dioxide incubator at 37°C. Patient-derived diffuse intrinsic pontine glioma cell lines TT150630 and TT150714 were cultivated as previously described.19 All of the above-mentioned cell lines were tested and confirmed to be negative for mycoplasma.
Plasmid Construction and Lentivirus Package
The three QSOX1 shRNA sequences (Lv-shQ1 GCTGAACACAGAGGCCAATGT, Lv-shQ2 GCACTACATCCTGCGGATAGA and Lv-shQ3 GCAACATCATCCTGGACTTCC) were designed from Sigma (https://www.sigmaaldrich.com/life-science/functional-genomics-and-rnai/sirna/mission-predesigned-sirna.html). Lentiviral shRNA plasmids and lentiviruses were generated as previously described.20 The empty vector was used as the shRNA control (NC).
RNA Isolation and Quantitative Real Time-Polymerase Chain Reaction (qRT-PCR)
Total RNA was extracted by Trizol (Thermo Fisher Scientific, Inc., St. Louis, MO, USA) according to the manufacturer’s instructions. Next, 2μg of total RNAs were reverse-transcribed using a commercial reverse transcription kit (abm, Zhenjiang, Jiangsu, China). qRT-PCRs were performed on a CFX384 Touch qRT-PCR instrument (Bio-Rad, Hercules, CA, USA) using SYBR Green (CWBIO, Beijing, China) and relative expression was assessed using the 2−ΔΔCt method and normalized to GAPDH. qRT-PCR primers used in our research are listed below.
QSOX1-Forward: 5ʹ-GGAAGCTTCTGGAAGTCGTG-3ʹ
QSOX1-Reverse: 5ʹ-CAAAAGACCAGGCTCAGAGG-3ʹ
GAPDH-Forward: 5ʹ-GATCATCAGCAATGCCTCCT-3ʹ
GAPDH-Reverse: 5ʹ-TGAGTCCTTCCACGATACCA-3ʹ
Cell Viability
2000 cells were plated into 96-well plates in quadruplicate. At indicated time points, cell viability was assessed by Celltiter Glo assay (Promega, Madison, WI, USA) and the bioluminescence signal was measured by a TECAN Infinite 2000 plate reader (TECAN, Maennedorf, Zürich, Switzerland). This experiment was performed in triplicate independently.
Colony Formation Assay
2000 cells were seeded in at least three replicates in 6-well plates and incubated at 37°C for 24 hours. Then, 8 µg/mL SC79 (Selleck, Pittsburgh, PA, USA) or dimethyl sulfoxide (DMSO) was added into the medium. After seven days, cells were fixed by methanol for 20 minutes and stained with 0.5% crystal violet for 10 minutes. Subsequently, the plates were rinsed in water to remove excessive crystal violet. The plates were scanned by an electronic scanner (Fuji Xerox, Tokyo, Japan).
Wound Healing Assay
4×10⁵ cells were plated into 6-well plate and incubate 24 hours in DMEM medium. Wounds were created by scratching the cell monolayer with a 1000ul pipette tip. Cells were cultured in the DMEM containing 2% fetal bovine serum (FBS) for another 24 hours and images were captured using a microscope (Zeiss, Jena, Germany). This experiment was performed in triplicate independently.
Migration and Invasion Assay
5×10⁴ cells suspended in serum-free DMEM were plated into 8 μm pore size inserts (Corning) for cell migration assay [without Matrigel (Corning)] and cell invasion assay (pre-coated with Matrigel for 2 hours). Then, the DMEM containing 10% FBS was added to the lower chamber to induce cell migration or invasion. After incubation at 37°C for 24 hours, the chambers were fixed by 4% paraformaldehyde for 30 minutes and then stained by 0.5% crystal violet for 10 minutes. Cells remaining on the upper surface of the membrane were gently removed with a cotton swab. The number of migration or invasion cells in the lower surface were counted in four random fields.
Western Blot
The cells were lysed with RIPA lysis buffer containing complete tablets (Roche, Basel, Switzerland) and phosphatase inhibitor (Sangon Biotech, Shanghai, China) on a shaker at 4°C overnight. Following quantification using Pierce BCA Protein Assay Kit (Thermo Fisher Scientific), equal amounts of proteins were boiled and loaded for Western blot analysis. PVDF membranes were incubated with primary antibody (1:1000) at 4°C overnight. Membranes were then incubated for 1 hour with HRP-conjugated anti-rabbit/mouse IgG secondary antibody (CWBIO) at room temperature. Protein bands were visualized using the enhanced chemiluminescence detection kit (Thermo Fisher Scientific) and the ChemiDoc Touch imaging system (Bio-rad). Primary antibodies used were GAPDH (abm), QSOX1 (Thermo Fisher Scientific, 12713-1-AP), E-cadherin (Cell Signaling Technology, Danvers, MA, USA, 3195), N-cadherin (BD Biosciences, San Jose, CA, USA, 610920), vimentin (Thermo Fisher Scientific, MA5-16409), phospho-PI3K (Cell Signaling Technology, 4228T), PI3K (Cell Signaling Technology, 4257T), phospho-Akt (Cell Signaling Technology, 4060T) and Akt (Cell Signaling Technology, 4691T). The intensities were measured by Image J software.
In vivo Experiments
All in vivo experiments were approved by the Committee on the Ethics of Animal Experiments, of Beijing Tiantan Hospital and performed in accordance with the guidelines for the Care and Use of Laboratory Animals, Committee on the Ethics of Animal Experiments, Beijing Tiantan Hospital.
106 active U87 cells infected with Lv-shQ2 or NC lentivirus were suspended in 200μL PBS and subcutaneously injected into a group of six BALB/c nude mice, respectively. After 1 month, the mice were sacrificed and the xenografts were excised, weighed and fixed subsequently.
Hematoxylin-Eosin Staining (H&E) and Immunohistochemistry
Serial sections at 5 μm thickness were prepared and deparaffinized according to standard protocol. Next, the sections were stained with hematoxylin and eosin (Sangon Biotech) in accordance with manufacturer’s guideline. Other slides were incubated with anti-Ki67 (Invitrogen), anti-QSOX1 and anti-GFAP (Invitrogen) primary antibody overnight at 4°C. Subsequently, sections were visualized using DAB and co-stained with hematoxylin (Sangon Biotech), mounted with neutral gum (CWBIO) and captured by the microscope (Zeiss).
Statistics
All results were presented as the mean ± standard deviation (SD) from at least three replicates independently. One-way analysis of variance (ANOVA) or Student’s unpaired t-test was utilized to analyze significance using GraphPad Prism 7.0 (GraphPad Software, Inc., La Jolla, CA, USA). Kaplan–Meier method and Log rank test were carried out for survival analysis. P < 0.05 were considered to indicate statistical significance.
Results
Upregulation of QSOX1 Was Correlated with Poor Prognosis in HGG
Firstly, to evaluate the role of QSOX1 in the progression of glioma, the expression level of QSOX1 was analyzed in the CGGA and TCGA databases. We found a significant increase of QSOX1 in the HGG compared with the low-grade glioma (LGG) and normal brain (Figure 1A and B, Supplementary Figure 1A). Importantly, Kaplan-Meier survival analysis suggested that HGG patients with lower QSOX1 expression were significantly correlated with longer overall survival time, while no statistical difference in LGG patients (Figure 1C–E, Supplementary Figure 1B, C). Next, the expression levels of five HGG and one normal astrocyte cell lines were detected by qRT-PCR (Figure 1F). U87 and U251 cells were selected for our further loss-of-function experiments due to their high expression of QSOX1 among the five HGG cell lines. Hence, QSOX1 was upregulated in glioma, especially HGG, and negatively correlated with overall survival.
 |
Figure 1 QSOX1 was upregulated in glioma with poor prognosis. (A) The expression level of QSOX1 between GBM tissues (red bar, n=163) and normal tissues (black bar, n=207) in the TCGA database. (B) The expression level of QSOX1 between different pathology stages of glioma tissues. (C–E) Kaplan-Meier survival curves of glioma patients based on QSOX1 expression in the TCGA database (C) and CGGA database which includes primary glioma patients (D) and recurrent glioma patients (E). (F) QSOX1 expression levels in human astrocytes HEB and five HGG cell lines. Notes: *P < 0.05, ****P < 0.0001. Abbreviations: T, GBM tumor tissue; N, normal tissue; ns, no significant. |
QSOX1 Promoted GBM Cell Proliferation and Colony Formation
To unveil the biological functions of QSOX1 in GBM, three different lentiviral shRNAs were used to stably knockdown the QSOX1 expression in U87 and U251 GBM cell lines. The knockdown efficiencies were detected by qRT-PCR (Figure 2A) and verified by Western Blot (Figure 2B). The two most efficient shRNAs, Lv-shQ1 and Lv-shQ2 were chosen for lentivirus packages for further experiments.
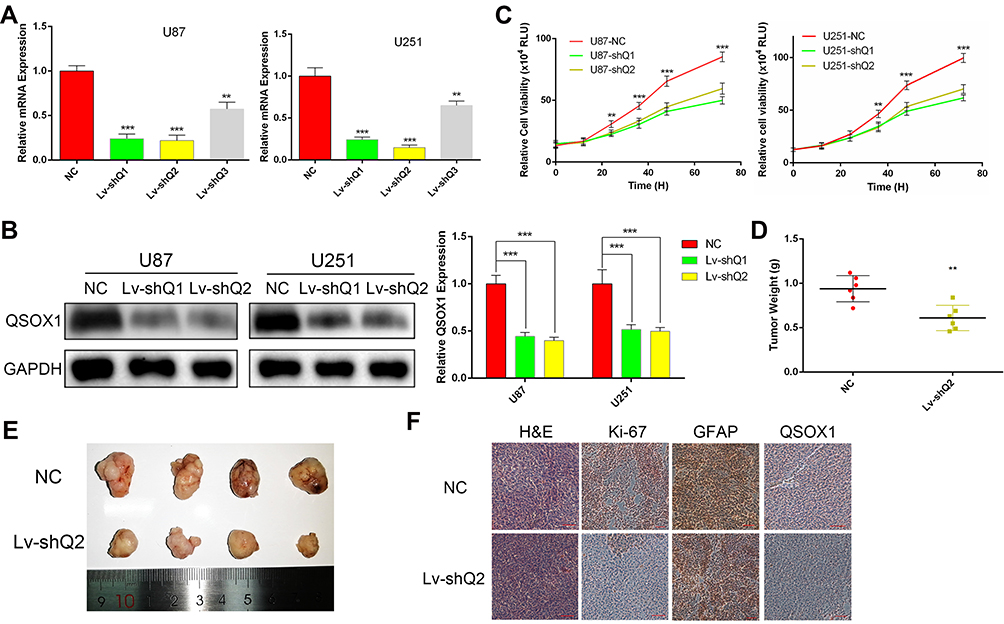 |
Figure 2 Knockdown of QSOX1 decreased GBM cell growth. (A) The expression levels of QSOX1 evaluated by qRT-PCR in HGG and astrocyte cell lines. (B) Stable knockdown of QSOX1 in U87 and U251 cell lines was detected by Western blot. (C) Cell proliferation was measured by Celltiter-Glo assay for up to 72 hours. (D) The weights of xenograft tumors derived from subcutaneous implantation of U87 cells infected with NC or Lv-shQ2. (E) Representative image of tumors resected from the immunodeficient mice. (F) Representative immunohistochemical images of H&E, QSOX1, Ki-67 and GFAP. Scale bar, 200 μm. Notes: **P < 0.01, ***P < 0.001. Abbreviations: RLU, relative light units; H&E, hematoxylin-eosin staining; GFAP, glial fibrillary acidic protein. |
As expected, the cell viability decreased remarkably after inhibition of QSOX1 expression measured by Celltiter-Glo assay (Figure 2C). To verify whether QSOX1 promoted tumor growth in vivo, we concurrently injected NC or Lv-shQ2 U87 cells into immunodeficient mice to establish the xenograft mouse models and grouped them into the NC and Lv-shQ2 group randomly. The results demonstrated that tumor weights were decreased by ~35% in the Lv-shQ2 group compared with the NC group after 30 days (Figure 2D and E). Furthermore, the immunohistochemical assay revealed significantly down-regulated levels of QSOX1 and Ki-67 in the tumor tissues of nude mice treated with Lv-shQ2 compared to that in controls, while the intensity of GFAP, a common GBM marker,21 was similar between QSOX1 knockdown and control group (Figure 2F).
Silencing QSOX1 Inhibited GBM Cells Migration, Invasion and EMT
Accumulating studies have demonstrated that QSOX1 affects tumor microenvironment and extracellular matrix.22 As a result, we utilized wound healing, transwell migration and matrigel invasion assays to evaluate the migration and invasion ability influenced by QSOX1 knockdown. In agreement with our speculation, both the migration and invasion ability of U87 and U251 cells significantly reduced after QSOX1 knockdown (Figure 3A). Meanwhile, the wound healing rate decreased by over 50% in the two shQSOX1 groups (Figure 3B). These results indicated that silencing QSOX1 could inhibit the migration and invasion of GBM cells.
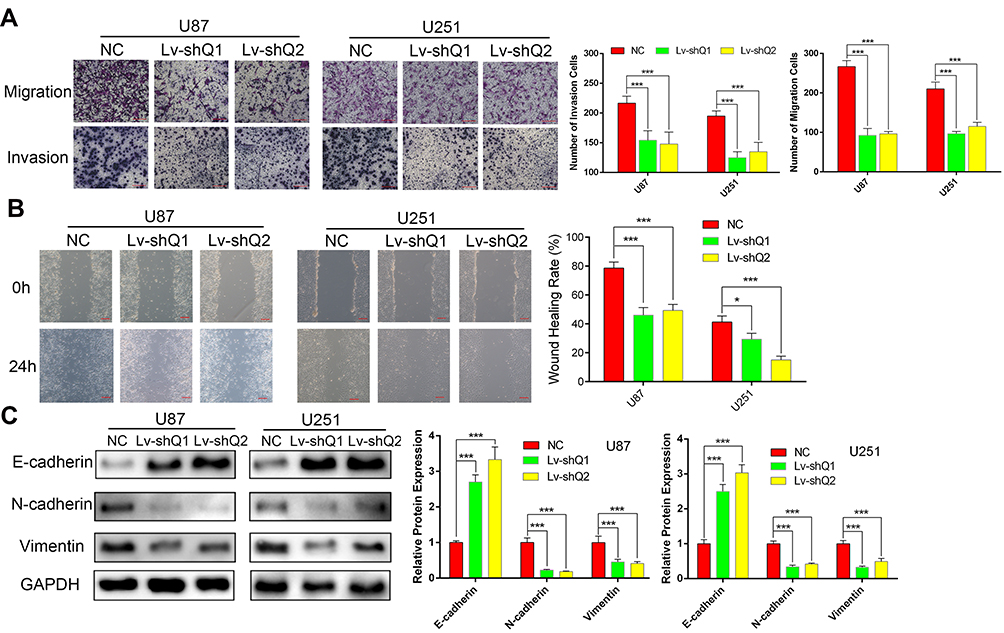 |
Figure 3 Downregulation of QSOX1 inhibited GBM cell migration, invasion and EMT. (A) Effect of QSOX1 on the migration and invasion of glioma cell lines. Scale bar, 200 μm. (B) The QSOX1-knockdown glioma cells demonstrated a lower wound closure rate than the NC group. Scale bar, 200μm. (C) The protein levels of EMT markers in U87 and U251 cells transfected with Lv-shQ1, Lv-shQ2 and NC. Notes: *P < 0.05, ***P < 0.001. |
Base on the above-mentioned results and previous investigations,23 we supposed that QSOX1 inhibited EMT in GBM. It is well accepted that N-cadherin, E-cadherin and vimentin are considered classical EMT markers. As indicated by Western blot assay, the expression level of E-cadherin was increased in QSOX1-knockdown U87 and U251 cell lines compared with the corresponding NC group. On the contrary, N-cadherin and vimentin showed the opposite trend (Figure 3C).
Silencing QSOX1 Inhibited GBM Cell Proliferation and Migration Partially by Blocking the PI3K/Akt Pathway
Due to the PI3K/Akt pathway controls many cellular processes that are important for the formation and progression of cancer,24 we wondered if QSOX1 inhibited PI3K/Akt pathway. As shown in Figure 4A, silencing QSOX1 significantly reduced phospho-PI3K and phospho-Akt levels in U87 and U251 cells.
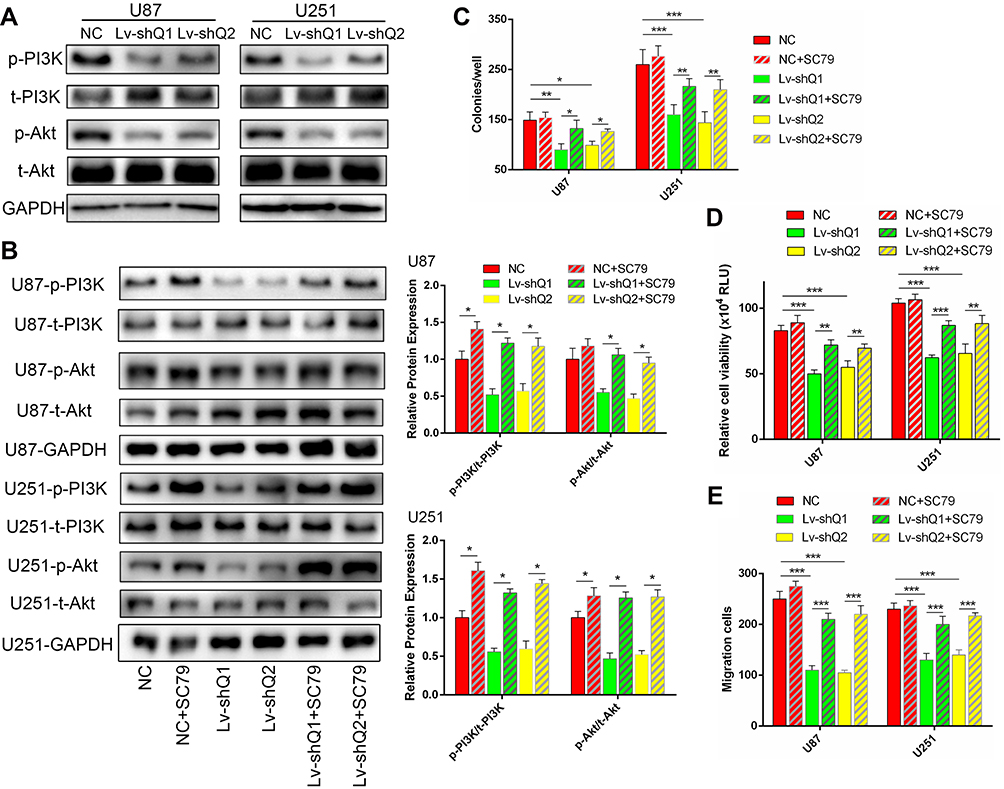 |
Figure 4 The PI3K/Akt pathway activator reversed the effects of QSOX1 knockdown on cell growth in vitro. (A) The protein levels of phospho-PI3K (p-PI3K), total-PI3K (t-PI3K), phospho-Akt (p-Akt) and total-Akt (t-Akt) were assessed by Western blot in the Lv-shQ1, Lv-shQ2 and NC groups. (B–D) U87 and U251 cells were transfected with Lv-shQ1/Lv-shQ1+SC79/Lv-shQ2/Lv-shQ2+SC79, NC or NC+SC79 as the control. (B) The SC79 activated the PI3K/Akt axis monitored by Western blot. (C–E) Quantification of colony numbers (C), cell viability (D) and migration cells (E) in the control and treated groups. Notes: *P < 0.05, **P < 0.01, ***P < 0.001. Abbreviations: p-PI3K, phosphorylation of PI3K; t-PI3K, phosphatidylinositol 3 kinase; p-Akt, phosphorylation of Akt; t-Akt, protein kinase B; RLU, relative light units. |
To determine the roles of PI3K/Akt signaling pathway in QSOX1-related tumorigenicity, QSOX1-knockdown and the corresponding NC GBM cells were seeded in the medium with or without 8 μg/mL SC79, a novel brain-penetrable Akt phosphorylation activator. Western blot analysis confirmed that SC79 effectively increased the protein levels of phosphorylated PI3K and Akt in the NC and QSOX1-knockdown GBM cells (Figure 4B). Afterward, colony formation, Celltiter-Glo and Transwell assays were utilized to assess cell growth, proliferation and migration. Strikingly, the results indicated that the upregulation of PI3K/Akt signaling pathway rescued the QSOX1 knockdown-impaired cell growth, proliferation and migration in vitro (Figure 4C–E, Supplementary Figure 2A, B). Taken together, our findings suggested that QSOX1 regulated cell proliferation and migration partially through PI3K/Akt pathway.
Discussion
Although QSOX1 is well accepted as an enzyme that oxidizes thiols during protein folding,25 the biological functions in glioma progression remain puzzled. Recently, several studies have been reported that QSOX1 could function as an oncogene.5,7 Katchman et al reported that QSOX1 promoted the proteolytic activity of matrix metalloproteins secreted by tumor cells and helped tumor cells invade through a basement membrane and gain access to the bloodstream.26 Also, Fifield et al identified that an oral inhibitor of QSOX1 suppressed renal cell carcinoma growth in vivo.5 However, some controversy reveals that QSOX1 acts as a biomarker of a favorable outcome in certain breast tumors.27 In our study, we found that QSOX1 was upregulated in GBM tissues and partially correlated with the stages of glioma. More importantly, high QSOX1 expression was associated with poor overall survival outcome in HGG, which was consistent with most previous studies in other tumors.26 To our best knowledge, this was the first investigation of QSOX1 function in glioma.
EMT is a transformation process by which the static epithelial cells transfer to motile cells and manipulating some parts of the molecular program.28 The EMT enables glioma cells to survive from the primary tumor site, which is a major process for therapy resistance.29 Recently, the EMT-derived molecular mechanisms have been studied deeply and emphasize the suppression of E-cadherin together with other epithelial marker genes paralleled by overexpression of mesenchymal marker genes including N-cadherin, vimentin and fibronectin.30 In GBM, MES subtype was characterized by high expression of mesenchymal genes, predicting the poor survival outcome. Accumulating evidence suggested that different GBM subtypes can co-exist and shift in the same tumor,31,32 which implicated that mesenchymal genes might induce the PN-MES occurrence. We found that QSOX1 knockdown inhibited the proliferation, migration, invasion and the EMT progress of GBM cells. These data indicated that QSOX1 might be an indicator of metastasis and demonstrated a novel mechanism for QSOX1 in the GBM subtype transition.
Although the activation of PI3K/Akt pathway plays a crucial role in mesenchymal cells33 and glioma malignancy,34 the interaction between QSOX1 and PI3K/Akt axis is not fully elucidated. Thus, we observed that silencing QSOX1 inactivated PI3K/Akt signaling pathway. Moreover, the cell growth inhibited by QSOX1 knockdown could be partially rescued by using Akt activator. These data suggested that QSOX1 knockdown could inhibit cell growth partially via inactivating PI3K/Akt pathway.
Conclusion
Collectively, the abundance of QSOX1 was aberrantly increased in GBM tissue and cell lines. Our research first demonstrated that knockdown of QSOX1 suppressed GBM cell proliferation, invasion and migration via inactivating PI3K/Akt pathway, providing a promising biomarker and therapeutic target of GBM.
Acknowledgments
This work was supported by the Beijing Medical Research “Multi-center Clinical Big Data Study and Multi-path Tumorigenesis Mechanisms and Precision Treatment Research on Brainstem Glioma” [Grant No. 2018-7]; and the National Natural Science Foundation of China [Grant No. 81872048].
Disclosure
The authors report no conflicts of interest in this work.
References
1. Ostrom QT, Cioffi G, Gittleman H, et al. CBTRUS statistical report: primary brain and other central nervous system tumors diagnosed in the United States in 2012–2016. Neuro Oncol. 2019;21(Suppl 5):v1–v100. doi:10.1093/neuonc/noz150
2. Wick W, Osswald M, Wick A, Winkler F. Treatment of glioblastoma in adults. Ther Adv Neurol Disord. 2018;11:1756286418790452. doi:10.1177/1756286418790452
3. Chuang DF, Lin X. Targeted therapies for the treatment of glioblastoma in adults. Curr Oncol Rep. 2019;21(7):61. doi:10.1007/s11912-019-0807-1
4. Verhaak RG, Hoadley KA, Purdom E, et al. Integrated genomic analysis identifies clinically relevant subtypes of glioblastoma characterized by abnormalities in PDGFRA, IDH1, EGFR, and NF1. Cancer Cell. 2010;17(1):98–110. doi:10.1016/j.ccr.2009.12.020
5. Fifield AL, Hanavan PD, Faigel DO, et al. Molecular inhibitor of QSOX1 suppresses tumor growth in vivo. Mol Cancer Ther. 2020;19(1):112–122. doi:10.1158/1535-7163.MCT-19-0233
6. Zhang XF, Wang J, Jia HL, et al. Core fucosylated glycan-dependent inhibitory effect of QSOX1-S on invasion and metastasis of hepatocellular carcinoma. Cell Death Discov. 2019;5(1):84. doi:10.1038/s41420-019-0164-8
7. Sung HJ, Ahn JM, Yoon YH, et al. Quiescin sulfhydryl oxidase 1 (QSOX1) secreted by lung cancer cells promotes cancer metastasis. Int J Mol Sci. 2018;19(10):3213. doi:10.3390/ijms19103213
8. Knutsvik G, Collett K, Arnes J, Akslen LA, Stefansson IM. QSOX1 expression is associated with aggressive tumor features and reduced survival in breast carcinomas. Mod Pathol. 2016;29(12):1485–1491. doi:10.1038/modpathol.2016.148
9. Baek JA, Song PH, Ko Y, Gu MJ. High expression of QSOX1 is associated with tumor invasiveness and high grades groups in prostate cancer. Pathol Res Pract. 2018;214(7):964–967. doi:10.1016/j.prp.2018.05.019
10. Shergalis A, Bankhead A
11. Szopa W, Burley TA, Kramer-Marek G, Kaspera W. Diagnostic and therapeutic biomarkers in glioblastoma: current status and future perspectives. Biomed Res Int. 2017;2017:8013575. doi:10.1155/2017/8013575
12. Liu F, Hon GC, Villa GR, et al. EGFR mutation promotes glioblastoma through epigenome and transcription factor network remodeling. Mol Cell. 2015;60(2):307–318. doi:10.1016/j.molcel.2015.09.002
13. Yang K, Tang XJ, Xu FF, et al. PI3K/mTORC1/2 inhibitor PQR309 inhibits proliferation and induces apoptosis in human glioblastoma cells. Oncol Rep. 2020;43(3):773–782. doi:10.3892/or.2020.7472
14. Harder BG, Peng S, Sereduk CP, et al. Inhibition of phosphatidylinositol 3-kinase by PX-866 suppresses temozolomide-induced autophagy and promotes apoptosis in glioblastoma cells. Mol Med. 2019;25(1):49. doi:10.1186/s10020-019-0116-z
15. Ma DJ, Galanis E, Anderson SK, et al. A phase II trial of everolimus, temozolomide, and radiotherapy in patients with newly diagnosed glioblastoma: NCCTG N057K. Neuro Oncol. 2015;17(9):1261–1269. doi:10.1093/neuonc/nou328
16. Sarkaria JN, Galanis E, Wu W, et al. North central cancer treatment group phase I trial N057K of everolimus (RAD001) and temozolomide in combination with radiation therapy in patients with newly diagnosed glioblastoma multiforme. Int J Radiat Oncol Biol Phys. 2011;81(2):468–475. doi:10.1016/j.ijrobp.2010.05.064
17. Lapointe S, Mason W, MacNeil M, et al. A phase I study of vistusertib (dual mTORC1/2 inhibitor) in patients with previously treated glioblastoma multiforme: a CCTG study. Invest New Drugs. 2019. doi:10.1007/s10637-019-00875-4
18. Kaley TJ, Panageas KS, Pentsova EI, et al. Phase I clinical trial of temsirolimus and perifosine for recurrent glioblastoma. Ann Clin Transl Neurol. 2020;7(4):429–436. doi:10.1002/acn3.51009
19. Xu C, Liu X, Geng Y, et al. Patient-derived DIPG cells preserve stem-like characteristics and generate orthotopic tumors. Oncotarget. 2017;8(44):76644–76655. doi:10.18632/oncotarget.19656
20. Hu XL, Chen G, Zhang S, et al. Persistent expression of VCAM1 in radial glial cells is required for the embryonic origin of postnatal neural stem cells. Neuron. 2017;95(2):309–325 e306. doi:10.1016/j.neuron.2017.06.047
21. Ahmadipour Y, Gembruch O, Pierscianek D, Sure U, Jabbarli R. Does the expression of glial fibrillary acid protein (GFAP) stain in glioblastoma tissue have a prognostic impact on survival? Neurochirurgie. 2020. doi:10.1016/j.neuchi.2019.12.012
22. Grossman I, Alon A, Ilani T, Fass D. An inhibitory antibody blocks the first step in the dithiol/disulfide relay mechanism of the enzyme QSOX1. J Mol Biol. 2013;425(22):4366–4378. doi:10.1016/j.jmb.2013.07.011
23. Ilani T, Alon A, Grossman I, et al. A secreted disulfide catalyst controls extracellular matrix composition and function. Science. 2013;341(6141):74–76. doi:10.1126/science.1238279
24. Wang Q, Shi M, Sun S, et al. CLEC5A promotes the proliferation of gastric cancer cells by activating the PI3K/AKT/mTOR pathway. Biochem Biophys Res Commun. 2020;524(3):656–662. doi:10.1016/j.bbrc.2019.10.122
25. Horowitz B, Javitt G, Ilani T, et al. Quiescin sulfhydryl oxidase 1 (QSOX1) glycosite mutation perturbs secretion but not Golgi localization. Glycobiology. 2018;28(8):580–591. doi:10.1093/glycob/cwy044
26. Katchman BA, Ocal IT, Cunliffe HE, et al. Expression of quiescin sulfhydryl oxidase 1 is associated with a highly invasive phenotype and correlates with a poor prognosis in luminal B breast cancer. Breast Cancer Res. 2013;15(2):R28. doi:10.1186/bcr3407
27. Pernodet N, Hermetet F, Adami P, et al. High expression of QSOX1 reduces tumorogenesis, and is associated with a better outcome for breast cancer patients. Breast Cancer Res. 2012;14(5):R136. doi:10.1186/bcr3341
28. Kalluri R, Weinberg RA. The basics of epithelial-mesenchymal transition. J Clin Invest. 2009;119(6):1420–1428. doi:10.1172/JCI39104
29. Smith BN, Bhowmick NA. Role of EMT in metastasis and therapy resistance. J Clin Med. 2016;5(2):17. doi:10.3390/jcm5020017
30. Sanchez-Tillo E, Liu Y, de Barrios O, et al. EMT-activating transcription factors in cancer: beyond EMT and tumor invasiveness. Cell Mol Life Sci. 2012;69(20):3429–3456.
31. Sottoriva A, Spiteri I, Piccirillo SG, et al. Intratumor heterogeneity in human glioblastoma reflects cancer evolutionary dynamics. Proc Natl Acad Sci U S A. 2013;110(10):4009–4014. doi:10.1073/pnas.1219747110
32. Patel AP, Tirosh I, Trombetta JJ, et al. Single-cell RNA-seq highlights intratumoral heterogeneity in primary glioblastoma. Science. 2014;344(6190):1396–1401. doi:10.1126/science.1254257
33. Salt MB, Bandyopadhyay S, McCormick F. Epithelial-to-mesenchymal transition rewires the molecular path to PI3K-dependent proliferation. Cancer Discov. 2014;4(2):186–199. doi:10.1158/2159-8290.CD-13-0520
34. Nicoletti NF, Erig TC, Zanin RF, et al. Mechanisms involved in kinin-induced glioma cells proliferation: the role of ERK1/2 and PI3K/Akt pathways. J Neurooncol. 2014;120(2):235–244. doi:10.1007/s11060-014-1549-4
 © 2020 The Author(s). This work is published and licensed by Dove Medical Press Limited. The full terms of this license are available at https://www.dovepress.com/terms.php and incorporate the Creative Commons Attribution - Non Commercial (unported, v3.0) License.
By accessing the work you hereby accept the Terms. Non-commercial uses of the work are permitted without any further permission from Dove Medical Press Limited, provided the work is properly attributed. For permission for commercial use of this work, please see paragraphs 4.2 and 5 of our Terms.
© 2020 The Author(s). This work is published and licensed by Dove Medical Press Limited. The full terms of this license are available at https://www.dovepress.com/terms.php and incorporate the Creative Commons Attribution - Non Commercial (unported, v3.0) License.
By accessing the work you hereby accept the Terms. Non-commercial uses of the work are permitted without any further permission from Dove Medical Press Limited, provided the work is properly attributed. For permission for commercial use of this work, please see paragraphs 4.2 and 5 of our Terms.