")
Back to Journals » International Journal of Nanomedicine » Volume 12
Quercetin nanoparticle complex attenuated diabetic nephropathy via regulating the expression level of ICAM-1 on endothelium
Authors Tong F , Liu S, Yan B, Li X, Ruan S, Yang S
Received 21 July 2017
Accepted for publication 25 September 2017
Published 24 October 2017 Volume 2017:12 Pages 7799—7813
DOI https://doi.org/10.2147/IJN.S146978
Checked for plagiarism Yes
Review by Single anonymous peer review
Peer reviewer comments 3
Editor who approved publication: Dr Linlin Sun
Fei Tong,1,2 Suhuan Liu,1 Bing Yan,1 Xuejun Li,1 Shiwei Ruan,3 Shuyu Yang1
1Department of Endocrinology and Diabetes, The First Affiliated Hospital, Xiamen University, Xiamen, 2Department of Pathology and Pathophysiology, Provincial Key Discipline of Pharmacology, Jiaxing University Medical College, Jiaxing, Zhejiang, 3Academy of Integrative Medicine, Fujian University of Traditional Chinese Medicine, Fuzhou, People’s Republic of China
Abstract: The purpose of the study was to reveal the therapeutic effect of quercetin (QUE) nanoparticle complex on diabetic nephropathy (DN) by regulating the expression of intercellular adhesion molecular-1 (ICAM-1) on endothelium as compared to free QUE. QUE 10 mg/kg as a single abdominal subcutaneous injection daily for 8 weeks continuously in diabetic rats and 10 mg/kg QUE nanoparticle complex as a single abdominal subcutaneous injection every 5 days, continuously administered for 8 weeks to diabetic rats. Blood and left kidneys were collected; pathological change of kidney, renal function, oxidative stress level, blood glucose level, serum lipid, urine protein, and albumin/creatinine ratio were measured; and neutrophil adhesion, ICAM-1 expression, and CD11b+ cells infiltration were observed. Both QUE and QUE nanoparticle complex preconditioning ameliorated the pathological damage of kidney and improved renal function, alleviated renal oxidative stress injury, restricted inflammatory cells infiltration, and downregulated the ICAM-1 expression as compared to DN group, while QUE nanoparticle complex significantly alleviated this effect.
Keywords: nanoparticle complex, quercetin, DN, ICAM-1, CD11b+, endothelium
Corrigendum for this paper has been published
Introduction
Approximately one-third of long-standing diabetes leads to nephropathy.1,2 Diabetic nephropathy (DN) is a life-threatening complication in diabetes mellitus and is the biggest single cause of end-stage kidney diseases.3–7 The mechanism involved in DN ranges from oxidative stress, derangement of glucose metabolism, and the activation of abundant inflammatory mediators and cell factors to cellular death.8–10 In particular, constant hyperglycemia is the proegumenal cause of initiation, promotion, and sustentation of DN.11 Quercetin (QUE) belongs to plant flavonoid and possesses potent anti-oxidant properties in vitro, and recent data have shown that QUE may have anti-cancer and anti-inflammatory functions in vivo.12 In the current study, QUE can attenuate DN and is an effective treatment for DN; the result is consistent with previous documents.12,13 However, poor water solubility, low bioavailability, and short half-life of QUE restrict its use in vivo.14 Recent researches affirm that drug delivery via nanoparticles can improve efficacy with decreasing side effects.15 In this regard, poly(ethylene glycol)-block-(poly(ethylenediamine l-glutamate)-graft-poly(ε-benzyloxycarbonyl-l-lysine)) (PEG-b-(PELG-g-PZLL)) is synthesized and QUE/PEG-b-(PELG-g-PZLL) (QUE/P) nanoparticle complex is measured in vitro and vivo.
Several researches suggest that endothelial cells (ECs) are sensitive to DN and they might be a critical mediator of DN.16,17 Under normal condition, ECs offer a protective barrier between lumen and vascular smooth muscle of blood vessel, and the ECs are momentous players in modulating blood flow, neutrophil, complement activation, and renal function.18–21 The EC surface proteins involved in DN are known as cell adhesion molecules (CAMs), which are distributed at various time courses of activations and expressions.22,23 The original interactions between polymorphonuclear (PMN) cells and ECs are mediated via CAM expressed on the EC surface.24 This CAM-mediated interaction leads to the rolling of PMNs along vessel walls and upregulation of intercellular adhesion molecule-1 (ICAM-1) on the PMNs.23,24 As a result, CD11b+ associates with its counter receptors on ECs, mainly ICAM-1, leading to their firm adhesion and transmigration by vascular wall.25,26 Substantial evidence indicates that expression of adhesion molecules via glomerular ECs is increased following DN.17,27,28 Therefore, understanding discovery of ECs will improve the effective therapies, which can be applied in DN procedure.
QUE is a representative flavonoid that alleviates DN.29 Many documents have proved that treatment with QUE remarkably ameliorates renal dysfunction and oxidative stress injury in DN.3 In addition, QUE acts as an anti-inflammatory factor (such as ICAM-1) and modulates CD11b+, which may have implications for strategies attenuating endothelial dysfunction.30–32 In this study, QUE regulates endothelial expression of ICAM-1 and attenuates inflammatory cell infiltration (CD11b+), and ameliorates glucose metabolism and lipid metabolism disorder in DN. As is well known, the in vivo solubility of QUE is very low and circulation time is extremely short.14 Here, a PEG-b-(PELG-g-PZLL) carrier (Scheme 1; Figure 1G) as a potential QUE nanoparticle (Figure 1G) is reported. The PEG-b-(PELG-g-PZLL) and QUE form a compound via hydrophobic interaction (Figure 1G). The loaded QUE confirms stable and sustained release, which can develop the study on the protective effect of QUE. QUE encapsulation and in vitro release are affirmed. In vivo study is implemented by the hypodermic injection of QUE/P nanoparticle to DN in diabetic rats, followed by the measurement of blood urine nitrogen (BUN), serum creatinine (Scr), blood glucose, and serum lipid; detections of superoxide dismutase (SOD) activity and methane dicarboxylic aldehyde content in renal tissues; inspection of urine protein and albumin/creatinine ratio; and finally neutrophil adhesion, ICAM-1 expression, and CD11b+ cells infiltration.
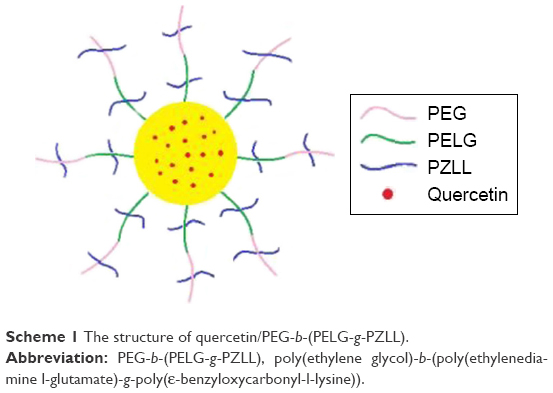 | Scheme 1 The structure of quercetin/PEG-b-(PELG-g-PZLL). |
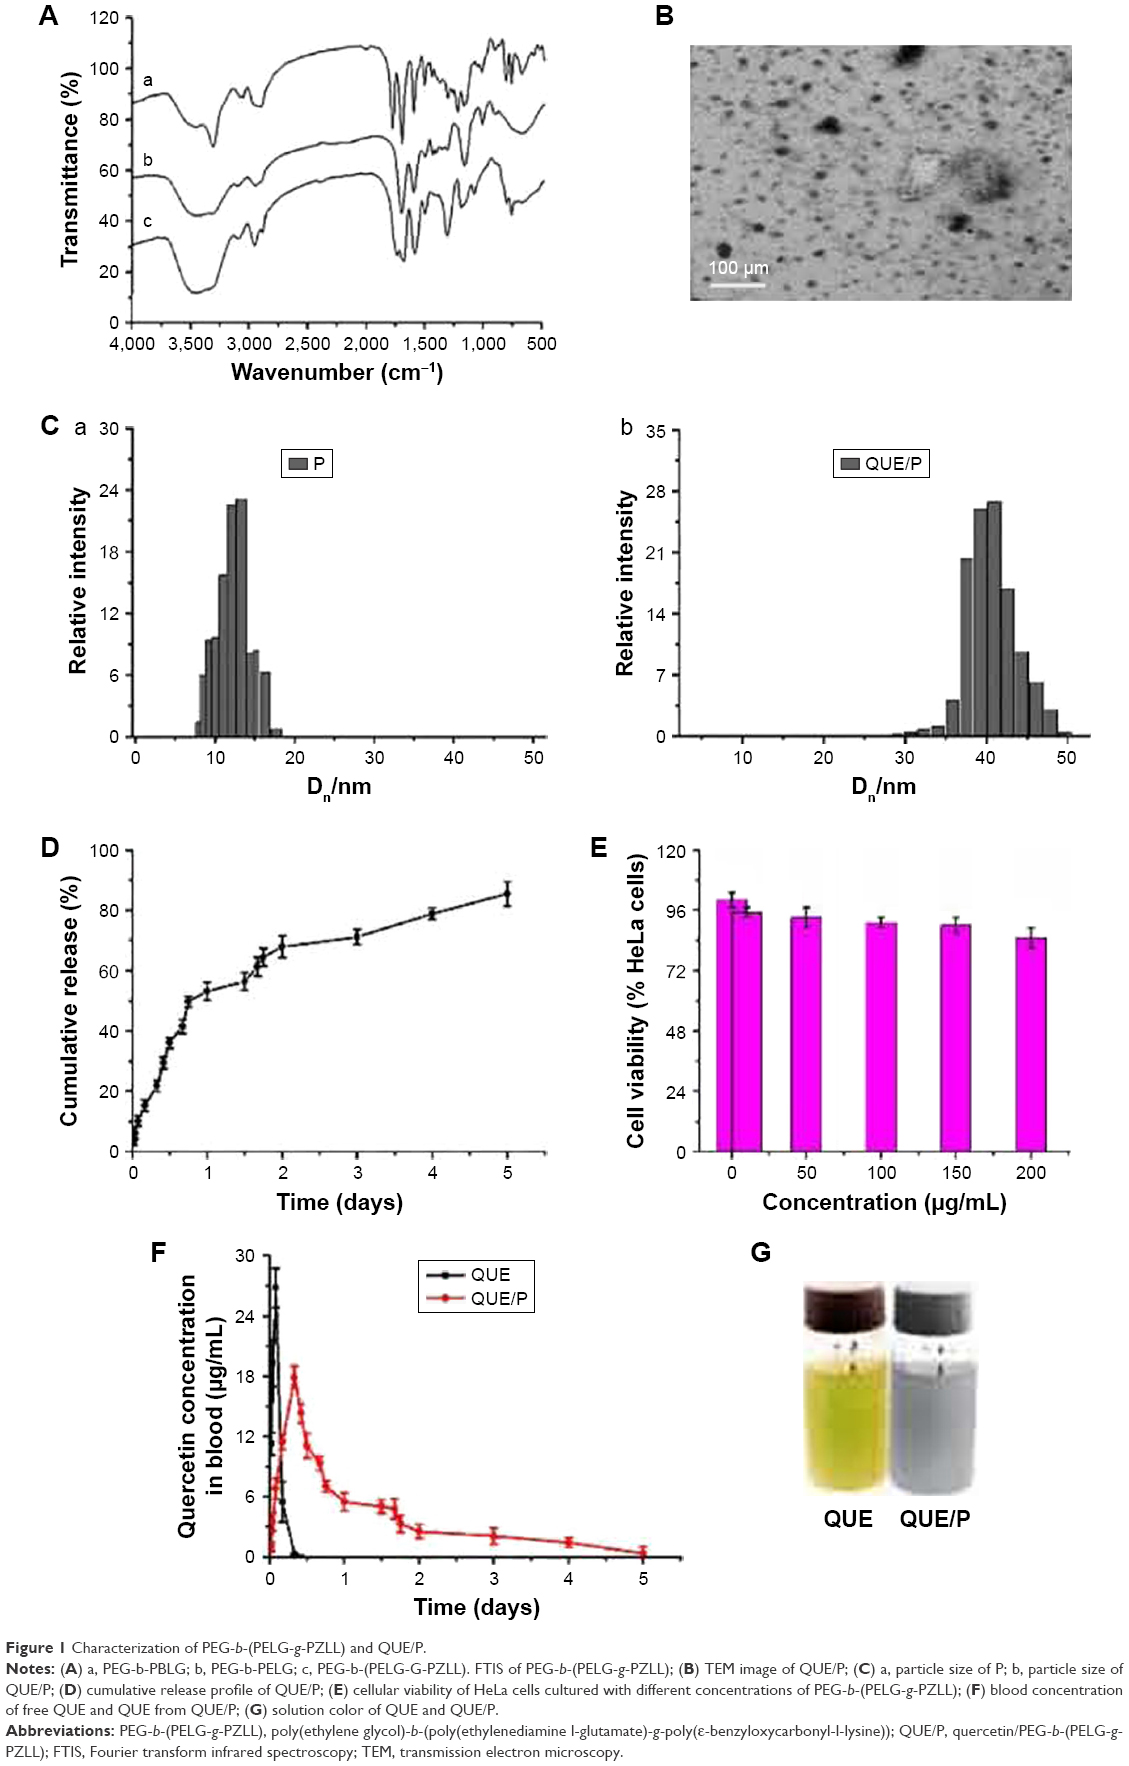 | Figure 1 Characterization of PEG-b-(PELG-g-PZLL) and QUE/P. |
Materials and methods
Materials
PEG-NH2 (molecular weight =5 kDa), BLG, and ε-benzyloxycarbonyl-l-lysine were purchased from Aladdin (Shanghai, People’s Republic of China); QUE was purchased from Shanghai excellent Biotechnology Co., Ltd; HeLa cell was purchased from Shanghai Hao Ran Biological Technology Co., Ltd; human umbilical vein endothelial cells (HUVECs) were purchased from Shanghai Bioleaf Biotech Co., Ltd; streptozotocin and other reagents were purchased from Nanjing Built Biological Technology Co., Ltd and Sigma.
Methods
Synthesis of PEG-b-(PELG-g-PZLL)
Synthesis of PEG-b-(PELG-g-PZLL) was elaborated in our previous works.33
Cytotoxicity evaluation of PEG-b-(PELG-g-PZLL)
Cytotoxicity evaluation of PEG-b-(PELG-g-PZLL) mainly referred to our previous works.33
Loading of QUE through PEG-b-(PELG-g-PZLL)
To investigate the encapsulation of QUE through PEG-b-(PELG-g-PZLL), a fixed amount of QUE (5 mg/mL) in PBS was associated with PEG-b-(PELG-g-PZLL) in PBS and then dialyzed via dialysis bag (MWCO =7 kDa). The PEG-b-(PELG-g-PZLL)-encapsulated QUE was measured by high-performance liquid chromatography (HPLC) and transmission electron microscopy (TEM).
In vitro release
QUE release from PEG-b-(PELG-g-PZLL) was assessed via dialysis (MWCO =7 kDa) at 37°C with 5 mL of QUE/P compound against 80 mL of 0.02 mol/L PB. At (0.02–5) day time interval, a fixed amount of release medium was extracted and replenished with a proper amount of fresh release medium. The quantity of released QUE remaining in the dialysis bag was assessed via HPLC. The free QUE release in the absence of polymeric compound was also implemented as a control.
Animals
Male Sprague Dawley rats (170–230 g) were obtained from Jiaxing University, Medical College, Jiaxing, People’s Republic of China. The procedures and care of the Sprague Dawley rats were authorized by the Institutional Ethics Committee of Jiaxing University, Medical College, Jiaxing, People’s Republic of China. The expedition conformed to the guide for the care and use of laboratory animal published by the US National Institutes of Health (NIH Publication updated in 2011).
Blood QUE concentration assessment
Sprague Dawley rats were administrated a dose of 10 mg/kg QUE or QUE/P via abdominal subcutaneous injection. A volume of 0.2 mL blood was extracted at a fixed time interval from aorta abdominalis and then separated promptly via centrifugation (12,000× g for 20 min), and immediately stored at −80°C for the following analyses. The concentrations of QUE and QUE/P were evaluated via HPLC following the previous reports.34
Distribution of QUE/P compound in Sprague Dawley rats
Sprague Dawley male rats were administrated a dose of 10 mg/kg QUE/P via abdominal subcutaneous injection. To extract left kidneys into test tubes, miscible liquids including 0.2 mL 60% perchloric acid and 0.2 mL 30% hydrogen peroxide were added. The sample was kept in a 80°C water bath for 50 min and then color of the sample changed to faint yellow. To extract 0.2 mL of tissue liquid, 1 mL of scintillation solution and 3 mL of absolute ethyl alcohol were added, and then radioactivity of the left kidney was measured via TRI-CARB2900 TR liquid scintillation counter (PACKARB) following previous methods.35
Diabetic animal procedure
Male Sprague Dawley rats were administrated a high-fat diet (fat content 40%) for 10 weeks and then streptozotocin was injected only once at a dose of 35 mg/kg through abdomina. After 3 days, diabetes was evaluated by checking blood glucose content using glucose oxidase-peroxidase (GOD-POD) methods.36 Animals with blood glucose content >16.7 mmol/L were used in the study.
Therapeutic assessment of QUE/P compound in diabetic rats
Thirty diabetic rats were randomly assigned to three groups (n=10, each group): 1) control group; 2) QUE group: 10 mg/kg as a single abdominal subcutaneous injection; 3) QUE/P group: 10 mg/kg as a single abdominal subcutaneous injection. At a fixed time, blood glucose contents were checked by GOD-POD ways.36
QUE/P suppresses neutrophil adhesion in vivo
To study the functional relevance of QUE/P, we checked the effect of QUE/P on leukocyte adhesion to ECs. The detailed process mainly referred to previous documents.25 To measure the change, we added QUE and QUE/P in HUVECs, and treated by tumor necrosis factor-α (TNF-α), added carboxyfluorescein diacetate succinimidyl ester-labeled acute promyelocytic leukemia (HL-60) leukocytes, washed the mixtures, and checked leukocyte binding to the ECs. Neutrophil adhesion in vivo was observed by immunofluorescence microscopy method.
Therapeutic assessment of QUE/P compound in DN
Eight normal Sprague Dawley rats and 24 diabetic rats were assigned to four groups (n=8, each group): 1) Sham group: normal Sprague Dawley rats were administrated a standard diet; 2) DN group: equal volume of normal saline was subcutaneously injected for 8 weeks in diabetic rats; 3) QUE group: 10 mg/kg as a single abdominal subcutaneous injection daily for 8 weeks continually in diabetic rats; and 4) QUE/P group: 10 mg/kg as a single abdominal subcutaneous injection every 5 days, continually injected for 8 weeks to diabetic rats. At a fixed time, blood and left kidneys were collected. Renal pathological damage, BUN, Scr, SOD: the kidneys were collected and the blood was purged drastically, homogenized (100 mg), and centrifuged at 3,600× g for 20 min to gain the liquid supernatant. SOD activity was checked using xanthine oxidase method. The absorbances were checked at 550 nm. Lipid peroxide contents were shown by “U” of SOD/mg protein in tissues, malonyldialdehyde (MDA, the kidneys were collected and the blood was purged drastically, homogenized (100 mg), and centrifuged at 3,600× g for 20 min to gain the liquid supernatant. MDA level was measured through thiobarbituric acid method. The absorbances were checked at 532 nm. Lipid peroxide contents are shown by “nmol” of MDA/mg protein in tissues.), serum lipid, urine protein (after 8 weeks, 24 h urine was collected with a metabolic cage for diabetic rats and urine protein was measured by Hitachi 7170 automatic biochemical analyzer.), albumin/creatinine ratio (after 8 weeks, 24-h urine was collected with a metabolic cage for diabetic rats, and albumin and creatinine were measured by Hitachi 7170 automatic biochemical analyzer, then albumin/creatinine ratio was calculated.), CD11b+ cells infiltration (referred to previous literature25), and expression of ICAM-1 (referred to previous literature25) were evaluated.
Statistical analyses
The analysis was actualized via SPSS. Data were expressed as the mean ± standard deviation. Statistical analysis was actualized by unpaired Student’s t-tests or ANOVA. Value of p<0.01 was considered statistically remarkable.
Results
Synthesis and characterization of PEG-b-(PELG-g-PZLL)
The PEG-b-(PELG-g-PZLL) contained a PEG block and a brush-like PZLL block (Figures S1 and S2); they were characterized via Fourier transform infrared spectroscopy, as depicted in Figure 1A.
Cellular viability assessment
The assessment of cell toxicity from PEG-b-(PELG-g-PZLL) on HeLa cells was measured in 24-h culture and the result is shown in Figure 1E. PEG-b-(PELG-g-PZLL) maintained low cell toxicity even below a concentration as high as 200 μg/mL.
Encapsulation capacity of QUE in PEG-b-(PELG-g-PZLL)
QUE was efficiently encapsulated by PEG-b-(PELG-g-PZLL) at physiological pH via hydrophobic interaction. To add QUE in PEG-b-(PELG-g-PZLL) (mass ratio =1:5) and dialyze against PB solution. The dialysis of free QUE as a control was also actualized at the same condition. To decide the encapsulation of QUE in PEG-b-(PELG-g-PZLL), the quantity of QUE was measured via HPLC. The encapsulation of QUE was found to be 53.2%, as depicted in Table 1.
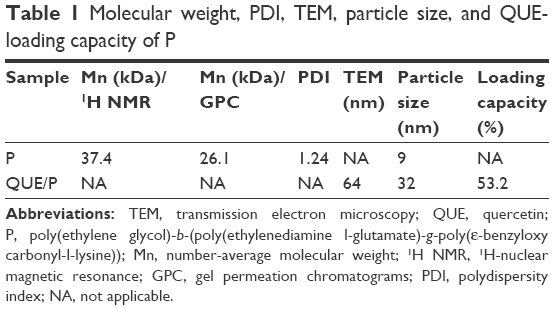 | Table 1 Molecular weight, PDI, TEM, particle size, and QUE-loading capacity of P |
Characterization assessment of QUE/P compound
The QUE/P compound was evaluated via TEM. The image of TEM is shown in Figure 1B. The QUE/P compound displayed an orbicular structure and the diameter was 64 nm (Table 1). The QUE/P compound was further characterized by a granulometer. The average particle size distributions of PEG-b-(PELG-g-PZLL) and QUE/P are evaluated in Figure 1C (a and b) and Table 1. The average diameters of PEG-b-(PELG-g-PZLL) and QUE/P were about 9 and 32 nm, respectively.
In vitro release of QUE
The QUE release from PEG-b-(PELG-g-PZLL) was evaluated via dialysis method (MWCO =7 kDa) at 37°C, with 5 mL of QUE/P against a PB solution of 0.02 mol/L (physiological condition). The release curve of QUE/P is described in Figure 1D. After 4 h, 15.23% of QUE was released from QUE/P, showing the beginning of a burst release of QUE. About 71.15% of QUE was released after 3 days and 85.43% after 5 days, showing biphase release profile from QUE/P.
Serum QUE content
The contents of QUE in serum of Sprague Dawley rats following a single subcutaneous injection in QUE group at a dose of 10 mg/kg rapidly attained Cmax of 26.78 μg/mL at Tmax of 2 h, and decreased to baseline content within 10 h of administration. The serum content of Sprague Dawley rats following a single subcutaneous injection in QUE/P group at a dose of 10 mg/kg attained Cmax of 17.85 μg/mL at Tmax of 8 h, and decreased to baseline content within 5 days of administration. The results affirmed that the release of QUE from QUE/P group was substantially sustained compared to QUE group (Figure 1F).
In vivo distribution assessment
The disintegrations per minute of kidney ranged from 89±23 to 1,875±34 within 0.05–5 days through QUE/P of administration. The result affirmed that QUE/P could be metabolized through the kidneys (Figure 2).
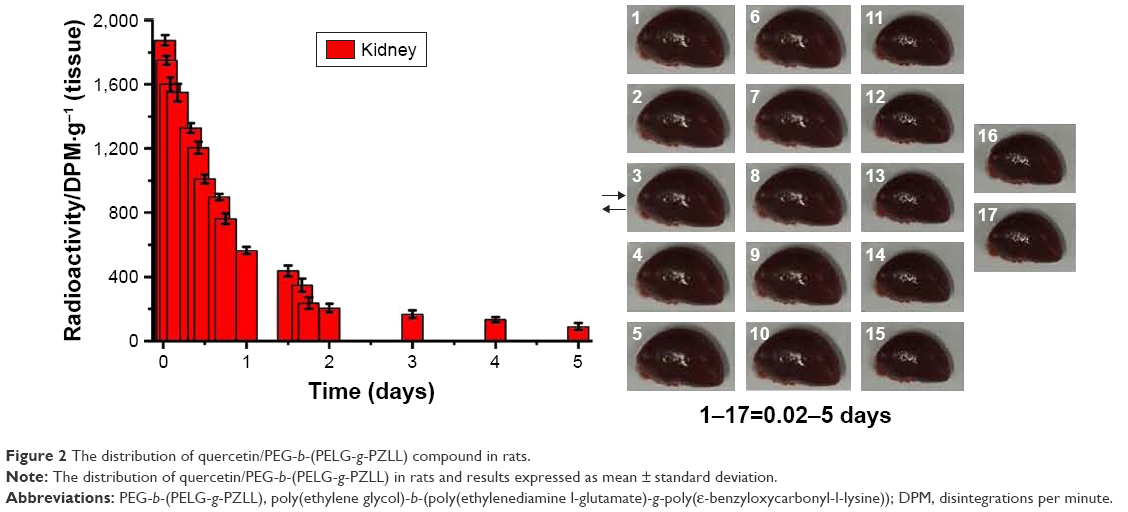 | Figure 2 The distribution of quercetin/PEG-b-(PELG-g-PZLL) compound in rats. |
Histopathologic evaluation
Light microscopy images of kidney sections are evaluated in Figure 3. Glomerular volume increase and swelling, tubulointerstitial fibrosis, infiltration of local lymphocytes in the renal cortex, and basement membrane hyperplasia were observed in histological specimens from DN group but were absent in Sham group (Figure 3A and B). Histological changes were reduced in QUE and QUE/P groups (Figure 3A and B) compared to DN group. Histological changes were remarkably reduced in QUE/P group (Figure 3A and B) compared to DN group. Gross appearance of kidney is evaluated in Figure 3C. Glomerular volume increase and swelling were observed through naked eye examination in DN group but Sham group was generally normal (Figure 3C). Naked eye examination was reduced in QUE and QUE/P groups (Figure 3C) compared to DN group. Naked eye examination was remarkably reduced in QUE/P group (Figure 3C) compared to DN group.
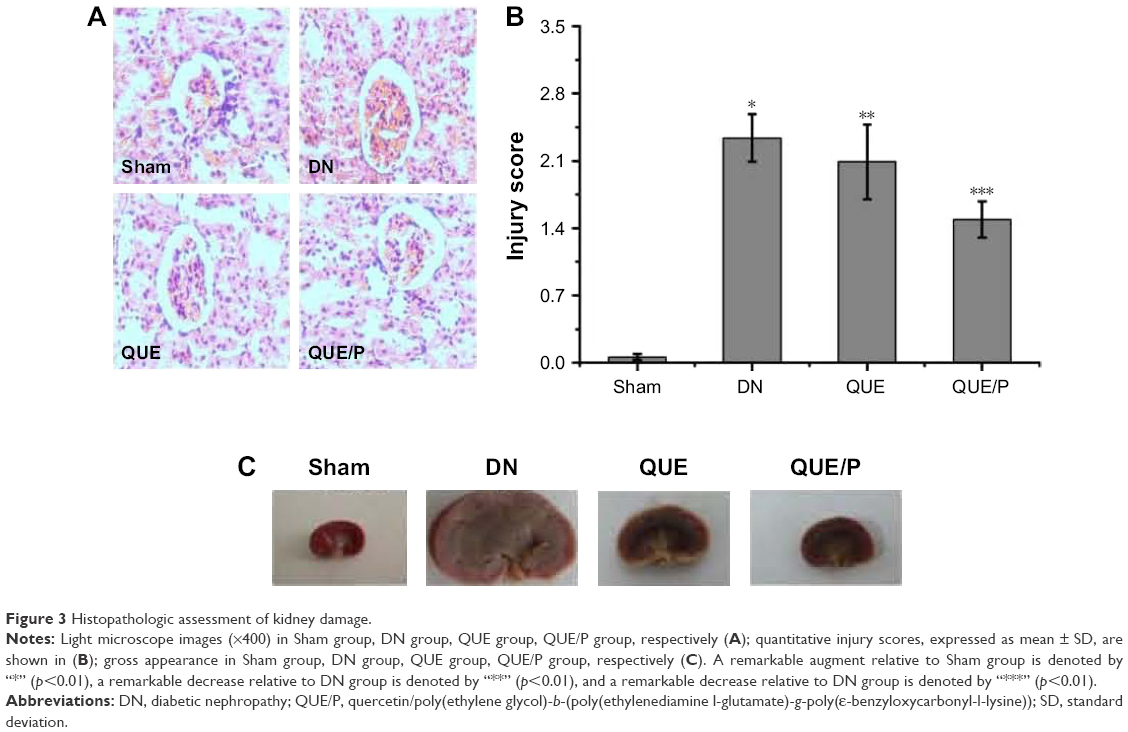 | Figure 3 Histopathologic assessment of kidney damage. |
Blood glucose content
To evaluate the blood glucose contents in a fixed time for diabetic rats administered QUE and QUE/P, and compared with control group, the result showed that diabetic rats injected with QUE maintained blood glucose contents in normal change for about 8 h, after which glycemia slowly augmented. By contrast, QUE/P compound decreased blood glucose contents to 5.1 mmol/L at 2 h after administration. Over the following 5 days, blood glucose contents increased to 4.4 mmol/L and were then maintained at about 4.1–6.2 mmol/L for 5 days (Figure 4A).
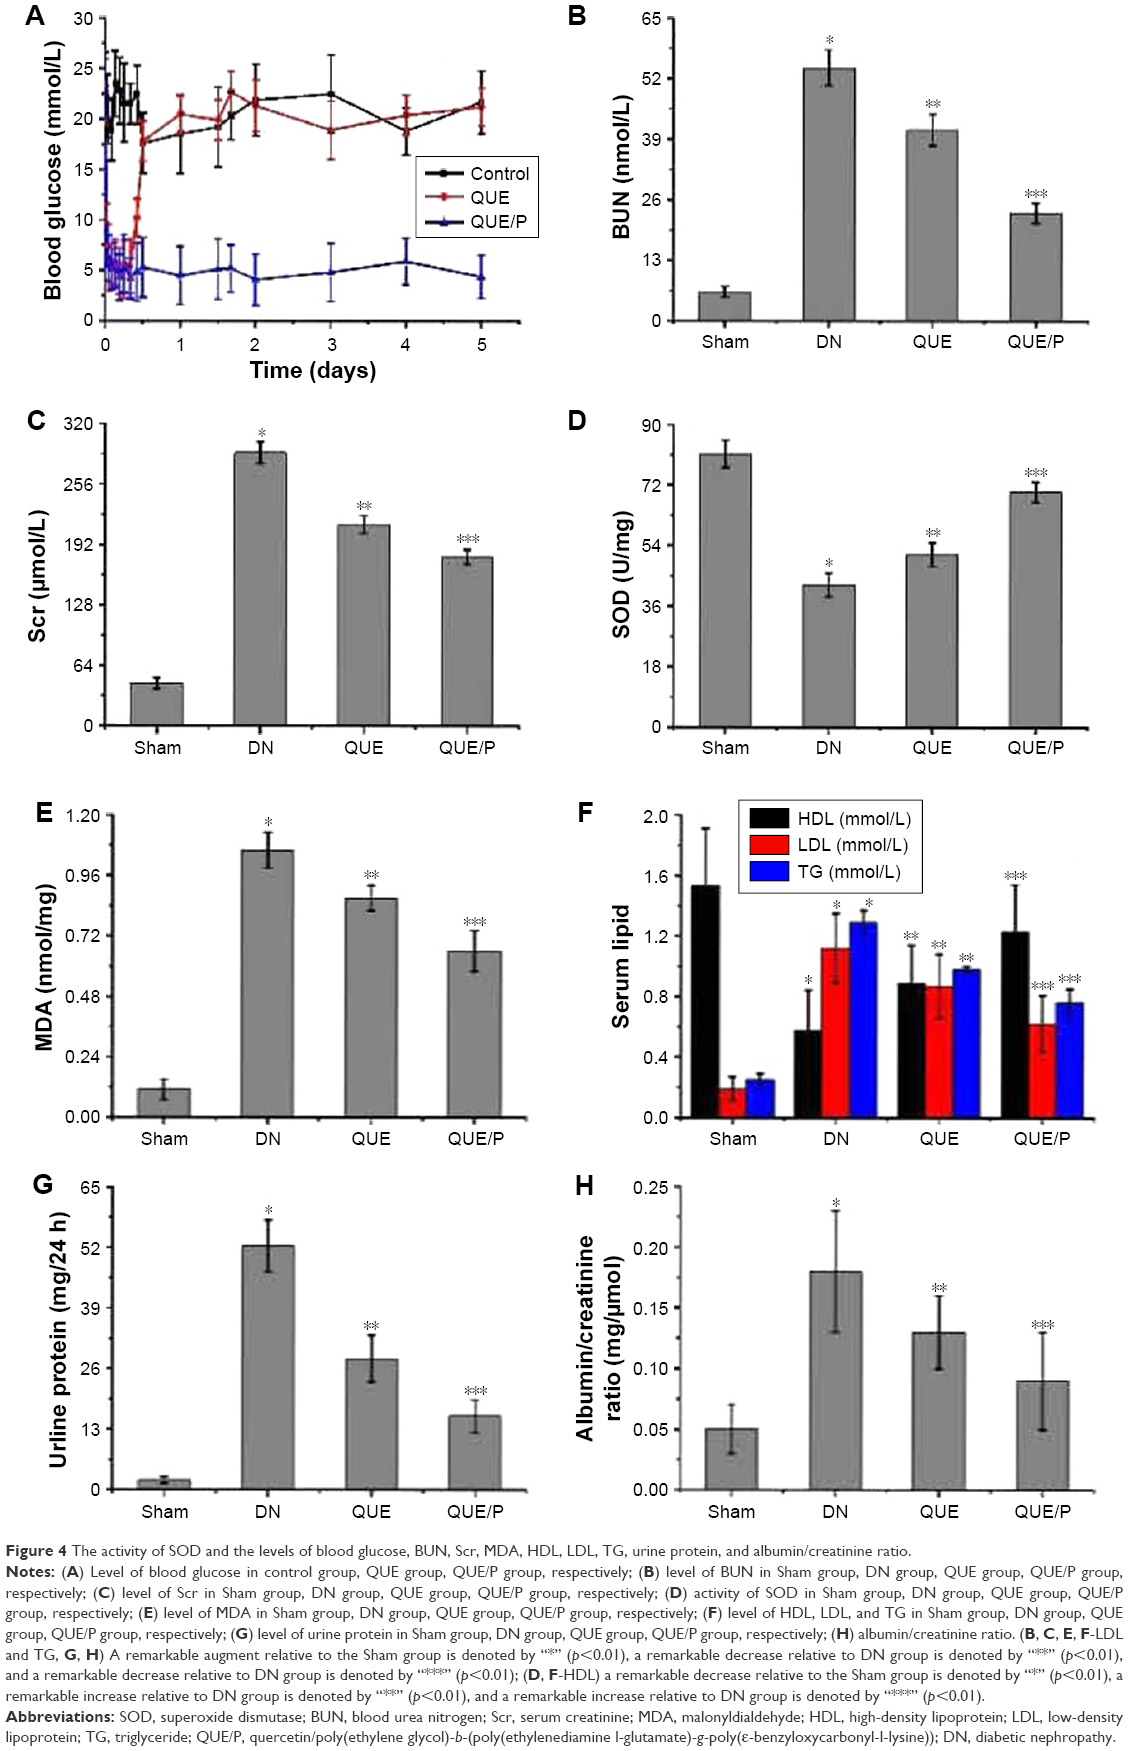 | Figure 4 The activity of SOD and the levels of blood glucose, BUN, Scr, MDA, HDL, LDL, TG, urine protein, and albumin/creatinine ratio. |
BUN and Scr contents
Level of BUN was evaluated in DN group (Figure 4B), and was found to be higher in DN group than in Sham group (p<0.01; BUN: Sham group 6.23±1.13 mmol/L, DN group 54.37±3.79 mmol/L). Administration of QUE reduced BUN (41.05±3.38 mmol/L) compared with BUN in DN group (p<0.01). Administration of QUE/P remarkably reduced BUN (23.18±2.17 mmol/L) compared with BUN in DN group (p<0.01).
Level of Scr was evaluated in DN group (Figure 4C), and was found to be higher in DN group than in Sham group (p<0.01; Scr: Sham group 45.26±5.78 μmol/L, DN group 289.16±11.27 μmol/L). Administration of QUE reduced Scr (213.56±9.37 μmol/L) compared with Scr in DN group (p<0.01). Administration of QUE/P remarkably reduced Scr (178.93±8.03 μmol/L) compared with Scr in DN group (p<0.01).
SOD activity and MDA level
Activity of SOD was evaluated in DN group (Figure 4D), and was found to be lower in DN group than in Sham group (p<0.01; SOD: Sham group 81.26±4.06 U/mg, DN group 42.36±3.49 U/mg). Administration of QUE increased SOD (51.37±3.57 U/mg) compared with SOD in DN group (p<0.01). Administration of QUE/P remarkably increased SOD (69.84±3.02 U/mg) compared with SOD in DN group (p<0.01).
Level of MDA was evaluated in DN group (Figure 4E), and was found to be higher in DN group than in Sham group (p<0.01; MDA: Sham group 0.11±0.04 nmol/mg, DN group 1.06±0.07 nmol/mg). Administration of QUE reduced MDA (0.87±0.05 nmol/mg) compared with MDA in DN group (p<0.01). Administration of QUE/P remarkably reduced MDA (0.66±0.08 nmol/mg) compared with MDA in DN group (p<0.01).
Serum lipid content
Level of high-density lipoprotein (HDL) was evaluated in DN group (Figure 4F), and was found to be lower in DN group than in Sham group (p<0.01; HDL: Sham group 1.53±0.38 mmol/L, DN group 0.58±0.26 mmol/L). Administration of QUE increased HDL (0.89±0.25 mmol/L) compared with HDL in DN group (p<0.01). Administration of QUE/P remarkably increased HDL (1.23±0.31 mmol/L) compared with HDL in DN group (p<0.01).
Level of low-density lipoprotein (LDL) was evaluated in DN group (Figure 4F), and was found to be higher in DN group than in Sham group (p<0.01; LDL: Sham group 0.19±0.08 mmol/L, DN group 1.12±0.23 mmol/L). Administration of QUE decreased LDL (0.87±0.21 mmol/L) compared with LDL in DN group (p<0.01). Administration of QUE/P remarkably decreased LDL (0.62±0.19 mmol/L) compared with LDL in DN group (p<0.01).
Level of triglyceride (TG) was evaluated in DN group (Figure 4F), and was found to be higher in DN group than in Sham group (p<0.01; TG: Sham group 0.25±0.04 mmol/L, DN group 1.29±0.08 mmol/L). Administration of QUE decreased TG (0.98±0.02 mmol/L) compared with TG in DN group (p<0.01). Administration of QUE/P demarkably decreased TG (0.76±0.09 mmol/L) compared with TG in DN group (p<0.01).
Urine protein
Level of urine protein was evaluated in DN group (Figure 4G), and was found to be higher in DN group than in Sham group (p<0.01; urine protein: Sham group 2.14±0.67 mg/24 h, DN group 52.29±5.59 mg/24 h). Administration of QUE decreased urine protein (28.15±5.07 mg/24 h) compared with urine protein in DN group (p<0.01). Administration of QUE/P demarkably decreased urine protein (15.79±3.49 mg/24 h) compared with urine protein in DN group (p<0.01).
Albumin/creatinine ratio
Level of albumin/creatinine ratio was evaluated in DN group (Figure 4H), and was found to be higher in DN group than in Sham group (p<0.01; albumin/creatinine ratio: Sham group 0.05±0.02 mg/μmol, DN group 0.18±0.05 mg/μmol). Administration of QUE decreased albumin/creatinine ratio (0.13±0.03 mg/μmol) compared with albumin/creatinine ratio in DN group (p<0.01). Administration of QUE/P demarkably decreased albumin/creatinine ratio (0.09±0.04 mg/μmol) compared with albumin/creatinine ratio in DN group (p<0.01).
QUE/P suppressed neutrophil adhesion
To evaluate neutrophil adhesion in HUVECs (Figure 5). TNF-α stimulation remarkably enhanced leukocyte adhesion to ECs. QUE reduced leukocyte binding to TNF-α-challenged HUVECs and QUE/P remarkably reduced leukocyte binding to TNF-α-challenged HUVECs (Figure 5). Our result affirmed that QUE or QUE/P modulated leukocyte adherence to the TNF-α-challenged HUVECs.
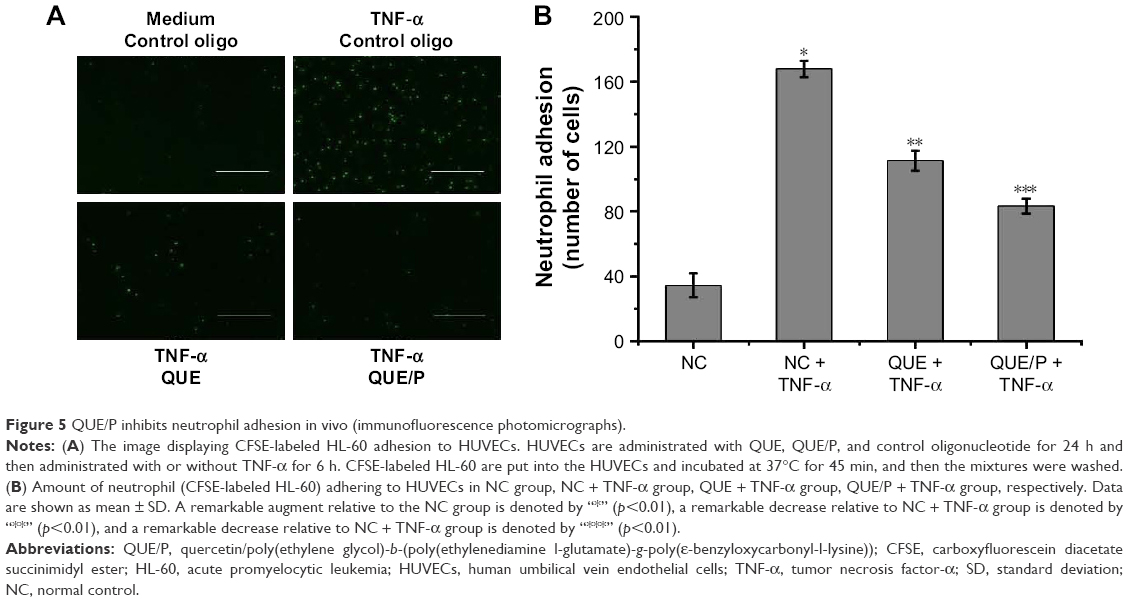 | Figure 5 QUE/P inhibits neutrophil adhesion in vivo (immunofluorescence photomicrographs). |
Expression of ICAM-1
Expression of ICAM-1 was higher in NC group than in QUE and QUE/P groups (p<0.01). Administration of QUE decreased ICAM-1 expression compared with ICAM-1 expression in NC group (p<0.01). Administration of QUE/P demarkably decreased ICAM-1 expression compared with ICAM-1 expression in NC group (p<0.01) (Figure 6A). Expression of ICAM-1 was higher in DN+2 week group than in DN+1 week group (p<0.01). Expression of ICAM-1 was higher in DN+4 week group than in DN+2 week group (p<0.01). Expression of ICAM-1 was higher in DN+8 week group than in DN+4 week group (p<0.01) (Figure 6B). Expression of ICAM-1 was higher in DN group than in Sham group (p<0.01). Administration of QUE decreased ICAM-1 expression compared with ICAM-1 expression in DN group (p<0.01). Administration of QUE/P demarkably decreased ICAM-1 expression compared with ICAM-1 expression in DN group (p<0.01) (Figure 6C).
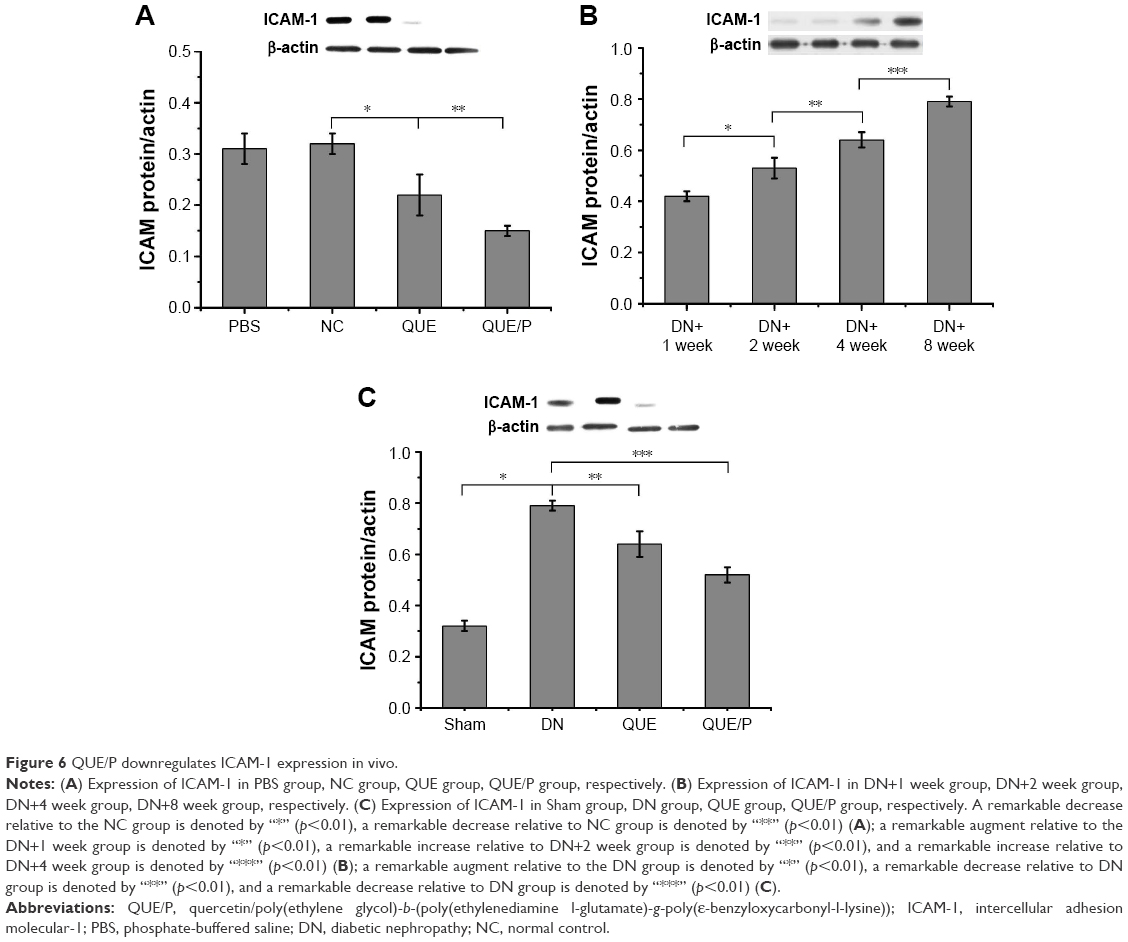 | Figure 6 QUE/P downregulates ICAM-1 expression in vivo. |
QUE/P attenuated inflammatory cells infiltration to the kidney tissue following DN
Infiltration of CD11b+ was evaluated in NC-DN group (Figure 7). Administration of QUE decreased CD11b+ infiltration compared with CD11b+ infiltration in NC-DN group (p<0.01). Administration of QUE/P demarkably decreased CD11b+ infiltration compared with CD11b+ infiltration in NC-DN group (p<0.01).
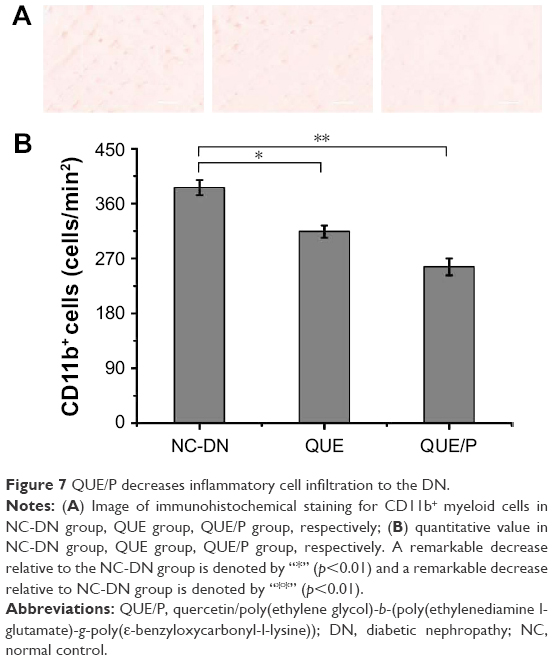 | Figure 7 QUE/P decreases inflammatory cell infiltration to the DN. |
Discussion
Diabetes mellitus contributed to pathology in a wide change of conditions, containing large vessels and microvascular damage, and was also a major challenge during heart, brain, peripheral nerves, eyes, feet and kidney injury. In this study, diabetes mellitus involved in kidney damage was a life-threatening complication.37 Currently, innovative curative methods for DN make use of traditional antidiabetic drugs (such as insulin and exenatide), metabolic modulation, cell factors, therapeutic gases like hydrogen sulfide, nucleotide, and QUE.10,38–44 QUE belongs to plant flavonoid and modulates oxidative stress and inflammatory injury in vivo.12 A growing number of researches have suggested that QUE is involved in the modulation of DN.44 However, since QUE possesses the shortcoming of low solubility and short circulation time in vivo, we therefore synthesized PEG-b-(PELG-g-PZLL) carrier to load QUE through hydrophobic interaction for improving its bioactivity in vivo. In this research, PEG-b-(PELG-g-PZLL) really promoted the therapeutic effect of QUE in DN. In the rat model of DN, QUE or QUE/P ameliorated renal pathological damage, enhanced renal function recovery, promoted metabolic modulation, and alleviated oxidative stress and inflammatory injury.
The extensive change of pathological procedure contributed to DN, within which leukocyte-EC adhesion and EC inflammation exacerbated glomerular EC injury.45–49 Hence, reducing leukocyte-EC adhesion and EC inflammation are promising therapeutic tactics to alleviate DN. ICAM-1 is a member of the CAM superfamily and plays an important effect in mediating the migration of leukocytes to pass through the endothelium and enter the kidneys. In the current study, a wide range of pathological process contributed to DN, among which leukocyte-EC adhesion and EC inflammation exacerbated renal dysfunction in DN. There was a growing appreciation that ECs were vulnerable to DN and they could be the critical determinants for the extent of DN and the recovery time. Consequently, reducing microvascular permeability and restraining leukocyte-EC adhesion improved therapeutic effects to decrease DN. ICAM-1, a member of cells adhesion molecule superfamily expressed via ECs, played a important function in mediating the migration of leukocyte across the endothelium and into the kidney. QUE or QUE/P ameliorated leukocyte-EC adhesion and EC inflammation through modulating ICAM-1 expression. On the other hand, TNF-α-stimulated HUVEC was regarded as a model of EC inflammation, and QUE or QUE/P downregulated EC inflammation in TNF-α-stimulated HUVECs. The result showed that QUE or QUE/P decreased leukocyte-EC adhesion and EC inflammation to ameliorate tissue injury. Moreover, in vivo research using DN model affirmed that QUE or QUE/P restrained the enhancement of CD11b+ myeloid cells in DN. The findings showed that QUE or QUE/P attenuated DN through suppressing ICAM-1 expression and inflammatory cell infiltration (CD11b+). These results were consistent with previous documents.50–53 Furthermore, in vivo study using DN model showed that QUE or QUE/P suppressed expression of ICAM-1, thereby decreasing the accumulation of CD11b+ myeloid cells in the DN, which may account for the decreased DN as evidenced by decreased MDA level and increased SOD activity.
In conclusion, we found that PEG-b-(PELG-g-PZLL) could improve the serum content of QUE in Sprague Dawley rats and increase the circulation time of QUE. In addition, PEG-b-(PELG-g-PZLL) could maintain a normal glucose level for up to 5 days, compared to free QUE in diabetic rats, and remarkably alleviate DN through suppressing ICAM-1 expression. These researches amplified our understanding of the interaction between QUE or QUE/P and ECs and its effect in DN. Hence, QUE or QUE/P may act as a valuable therapeutic drug in the setting of DN.
Conclusion
Synthesized PEG-b-(PELG-g-PZLL) remarkably augmented the bioactivity of QUE. Administration of QUE/P remarkably improved the serum content of QUE in Sprague Dawley rats, and also remarkably inhibited the hyperglycemia and decreased DN.
Acknowledgment
The authors appreciated the support from the Science and Technology Planning Project of Jiaxing (2017AY33076).
Disclosure
The authors report no conflicts of interest in this work.
References
Andersen AR, Christiansen JS, Andersen JK, Kreiner S, Deckert T. Diabetic nephropathy in Type 1 (insulin-dependent) diabetes: an epidemiological study. Diabetologia. 1983;25(6):496–501. | ||
Rossing P, Rossing K, Jacobsen P, Parving HH. Unchanged incidence of diabetic nephropathy in IDDM patients. Diabetes. 1995;44(7):739–743. | ||
Anjaneyulu M, Chopra K. Quercetin, an anti-oxidant bioflavonoid, attenuates diabetic nephropathy in rats. Clin Exp Pharmacol Physiol. 2004;31(4):244–248. | ||
Lin CY, Yin MC. Renal protective effects of extracts from guava fruit (Psidium guajava L.) in diabetic mice. Plant Foods Hum Nutr. 2012;67(3):303–308. | ||
Aires Neto P, Gomes HV, Campos M. Management of hyperglycemia in patients with chronic kidney disease. J Nephrol. 2013;26(4):629–635. | ||
Vallon V, Rose M, Gerasimova M, et al. Knockout of Na-glucose transporter SGLT2 attenuates hyperglycemia and glomerular hyperfiltration but not kidney growth or injury in diabetes mellitus. Am J Physiol Renal Physiol. 2013;304(2):F156–F167. | ||
Powell DW, Kenagy DN, Zheng S, et al. Associations between structural and functional changes to the kidney in diabetic humans and mice. Life Sci. 2013;93(7):257–264. | ||
Hong JN, Li WW, Wang LL, et al. Jiangtang decoction ameliorate diabetic nephropathy through the regulation of PI3K/Akt-mediated NF-κB pathways in KK-Ay mice. Chin Med. 2017;12:13. | ||
Gomes IB, Porto ML, Santos MC, et al. Renoprotective, anti-oxidative and anti-apoptotic effects of oral low-dose quercetin in the C57BL/6J model of diabetic nephropathy. Lipids Health Dis. 2014;13:184. | ||
Tong F. Preparation of exenatide-loaded linear poly(ethylene glycol)-brush poly(l-lysine) block copolymer: potential implications on diabetic nephropathy. Int J Nanomedicine. 2017;12:4663–4678. | ||
Brownlee M. Biochemistry and molecular cell biology of diabetic complications. Nature. 2001;414(6865):813–820. | ||
Stewart LK, Soileau JL, Ribnicky D, et al. Quercetin transiently increases energy expenditure but persistently decreases circulating markers of inflammation in C57BL/6J mice fed a high-fat diet. Metabolism. 2008;57(7 Suppl 1):S39–S46. | ||
Xie W, Du L. Diabetes is an inflammatory disease: evidence from traditional Chinese medicines. Diabetes Obes Metab. 2011;13(4):289–301. | ||
Csokay B, Prajda N, Weber G, Olah E. Molecular mechanisms in the antiproliferative action of quercetin. Life Sci. 1997;60(24):2157–2163. | ||
Lou M, Zhang LN, Ji PG, et al. Quercetin nanoparticles induced autophagy and apoptosis through AKT/ERK/Caspase-3 signaling pathway in human neuroglioma cells: in vitro and in vivo. Biomed Pharmacother. 2016;84:1–9. | ||
Wu XM, Gao YB, Xu LP, et al. Tongxinluo inhibits renal fibrosis in diabetic nephropathy: involvement of the suppression of intercellular transfer of TGF-[formula: see text]1-containing exosomes from GECs to GMCs. Am J Chin Med. 2017;45(5):1075–1092. | ||
Wang ZB, Zhang S, Li Y, et al. LY333531, a PKCβ inhibitor, attenuates glomerular endothelial cell apoptosis in the early stage of mouse diabetic nephropathy via down-regulating swiprosin-1. Acta Pharmacol Sin. 2017;38(7):1009–1023. | ||
Davidson SM, Duchen MR. Endothelial mitochondria: contributing to vascular function and disease. Circ Res. 2007;100(8):1128–1141. | ||
Kharbanda RK, Peters M, Walton B, et al. Ischemic preconditioning prevents endothelial injury and systemic neutrophil activation during ischemia-reperfusion in humans in vivo. Circulation. 2001;103(12):1624–1630. | ||
Yamagata K, Tagami M, Yamori Y. Dietary polyphenols regulate endothelial function and prevent cardiovascular disease. Nutrition. 2015;31(1):28–37. | ||
Rebholz CM, Harman JL, Grams ME, et al. Association between Endothelin-1 Levels and Kidney Disease among Blacks. J Am Soc Nephrol. Epub 2017 Jul 11. | ||
Hara T, Ishida T, Cangara HM, Hirata K. Endothelial cell-selective adhesion molecule regulates albuminuria in diabetic nephropathy. Microvasc Res. 2009;77(3):348–355. | ||
Sugimoto H, Shikata K, Hirata K, et al. Increased expression of intercellular adhesion molecule-1 (ICAM-1) in diabetic rat glomeruli: glomerular hyperfiltration is a potential mechanism of ICAM-1 upregulation. Diabetes. 1997;46(12):2075–2081. | ||
Li Z, Yang Z, Luo X, et al. Effects of burn serum on expression of CD11/CD18 on polymorphonuclear neutrophils and ICAM-1 on endothelial cells. Acta Academiae Medicinae Militaris Tertiae. 1997;19:101–104. | ||
Liu RR, Li J, Gong JY, et al. MicroRNA-141 regulates the expression level of ICAM-1 on endothelium to decrease myocardial ischemia-reperfusion injury. Am J Physiol Heart Circ Physiol. 2015;309(8):H1303–H1313. | ||
Behr J, Gaskin B, Fu C, Dong C, Kunz R. Localized modeling of biochemical and flow interactions during cancer cell adhesion. PLoS One. 2015;10(9):e0136926. | ||
Tian S, Tang J, Liu H, et al. Propyl gallate plays a nephroprotective role in early stage of diabetic nephropathy associated with suppression of glomerular endothelial cell proliferation and angiogenesis. Exp Diabetes Res. 2012;2012:209567. | ||
Sugimoto H, Shikata K, Matsuda M, et al. Increased expression of endothelial cell nitric oxide synthase (ecNOS) in afferent and glomerular endothelial cells is involved in glomerular hyperfiltration of diabetic nephropathy. Diabetologia. 1998;41(12):1426–1434. | ||
Lu Q, Ji XJ, Zhou YX, et al. Quercetin inhibits the mTORC1/p70S6K signaling-mediated renal tubular epithelial-mesenchymal transition and renal fibrosis in diabetic nephropathy. Pharmacol Res. 2015;99:237–247. | ||
Li C, Zhang WJ, Frei B. Quercetin inhibits LPS-induced adhesion molecule expression and oxidant production in human aortic endothelial cells by p38-mediated Nrf2 activation and antioxidant enzyme induction. Redox Biol. 2016;9:104–113. | ||
Bhaskar S, Sudhakaran PR, Helen A. Quercetin attenuates atherosclerotic inflammation and adhesion molecule expression by modulating TLR-NF-κB signaling pathway. Cell Immunol. 2016;310:131–140. | ||
Chakraborty J, Singh R, Dutta D, Naskar A, Rajamma U, Mohanakumar KP. Quercetin improves behavioral deficiencies, restores astrocytes and microglia, and reduces serotonin metabolism in 3-nitropropionic acid-induced rat model of Huntington’s Disease. CNS Neurosci Ther. 2014;20(1):10–19. | ||
Tong F, Tang X, Li X, Xia W, Liu D. The effect of insulin-loaded linear poly(ethylene glycol)-brush-like poly(l-lysine) block copolymer on renal ischemia/reperfusion-induced lung injury through downregulating hypoxia-inducible factor. Int J Nanomedicine. 2016;11:1717–1730. | ||
Feng XZ, Ding YF, Li X, et al. HPLC determination of quercetin and its entrapment efficiency in nanoliposome. Chin J Pharm Anal. 2008;28(4):556–558. | ||
Li S, Jiang WQ, Wang AX, Guan ZZ, Zhang L, Pan SR. Releasing characterization, pharmacokinetics and distribution of PEG-PBLG copolymer micelles in vitro and in vivo. Chinese Pharm J. 2005;40(9):699–702. | ||
Ding Y, Vaziri ND, Coulson R, Kamanna VS, Roh DD. Effects of simulated hyperglycemia, insulin, and glucagon on endothelial nitric oxide synthase expression. Am J Physiol Endocrinol Metab. 2000;279(1):E11–E17. | ||
Abouzed TK, Munesue S, Harashima A, et al. Preventive effect of salicylate and pyridoxamine on diabetic nephropathy. J Diabetes Res. 2016;2016:1786789. | ||
Safar MM, Abdelsalam RM. H2S donors attenuate diabetic nephropathy in rats: modulation of oxidant status and polyol pathway. Pharmacol Rep. 2015;67(1):17–23. | ||
Zhang Y, Jia N, Hu F, et al. Association of single-nucleotide polymorphisms in the RAGE gene and its gene-environment interactions with diabetic nephropathy in Chinese patients with type 2 diabetes. Oncotarget. Epub 2017 Jun 28. | ||
Dhamodharan U, Ezhilarasi K, Ponjayanthi B, Sireesh D, Ramkumar KM, Viswanathan V. Association of A1538G and C2437T single nucleotide polymorphisms in heat shock protein-70 genes with diabetic nephropathy among South Indian population. Biosci Rep. 2017;37(2). pii: BSR20160605. | ||
Tian W, Chen L, Zhang L, et al. Effects of ginsenoside Rg1 on glucose metabolism and liver injury in streptozotocin-induced type 2 diabetic rats. Genet Mol Res. 2017;16(1). | ||
Ngubane PS, Hadebe SI, Serumula MR, Musabayane CT. The effects of transdermal insulin treatment of streptozotocin-induced diabetic rats on kidney function and renal expression of glucose transporters. Ren Fail. 2015;37(1):151–159. | ||
Siddiqi FS, Chen LH, Advani SL, et al. CXCR4 promotes renal tubular cell survival in male diabetic rats: implications for ligand inactivation in the human kidney. Endocrinology. 2015;156(3):1121–1132. | ||
Gomes IB, Porto ML, Santos MC, et al. The protective effects of oral low-dose quercetin on diabetic nephropathy in hypercholesterolemic mice. Front Physiol. 2015;6:247. | ||
Bonventre JV, Yang L. Cellular pathophysiology of ischemic acute kidney injury. J Clin Invest. 2011;121(11):4210–4221. | ||
Rops AL, Jacobs CW, Linssen PC, et al. Heparan sulfate on activated glomerular endothelial cells and exogenous heparinoids influence the rolling and adhesion of leucocytes. Nephrol Dial Transplant. 2007;22(4):1070–1077. | ||
Yasuda M, Ohbayashi M, Shimizu S, Yamamoto T. Angiogenesis induced by adhesion between polymorphonuclear leukocyte and endothelial cell via intercellular adhesion molecule-1. New Frontiers in Regenerative Medicine. 2007:83–93. (Conference paper) | ||
Xu G, Qin Q, Yang M, Qiao Z, Gu Y, Niu J. Heparanase-driven inflammation from the AGEs-stimulated macrophages changes the functions of glomerular endothelial cells. Diabetes Res Clin Pract. 2017;124:30–40. | ||
Yin QH, Zhang R, Li L, et al. Exendin-4 ameliorates lipotoxicity-induced glomerular endothelial cell injury by improving ABC transporter A1-mediated cholesterol efflux in diabetic apoE knockout mice. J Biol Chem. 2016;291(51):26487–26501. | ||
Høj Thomsen L, Fog-Tonnesen M, Nielsen Fink L, et al. Smad2 phosphorylation in diabetic kidney tubule epithelial cells is associated with modulation of several transforming growth factor-β family members. Nephron. 2017;135(4):291–306. | ||
Namgung S, Yoon JJ, Yoon CS, et al. Prunella vulgaris attenuates diabetic renal injury by suppressing glomerular fibrosis and inflammation. Am J Chin Med. 2017;45(3):475–495. | ||
Yu CS, Lai KC, Yang JS, et al. Quercetin inhibited murine leukemia WEHI-3 cells in vivo and promoted immune response. Phytother Res. 2010;24(2):163–168. | ||
Kobuchi H, Roy S, Sen CK, Nguyen HG, Packer L. Quercetin inhibits inducible ICAM-1 expression in human endothelial cells through the JNK pathway. Am J Physiol. 1999;277(3 Pt 1):C403–C411. |
Supplementary materials
Synthesis of PEG-b-(PELG-g-PZLL)
Poly(ethylene glycol)-b-(poly(ethylenediamine l-glutamate)-g-poly(ε-benzyloxycarbonyl-l-lysine)) (PEG-b-(PELG-g-PZLL)) was synthesized by the following method: PEG-b-PBLG was prepared via ring-opening polymerization of BLG-N-carboxyanhydride (NCA), with PEG-NH2 as the macroinitiator, followed via aminolysis with ethanediamine to get PEG-b-PELG. PEG-b-PELG was used as the macroinitiator to initiate the ring-opening polymerization of ZLL-NCA to obtain PEG-b-(PELG-g-PZLL), as depicted in Figure S1. The degree of polymerization of PELG was 50 and the degree of polymerization of PZLL was 3, and they were characterized via 1H-nuclear magnetic resonance and gel permeation chromatogram, as depicted in Figure S2.
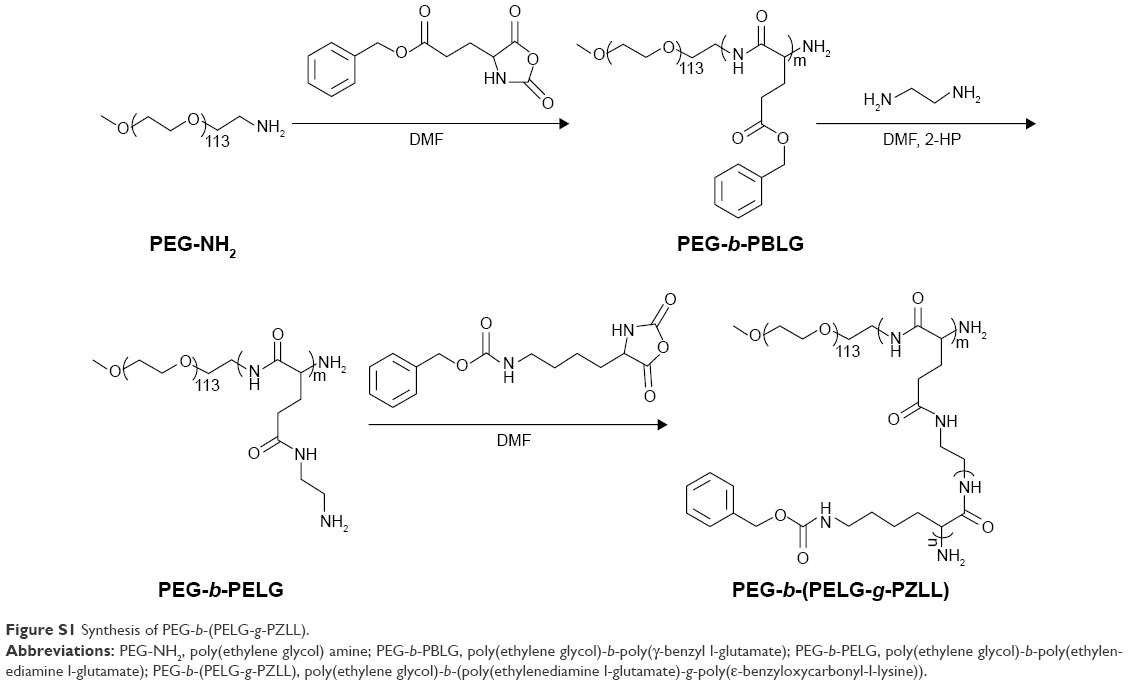 | Figure S1 Synthesis of PEG-b-(PELG-g-PZLL). |
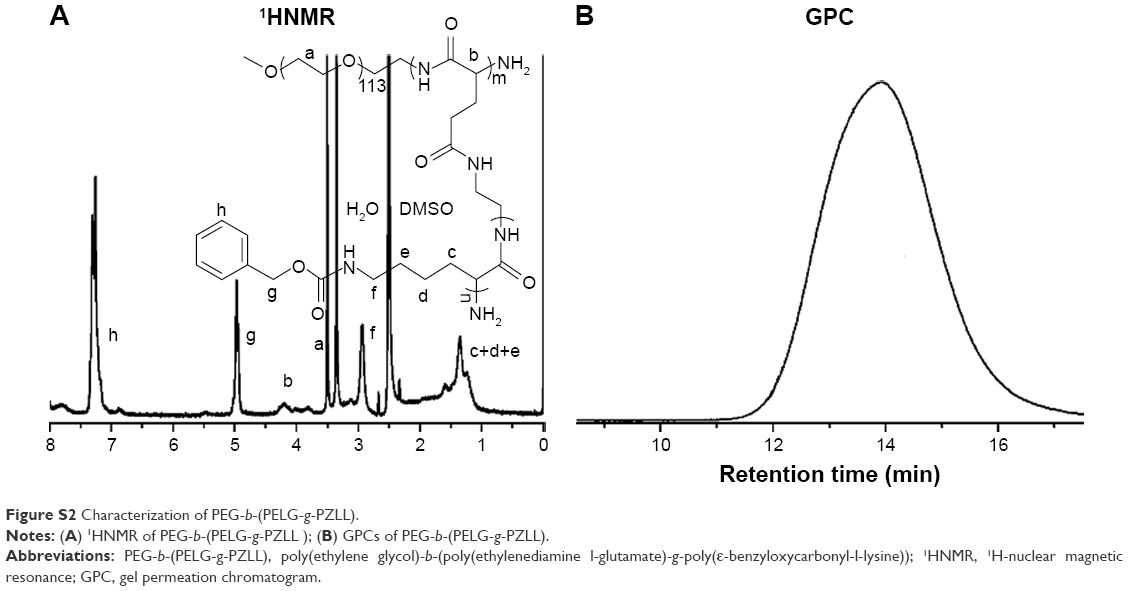 | Figure S2 Characterization of PEG-b-(PELG-g-PZLL). |
 © 2017 The Author(s). This work is published and licensed by Dove Medical Press Limited. The full terms of this license are available at https://www.dovepress.com/terms.php and incorporate the Creative Commons Attribution - Non Commercial (unported, v3.0) License.
By accessing the work you hereby accept the Terms. Non-commercial uses of the work are permitted without any further permission from Dove Medical Press Limited, provided the work is properly attributed. For permission for commercial use of this work, please see paragraphs 4.2 and 5 of our Terms.
© 2017 The Author(s). This work is published and licensed by Dove Medical Press Limited. The full terms of this license are available at https://www.dovepress.com/terms.php and incorporate the Creative Commons Attribution - Non Commercial (unported, v3.0) License.
By accessing the work you hereby accept the Terms. Non-commercial uses of the work are permitted without any further permission from Dove Medical Press Limited, provided the work is properly attributed. For permission for commercial use of this work, please see paragraphs 4.2 and 5 of our Terms.