")
Back to Journals » Cancer Management and Research » Volume 12
Quantitative Tyrosine Phosphoproteomic Analysis of Resistance to Radiotherapy in Nasopharyngeal Carcinoma Cells
Received 26 April 2020
Accepted for publication 2 November 2020
Published 9 December 2020 Volume 2020:12 Pages 12667—12678
DOI https://doi.org/10.2147/CMAR.S260028
Checked for plagiarism Yes
Review by Single anonymous peer review
Peer reviewer comments 2
Editor who approved publication: Dr Antonella D'Anneo
Lin Shen, Zhanzhan Li, Liangfang Shen
Department of Oncology, Xiangya Hospital, Central South University, Changsha 410008, People’s Republic of China
Correspondence: Zhanzhan Li
Department of Oncology, Xiangya Hospital, Central South University, Changsha 410008, People’s Republic of China
Tel + 86-0731-89753332
Email [email protected]
Background: Radioresistance poses a major challenge in nasopharyngeal carcinoma (NPC) treatment. Protein tyrosine phosphorylation has emerged as a key device in the control of resistance to therapy in cancer cells.
Methods: Using tandem mass tag (TMT) labeling and phospho-antibody affinity enrichment followed by high-resolution LC-MS/MS analysis, quantitative tyrosine phosphorylome analysis was performed in CNE2 (parental) and its radioresistant subline CNE2-IR.
Results: Altogether, 233 tyrosine phosphorylation sites in 179 protein groups were identified, among which 179 sites in 140 proteins were quantified. Among the quantified proteins, 38 tyrosine phosphorylation proteins are up-regulated and 18 tyrosine phosphorylation proteins are down-regulated in CNE2-IR vs CNE2. Increased tyrosine phosphorylation in multiple receptor/protein tyrosine kinases (EPHA2, EGFR, IGF1R, ABL1 and LYN) was identified in CNE2-IR vs CNE2 cells. Intensive bioinformatic analyses revealed robust activation of multiple biological processes/pathways including E-cadherin stabilization, cell-cell adhesion, and cell junction organization in radioresistant CNE2-IR cells. Specifically, we observed that the CNE2 cells incubated with EphrinA1-Fc exhibited higher EPHA2 Y772 phosphorylation and lower E-cadherin expression, as compared with PBS control. Furthermore, an ATP-competitive EPHA2 RTK inhibitor (ALW-II-41-27, ALW) reduced EPHA2 Y772 phosphorylation and increased the expression of E-cadherin in CNE2-IR cells. Colony formation analysis showed that EFNA1 (EFNA1 is the ligand of EPHA2) treatment in CNE2 significantly promoted colony formation after 6Gy irradiation; while incubation with EPHA2 inhibitor ALW-II-41-27 in CNE2-IR cells impaired colony formation after irradiation, as compared with solvent control (DMSO).
Conclusion: In conclusion, phosphoproteomic approach allowed us to link tyrosine kinases signaling with radioresistance in NPC. Further studies are necessary to delineate the molecular function of EPHA2/E-cadherin signaling in radioresistant NPC and to explore rational combination therapy and its underlying mechanism.
Keywords: nasopharyngeal carcinoma, radioresistance, quantitative tyrosine phosphorylome, receptor tyrosine kinase
Introduction
Nasopharyngeal carcinoma (NPC) mostly occurs in a number of Southeast Asian regions, including southern China, Hong Kong, and Taiwan.1 Radiation therapy is the major therapeutic modality used to treat NPC, and most NPC patients can be cured if the disease is diagnosed and treated at an early stage. However, about 20% of NPC patients develop local recurrence after radiotherapy, and radioresistance poses a major challenge in nasopharyngeal carcinoma (NPC) treatment.2 Hence, it is important to understand the mechanisms of radioresistance to develop more specific treatment for NPC and improve patient prognosis.
A majority of phosphorylation events in cells occur on serine and threonine residues of proteins with a very small fraction occurring on tyrosine residues. Although tyrosine phosphorylation accounts for a minority of total phosphorylation, it has emerged as a key device in the control of numerous cellular functions in diseases, especially in cancer.3 Kinase is an organism's complete set of protein kinases encoded in its genome. A number of studies indicated that tyrosine kinase signaling could promote resistance to cancer therapy. Liu et al showed that tyrosine phosphorylation of HSC70 (Heat shock cognate, also known as HSPA8, is a member of the heat shock protein 70 family, and it functions as a chaperone, and binds to nascent polypeptides to facilitate correct folding. It also functions as an ATPase in the disassembly of clathrin-coated vesicles during transport of membrane components through the cell) and its interaction with RFC (replication factor C, or RFC, is a five-subunit protein complex that is required for DNA replication) mediates methotrexate (Folate antineoplastic drugs) resistance in murine L1210 leukemia cells.4 Shajahan et al demonstrated that CAV1 (a scaffolding protein within caveolar membranes that interacts directly with G-protein alpha subunits and can functionally regulate their activity) tyrosine phosphorylation may contribute to anti-microtubule drug resistance in breast cancer cells.5 The diversity of the tyrosine kinome in mediating Trastuzumab (A chemotherapeutic drug used to treat metastatic (spread) breast cancer) resistance is further exemplified by the importance of the receptor/protein tyrosine kinase (Receptor tyrosine-protein kinase erbB-4, ErbB4; MET, SRC) in this process.6–8 Recently, Koppenhagen et al proposed c-Abl tyrosine kinase as an important mediator of beta1-integrin signaling for radioresistance.9 Radiation-induced phosphorylation of platelet-derived growth factor receptor (PDGFR) and c-kit regulates radiosensitivity in nasopharyngeal cancer cell.10 Therefore, understanding the mechanisms of tyrosine phosphorylation of key proteins might effectively allow the proteome-wide profiling of a signaling network and the identification of appropriate-targeted combination therapies.
In recent years, quantitative proteomic approaches have made it possible to utilize large-scale phosphoproteomic profiles for the discovery of drug-resistant targets. Based on a tyrosine phosphoproteomic analysis, Gioia et al observed increased tyrosine phosphorylation of Lyn (protein tyrosine kinase) and Syk kinase (Spleen tyrosine kinase) in nilotinib-resistant chronic myeloid leukemia (CML) cells.11 In the present study, we performed quantitative phosphoproteomics in human NPC cell line CNE2 and its radioresistant subline CNE2-IR in order to identify the altered tyrosine phosphorylation events associated with radioresistance. We showed that signaling components of E-cadherin stabilization pathway were significantly enriched in radioresistant CNE2-IR cells. We also identified epithelial cell kinase (EPHA2) as a potential kinase to promote radioresistance through modulating E-cadherin expression. These results may provide new insight to define a critical signaling node associated with the development of radioresistance for NPC treatment in the future.
Materials and Methods
Reagents
Sequencing grade modified trypsin was obtained from Promega (Madison, WI). Tandem mass tags (TMT) labeling Kit was purchased from Thermo Scientific (Waltham, MA). Dulbecco’s Modified Eagle Medium (DMEM), fetal bovine serum (FBS), L-glutamine, and antibiotics were purchased from Invitrogen (Carlsbad, CA). EphrinA1-Fc was from R&D Systems (Minneapolis, MN). ALW-II-41-27 (ALW) was from MedChemExpress (Monmouth Junction, NJ). siRNAs for Scramble or E-cadherin were purchased from GeneChem (Shanghai, China). pCMV3 plasmid expressing E-cadherin ORF and pCMV3 empty vector were obtained from Sinobiological (Wayne, PA).
Cell Culture
Human NPC cell line CNE2 and its radioresistant subline CNE2-IR were kindly provided by Dr Lunquan Sun (Center for Molecular Medicine, Xiangya Hospital Central South University, Changsha, China). STR test was run for CEN2 and CNE2-IR (See Provenance of Materials). CNE2 and CNE2-IR cells were cultured in DMEM media supplemented with 10% FBS, 2 mM glutamine and antibiotics as described previously.
Proteomic Quantification of Tyrosine Phosphorylation
The proteomic quantification of tyrosine phosphorylation had been described in the previous our study.12,13 The samples firstly experienced protein extraction and trypsin digestion. Briefly, cells were lysed in urea lysis buffer, sonicated, and then cleared by centrifugation. The protein was redissolved in buffer and the protein concentration was determined with 2-D Quant kit according to the manufacturer’s instructions. For digestion, the protein solution was reduced with 10 mM DTT for 1 h at 37°C and alkylated with 20 mM IAA for 45 min at room temperature in darkness. After digestion, peptide was desalted by Strata X C18 SPE column (Phenomenex) and vacuum-dried. Briefly, peptides were first separated with a gradient of 2% to 60% acetonitrile in 10 mM ammonium bicarbonate pH 10 over 80 min into 80 fractions. Then, the peptides were combined into 6 fractions and dried by vacuum centrifuging. Then, affinity enrichment was performed. To enrich pY peptides, tryptic peptides dissolved in NETN buffer (100 mM NaCl, 1 mM EDTA, 50 mM Tris-HCl, 0.5% NP-40, pH 8.0) were incubated with pre-washed antibody beads (PTM-703, PTM Biolabs) at 4°C overnight with gentle shaking. The beads were washed four times with NETN buffer and twice with ddH2O. The bound peptides were eluted from the beads with 0.1% TFA. The eluted fractions were combined and vacuum-dried. The resulting peptides were cleaned with C18 ZipTips (Millipore) according to the manufacturer’s instructions, followed by liquid chromatography tandem mass spectrometry (LC-MS/MS) analysis.
Liquid Chromatography Tandem Mass Spectrometry
Peptides were dissolved in 0.1% FA, directly loaded onto a reversed-phase pre-column (Acclaim PepMap 100, Thermo Scientific). Peptide separation was performed using a reversed-phase analytical column (Acclaim PepMap RSLC, Thermo Scientific). The gradient was comprised of an increase from 4% to 24% solvent B (0.1% FA in 98% ACN) for 50 min, 24% to 35% for 12 min and climbing to 80% in 4 min then holding at 80% for the last 4 min, all at a constant flow rate of 400 nl/min on an EASY-nLC 1000 UPLC system, the resulting peptides were analyzed by Q ExactiveTM hybrid quadrupole-Orbitrap mass spectrometer (ThermoFisher Scientific). The peptides were subjected to NSI source followed by tandem mass spectrometry (MS/MS) in Q ExactiveTM (Thermo) coupled online to the UPLC. Intact peptides were detected in the Orbitrap at a resolution of 70,000. Peptides were selected for MS/MS using NCE setting as 31; ion fragments were detected in the Orbitrap at a resolution of 17,500. A data-dependent procedure that alternated between one MS scan followed by 20 MS/MS scans was applied for the top 20 precursor ions above a threshold ion count of 5E3 in the MS survey scan with 30.0s dynamic exclusion.
Database Search
The resulting MS/MS data were processed using MaxQuant search engine (v.1.5.2.8). Tandem mass spectra were searched against Swissprot Human database (https://www.uniprot.org/) concatenated with reverse decoy database. Trypsin/P was specified as cleavage enzyme allowing up to 2 missing cleavages. The mass tolerance for precursor ions was set as 20 ppm in First search and 5 ppm in Main search, and the mass tolerance for fragment ions was set as 0.02 Da. Carbamidomethyl on Cys was specified as fixed modification, oxidation on Met, acetylation on protein N-term, and phosphorylation on Tyr were specified as variable modifications.
Mass Spectrometry Data Analysis
We averaged and normalized the intensities of the phosphopeptides identified in the two replicate experiments that were carried out. Total sum intensities of all phosphopeptides for each TMT label were used to normalize the phosphopeptide abundance. The quantifiable proteins in this study were divided into four quantitative categories according to their CEN2IR4/CNE2 ratio: Quartile 1(CNE2IR/CEN2 ratio<0.5 and P<0.05), Quartile 2(0.5<CNE2IR/CEN2 ratio<0.67 and P<0.05), Quartile 3(1.5<CNE2IR/CEN2 ratio<2 and P<0.05), Quartile 4(1.5<CNE2IR/CEN2 ratio<2 and P<0.05). 1.5-fold cutoff was selected for hyperphosphorylation, and a 0.67-fold cutoff was selected to denote hypophosphorylation.
Pathway and Process Enrichment Analysis
Pathway and process enrichment analysis was carried out in Metascape (http://metascape.org/gp/index.html) with the following ontology sources: Kyoto Encyclopedia of Genes and Genomes (KEGG) Pathway, GO Biological Processes, Reactome Gene Sets, Canonical Pathways and CORUM.14 All genes in the genome were used as the enrichment background. Terms with p-value < 0.01, minimum count 3, and enrichment factor > 1.5 (enrichment factor is the ratio between observed count and the count expected by chance) are collected and grouped into clusters based on their membership similarities. More specifically, P-values are calculated based on accumulative hypergeometric distribution. The most statistically significant term within a cluster is chosen as the one representing the cluster.
Clonogenic Survival Assay
Radiosensitivity was measured by clonogenic survival assay following exposure to irradiation.15 Briefly, NPC cells (5 × 10²) were plated in 6 cm culture dishes (n=3) and exposed to radiation dose (6 Gy). After exposure, the cells were further cultured for 12 days, and the number of surviving colonies (defined as a colony with >50 cells) was stained with 0.5% crystal violet and counted.
Western Blot Analysis
Western blotting was conducted as described previously.16 Briefly, cells were harvested and lysed in modified RIPA buffer (50 mM Tris-HCl, pH 7.4, 150 mM NaCl, 1 mm EDTA, 1% Nonidet P-40, 0.25% sodium deoxycholate, and 1 mM sodium orthovanadate in the presence of protease inhibitors). Protein lysates (15 μg) were separated by 10% SDS-PAGE and transferred to Hybond-P PVDF membranes (Amersham Biosciences). Blots were blocked with 5% non-fat dry milk in Tris-buffered saline buffer for 2 h at room temperature and then incubated with diluted antibodies against various proteins for 2 h at room temperature, followed by incubation with horseradish peroxidase-conjugated goat-anti-mouse antibody (Abcam, Cambridge, MA) for 1 h at room temperature. The signal was visualized with an enhanced chemiluminescence detection reagent (Abcam, Cambridge, MA). The primary antibodies used were phosphoEGFR Y869 (6963; Cell Signaling), epidermal growth factor receptor (EGFR) (4267; Cell Signaling), phospho-EPHA2 Y772 (8244; Cell Signaling), EPHA2 (6997; Cell Signaling), E-Cadherin (3195, Cell Signaling), phosphoIGF1R Y1161 (ab39398; Abcam), (Insulin-like growth factor receptor 1) IGF1R (Ab39675; Abcam), and β-Actin (A5316, Sigma).
Statistical Analysis
The statistical software package SPSS 13.0 was used in this study. Single comparisons were performed using Student’s t-test or Mann–Whitney’s U-test. All statistical tests were two-sided. Differences were considered statistically significant for P < 0.05.
Results
Quantitative Tyrosine Phosphoproteomic Analysis on CNE2 and Its Radioresistant Subline CNE2-IR
NPC cell line CNE2 and its radioresistant subline CNE2-IR were used in a previous 2-DE/MALDI-TOF-MS study to identify potential biomarkers predicting radiosensitivity in NPC cells.17,18 Hence, these two cell lines were used in this study for quantitative tyrosine phosphoproteomic analysis using TMT labeling and LC-MS/MS analysis. The general experimental strategy is illustrated in Figure 1A. We first defined the length of the peptides and noted that most were between 8 and 20” amino acids (Figure 1B). Second, we checked the mass error of all the identified peptides. The distribution of mass error is near zero and most of them are less than 5 ppm, suggesting the mass accuracy of the MS data fit the requirement (Figure 1C). The detection and quantification of proteins showed good reproducibility in two biological replicates (Figure 1D).
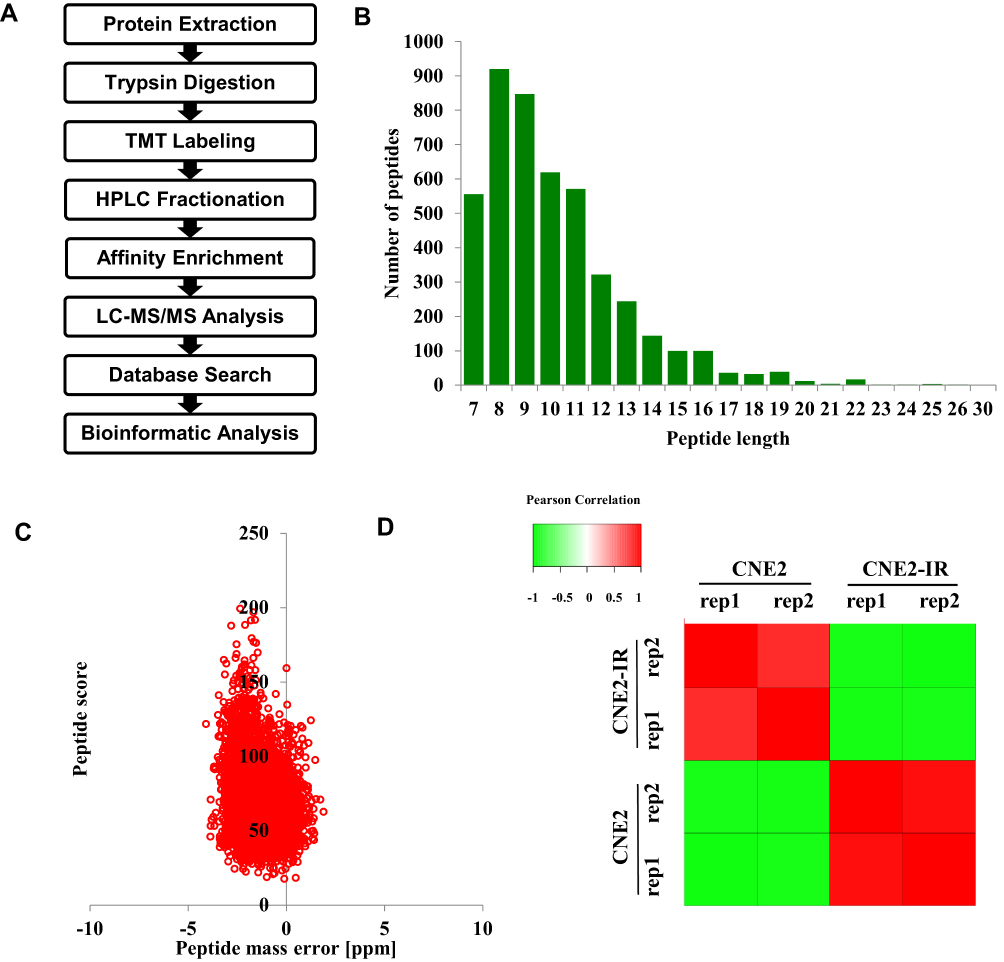 |
Figure 1 Quantitative proteomic analysis on CNE2 and its radioresistant subline CNE2-IR. (A) Experimental scheme for the quantitative tyrosine phosphoproteomic. (B) Peptide length distribution identified by quantitative proteomic analysis. (C) Mass error indicates distribution of all identified peptides. (D) Reproducibility of the quantitative proteomic analysis. |
In total, 233 tyrosine phosphorylation sites in 179 protein groups were identified, among which179 sites in 140 proteins were quantified (Figure 2A). Among the 179 identified protein groups, most of the proteins exhibited one modification site (Figure 2B). The fold-change cutoff was set when proteins with quantitative ratios above 1.5 or below 1/1.5 are deemed significant. Among the quantified proteins, 38 tyrosine phosphorylated proteins are up-regulated and 18 tyrosine phosphorylated proteins are down-regulated in CNE2-IR/CNE2 (Figure 2A, Table S1). Phosphomotif analysis showed that tyrosine phosphorylation mostly occurred in motif containing YXXXR (Figure 2C). To determine the cellular localization of phosphorylated proteins which are significantly up-regulated in CNE2-IR or parental CNE2 cells, we interrogated our dataset using the Uniprot Keyword database,19 and found that phosphorylated proteins in subcellular compartments (Cytoplasm-nuclear and Extracellular) were increased in CNE2-IR cells versus the parental CNE2 line (Figure 3). Impressively, increased tyrosine phosphorylation of multiple receptor/protein tyrosine kinases (EGFR, EPHA2, IGF1R, ABL1, and LYN) was observed in CNE2-IR, as compared with CNE2 (Figure 4).
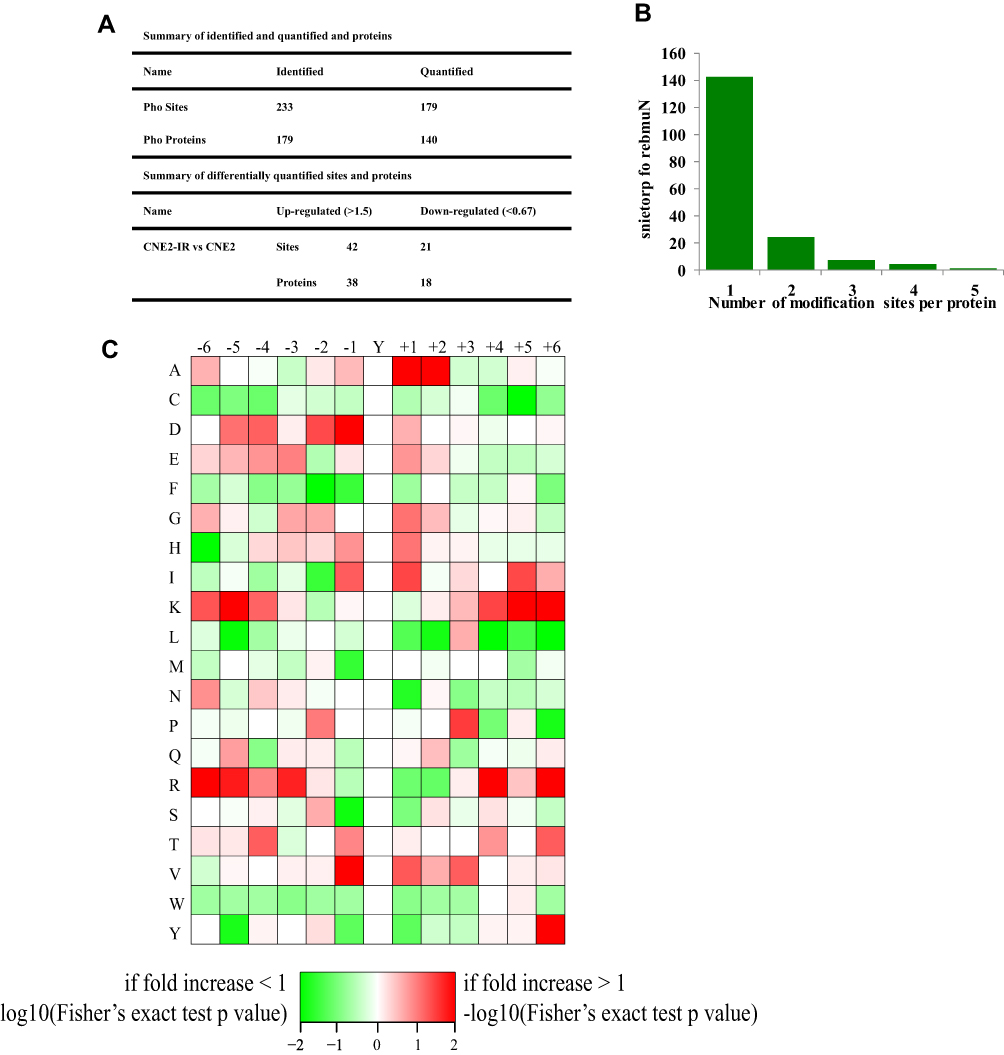 |
Figure 2 Phosphoproteomic analysis on radiosensitivity-related proteome in CNE2 and CNE2-IR. (A) Enrichment of differentially expressed proteins in CNE2 and CNE2-IR. (B) Among the 179 identified protein groups, most of the proteins exhibited one modification site. (C) Phosphomotif analysis on identified tyrosine phosphoproteins. |
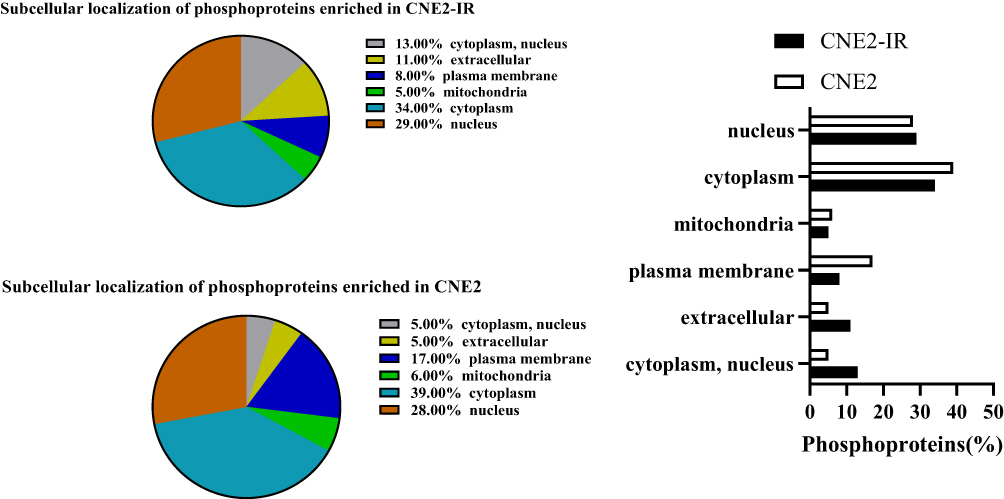 |
Figure 3 Protein subcellular localization annotation terms linked to either statistically significant CNE2-IR or CNE2 parental up-regulated phosphoproteins generated using the DAVID functional annotation tool. |
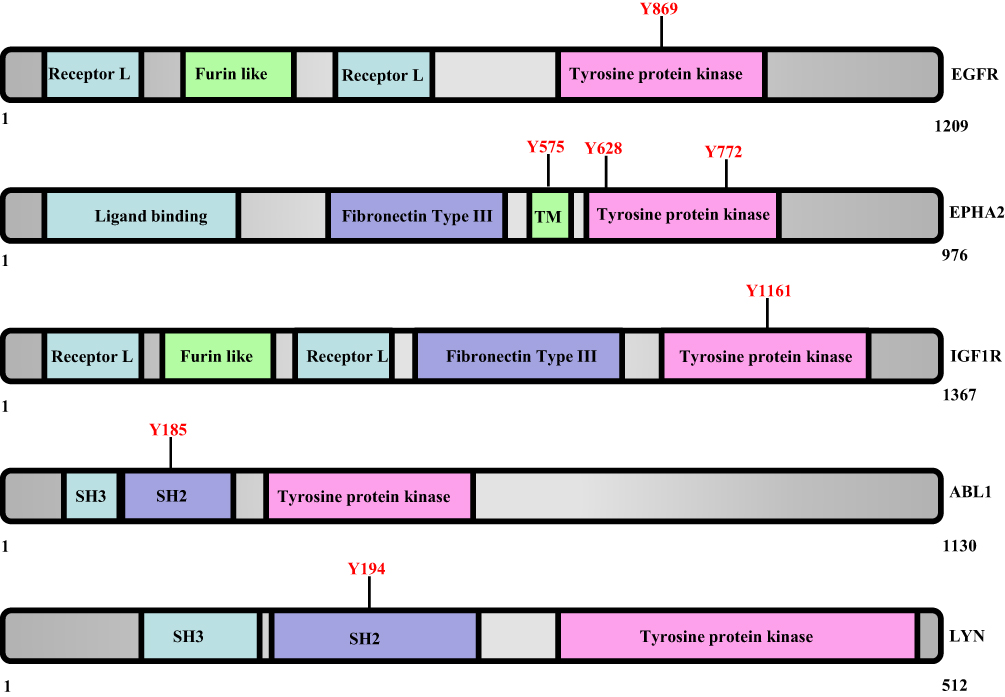 |
Figure 4 Up-regulated tyrosine phosphorylation of the protein/receptor tyrosine kinases in CNE2-IR vs CNE2. |
Differential Activation of Multiple Biological Processes/Pathways in Radioresistant CNE2-IR Cells
Intensive bioinformatic analysis for 56 differentially phosphorylated tyrosine proteins was carried out. To identify cellular pathways and the protein complex related with radiosensitivity, we performed the analysis based on KEGG Pathway, GO Biological Processes, Reactome Gene Sets, Canonical Pathways and CORUM. Our findings showed that the pathways of E-cadherin stabilization (EPHA2, EGFR, IGF1R, VASP, VCL, ACTN1, CTNNA1), cell-cell adhesion (ABL1, ACTN1, ANXA2, CAV1, CTNNA1, DSP, EGFR, LYN, MYH9, VCL, ADAM9, BAIAP2L1, ANXA5, CDK1, KIF23), cell junction organization (ABL1, CTNNA1, DSP, EGFR, IGF1R, EPHA2, RASSF1, BST2, CHMP1A, VASP, BAIAP2L1, KIF23), and EPHA-mediated growth cone collapse (Growth cone collapse is an easy and efficient test for detecting and characterizing axon guidance activities secreted or expressed by cells) (EPHA2, LYN, MYH9, ABL1, CTNNA1, ADAM9, ANXA2, ACTN1, BAIAP2L1, KIF23) were the dominant pathways enriched in CNE2-IR cells (Figure 5A). However, as shown in Figure 5B, some pathways such as nucleocytoplasmic transport (MAPK14, EGFR, NPM1, PTPN11, STAT3, NDC1, THOC2, FYN, HSP90AA1, ATP1A1, TRIM29, KRT18, RBBP6), post-transcriptional regulation of gene expression (MAPK14, DDX1, EGFR, HNRNPC, NPM1, STAT3, NDC1, FYN, KRT18, TOP1, HSP90AA1, ATP1A1), and regulation of DNA metabolic process (EGFR, HNRNPC, HSP90AA1, NPM1, RBBP6, PTPN11, NDC1) were significantly enriched in CNE2 cells.
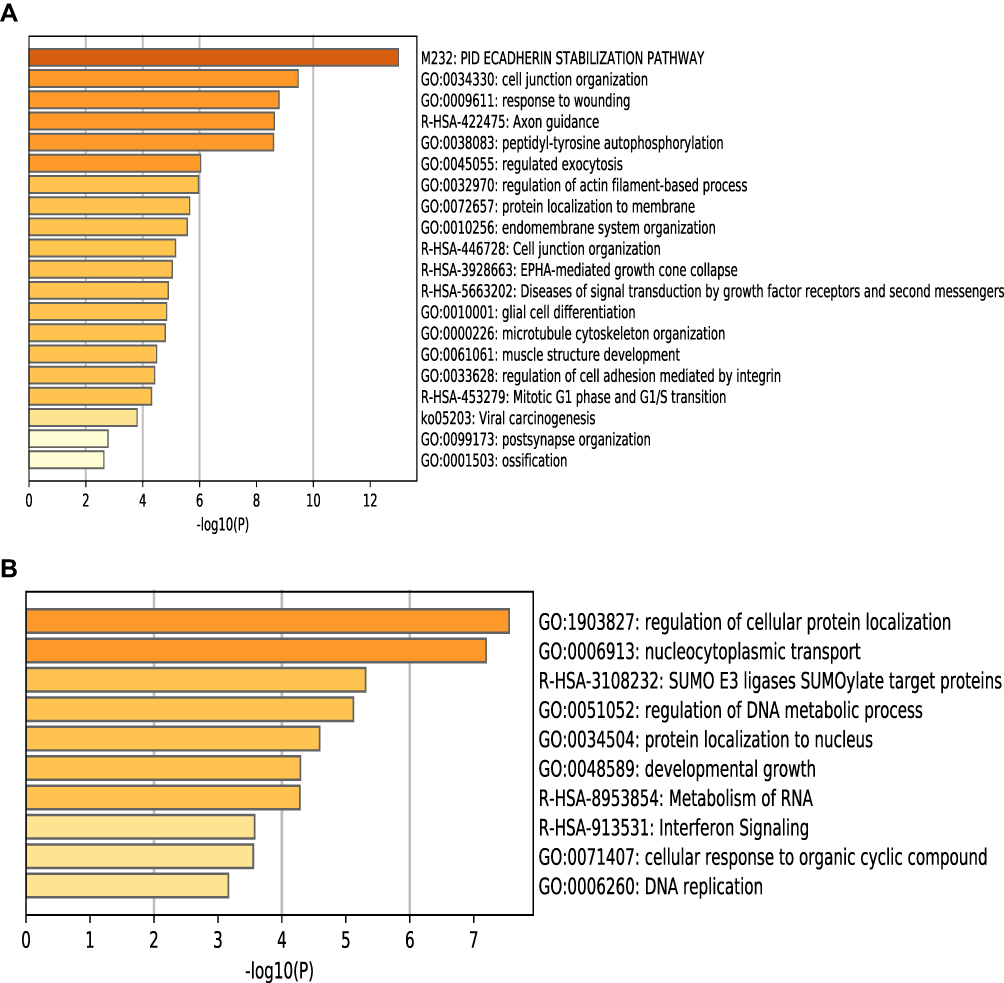 |
Figure 5 Pathway and process enrichment analysis on the differential phosphoproteins in CNE2-IR vs CNE2. (A) Enriched pathways and process of up-regulated phosphoproteins. (B) Enriched pathways and process of down-regulated phosphoproteins. |
Multiple Components of E-Cadherin Stabilization Pathway are Significantly Activated in CNE2-IR Cells
Quantitative proteomic data suggested a robust activation of components of E-cadherin stabilization pathway in CNE2-IR cells compared to CNE2. Eleven tyrosine phosphorylation sites in 7 protein groups (EPHA2, EGFR, IGF1R, VASP, VCL, ACTN1, CTNNA1) were identified to be significantly increased in CNE2-IR vs CNE2 (Figure 6A). Among these quantified sites, considerably higher levels of EPHA2 tyrosine phosphorylation (pY772, pY628, and pY575) could be appreciated in CNE2-IR cells (Figure 6A). Consistently, Western blotting analysis revealed a similar pattern of increased tyrosine phosphorylation on EPHA2 (pY772), EGFR (pY869), and IGF1R (pY1161) (Figure 6B). Protein level of E-cadherin was greatly reduced in CNE2-IR, as compared with parental CNE2 (Figure 6B). These results suggested that attenuation of E-cadherin expression induced by RTK signaling might contribute to the acquisition of radioresistance in NPC cells.
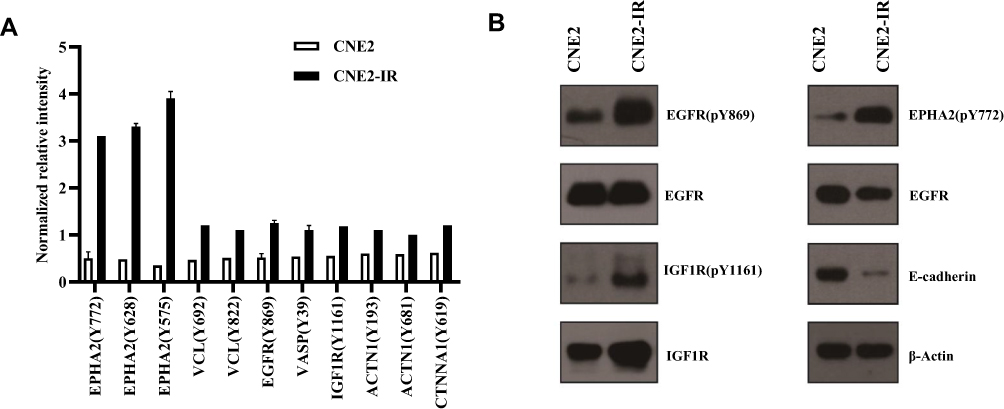 |
Figure 6 (A) Enrichment of phosphoproteins of E-cadherin stabilization pathway in CNE2-IR vs CNE2. (B) Western blotting validation on the expression of phosphoproteins in CNE2 and CNE2-IR cells. |
EPHA2 Reduces E-Cadherin Expression and Promotes Radioresistance in CNE2-IR Cells
To confirm the hypothesis that attenuation of E-cadherin promoted resistance to irradiation in NPC cells, we manipulated E-cadherin expression in CNE2 or CNE2-IR cells. As shown in Figure 7A, E-cadherin expression was successfully reduced by siRNA targeting E-cadherin in CNE2; while its expression was increased in CNE2-IR expressing E-cadherin ORF plasmid. Results from the colony surviving analysis showed that knockdown of E-cadherin in CNE2 cells significantly increased colony formation following 6Gy γ-irradiation; while over-expression of E-cadherin in CNE2-IR cells impaired colony formation after receiving γ-irradiation (Figure 7B). These results suggested that E-cadherin could play an important role in the development of radioresistance in NPC.
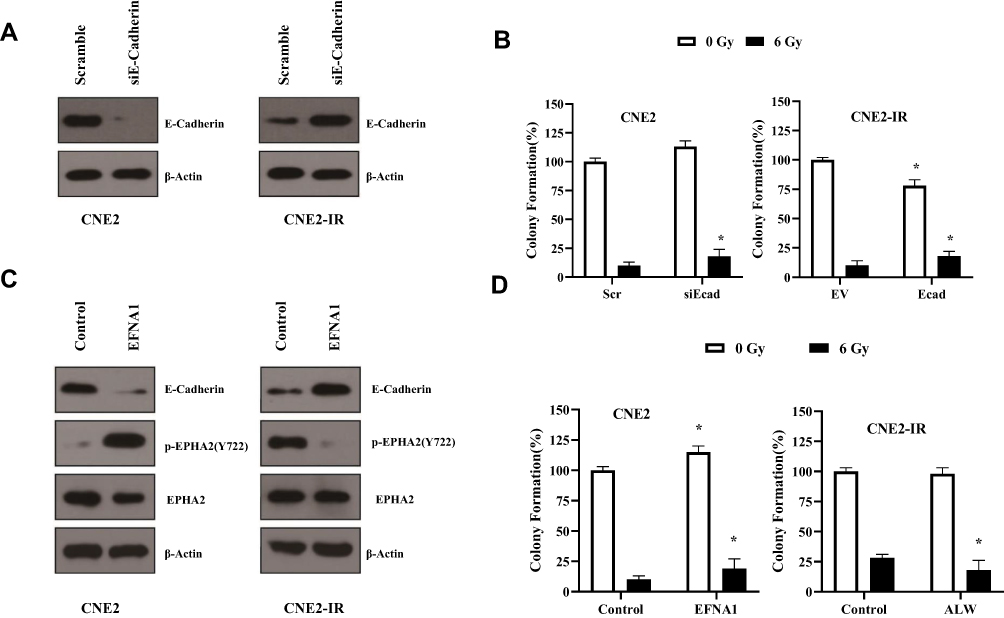 |
Figure 7 (A) Western blotting analysis on E-cadherin expression in CNE2 with E-cadherin specific siRNA or CNE2-IR cells over-expressing E-cadherin ORF plasmid. (B) Knockdown of E-cadherin in CNE2 or over-expression of E-cadherin in CNE2-IR affected colony formation after irradiation, *P<0.05. (C) Western blotting analysis on E-cadherin expression in CNE2 or CNE2-IR cells treated with EphrinA1-Fc (1 μg/mL, 48 hours) or EPHA2 inhibitor ALW (1 μM, 48 hours) respectively. (D) EphrinA1-Fc stimulation or EPHA2 inhibition regulated colony formation after irradiation in CNE2 or CNE2-IR, respectively., *P<0.05. |
To further explore the regulatory role of EPHA2 on the expression of E-cadherin, we treated CNE2 cells with EPHA2 ligand EphrinA1-Fc or EPHA2 inhibitor ALW-II-41-27.20,21 We observed the CNE2 cells incubated with EphrinA1-Fc exhibited higher EPHA2 Y772 phosphorylation and lower E-cadherin expression, as compared with PBS control (Figure 7C). Furthermore, an ATP-competitive EPHA2 RTK inhibitor (ALW-II-41-27, ALW) reduced EPHA2 Y772 phosphorylation and increased the expression of E-cadherin in CNE2-IR cells. Colony formation analysis showed that EFNA1 (EFNA1 is the ligand of EPHA2) treatment in CNE2 significantly promoted colony formation after 6Gy irradiation; while incubation with EPHA2 inhibitor ALW-II-41-27 in CNE2-IR cells impaired colony formation after irradiation, as compared with solvent control (DMSO) (Figure 7D). These results suggested that EPHA2 signaling might regulate E-cadherin expression and exert a potential function in the development of radioresistance in NPC.
Discussion
Radioresistance remains a major problem in the treatment of NPC.22,23 The molecular mechanisms are still poorly understood. Quantitative phosphoproteomic techniques have been widely applied in many preclinical and clinical investigations due to their advantage of revealing the dynamics of protein expression and protein–protein interactions from a global perspective, which contributes greatly to our understanding of the gene function in cellular processes.24 Our study is, to our knowledge, the first quantitative phosphoproteomic analysis of acquired resistance to radiotherapy in NPC cells. We showed that CNE2 NPC cells that have acquired resistance to irradiation harbor an enrichment of phosphotyrosine proteins. In total, 233 tyrosine phosphorylation sites in 179 protein groups were identified. Among the identified protein groups, 38 tyrosine phosphorylated proteins are up-regulated and 18 tyrosine phosphorylated proteins are down-regulated in CNE2IR/CNE2. Our findings highlighted the usefulness of quantitative proteomic technique in identifying radiosensitivity-related proteins with good sensitivity and reproducibility.
The enriched tyrosine phosphoproteins might play a critical role in the regulation of radioresistance. These phosphoproteins include several receptor/protein tyrosine kinases (EGFR, IGF1R, and ABL1). EGFR has previously been shown to exhibit irradiation-induced tyrosine phosphorylation and play important roles in pro-survival signaling after radiotherapy in cancer cells.25,26 Interestingly, we only observed elevated EGFR phosphorylation at Y869, but not phosphorylation at Y1068 and Y1173 (ligand dependent) in CNE2-IR cells. Nevertheless, LYN, one of the Src family genes, also showed increased tyrosine phosphorylation in CNE2-IR. As EGFR Y869 phosphorylation was shown to be Src dependent, it would be reasonable to propose that Src, rather than EGF ligand, might contribute to EGFR activation and radioresistance in CNE2-IR.27 Activation of IGF1R signaling is a well-established bypass mechanism of resistance to radiotherapy. Previous studies indicated that ionizing radiation activated IGF-1R and triggered a cytoprotective signaling in cancer cells.28 Inhibition of IGF-1R enhanced tumor cell sensitivity to ionizing radiation in prostate cancer and glioma.29,30 ABL1 (ABL Proto-Oncogene 1) critically contributes to cancer cell therapy resistance and DNA double strand break (DSB) repair.31 ABL1 kinase phosphorylation was seen after ionizing radiation in cancer cells; dual targeting of ABL1 and beta1-integrin sensitized head and neck cancer cells to radiotherapy.9 ANXA2 is a key factor to promote therapeutic resistance of NPC.32 We found that ANXA2 Y24 phosphorylation was elevated in CNE2-IR cells, suggesting ANXA2 tyrosine phosphorylation might also contribute to radioresistance in NPC cells. Therefore, our phosphoproteomic study may provide a rich source of new candidates for target validation and drug development to overcome radioresistance in NPC.
In addition, we found that phosphoproteins (EGFR, IGF1R, EPHA2, VASP, VCL, ACTN1, and CTNNA1) involved in E-cadherin stabilization pathway are significantly enriched in CNE2-IR cells. E-cadherin is the major adhesion protein associated with epithelial cells. Loss of its expression is diagnostic of the epithelial to mesenchymal transition (EMT). There was a general correlation between EMT, based on loss of E-cadherin expression, and radioresistance.33–36 Indeed, we observed a decline of E-cadherin expression in radioresistant CNE2-IR cells. Manipulation of E-cadherin expression regulated radiosensitivity in our CNE2/CNE2-IR cell model. However, it remains to be determined if EPHA2, one of the prominent genes involved in the E-cadherin stabilization pathway, is a cause or consequence of the acquisition of radioresistance. Mosch et al showed that irradiation affects cellular properties and Eph receptor expression in human melanoma cells.37 Graves et al revealed that ionizing radiation induces EphA2 S897 phosphorylation in a MEK/ERK/RSK-dependent manner.38 These results suggested that EPHA2 phosphorylation might contribute to the radioresistance in cancer cells, despite its mechanism remains to be poorly understood. In our study, we found three tyrosine sites (Y575, Y628, and Y772) highly phosphorylated in EPHA2 in CNE2-IR, suggesting EphA2 tyrosine phosphorylation might contribute to resistance to radiotherapy in NPC. We also showed that EPHA2 tyrosine phosphorylation (pY772) was regulated by EPHA2 ligand and EPHA2 inhibitor. EPHA2 activity regulated E-cadherin expression and radiosensitivity in CNE2/CNE2-IR cell model. Our data would suggest that EPHA2/E-cadherin pathway is an actionable target for salvage therapy and further investigation to dissect the contribution of components of this pathway to acquired radioresistance is planned.
In conclusion, our study provides a useful resource for future studies investigating the potential determinants of radioresistance through tyrosine phosphoproteomic approach, and identifies a new therapeutic strategy of inhibiting EPHA2 function for further evaluation as a means of overcoming radioresistance and tumor recurrence in NPC.
Data Sharing Statement
The datasets used and/or analyzed during the current study are available from the corresponding author on reasonable request.
Ethics Approval and Consent to Participate
Not applicable.
Patient Consent for Publication
Not applicable.
Funding
This study was supported by the National Natural Science Funds of China (Grant No.82003239) and Hunan Province Natural Science Foundation (Youth Foundation Project) (No.2019JJ50945).
Disclosure
The authors declare that they have no competing interests.
References
1. Zhou Q, He Y, Zhao Y, Wang Y, Kuang W. A study of 358 cases of locally advanced nasopharyngeal carcinoma receiving intensity-modulated radiation therapy: improving the seventh edition of the american joint committee on cancer t-staging system. Biomed Res Int. 2017;2017:1419676.
2. Li Z, Li Y, Yan S, Fu J, Zhou Q, Huang X. Nimotuzumab combined with concurrent chemoradiotherapy benefits patients with advanced nasopharyngeal carcinoma. Onco Targets Ther. 2017;10:5445–5458. doi:10.2147/OTT.S141538
3. Zahari MS, Wu X, Blair BG, et al. Activating mutations in pik3ca lead to widespread modulation of the tyrosine phosphoproteome. J Proteome Res. 2015;14(9):3882–3891. doi:10.1021/acs.jproteome.5b00302
4. Liu T, Singh R, Rios Z, et al. Tyrosine phosphorylation of HSC70 and its interaction with RFC mediates methotrexate resistance in murine L1210 leukemia cells. Cancer Lett. 2015;357(1):231–241. doi:10.1016/j.canlet.2014.11.036
5. Shajahan AN, Wang A, Decker M, Minshall RD, Liu MC. Caveolin-1 tyrosine phosphorylation enhances paclitaxel-mediated cytotoxicity. J Biol Chem. 2007;282(8):5934–5943. doi:10.1074/jbc.M608857200
6. Zhang S, Huang WC, Li P, Guo H, Poh SB, Brady SW. Combating trastuzumab resistance by targeting SRC, a common node downstream of multiple resistance pathways. Nat Med. 2011;17(4):461–469. doi:10.1038/nm.2309
7. Paulson AK, Linklater ES, Berghuis BD, et al. MET and ERBB2 are coexpressed in ERBB2+ breast cancer and contribute to innate resistance. Mol Cancer Res. 2013;11(9):1112–1121. doi:10.1158/1541-7786.MCR-13-0042
8. Mohd NS, Generali D, Kramer-Marek G, et al. Nuclear HER4 mediates acquired resistance to trastuzumab and is associated with poor outcome in HER2 positive breast cancer. Oncotarget. 2014;5(15):5934–5949. doi:10.18632/oncotarget.1904
9. Koppenhagen P, Dickreuter E. Head and neck cancer cell radiosensitization upon dual targeting of c-Abl and beta1-integrin. Radiother Oncol. 2017;124(3):370–378. doi:10.1016/j.radonc.2017.05.011
10. Carr MI, Roderick JE, Zhang H, Woda BA, Kelliher MA. Phosphorylation of the Mdm2 oncoprotein by the c-Abl tyrosine kinase regulates p53 tumor suppression and the radiosensitivity of mice. Proc Natl Acad Sci U S A. 2016;113(52):15024–15029. doi:10.1073/pnas.1611798114
11. Gioia R, Leroy C, Drullion C, et al. Quantitative phosphoproteomics revealed interplay between Syk and Lyn in the resistance to nilotinib in chronic myeloid leukemia cells. Blood. 2011;118(8):2211–2221.
12. Li Z, Fu J, Li N. Quantitative proteome analysis identifies MAP2K6 as potential regulator of LIFR-induced radioresistance in nasopharyngeal carcinoma cells. Biochem Biophys Res Commun. 2018;505(1):274–281. doi:10.1016/j.bbrc.2018.09.020
13. Li Z, Li N, Shen L. Quantitative proteomic analysis identifies mapk15 as a potential regulator of radioresistance in nasopharyngeal carcinoma cells. Front Oncol. 2018;8:548.
14. Kanehisa M, Sato Y, Kawashima M, Furumichi M. KEGG as a reference resource for gene and protein annotation. Nucleic Acids Res. 2016;44(D1):D457–D462. doi:10.1093/nar/gkv1070
15. Jun F, Hong J, Liu Q, et al. Epithelial membrane protein 3 regulates TGF-beta signaling activation in CD44-high glioblastoma. Oncotarget. 2017;8(9):14343–14358.
16. Fu J, Shao CJ, Chen FR, Ng HK. Autophagy induced by valproic acid is associated with oxidative stress in glioma cell lines. Neuro Oncol. 2010;12(4):328–340. doi:10.1093/neuonc/nop005
17. Zhang B, Qu JQ, Xiao L, et al. Identification of heat shock protein 27 as a radioresistance-related protein in nasopharyngeal carcinoma cells. J Cancer Res Clin Oncol. 2012;138(12):2117–2125. doi:10.1007/s00432-012-1293-0
18. Feng XP, Yi H, Li MY, et al. Identification of biomarkers for predicting nasopharyngeal carcinoma response to radiotherapy by proteomics. Cancer Res. 2010;70(9):3450–3462.
19. Huang DW, Sherman BT. Systematic and integrative analysis of large gene lists using DAVID bioinformatics resources. Nat Protoc. 2009;4(1):44–57. doi:10.1038/nprot.2008.211
20. Xiong Y, Li KX, Wei H, Jiao L, Yu SY. Eph/ephrin signalling serves a bidirectional role in lipopolysaccharide-induced intestinal injury. Mol Med Rep. 2018;18(2):2171–2181.
21. Amato KR, Wang S, Hastings AK, et al. Genetic and pharmacologic inhibition of EPHA2 promotes apoptosis in NSCLC. J Clin Invest. 2014;124(5):2037–2049. doi:10.1172/JCI72522
22. Lee AW, Ma BB, Ng WT. Management of nasopharyngeal carcinoma: current practice and future perspective. J Clin Oncol. 2015;33(29):3356–3364. doi:10.1200/JCO.2015.60.9347
23. Chua M, Wee J, Hui EP. Nasopharyngeal carcinoma. Lancet. 2016;387(10022):1012–1024. doi:10.1016/S0140-6736(15)00055-0
24. Riley NM. Phosphoproteomics in the age of rapid and deep proteome profiling. Anal Chem. 2016;88(1):74–94. doi:10.1021/acs.analchem.5b04123
25. Kiyozuka M, Akimoto T, Fukutome M, Motegi A. Radiation-induced dimer formation of EGFR: implications for the radiosensitizing effect of cetuximab. Anticancer Res. 2013;33(10):4337–4346.
26. Wu S, Zhu L, Tu L, et al. AZD9291 increases sensitivity to radiation in pc-9-ir cells by delaying DNA damage repair after irradiation and inducing apoptosis. Radiat Res. 2018;189(3):283–291. doi:10.1667/RR14682.1
27. Dittmann K, Mayer C, Kehlbach R. Radiation-induced caveolin-1 associated EGFR internalization is linked with nuclear EGFR transport and activation of DNA-PK. Mol Cancer. 2008;7:69. doi:10.1186/1476-4598-7-69
28. Cosaceanu D, Budiu RA, Carapancea M, Castro J, Lewensohn R. Ionizing radiation activates IGF-1R triggering a cytoprotective signaling by interfering with Ku-DNA binding and by modulating Ku86 expression via a p38 kinase-dependent mechanism. Oncogene. 2007;26(17):2423–2434. doi:10.1038/sj.onc.1210037
29. Osuka S, Sampetrean O, Shimizu T, et al. IGF1 receptor signaling regulates adaptive radioprotection in glioma stem cells. Stem Cells. 2013;31(4):627–640. doi:10.1002/stem.1328
30. Chitnis MM, Lodhia KA, Aleksic T, Gao S, Protheroe AS. IGF-1R inhibition enhances radiosensitivity and delays double-strand break repair by both non-homologous end-joining and homologous recombination. Oncogene. 2014;33(45):5262–5273. doi:10.1038/onc.2013.460
31. Tang J, Wang JY. Detection of early Abl kinase activation after ionizing radiation by using a peptide biosensor. Chembiochem. 2012;13(5):665–673. doi:10.1002/cbic.201100763
32. Chen CY, Lin YS, Chen CH. Annexin A2-mediated cancer progression and therapeutic resistance in nasopharyngeal carcinoma. J Biomed Sci. 2018;25(1):30. doi:10.1186/s12929-018-0430-8
33. Xie G, Ao X, Lin T, et al. E-cadherin-mediated cell contact controls the epidermal damage response in radiation dermatitis. J Invest Dermatol. 2017;137(8):1731–1739. doi:10.1016/j.jid.2017.03.036
34. Huang X, Qian Y, Wu H, et al. Aberrant expression of osteopontin and E-cadherin indicates radiation resistance and poor prognosis for patients with cervical carcinoma. J Histochem Cytochem. 2015;63(2):88–98.
35. Zhang H, Luo H, Jiang Z, Yue J, Hou Q, Xie R. Fractionated irradiation-induced EMT-like phenotype conferred radioresistance in esophageal squamous cell carcinoma. J Radiat Res. 2016;57(4):370–380. doi:10.1093/jrr/rrw030
36. Su Z, Li G, Liu C, Ren S, Tian Y, Liu Y. Ionizing radiation promotes advanced malignant traits in nasopharyngeal carcinoma via activation of epithelial-mesenchymal transition and the cancer stem cell phenotype. Oncol Rep. 2016;36(1):72–78.
37. Mosch B, Pietzsch D. Irradiation affects cellular properties and Eph receptor expression in human melanoma cells. Cell Adh Migr. 2012;6(2):113–125. doi:10.4161/cam.20655
38. Graves PR, Din SU, Ashamalla M, Ashamalla H, Gilbert T. Ionizing radiation induces EphA2 S897 phosphorylation in a MEK/ERK/RSK-dependent manner. Int J Radiat Biol. 2017;93(9):929–936. doi:10.1080/09553002.2017.1355580
 © 2020 The Author(s). This work is published and licensed by Dove Medical Press Limited. The full terms of this license are available at https://www.dovepress.com/terms.php and incorporate the Creative Commons Attribution - Non Commercial (unported, v3.0) License.
By accessing the work you hereby accept the Terms. Non-commercial uses of the work are permitted without any further permission from Dove Medical Press Limited, provided the work is properly attributed. For permission for commercial use of this work, please see paragraphs 4.2 and 5 of our Terms.
© 2020 The Author(s). This work is published and licensed by Dove Medical Press Limited. The full terms of this license are available at https://www.dovepress.com/terms.php and incorporate the Creative Commons Attribution - Non Commercial (unported, v3.0) License.
By accessing the work you hereby accept the Terms. Non-commercial uses of the work are permitted without any further permission from Dove Medical Press Limited, provided the work is properly attributed. For permission for commercial use of this work, please see paragraphs 4.2 and 5 of our Terms.