")
Back to Journals » Journal of Pain Research » Volume 15
Quantitative Radiological Characteristics of the Facet Joints in Patients with Lumbar Foraminal Stenosis
Authors Wang A, Wang T, Zang L , Yuan S , Fan N, Du P, Wu Q
Received 14 May 2022
Accepted for publication 3 August 2022
Published 17 August 2022 Volume 2022:15 Pages 2363—2371
DOI https://doi.org/10.2147/JPR.S374720
Checked for plagiarism Yes
Review by Single anonymous peer review
Peer reviewer comments 2
Editor who approved publication: Dr Michael A Ueberall
Aobo Wang,* Tianyi Wang,* Lei Zang, Shuo Yuan, Ning Fan, Peng Du, Qichao Wu
Department of Orthopedics, Beijing Chaoyang Hospital, Capital Medical University, Beijing, People’s Republic of China
*These authors contributed equally to this work
Correspondence: Lei Zang, Department of Orthopedics, Beijing Chaoyang Hospital, Capital Medical University, 5 JingYuan Road, Shijingshan District, Beijing, 100043, People’s Republic of China, Tel +86 13601252787, Email [email protected]
Purpose: This study aimed to evaluate the degeneration patterns of the facet joints (FJs) in patients with lumbar foraminal stenosis (LFS) and investigate the correlation between quantitative parameters and FJ osteoarthritis (FJ OA).
Patients and Methods: A total of 171 patients with LFS at the L4/5 level and 146 control patients were enrolled in this study. The severity of FJ OA was graded according to the Weishaupt classification. The FJ orientation, FJ tropism, superior articular process cross-sectional area (SAPA), and FJ area were measured at the L3/4, L4/5, and L5/S1 spinal levels. Associations among the parameters were assessed using Pearson’s correlation coefficients. Independent sample t-tests and Pearson’s chi-square tests were used for univariate analyses. The association between LFS and the quantitative parameters was also analyzed using multivariate logistic regression models adjusted for age, gender, and body mass index.
Results: Patients with LFS had more sagittal FJ orientation (37.9 vs 45.0, p < 0.001), more FJ tropism (5.6 vs 3.8, p < 0.001), larger SAPA (129.0 vs 97.8, p < 0.001), and less FJ area (21.7 vs 23.3, p = 0.016). Logistic regression analysis showed that LFS was significantly associated with FJ tropism (odds ratio [OR]: 1.153; p = 0.003) and SAPA (OR: 1.113; p < 0.001). The SAPA showed the largest area under the curve (0.908, 95% confidence interval: 0.875– 0.942) for the diagnosis of LFS. The optimal cutoff value was 114.75 mm2 with 85.4% sensitivity and 87.0% specificity. Additionally, a significant correlation was observed between FJ OA and SAPA and FJ area at each studied spinal level.
Conclusion: This study confirmed that LFS is significantly associated with FJ hypertrophy and tropism. FJ hypertrophy and joint space narrowing correlated with the severity of FJ OA. These results are helpful in understanding the morphology and pathology of FJs.
Keywords: spinal stenosis, facet joint, articular process, osteoarthritis
Introduction
The facet joints (FJs) are paired diarthrodial joints between the articular processes arising from two adjacent vertebrae.1,2 FJs are the only synovial joints in the human spine.3 The lumbar FJs are oriented in a sagittal oblique plane, affording axial loadings and protecting segmental motion from rotation and flexion.4,5 Owing to the functional characteristics of the FJ, degenerative changes, known as FJ osteoarthritis (FJ OA), are common with age, with a prevalence of >50% in the elderly.6,7 FJ OA is related to disc degeneration and lumbar instability1,3 and has been considered one of the major causes of lumbar foraminal stenosis (LFS).8 The synovial cysts and osteophyte formation in the superior articular processes (SAPs) can lead to the narrowing of the foramen and further contribute to LFS symptoms.9,10 Thus, it is important to understand the relationship between anatomical abnormalities of the FJ and LFS.
Several radiological parameters were used to evaluate the FJ. The diagnosis and grading system of FJ OA in computed tomography (CT) images was proposed by Weishaupt.11 The system indicators include joint space narrowing, osteophyte formation, hypertrophy of the articular process, subarticular bone erosion, subchondral cysts, and the vacuum joint phenomenon. FJ orientation and tropism have been proposed to reflect the degeneration and reconstruction of the FJ.12–14 In other studies, the superior articular process cross-sectional area (SAPA)15,16 and FJ area17 were considered good indicators for evaluating patients with degenerative lumbar spinal stenosis. Lim16 proposed the SAPA as a predictor of LFS. However, to the best of our knowledge, the quantitative radiological characteristics of the FJ in patients with LFS have not been comprehensively analyzed. In addition, whether the quantitative parameters of the FJ can reflect the severity of FJ OA remains controversial.18
In many previous studies, magnetic resonance imaging (MRI) was used to evaluate FJs.15 Despite moderate to good accuracy in diagnosing FJ OA,11 MRI is inferior to CT in terms of bone imaging.19 The cortical bone shows nearly zero signal in conventional clinical MRI sequences,20 resulting in unclear boundaries of the SAPs. Therefore, in this study, we analyzed the FJs using CT images.
This study aimed to investigate the characteristics of the FJs on CT images in patients with LFS and the correlation between the quantitative parameters and severity of FJ OA in all enrolled patients. To avoid the influence of different lesion levels on the measurement results, patients with LFS at the L4/5 were selected as the study participants.
Materials and Methods
Study Participants
We retrospectively reviewed the clinical and imaging data of 171 patients diagnosed with LFS who visited our institution between January 2020 and March 2021. All patients underwent preoperative lumbar CT and MRI. The inclusion criteria were as follows: age >40 years, preoperative MRI confirmed narrowing of the bony exit of the nerve root with perineural fat obliteration,21 unilateral or bilateral symptoms with or without cauda equina compression, and the L4/5 as the most stenotic level. The exclusion criteria were a history of lumbar injury or surgery, congenital spine defects, and insufficient clinical or radiological data.
Additionally, 146 patients without lumbar stenosis-related symptoms were enrolled in the control group. The patients underwent routine lumbar CT in the outpatient department. The medical records and CT images of all enrolled patients were reviewed. The demographic and clinical data are summarized in Table 1.
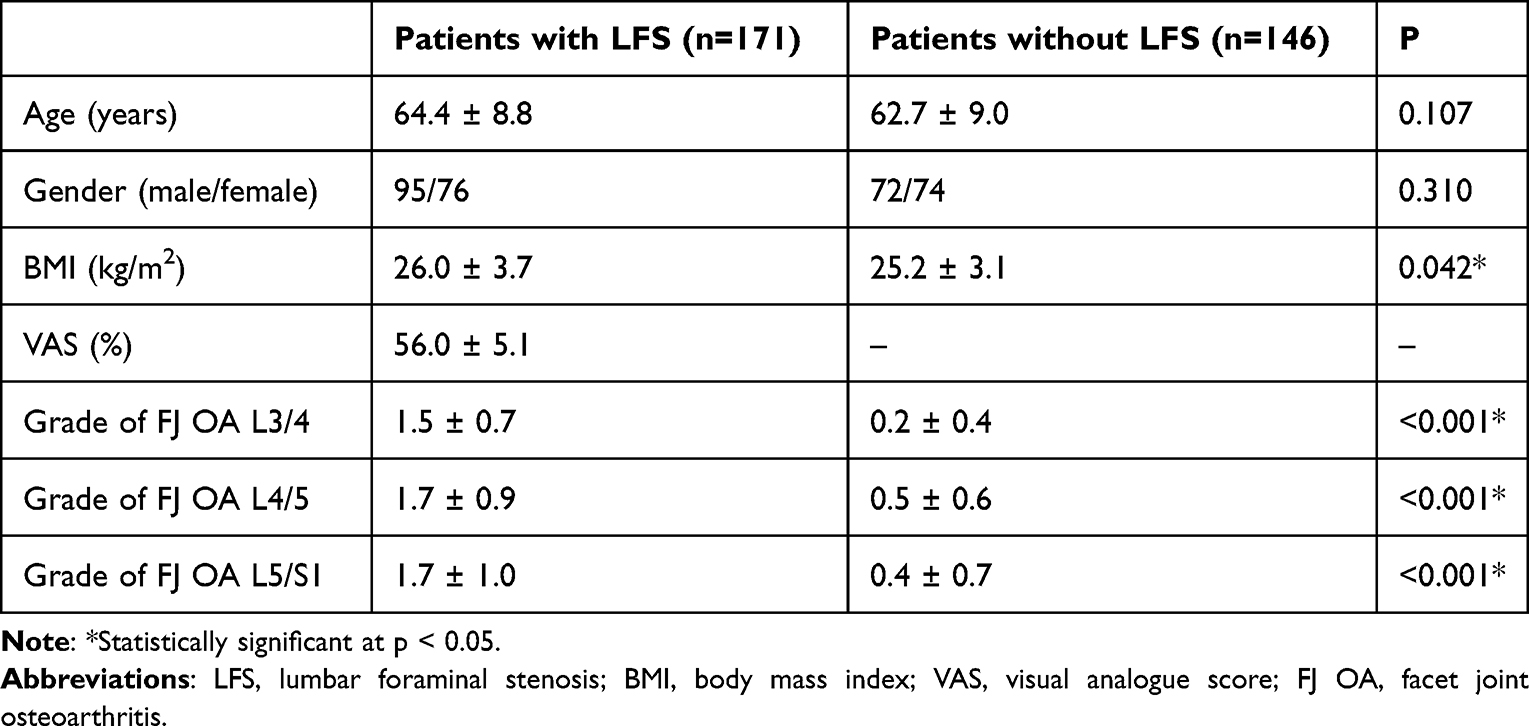 |
Table 1 Characteristics of the Studied Sample |
Radiological Analysis
Axial CT images at the L3/4, L4/5, and L5/S1 spinal levels were obtained using a picture archiving and communication system (PACS). All quantitative measurements were performed using the DICOM (version 3.1) viewer software (Neusoft PACS/RIS) by two trained orthopedic surgeons in a blinded fashion, and the mean of the measurement results was calculated.
FJ OA was diagnosed and graded according to the Weishaupt classification.11 This system classifies FJ OA into four grades: normal (0) to severe (3). The grading procedure was performed by two experienced clinicians. Overall, 85.4% (812/951) of the results were consistent. The remaining atypical cases were reassessed by two clinicians.
All quantitative radiological parameters were measured using the axial CT images. Slices proximal to the appearance of the pedicles were identified to perform the measurements.22 One line was drawn in the midsagittal plane of the vertebra, and the other connected the anterior and posterior margins of the SAPs.18 FJ orientation was defined as the mean facet angle between the left and right sides. FJ tropism was defined as the absolute difference in angles between the two sides. The SAPA and FJ area were measured by outlining the SAP and facet joint space at each level, respectively. (Figure 1).
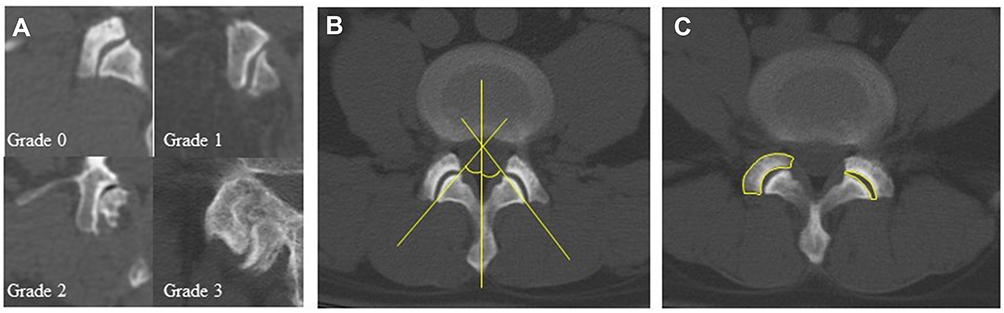 |
Figure 1 Qualitative and quantitative measurements of the facet joints. (A) Examples of CT-evaluated facet joint osteoarthritis grades. (B) Schema of facet joint orientation measurement. (C) Schema of superior articular process cross-sectional area and facet joint area measurement. |
Statistical Analysis
For statistical analyses, data were analyzed using statistical software (SPSS version 23.0 for Windows, IBM). Continuous variables are presented as mean ± standard deviation. Independent sample t-tests and Pearson’s chi-square tests were used to compare the clinical data and radiological parameters between groups. The associations between the Weishaupt grade and quantitative parameters were determined using Spearman correlation coefficient. Correlations between parameters were considered very weak for 0 ≤ |R| < 0.2, weak for 0.2 ≤ |R| < 0.4, moderate for 0.4 ≤ |R| < 0.6, strong for 0.6 ≤ |R| < 0.8, and very strong for 0.8 ≤ |R| ≤ 1.0. Logistic regression analysis was used to identify the association between the quantitative parameters and LFS. Receiver operating characteristic (ROC) curves and areas under the ROC curves (AUCs) were constructed to determine the most appropriate parameter for diagnosing LFS. Sensitivity and specificity were calculated based on the optimal thresholds determined according to the ROC curve analysis. Statistical significance was set at p < 0.05.
Results
The descriptive statistics of the sample are shown in Table 1. No statistical difference in age and sex was found between the patients with and without LFS. However, patients with LFS had a higher body mass index (BMI; 26.0 vs 25.2, p = 0.042) and more severe FJ OA at each spinal level (p < 0.001).
In the comparison of the FJ parameters between patients with and without LFS, the mean FJ tropism (5.6 vs 3.8, p < 0.001) and SAPA (129.0 vs 97.8, p < 0.001) were larger in patients with LFS, whereas the mean FJ orientation (37.9 vs 45.0, p < 0.001) and FJ area (21.7 vs 23.3, p = 0.016) were smaller. The results are summarized in Table 2. Multivariate logistic regression analysis showed that LFS was significantly associated with FJ tropism (odds ratio [OR]: 1.153; p = 0.003) and SAPA (OR: 1.113; p < 0.001; Table 3). After applying the ROC curve analysis, the SAPA showed the largest AUC (0.908, 95% confidence interval: 0.875–0.942; Table 4, Figure 2). The optimal cutoff value of the SAPA for diagnosing LFS was 114.75 mm2, with 85.4% sensitivity and 87.0% specificity.
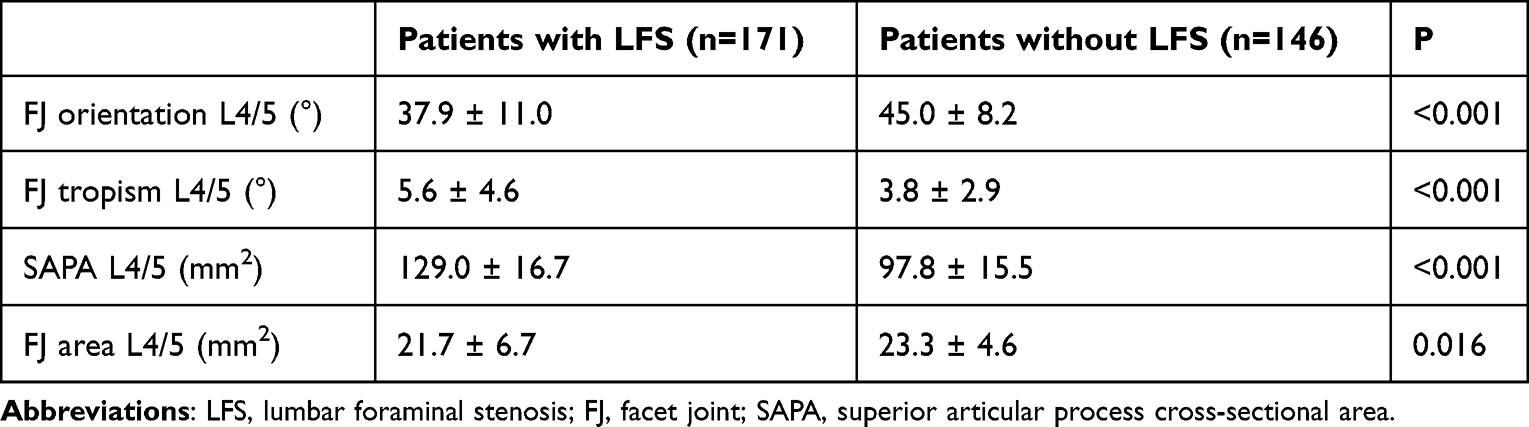 |
Table 2 Comparison of the Quantitative Parameters Between Patients with and without LFS |
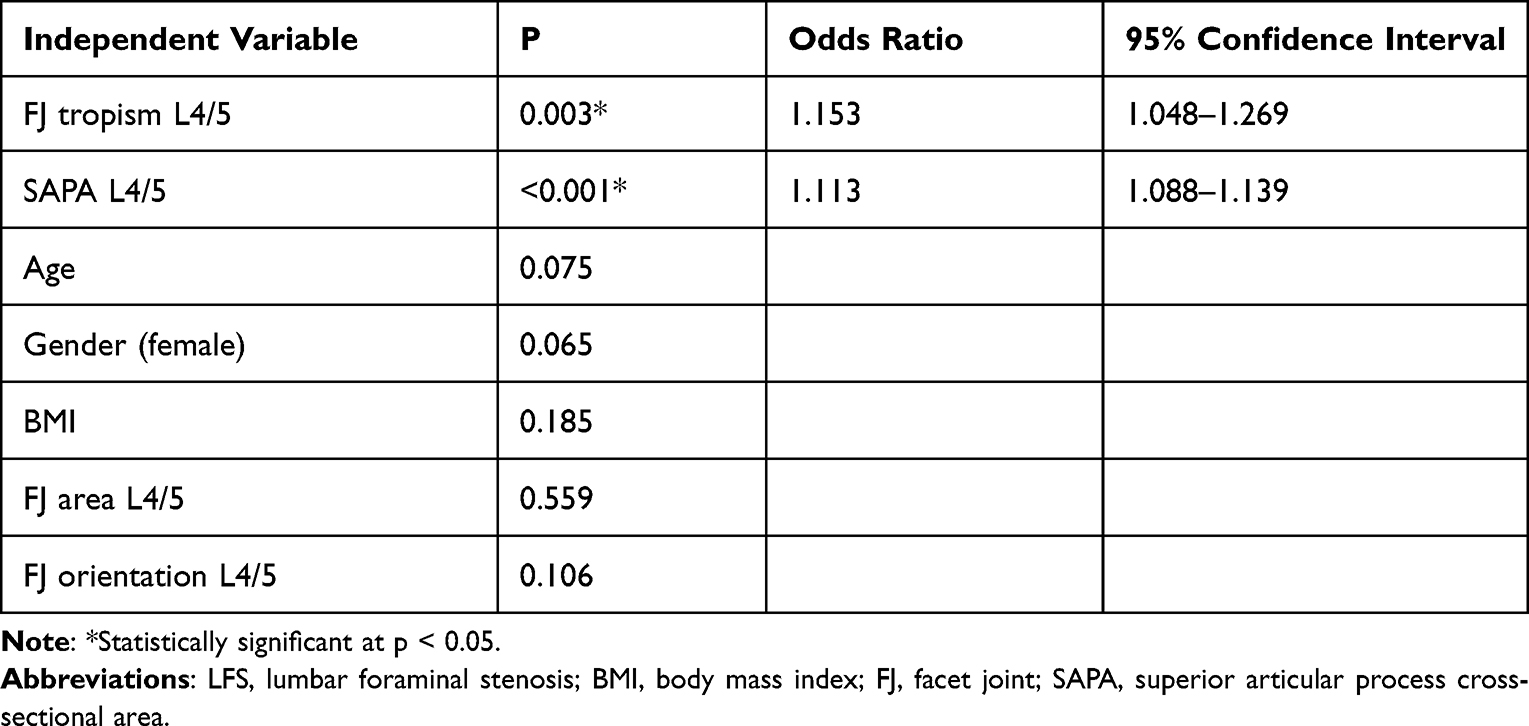 |
Table 3 Association Between LFS and Quantitative Parameters at the Same Level, Adjusted for Age, Gender, and BMI |
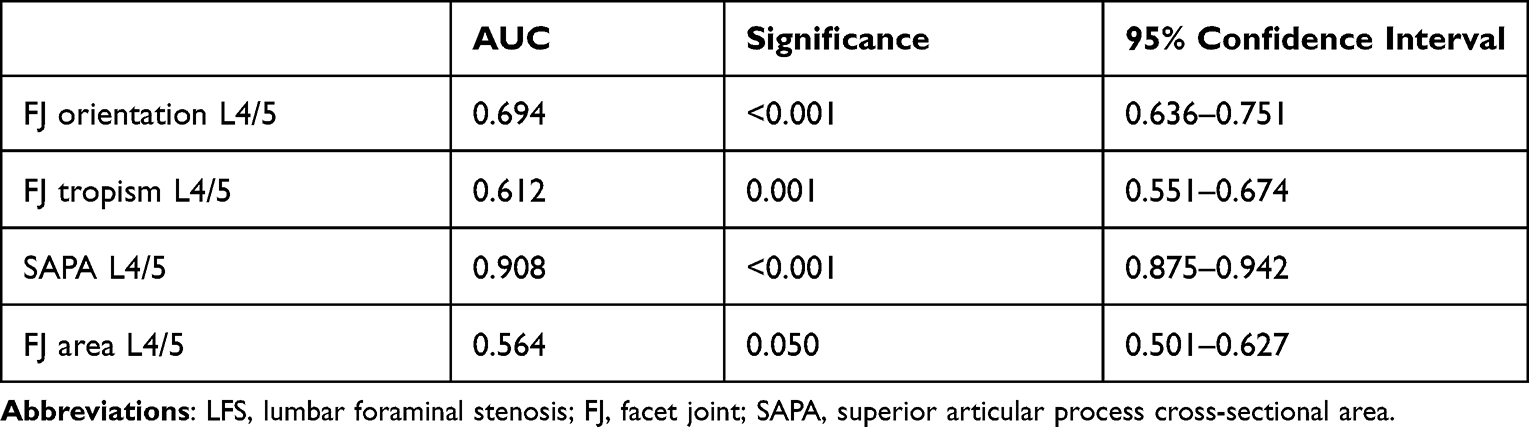 |
Table 4 Areas Under the Receiver Operating Characteristic Curves (AUCs) of the Parameters for Diagnosing LFS |
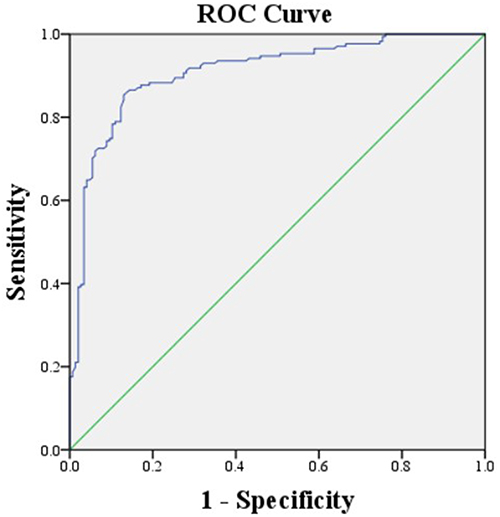 |
Figure 2 Receiver operating characteristic curves of the superior articular process cross-sectional area for diagnosing lumbar foraminal stenosis. |
Figure 3 shows the average values of the quantitative parameters for each FJ OA grade at the L4/5 level. In general, FJ tropism and SAPA increased with the severity of FJ OA, whereas FJ orientation and FJ area decreased with the increasing severity of FJ OA. Table 5 shows the correlations between the grade of FJ OA and age, BMI, and quantitative parameters. The correlations between the SAPA and FJ OA were strong at each studied spinal level (R = 0.764 at L3/4, R = 0.674 at L4/5, R = 0.749 at L5/S1). The correlations between the FJ area and FJ OA were moderate to strong at each studied spinal level (R = −0.406 at L3/4, R = −0.524 at L4/5, R = −0.620 at L5/S1). In addition, no statistically significant correlation was observed between the quantitative parameters and the visual analogue score (VAS) in patients with LFS.
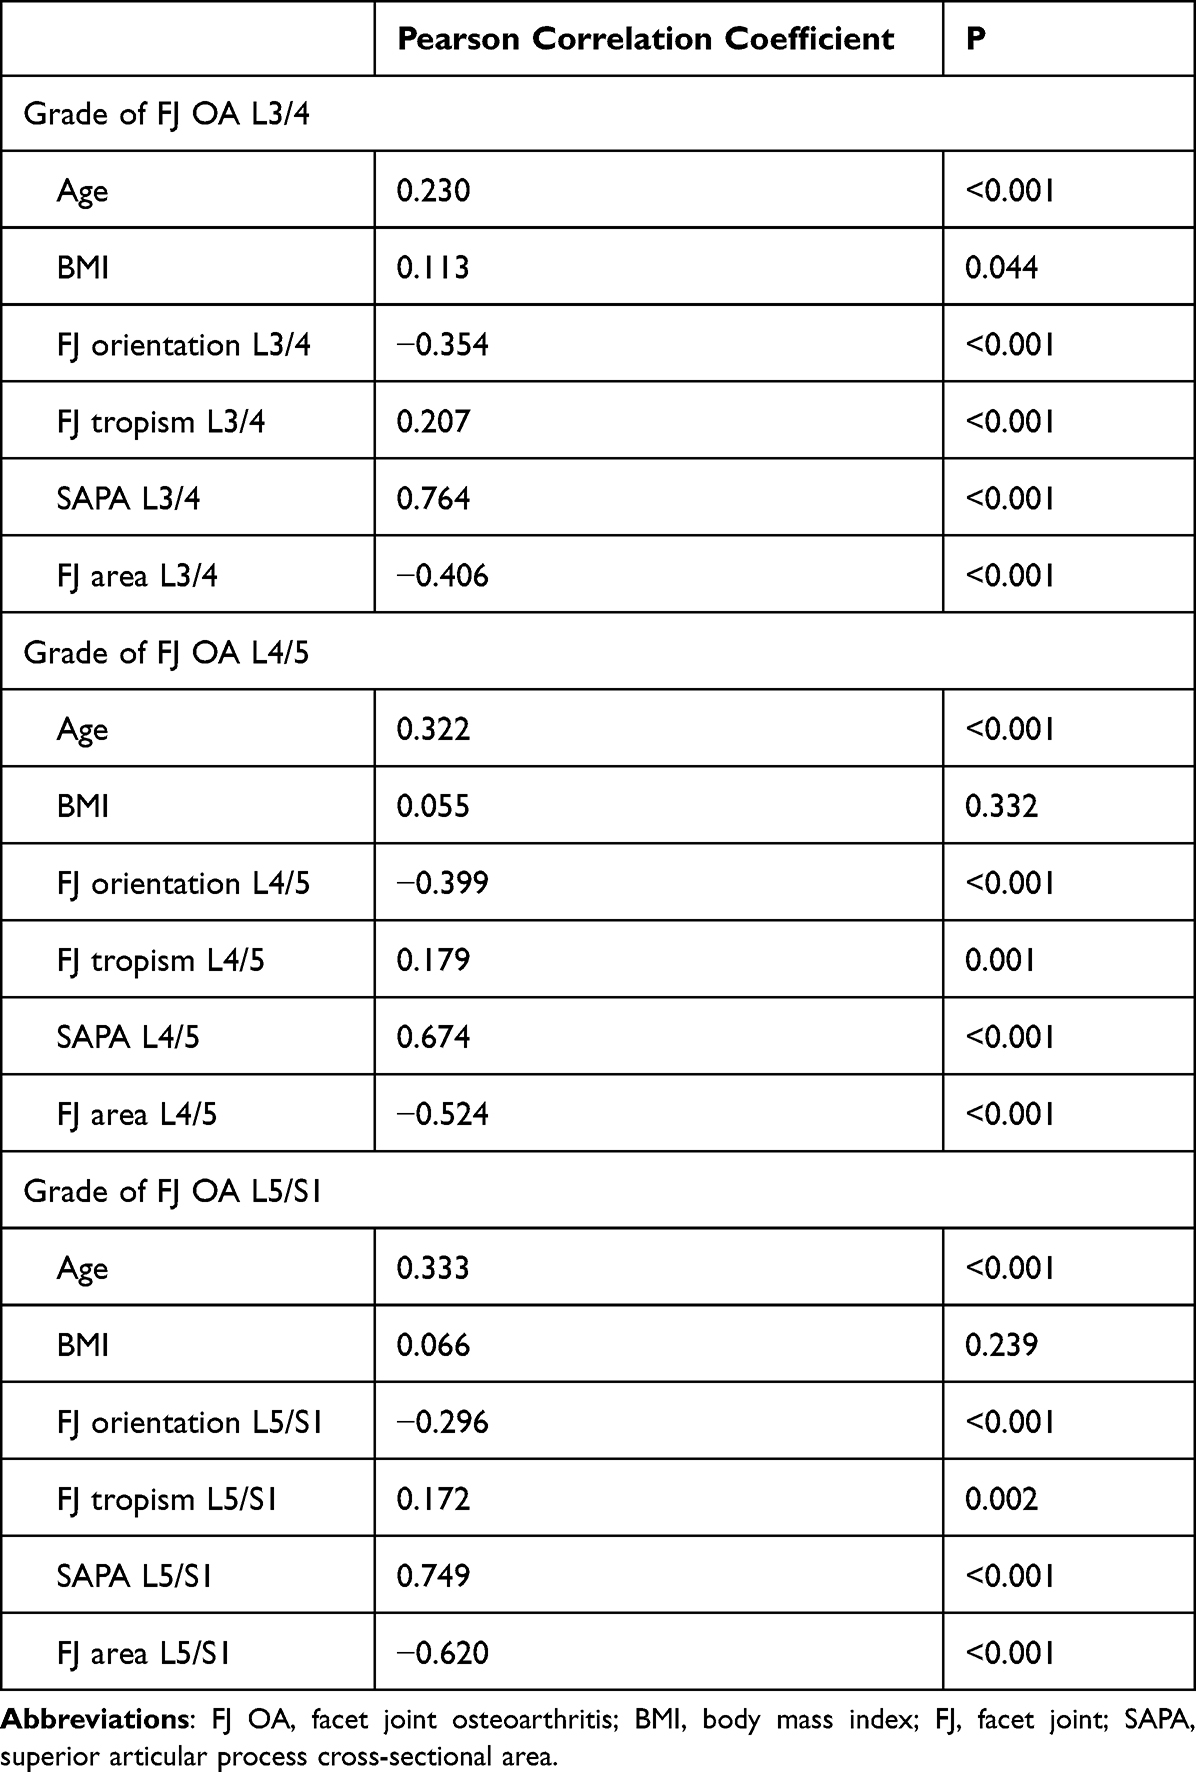 |
Table 5 Correlations Between the Grade of FJ OA and Age, BMI, and the Quantitative Parameters |
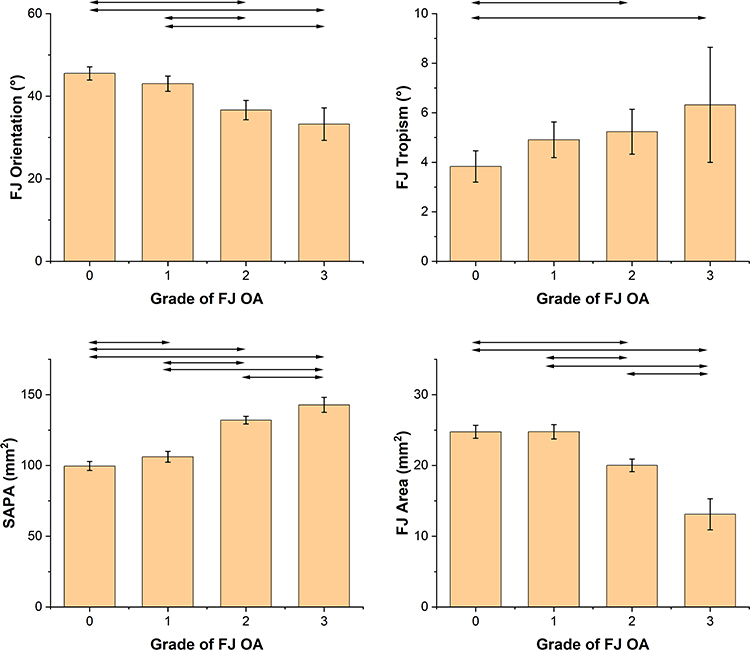 |
Figure 3 Mean and 95% confidence interval of the facet joint orientation (top left), facet joint tropism (top right), superior articular process cross-sectional area (SAPA; bottom left), and facet joint area (bottom right) with each grade of facet joint osteoarthritis (FJ OA) at the L4/5 level (101 patients with grade 0, 97 with grade 1, 94 with grade 2, and 25 with grade 3). Horizontal lines indicate significant differences between grades (independent sample t-test, p <0.05). |
Discussion
In this study, a case-control analysis was designed to assess FJ degeneration using Weishaupt grading and quantitative CT measurements, including orientation, tropism, hypertrophy, and joint space narrowing. Multivariate logistic analysis revealed that LFS was significantly associated with the SAPA and FJ tropism. Correlation analysis showed that the severity of FJ OA was significantly correlated with the SAPA and FJ area. However, no significant correlation was noted between the quantitative parameters and the severity of symptoms (VAS), which may be due to the multifactorial pathology of lumbar stenosis.
FJ orientation is considered an important structural parameter that plays a significant role in the pathology of lumbar degeneration. Kalichman18 analyzed CT images of 191 patients and confirmed that facet sagittal orientation was associated with FJ OA. Liu13 considered that sagittalization of the FJ is a risk factor for lumbar stenosis. However, the relationship between FJ orientation and lumbar degeneration was not strong in the aforementioned studies. Fujiwara12 stated that the sagittal orientation of the FJ is a remodeling process secondary to OA. Many subsequent studies support this view. A biomechanical study showed that a greater coronal orientation of the FJ is associated with a higher contact force.23 Studies on young populations have demonstrated that coronal orientation of the FJ is a risk factor for disc herniation and low back pain.24,25 This evidence indicated that as lumbar degeneration progressed, the FJs were remodeled to a sagittal orientation to reduce loading. However, further studies are required to identify these pathological changes. In this study, we found that the mean FJ orientation decreased with the increasing grade of FJ OA, but the correlation between them was not strong. In addition, the FJ orientation was not significantly associated with LFS. We considered that it was because the FJ orientation was influenced by a mixture of nature and nurture. Thus, FJ orientation may have a relatively large individual variety. It is also worth noting that the values of FJ orientation reported in different studies are not consistent,12,13,18 which also indicates that differences in samples, such as race and age, may have some influence on the measurement results.
FJ tropism reflects the asymmetry of the lumbar vertebrae. However, whether they are associated with lumbar degeneration remains controversial. Kalichman18 considered that the relationship between FJ tropism and FJ OA was “false positive” because facet tropism could only indicate that one side had more severe OA than that of the other. However, in other studies, facet asymmetry was significantly related to lumbar stenosis,14 spondylolisthesis,26 and low back pain.25 In this study, FJ tropism was not strongly correlated with FJ OA but was a risk factor for LFS. This seems to be a combination of the abovementioned views. Although FJ tropism is not directly related to the grade of FJ OA, studies have shown that patients with asymmetric FJ are more vulnerable to shear force than those without.27,28 Thus, more remarkable FJ tropism may accelerate disc degeneration and lead to lumbar stenosis.29,30
In recent years, the SAPA has received increasing attention. Although Barry22 concluded that FJ hypertrophy was a misnomer, many subsequent studies considered the SAPA as an important parameter. An15 and Lim16 demonstrated that the SAPA was sensitive and specific for diagnosing lumbar central canal stenosis and foraminal stenosis, respectively. FJ hypertrophy is also associated with lumbar spondylolisthesis.31 Similar results were observed for the cervical spine.32 In this study, we found that the SAPA strongly correlated with FJ OA. It is considered that disc degeneration and an increase in segmental pressure can lead to osteosclerosis, osteophyte formation, and subchondral cysts, which can increase the cross-sectional area of the articular processes.3 Another study demonstrated that osteophyte formation was an adaptive change to stabilize the segment by lengthening the articular surface.33 The SAPA is also an accurate parameter for diagnosing LFS. This can be explained from two perspectives: First, the major cause of LFS is the loss of disc height, which may increase stress on the FJ and result in a high degree of abrasion.34,35 Second, the articular facets act as the posterior boundaries of the foramen. Hypertrophy and osteophyte formation of the FJ can also lead to a decrease in foraminal volume.8 However, research on the pathology and biomechanics of FJ hypertrophy and osteophyte formation remains limited. Further studies are needed to identify the causal relationship between increased SAPA and LFS.
The FJ area was proposed to reflect the narrowing of the joint space. Patients with lumbar stenosis have a significantly lower FJ area than that of healthy controls.17 However, despite the moderate to strong correlations found between the FJ area and FJ OA in this study, no significant association was found between the FJ area and LFS in the multivariable analysis. Our explanation is that although joint space narrowing is an important indicator of FJ OA, the FJ area may be influenced by other factors. On the one hand, the appearance of vertebral instability or displacement can also lead to the change of FJA. On the other hand, in many cases of severe OA, hypertrophy and osteophyte formation in the articular process can cause lengthening of the joint surface, so the FJ area does not reduce significantly (Figure 4).
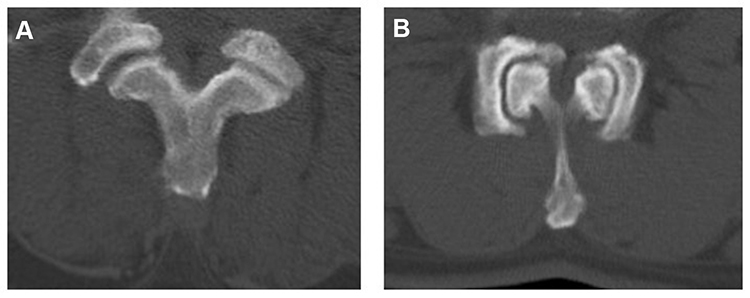 |
Figure 4 Examples of factors that may influence the facet joint area. (A) Vertebral displacement can lead to changes in the facet joint area. (B) Despite severe hyperplasia and sagittalization, the facet joint area increased because of the lengthening of the joint surface. |
This study was a validation and expansion of previous research, with a larger sample size. We qualitatively and quantitatively evaluated the FJ based on several aspects. FJ hypertrophy and tropism are associated with LFS. FJ hypertrophy and joint space narrowing correlated with the severity of FJ OA. Taken together, SAPA seemed to be a good quantitative parameter to reflect FJ OA and degenerative LFS. We speculated that SAP hypertrophy and osteophyte formation could reflect the increase in segmental loading, FJ degenerative change, and nerve root compression. Although the causal relationship among them has not been identified, these conclusions may be helpful for clinicians to understand FJ morphology and degeneration.
This study has several limitations. First, this study was retrospective, and we could not determine the causal relationship between the changes in radiological parameters and FJ OA. Second, the study sample was not community-based. The control patients were from a group of middle-aged and elderly individuals who underwent physical examination, which may explain why aging was not associated with LFS in this study. Third, we used the cross-sectional area to reflect the hypertrophy and narrowing of the FJ. Although this method is very common, there are measurement errors owing to differences in the cutting angle of the CT. Three-dimensional volume measurements are required to further confirm our results. Fourth, other structures in the lumbar spine, such as the intervertebral disc and ligament flavum, were not investigated in this study.
Conclusion
This study confirmed that the SAPA and FJ tropism were associated with LFS. The SAPA and FJ area were significantly correlated with FJ OA. We believe that this measurement tool will help in the evaluation of patients with LFS. Longitudinal studies are required to determine the pathological process of FJ degeneration.
Data Sharing Statement
The datasets used and/or analyzed during the present study are available from the corresponding author on reasonable request.
Ethics Approval and Informed Consent
The study design was approved by the Ethics Review Committee of Beijing Chaoyang Hospital (Registration number: 2021-8-5-5), and no administrative permission was required to access the raw data for this study. In addition, all subjects provided informed consent prior to participation. All methods in the study were carried out in accordance with the Helsinki guidelines and declaration.
Funding
There is no funding that supported this work.
Disclosure
The authors report no conflicts of interest in this work.
References
1. O’Leary SA, Paschos NK, Link JM, Klineberg EO, Hu JC, Athanasiou KA. Facet joints of the spine: structure-function relationships, problems and treatments, and the potential for regeneration. Annu Rev Biomed Eng. 2018;20:145–170. doi:10.1146/annurev-bioeng-062117-120924
2. Cohen SP, Raja SN. Pathogenesis, diagnosis, and treatment of lumbar zygapophysial (facet) joint pain. Anesthesiology. 2007;106(3):591–614. doi:10.1097/00000542-200703000-00024
3. Gellhorn AC, Katz JN, Suri P. Osteoarthritis of the spine: the facet joints. Nat Rev Rheumatol. 2013;9(4):216–224. doi:10.1038/nrrheum.2012.199
4. Farfan HF, Cossette JW, Robertson GH, Wells RV, Kraus H. The effects of torsion on the lumbar intervertebral joints: the role of torsion in the production of disc degeneration. J Bone Joint Surg Am. 1970;52(3):468–497. doi:10.2106/00004623-197052030-00006
5. Asano S, Kaneda K, Umehara S, Tadano S. The mechanical properties of the human L4-5 functional spinal unit during cyclic loading. The structural effects of the posterior elements. Spine. 1992;17(11):1343–1352. doi:10.1097/00007632-199211000-00014
6. Goode AP, Carey TS, Jordan JM. Low back pain and lumbar spine osteoarthritis: how are they related? Curr Rheumatol Rep. 2013;15(2):305. doi:10.1007/s11926-012-0305-z
7. Kalichman L, Kim DH, Li L, Guermazi A, Hunter DJ. Computed tomography-evaluated features of spinal degeneration: prevalence, intercorrelation, and association with self-reported low back pain. Spine J. 2010;10(3):200–208. doi:10.1016/j.spinee.2009.10.018
8. Jenis LG, An HS. Spine update. Lumbar foraminal stenosis. Spine. 2000;25(3):389–394. doi:10.1097/00007632-200002010-00022
9. Ko S, Vaccaro AR, Lee S, Lee J, Chang H. The prevalence of lumbar spine facet joint osteoarthritis and its association with low back pain in selected Korean populations. Clin Orthop Surg. 2014;6(4):385–391. doi:10.4055/cios.2014.6.4.385
10. Suri P, Hunter DJ, Rainville J, Guermazi A, Katz JN. Presence and extent of severe facet joint osteoarthritis are associated with back pain in older adults. Osteoarthritis Cartilage. 2013;21(9):1199–1206. doi:10.1016/j.joca.2013.05.013
11. Weishaupt D, Zanetti M, Boos N, Hodler J. MR imaging and CT in osteoarthritis of the lumbar facet joints. Skeletal Radiol. 1999;28(4):215–219. doi:10.1007/s002560050503
12. Fujiwara A, Tamai K, An HS, et al. Orientation and osteoarthritis of the lumbar facet joint. Clin Orthop Relat Res. 2001;385(385):88–94. doi:10.1097/00003086-200104000-00015
13. Liu X, Zhao X, Long Y, et al. Facet sagittal orientation: possible role in the pathology of degenerative lumbar spinal stenosis. Spine. 2018;43(14):955–958. doi:10.1097/BRS.0000000000002493
14. Abbas J, Peled N, Hershkovitz I, Hamoud K. Facet tropism and orientation: risk factors for degenerative lumbar spinal stenosis. Biomed Res Int. 2020;2020:2453503. doi:10.1155/2020/2453503
15. An SJ, Mun JU, Kang KN, Kim YU. Superior articular process cross-sectional area is a new sensitive parameter for the diagnosis of lumbar central canal spinal stenosis. Clin Interv Aging. 2018;13:1763–1767. doi:10.2147/CIA.S172355
16. Lim TH, Choi SI, Cho HR, et al. Optimal cut-off value of the superior articular process area as a morphological parameter to predict lumbar foraminal stenosis. Pain Res Manag. 2017;2017:7914836. doi:10.1155/2017/7914836
17. An SJ, Seo MS, Choi SI, et al. Facet joint hypertrophy is a misnomer: a retrospective study. Medicine. 2018;97(24):e11090. doi:10.1097/MD.0000000000011090
18. Kalichman L, Suri P, Guermazi A, Li L, Hunter DJ. Facet Orientation and Tropism: Associations With Facet Joint Osteoarthritis and Degeneratives. Spine. 2009;34(16):E579–E585. doi:10.1097/BRS.0b013e3181aa2acb
19. Berg L, Thoresen H, Neckelmann G, Furunes H, Hellum C, Espeland A. Facet arthropathy evaluation: CT or MRI? Eur Radiol. 2019;29(9):4990–4998. doi:10.1007/s00330-019-06047-5
20. Jerban S, Chang DG, Ma Y, Jang H, Chang EY, Du J. An update in qualitative imaging of bone using ultrashort echo time magnetic resonance. Front Endocrinol. 2020;11:555756. doi:10.3389/fendo.2020.555756
21. Lee S, Lee JW, Yeom JS, et al. A practical MRI grading system for lumbar foraminal stenosis. AJR Am J Roentgenol. 2010;194(4):1095–1098. doi:10.2214/AJR.09.2772
22. Barry M, Livesley P. Facet joint hypertrophy: the cross-sectional area of the superior articular process of L4 and L5. Eur Spine J. 1997;6(2):121–124. doi:10.1007/BF01358744
23. Liu X, Huang Z, Zhou R, et al. The effects of orientation of lumbar facet joints on the facet joint contact forces: an in vitro biomechanical study. Spine. 2018;43(4):E216–E220. doi:10.1097/BRS.0000000000002290
24. Zhou Q, Teng D, Zhang T, Lei X, Jiang W. Association of facet tropism and orientation with lumbar disc herniation in young patients. Neurol Sci. 2018;39(5):841–846. doi:10.1007/s10072-018-3270-0
25. Yang M, Wang N, Xu X, et al. Facet joint parameters which may act as risk factors for chronic low back pain. J Orthop Surg Res. 2020;15(1):185. doi:10.1186/s13018-020-01706-6
26. Rai RR, Shah Y, Shah S, Palliyil NS, Dalvie S. A radiological study of the association of facet joint tropism and facet angulation with degenerative spondylolisthesis. Neurospine. 2019;16(4):742–747. doi:10.14245/ns.1836232.116
27. Kim HJ, Chun HJ, Lee HM, et al. The biomechanical influence of the facet joint orientation and the facet tropism in the lumbar spine. Spine J. 2013;13(10):1301–1308. doi:10.1016/j.spinee.2013.06.025
28. Kong MH, He W, Tsai YD, et al. Relationship of facet tropism with degeneration and stability of functional spinal unit. Yonsei Med J. 2009;50(5):624–629. doi:10.3349/ymj.2009.50.5.624
29. Eksi MS, Ozcan-Eksi EE, Orhun O, Huet SE, Turgut VU, Pamir MN. Association between facet joint orientation/tropism and lumbar intervertebral disc degeneration. Br J Neurosurg. 2020;1–8. doi:10.1080/02688697.2020.1864289
30. Cyron BM, Hutton WC. Articular tropism and stability of the lumbar spine. Spine. 1980;5(2):168–172. doi:10.1097/00007632-198003000-00011
31. Naeem K, Nathani KR, Barakzai MD, et al. Modifications in lumbar facet joint are associated with spondylolisthesis in the degenerative spine diseases: a comparative analysis. Acta Neurochir. 2021;163(3):863–871. doi:10.1007/s00701-020-04657-3
32. An SJ, Hong SJ, Kim YU, Lee YK. Best cut-off point of the cervical facet joint area as a new morphological measurement tool to predict cervical foraminal stenosis. J Pain Res. 2019;12:1325–1330. doi:10.2147/JPR.S204567
33. Bajek G, Bajek S, Cvek SZ, Bobinac D, Splavski B, Grahovac DS. Histomorphological analysis of the osteophytic appositions in patients with lumbar lateral recess syndrome. Coll Antropol. 2010;34(Suppl 2):79–84.
34. Dunlop RB, Adams MA, Hutton WC. Disc space narrowing and the lumbar facet joints. J Bone Joint Surg Br. 1984;66(5):706–710. doi:10.1302/0301-620X.66B5.6501365
35. Bashkuev M, Reitmaier S, Schmidt H. Relationship between intervertebral disc and facet joint degeneration: a probabilistic finite element model study. J Biomech. 2020;102:109518. doi:10.1016/j.jbiomech.2019.109518
 © 2022 The Author(s). This work is published and licensed by Dove Medical Press Limited. The full terms of this license are available at https://www.dovepress.com/terms.php and incorporate the Creative Commons Attribution - Non Commercial (unported, v3.0) License.
By accessing the work you hereby accept the Terms. Non-commercial uses of the work are permitted without any further permission from Dove Medical Press Limited, provided the work is properly attributed. For permission for commercial use of this work, please see paragraphs 4.2 and 5 of our Terms.
© 2022 The Author(s). This work is published and licensed by Dove Medical Press Limited. The full terms of this license are available at https://www.dovepress.com/terms.php and incorporate the Creative Commons Attribution - Non Commercial (unported, v3.0) License.
By accessing the work you hereby accept the Terms. Non-commercial uses of the work are permitted without any further permission from Dove Medical Press Limited, provided the work is properly attributed. For permission for commercial use of this work, please see paragraphs 4.2 and 5 of our Terms.