")
Back to Journals » International Journal of Chronic Obstructive Pulmonary Disease » Volume 16
Quantitative CT Analysis of Small Airway Remodeling in Patients with Chronic Obstructive Pulmonary Disease by a New Image Post-Processing System
Authors Qin S , Yu X , Ma Q, Lin L, Li Q, Liu H, Zhang L, Leng S, Han W
Received 2 December 2020
Accepted for publication 7 February 2021
Published 2 March 2021 Volume 2021:16 Pages 535—544
DOI https://doi.org/10.2147/COPD.S295320
Checked for plagiarism Yes
Review by Single anonymous peer review
Peer reviewer comments 2
Editor who approved publication: Dr Richard Russell
Shuyi Qin,1,2,* Xinjuan Yu,1,2,* Qianli Ma,3,* Li Lin,4 Qinghai Li,1,2 Hong Liu,1,2 Lei Zhang,5 Shuguang Leng,6 Wei Han1,2
1Department of Pulmonary and Critical Care Medicine, Qingdao Municipal Hospital, School of Medicine, Qingdao University, Qingdao, Shandong, People’s Republic of China; 2Respiratory Disease Key Laboratory of Qingdao, Qingdao Municipal Hospital, Qingdao, Shandong, People’s Republic of China; 3Department of Radiology, Qingdao Municipal Hospital, Qingdao, Shandong, People’s Republic of China; 4Department of Pulmonary Medicine, Shandong Provincial Chest Hospital, Jinan, Shandong, People’s Republic of China; 5Department of Hospital Infection, Qingdao Municipal Hospital, Qingdao, Shandong, People’s Republic of China; 6Department of Internal Medicine, University of New Mexico School of Medicine, Albuquerque, NM, USA
*These authors contributed equally to this work
Correspondence: Wei Han
Department of Pulmonary and Critical Care Medicine, Qingdao Municipal Hospital, School of Medicine, Qingdao University, No. 5 Donghaizhong Road, Qingdao, Shandong, People’s Republic of China
Tel +86 532 85937579
Email [email protected]
Shuguang Leng
Department of Internal Medicine, University of New Mexico School of Medicine, Albuquerque, NM, USA
Tel +1 505 3489465
Email [email protected]
Purpose: To explore a practical marker for quantitatively analyzing the small airway remodeling in COPD by HRCT.
Patients and Methods: Twenty-four patients with COPD (GOLD I, n = 7; GOLD II, n = 8; GOLD III+IV, n = 9) and 14 healthy controls (7 normal pulmonary function; 7 small-airway disease (SAD)) were enrolled in the study as five groups, GOLD I, GOLD II, GOLD III+IV, normal and SAD. All subjects underwent HRCT and spirometry. With ISP 9.0, whole emphysema index (EI) and the airway parameters, including wall area (WA), lumen area (LA), airway area (AA) of the 3rd, 5th and 9th generations of bronchi, were measured successively. The ratio of LA/AA and WA/AA in the 3rd, 5th and 9th generations of bronchi were calculated and compared among groups.
Results: For the five groups, EI was increased only in GOLD III+IV group (P < 0.05), while the ratio of LA/AA (9-LA/AA) and WA/AA (9-WA/AA) in 9th generation of bronchi have significantly changed since SAD group (P < 0.05). There were significant correlation between FEV1generations of bronchi (r3 = 0.429, r5 = 0.583, r9 = 0.592, respectively, P < 0.05); FEV1% and WA/AA (r3 = – 0.428, r5 = – 0.532, r9 = – 0.570, respectively, P < 0.05); as well as MMEF% and LA/AA (r3 = 0.421, r5 = 0.566, r9 = 0.610, respectively, P < 0.05); MMEF% and WA/AA (r3 = – 0.421, r5 = – 0.529, r9 = – 0.593, respectively, P < 0.05).
Conclusion: Small airway remodeling has occurred in the early stage of COPD, while emphysema in the late stage of COPD. The 9-LA/AA and 9-WA/AA are accurate and practical markers for small airway remodeling of COPD.
Keywords: COPD, high-resolution CT, emphysema index, pulmonary function test
Introduction
Chronic obstructive pulmonary disease (COPD) has become a major public health problem with increasing morbidity and mortality worldwide in the last several decades. It was predicted that COPD will bring a heavy burden to the family and society as the third leading cause of mortality worldwide.1–3 As a chronic airway inflammatory disease, COPD is characterized by small airway remodeling and persistent airflow limitation.4 Small airway remodeling is the central mechanism for air-trapping and increase of airway resistance in the process of COPD development.4,5 It is a pivotal strategy for early diagnosis and accurate assessment of small airway remodeling in management of COPD, to prevent the reversible inflammation from irreversible emphysema.6,7
However, since the clinical symptoms of COPD present until more than 30% of the lung parenchyma has been destroyed.8 By the time this disease becomes symptomatic, the forced expiratory volume in one second (FEV1) has declined by about 50% in most patients.9 It is hard to identify small airway remodeling according to the symptoms, especially in the early stage of COPD. Spirometry, including FEV1, forced vital capacity (FVC), maximal mid-expiratory flow (MMEF) and residual volume (RV), is recommended as the primary tool for the diagnosis and evaluation of COPD.10 However, the reliability and reproducibility of spirometry are not always feasible due to patients’ compliance, technicians’ quality, and operation conditions. Meanwhile, the small airway function is susceptible to large-airway obstruction and lung volume.11–13 Therefore, it is urgently needed to find some sensitive markers to evaluate the small airway remodeling pulmonary directly.
Historically, small airways are defined as airways with an internal diameter of less than 2 mm without cartilage support which comprise airway, generally located in the 8th–23rd generation bronchi.14 Recently, scientists have engaged in assessing COPD objectively by imaging techniques. As the most important examination method of respiratory diseases, CT was initially used to evaluate emphysema, pulmonary bullae, and extension to small-airway disease in patients with COPD.15 CT-based quantification of emphysema and airway thickness has also proven to be a method that yields results in a relatively good match with those of spirometry in patients with COPD.16,17 However, the application of CT in “small airway disease” is still limited to the bronchus of moderate size at generation six or above.18,19 There is restricted straightforward data on the real small airway, the conductive bronchi with an internal diameter <2 mm in the CT study.
With the development of imaging technology and post-processing software, quantitative evaluation of CT will become even more helpful in the prevention, diagnosis, and treatment of COPD. The IntelliSpace Portal (ISP, Philips Medical Systems, Cleveland, OH, USA), a cloud-based advanced analytics platform, has been ISO13485-certified for quality control and FDA-authorized for clinical use. In a previous study, FEV1 was significantly inversely correlated with %LAA-950, an emphysema parameter on ISP 6/7.20,21 With the updated analytical capabilities, ISP 9.0 significantly optimizes the visualization of the small airway, allowing accurate structural measurements of the distal tracheobronchial tree.
In this study, we hypothesized that airway dimensions in the 9th generation of tracheobronchial tree measured by ISP 9.0 may reflect small airway remodeling as a pathophysiological basis underlying lung function impairment in COPD. The findings of this study provide the first reliable method for quantitative analysis of small airway remodeling in COPD and may shed light on the understanding of the disease.
Patients and Methods
Study Participants
We searched COPD outpatients and healthy controls who underwent both chest CT scan and spirometry within a one-week interval between November 2018 to November 2019 from the medical database of Qingdao Municipal Hospital. All subjects have smoking history >10 package year and were classified as normal group, small airway disease (SAD) group, GOLD I group, GOLD II group, GOLD III+IV group, according to their spirometry results. In each group, 7 to 9 subjects were enrolled continuously.
Diagnostic criteria of COPD bases on GOLD 2019,22 briefly met: chronic cough and FEV1/FVC <70% after inhaling bronchodilator. For COPD, GOLD I group: FEV1% >80%; GOLD II group: FEV1% 50–80%; GOLD III+IV FEV1% <50%. GOLD I+II was defined as the early stage of COPD, and GOLD III+IV was defined as late stage.
For the healthy controls: Healthy controls were recruited from individuals who selected chest CT scan and lung function test as routine items in their annual health check-up voluntarily. Normal: FEV1/FVC >70% after inhaling bronchodilator, FEV1% >80% and MMEF% >80%; SAD: FEV1/FVC >70% after inhaling bronchodilator, FEV1% >80% and MMEF% <65%.
Exclusion criteria included asthma, severe pneumonia, thoracic deformity, lung cancer, tuberculosis, pulmonary fibrosis, or other diseases that may affect pulmonary function test (PFT). The study was approved by the Medical Ethics Committee of Qingdao Municipal Hospital, and all participants signed informed consent.
The patient’s age, gender, height and weight were recorded.
Spirometry
Spirometry was performed using Medgraphics ProfilevE (United States) and performed according to the ATS/ERS standard, the percentage predicted values were calculated using the equations for Asian adults supplied in the user’s manual. After a 10-min rest, the subject assumed a seated position with feet in full contact with the floor, breathed for three cycles, then inhaled forcefully, rapidly and deeply through the interface device and exhaled suddenly, continuously and steadily to reach a maximum amount of breathing. The exhalation process should not be interrupted spontaneously or by unsolicited coughing. The above test was repeated three times, and each curve should be coincident, as far as possible, to qualify the PFT, which included FVC, FEV1, FEV1%, FEV1/FVC, and MMEF. And then, the subjective inhaled salbutamol aerosol 400 μg (GSK, UK), followed by a re-examination of PFT after 15 min.
Computed Tomography Data Acquisition
The contiguous CT images of subjects were acquired in the supine position as described previously.23 Chest CT examinations were conducted using 64-detector row CT scanner (Siemens Medical Solutions, Germany). Scanning parameters were as follows: tube voltage 120 kV; tube current 40 mA; window width 1600 Hounsfield units (HU), window level −600HU; pitch 0.985; X-ray tube rotation speed 0.6 slice/rotation, slice thickness 0.625 mm with 1 mm reconstruction interval; 512 ×512 matrix. Both the original and reconstructed data were stored in DICOM format.
Computed Tomography Data Analysis
To explore airway remodeling in COPD on HRCT, three-dimensional bronchial trees were reconstructed by ISP 9.0 (Philips Medical Systems, Cleveland, OH, USA) according to the instruction. Firstly, the full width at half maxima (FWHM) correction algorithm was adopted in the ISP 9.0 system.23 The original CT data passed into the system were automatically reconstructed into lobes and segments, filled with different colors and reconstructed into three-dimensional bronchial trees. As previously described, emphysema was the area of low attenuation below −950 HU on full-inspiration CT images, the emphysema index (EI, the percent of emphysema voxels over total lung capacity) of each lung lobe was measured automatically. To ensure the consistency of measurement and comparability of results, we selected a representative branch from 4 segment of each lung, B1+2 (apical posterior segment of the upper lobe), B4 (superior lingual segment of the upper lobe), B6 (superior segment of the lower lobe) and B9 (lateral basal segment of the lower lobe). The start and end points of each segmental and subsegmental bronchus were marked by the radiologist on either volume-rendered or cross-sectionalgenerations bronchi at the longest airways downstream of the candidate segmental airways were measured by an extensively trained analyst, and then the lumen area/airway area ratio (LA/AA) and the wall area/airway area ratio (WA/AA) were calculated accordingly (Figure 1). In fact, LA/AA is equal to 1 – WA/AA.
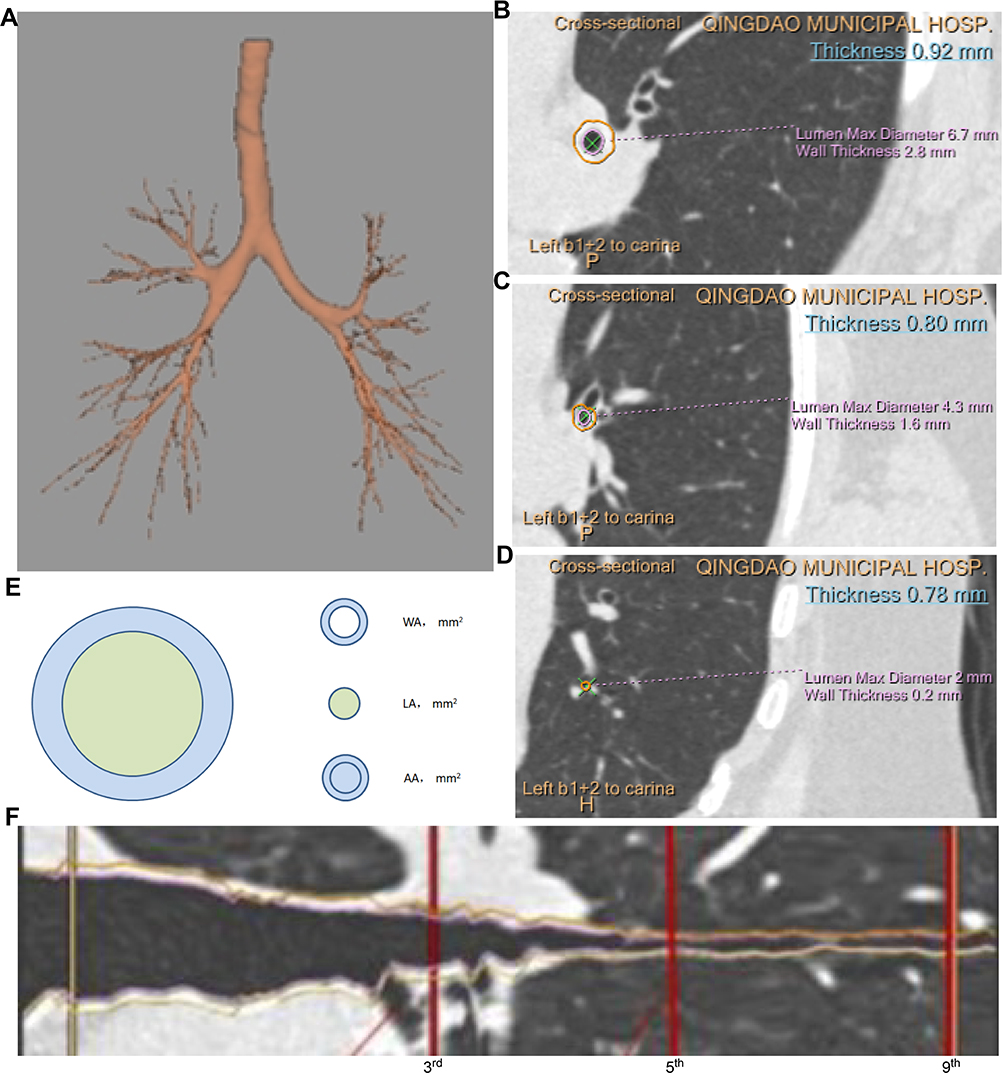 |
Figure 1 Airway measurement on CT image in ISP9.0. (A) Accurate bronchial skeleton. (B–D) Short-axis images obtained from the curved CT image with the numbers of bronchial generations. (E) Schematic drawing of airway parameters. (F) The airway’s long axis of a selected airway was precisely perpendicular with the measure line of 3rd, 5th and 9th generations. Abbreviations: WA, wall area; LA, lumen area; AA, airway area. |
Statistical Analysis
Statistical analysis was performed using statistical software (IBM SPSS Statistics, Release 23.0: IBM Corp, Armonk NY). Categorical data were presented as counts. Continuous data were reported as mean ± standard deviation (SD). Differences in lung (EI) and airway remodeling (LA/AA, WA/AA) of different generations were compared among groups with one-way ANOVA, and multiple comparisons were performed with Newman-Keuls test. Distributed variables were tested by the chi-square test. Pearson’s correlation coefficient was applied to determine the correlation between airway remodeling (LA/AA, WA/AA) and spirometry parameters (FEV1%, MMEF%). Multivariate linear regression analysis was used to adjust for demographics and smoking pack years when evaluating the association between observed significant correlations with lung function measures and were used to identify the relationship between the airway remodeling and age, gender, BMI and smoking status. Principal component analysis was used to analyze the data from the following 13 variables: EI, 3-WA/AA, 3-LA/AA, 3-LA, 3-WA, 5-WA/AA, 5-LA/AA, 5-LA, 5-WA, 9-WA/AA, 9-LA/AA, 9-LA, 9-WA. P< 0.05 was considered statistically significant.
Results
Baseline Characteristics
There were no significant differences in age, gender, body mass index (BMI), or smoking history between COPD and healthy controls, despite the distinction in FEV1%, MMEF% (P < 0.05, Table 1).
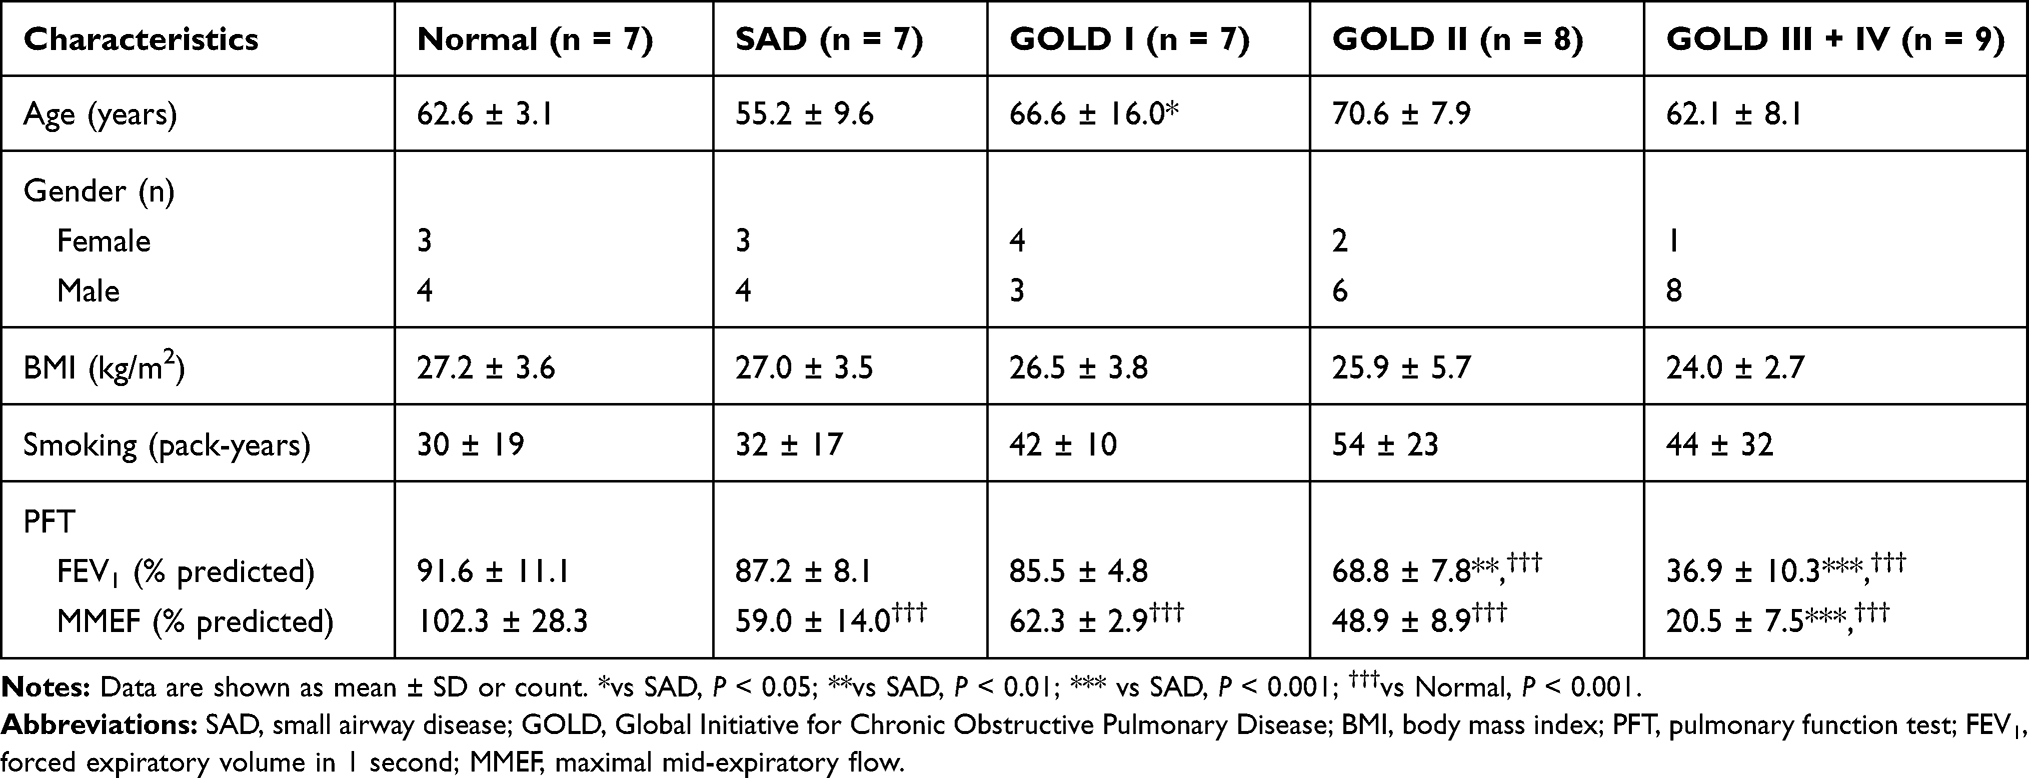 |
Table 1 Baseline Characteristics of Study Subjects |
Bronchial Tree and EI
To explore airway remodeling of COPD on HRCT, three-dimensional bronchial trees were reconstructed firstly. As shown in Figure 2Aa, the number of bronchial tree branches was decreased with COPD aggravation. After that, the EI was obtained automatically, however, EI did no change until in the late-stage COPD (Figure 2Ab, B and Table S1).
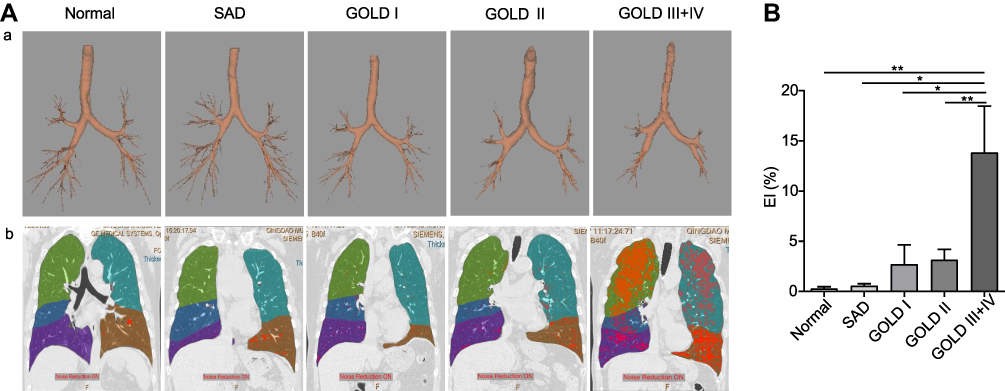 |
Figure 2 The three-dimensional reconstruction of lung by ISP 9.0. (A) The total bronchi count generated was significantly reduced with severity of disease. (B) EI generated in the late COPD was worse than in the early COPD. Abbreviations: SAD, small airway disease; GOLD, Global Initiative for Chronic Obstructive Pulmonary Disease; EI, emphysema index. Notes: Data are shown as mean ± SD. *P < 0.05; **P < 0.01. |
Airway Remodeling with Decline of Pulmonary Function in Spirometry
Airway structure of different bronchi, including 3-WA, 3-LA, 3-AA, 3-WA/AA, 3-LA/AA, 5-WA, 5-LA, 5-AA, 5-WA/AA, 5-LA/AA, 9-WA, 9-LA, 9-AA, 9-WA/AA, 9-LA/AA, was measured to understand the airway remodeling with the decline of pulmonary function (Figures 3, S1 and Table S1). Unlike EI had changed until in the GOLD III+IV, LA has been decreased since GOLD I and WA since GOLD II (Figure 3B generations bronchi in the GOLD I group significantly increased than that in SAD group, however, there was no difference for WA/AA or LA/AA in 3rd generation bronchi (Figures 3C and S1). To be noticed, only 9-LA/AA had a significant difference between SAD and GOLD I, as well as GOLD I and GOLD II. While age, gender, BMI and smoking status were not associated with 9-LA/AA by multivariate linear regression analysis (all P > 0.05).
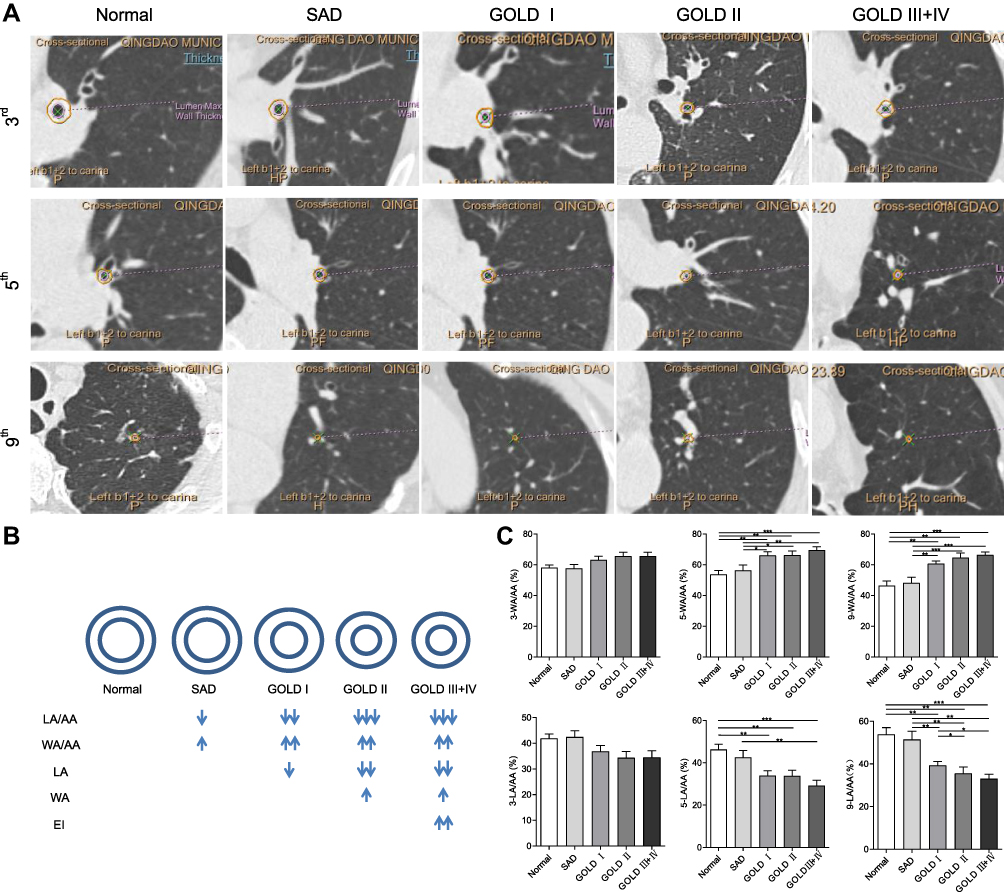 |
Figure 3 Airway dimensions and their relationship with different groups. (A) Cross-sections of different generations in different groups. (B) Schematic diagram of airway remodeling in 9th generation. (C) Comparison of WA/AA and LA/AA among different groups. Abbreviations: SAD, small airway disease; GOLD, Global Initiative for Chronic Obstructive Pulmonary Disease; WA, wall area; LA, lumen area; AA, airway area; WA/AA, wall area/airway area; LA/AA, lumen area/airway area; 3-, 5-, 9-, represented the 3rd, 5th, 9th generations, respectively. Notes: Data are shown as mean ± SD. *P < 0.05; **P < 0.01; ***P < 0.001. |
Airway Remodeling and Small Airway Dysfunction in Spirometry
Regardless of the generation of bronchus, the WA/AA and LA/AA were significantly correlated with FEV1% and MMEF% (Figure 4). After adjusting for age, gender, BMI, and smoking status by multivariate linear regression analysis, this association remained statistically significant (all adjusted P < 0.01). However, the WA and AA were not significantly correlated with FEV1% and MMEF% (Figure S2).
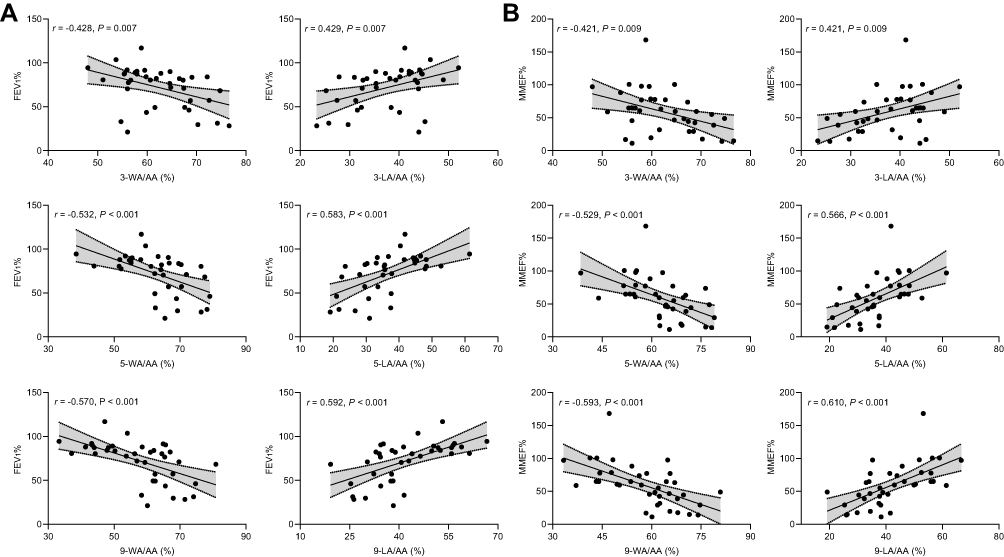 |
Figure 4 (A) The correlations between airway dimensions and FEV1%; (B) the correlations between airway dimensions and MMEF%. Abbreviations: WA/AA, wall area/airway area; LA/AA, lumen area/airway area; MMEF, maximal mid-expiratory flow; FEV1, forced expiratory volume in one second; 3-, 5-, 9-, represented the 3rd, 5th, 9th generations, respectively. |
Optimal Airway Remodeling Markers
We used principal component analysis to analyze the data from the following 13 variables: EI, 3-WA, 3-LA, 3-WA/AA, 3-LA/AA, 5-WA, 5-LA, 5-WA/AA, 5-LA/AA, 9-WA, 9-LA, 9-WA/AA, 9-LA/AA. As the results, the 9-WA/AA and 9-LA/AA were closest correlated to the principal component, compared to their 5- and 3- counterparts. In the meantime, EI, 3-WA, and 3-LA variables were not significantly related to the first principal component (Figure 5).
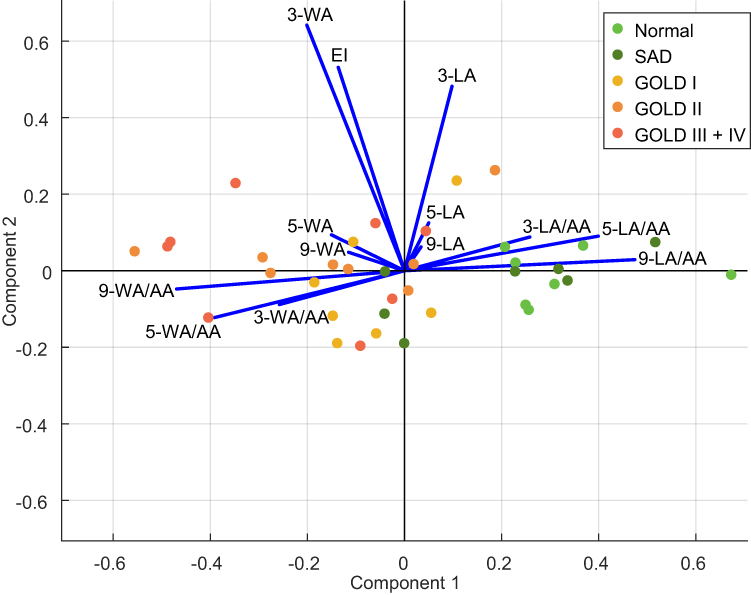 |
Figure 5 Biplot of principal component analysis. Abbreviations: SAD, small airway disease; GOLD, Global Initiative for Chronic Obstructive Pulmonary Disease; WA, wall area; LA, lumen area; AA, airway area. LA/AA, lumen area/airway area; WA/AA, wall area/airway area; 3-, 5-, 9-, represented the 3rd, 5th, 9th generations, respectively. Notes: Distance to horizontal axis represented the correlation between the variable and principal component, the length represented the influence on principle component. |
Discussion
In this study, the ISP 9.0 system was firstly used to evaluate small airway remodeling in COPD. With this advanced image software, we found the airway remodeling in the early stage of COPD, airway remodeling parameters, specially 9-LA/AA and 9-WA/AA, were significantly correlated with FEV1% and MMEF%, could be used as the sensitive markers for small airway remodeling.
The accurate evaluation of airway remodeling in early COPD provided a stable basis for early intervention of COPD.24 Even spirometry remains the standard for evaluating airflow limitation in patients with COPD, as the most widely used imaging diagnostic equipment, CT has been used to evaluate the airway remodeling in COPD studies for twenty years, with the parameters, such as lung density, EI, airway dimensions, etc.25 Emphysema, the main pathological changes in the late stage of COPD, is the abnormal, permanent enlargement of air spaces distal to the terminal, non-respiratory bronchiole. It is accompanied by the destruction of the alveolar walls, without obvious fibrosis,26–29 showing low attenuation values on CT during breath-holding at full inspiration.30 Hogg et al31 calculated the relative area of the lung occupied by attenuation values lower than a threshold (−950 HU) of each lobe and revealed that “airway remodeling” began before the onset of emphysematous destruction. In our study, we found that EI showed no difference between the control and the early-stage COPD but was significantly increased in the late-stage COPD, which indicating that emphysema is the main pathological change of severe COPD. Since there is no emphysema but significant small airway remodeling by HRCT analysis in the early stage COPD, the latter one could be recognized as a sensitive marker for early COPD.5,32–34
Coxson et al35 compared the correlation between FEV1% and the 3-WA or 5-WA, respectively, and found the correlation between 5-WA and FEV1% was stronger than that between 3-WA and FEV1%, which indicated a stronger correlation between bronchial structure and spirometry in smaller airway than the bigger one. With ISP 9.0 system, the small airway parameters of the 8–10th generation bronchi were obtained semi-automatically, to allow the study on airway remodeling at a more distal level. In our study, the correlation between FEV1% and 9-LA/AA or 9-WA/AA was better than that of 3rd and 5th generations, which suggested that 9-LA/AA could be a potential marker of early small airway remodeling in COPD. Interestingly, 9-LA/AA reduced considerably in the early COPD than the healthy subjects, but there was no difference between GOLD II and GOLD III+IV, and the number of terminal bronchioles decreased significantly from GOLD I. These findings imply that occlusion of the airway wall may contribute to early remodeling, that luminal stenosis progresses with the course of COPD gradually, but may eventually plateau at GOLD II, which are consistent with Higham’s research.36
There are other ways of measuring airways, such as parametric response mapping (PRM) and Pi10, have been used widely. As a novel noninvasive CT biomarker for mild to moderate COPD, PRM is to differentiate emphysema and SAD by matching inspiratory and expiratory images on a voxel-by-voxel basis.37 But this method may underestimate the amount of air trapping being seen at RV. Pi10 is a measure of airway wall thickness calculated by regressing the square-root wall area on internal perimeter of airways to correction of wall thickness overestimation produced more accurate measurements, however, it is not suitable for the real small airway, whose diameter is less than 2 mm.38 generations bronchi. Among these parameters, LA/AA and WA/AA in 9th generation bronchi were the most related with FEV1% and MMEF%.
This is the first study to evaluate the small airway remodeling in COPD with ISP 9.0 system. Due to this small study population, there might be unavoidable bias and limitation for this cross-sectional descriptive study. However, with ISP 9.0, the data can be reacquired/reanalyzed to avoid the unreliability caused by the previous visual measurement. Additionally, as a cloud platform, ISP 9.0 system is easier to operate and performs multicenter applications, which would play an essential role in identifying early small airway diseases in the future. In our another study, airway remodeling in carbon black packers was assessed using ISP 9.0 and found small airway wall thickening was a major feature of airway remodeling and the pathology of lung function impairment caused by carbon black exposure.23
Conclusion
This study verified that the early airway remodeling of COPD could be quantitatively detected by HRCT with advanced post-processing software, ISP9.0. Though there is still no consensus on the diagnostic criteria of spirometry and CT quantitative measurement, stable experience will be formed with more cases studied with the continuous progress of software and hardware technology. According to our study, small airway remodeling had occurred in the early stage of COPD, the ratio of 9-LA/AA and 9-WA/AA are practical tools for accurate assessment of small airway remodeling in COPD. Chest CT being done for many reasons could be used to “screen” for early COPD, thus aiding early diagnosis without extra burden on patients or healthcare systems. In conclusion, quantitative evaluation of airway in CT provides a scientific basis for the early prevention, diagnosis, and treatment of COPD.
Abbreviations
AA, airway area; COPD, chronic obstructive pulmonary disease; EI, emphysema index; FEV1, forced expiratory volume in one second; FVC, forced vital capacity; GOLD, Global Initiative for Chronic Obstructive Lung Disease; HRCT, high-resolution CT; HU, Hounsfield units; ISP, IntelliSpace Portal; LA, lumen area; MMEF, maximum mid-expiratory flow; PFT, pulmonary function test; SAD, small airway disease; WA, wall area.
Data Sharing Statement
The datasets used and/or analyzed during the current study are available from the corresponding author (Dr. Wei Han) in response to reasonable requests.
Ethics Approval and Consent to Participate
The study was approved by the Medical Ethics Committee of Qingdao Municipal Hospital (number: 2018030). Written informed consent was acquired from all subjects before enrollment into the study in accordance with the principles of the Declaration of Helsinki.
Acknowledgments
Special thanks to respiratory laboratory, Qingdao Municipal Hospital, School of Medicine, Qingdao University. Shuyi Qin, Xinjuan Yu and Qianli Ma are co-first authors for this study.
Funding
This study was supported by the National Natural Science Foundation of China (No. 81973012).
Disclosure
The authors report no conflicts of interest in this work.
References
1. López-Campos JL, Tan W, Soriano JB. Global burden of COPD. Respirology. 2016;21(1):14–23. doi:10.1111/resp.12660
2. Lopez AD, Shibuya K, Rao C, et al. Chronic obstructive pulmonary disease: current burden and future projections. Eur Respir J. 2006;27(2):397–412. doi:10.1183/09031936.06.00025805
3. Murray CJ, Lopez AD. Alternative projections of mortality and disability by cause 1990–2020: Global Burden of Disease Study. Lancet. 1997;349(9064):1498–1504. doi:10.1016/s0140-6736(96)07492-2
4. Barnes PJ. Small airways in COPD. N Engl J Med. 2004;350(26):2635–2637. doi:10.1056/NEJMp048102
5. Singh D. Small airway disease in patients with chronic obstructive pulmonary disease. Tuberc Respir Dis (Seoul). 2017;80(4):317–324. doi:10.4046/trd.2017.0080
6. Wang C, Xu J, Yang L, et al. Prevalence and risk factors of chronic obstructive pulmonary disease in China (the China Pulmonary Health [CPH] study): a national cross-sectional study. Lancet. 2018;391(10131):1706–1717. doi:10.1016/s0140-6736(18)30841-9
7. Hess MW. The 2017 global initiative for chronic obstructive lung disease report and practice implications for the respiratory therapist. Respir Care. 2017;62(11):1492–1500. doi:10.4187/respcare.05402
8. Choromańska A, Macura KJ. Role of computed tomography in quantitative assessment of emphysema. Pol J Radiol. 2012;77(1):28–36. doi:10.12659/pjr.882578
9. Sutherland ER, Cherniack RM. Management of chronic obstructive pulmonary disease. N Engl J Med. 2004;350(26):2689–2697. doi:10.1056/NEJMra030415
10. Koo HJ, Lee SM, Seo JB, et al. Prediction of pulmonary function in patients with chronic obstructive pulmonary disease: correlation with quantitative CT parameters. Korean J Radiol. 2019;20(4):683–692. doi:10.3348/kjr.2018.0391
11. Eisner MD, Iribarren C, Yelin EH, et al. Pulmonary function and the risk of functional limitation in chronic obstructive pulmonary disease. Am J Epidemiol. 2008;167(9):1090–1101. doi:10.1093/aje/kwn025
12. Wells CD, Joo MJ. COPD and asthma: diagnostic accuracy requires spirometry. J Fam Pract. 2019;68(2):76–81.
13. Miller MR, Crapo R, Hankinson J, et al. General considerations for lung function testing. Eur Respir J. 2005;26(1):153–161. doi:10.1183/09031936.05.00034505
14. Usmani OS. Small airways dysfunction in asthma: evaluation and management to improve asthma control. Allergy Asthma Immunol Res. 2014;6(5):376–388. doi:10.4168/aair.2014.6.5.376
15. Uppaluri R, Mitsa T, Sonka M, Hoffman EA, McLennan G. Quantification of pulmonary emphysema from lung computed tomography images. Am J Respir Crit Care Med. 1997;156(1):248–254. doi:10.1164/ajrccm.156.1.9606093
16. Chen H, Chen RC, Guan YB, et al. Correlation of pulmonary function indexes determined by low-dose MDCT with spirometric pulmonary function tests in patients with chronic obstructive pulmonary disease. AJR Am J Roentgenol. 2014;202(4):711–718. doi:10.2214/ajr.12.10501
17. Park KJ, Bergin CJ, Clausen JL. Quantitation of emphysema with three-dimensional CT densitometry: comparison with two-dimensional analysis, visual emphysema scores, and pulmonary function test results. Radiology. 1999;211(2):541–547. doi:10.1148/radiology.211.2.r99ma52541
18. Kim WJ, Silverman EK, Hoffman E, et al. CT metrics of airway disease and emphysema in severe COPD. Chest. 2009;136(2):396–404. doi:10.1378/chest.08-2858
19. Paulin LM, Smith BM, Koch A, et al. Occupational Exposures and Computed Tomographic Imaging Characteristics in the SPIROMICS Cohort. Ann Am Thorac Soc. 2018;15(12):1411–1419. doi:10.1513/AnnalsATS.201802-150OC
20. Kim J, Kim MJ, Sol IS, et al. Quantitative CT and pulmonary function in children with post-infectious bronchiolitis obliterans. PLoS One. 2019;14(4):e0214647. doi:10.1371/journal.pone.0214647
21. de Boer E, Nijholt IM, Jansen S, et al. Optimization of pulmonary emphysema quantification on CT scans of COPD patients using hybrid iterative and post processing techniques: correlation with pulmonary function tests. Insights Imaging. 2019;10(1):102. doi:10.1186/s13244-019-0776-9
22. Singh D, Agusti A, Anzueto A, et al. Global strategy for the diagnosis, management, and prevention of chronic obstructive lung disease: the GOLD science committee report 2019. Eur Respir J. 2019;53(5):1900164. doi:10.1183/13993003.00164-2019
23. Cao X, Lin L, Sood A, et al. Small airway wall thickening assessed by computerized tomography is associated with low lung function in Chinese carbon black packers. Toxicol Sci. 2020;178(1):26–35. doi:10.1093/toxsci/kfaa134
24. Jones RL, Noble PB, Elliot JG, James AL. Airway remodelling in COPD: it’s not asthma! Respirology. 2016;21(8):1347–1356. doi:10.1111/resp.12841
25. Nakano Y, Müller NL, King GG, et al. Quantitative assessment of airway remodeling using high-resolution CT. Chest. 2002;122(6Suppl):271s–275s. doi:10.1378/chest.122.6_suppl.271S
26. American Thoracic Society. Standards for the diagnosis and care of patients with chronic obstructive pulmonary disease.. Am J Respir Crit Care Med. 1995;152(5 Pt 2):S77–S121.
27. Snider GL. Emphysema: the first two centuries–and beyond. A historical overview, with suggestions for future research: part 2. Am Rev Respir Dis. 1992;146(6):1615–1622. doi:10.1164/ajrccm/146.6.1615
28. Sanders C. The radiographic diagnosis of emphysema. Radiol Clin North Am. 1991;29(5):1019–1030.
29. Snider GL, Kleinerman J, Thurlbeck WM, Bengali ZH. The definition of emphysema. Report of a National Heart, Lung, and Blood Institute, Division of Lung Diseases workshop. Am Rev Respir Dis. 1985;132(1):182–185. doi:10.1164/arrd.1985.132.1.182
30. Gevenois PA, De Vuyst P, de Maertelaer V, et al. Comparison of computed density and microscopic morphometry in pulmonary emphysema. Am J Respir Crit Care Med. 1996;154(1):187–192. doi:10.1164/ajrccm.154.1.8680679
31. Hogg JC, McDonough JE, Sanchez PG, et al. Micro-computed tomography measurements of peripheral lung pathology in chronic obstructive pulmonary disease. Proc Am Thorac Soc. 2009;6(6):546–549. doi:10.1513/pats.200905-029DS
32. Zhao D, Zhou Y, Jiang C, et al. Small airway disease: a different phenotype of early stage COPD associated with biomass smoke exposure. Respirology. 2018;23(2):198–205. doi:10.1111/resp.13176
33. Stewart JI, Criner GJ. The small airways in chronic obstructive pulmonary disease: pathology and effects on disease progression and survival. Curr Opin Pulm Med. 2013;19(2):109–115. doi:10.1097/MCP.0b013e32835ceefc
34. McDonough JE, Yuan R, Suzuki M, et al. Small-airway obstruction and emphysema in chronic obstructive pulmonary disease. N Engl J Med. 2011;365(17):1567–1575. doi:10.1056/NEJMoa1106955
35. Coxson HO, Quiney B, Sin DD, et al. Airway wall thickness assessed using computed tomography and optical coherence tomography. Am J Respir Crit Care Med. 2008;177(11):1201–1206. doi:10.1164/rccm.200712-1776OC
36. Higham A, Quinn AM, Cançado JED, Singh D. The pathology of small airways disease in COPD: historical aspects and future directions. Respir Res. 2019;20(1):49. doi:10.1186/s12931-019-1017-y
37. Martinez CH, Diaz AA, Meldrum C, et al. Age and small airway imaging abnormalities in subjects with and without airflow obstruction in SPIROMICS. Am J Respir Crit Care Med. 2017;195(4):464–472. doi:10.1164/rccm.201604-0871OC
38. Lutey BA, Conradi SH, Atkinson JJ, et al. Accurate measurement of small airways on low-dose thoracic CT scans in smokers. Chest. 2013;143(5):1321–1329. doi:10.1378/chest.12-0034
 © 2021 The Author(s). This work is published and licensed by Dove Medical Press Limited. The full terms of this license are available at https://www.dovepress.com/terms.php and incorporate the Creative Commons Attribution - Non Commercial (unported, v3.0) License.
By accessing the work you hereby accept the Terms. Non-commercial uses of the work are permitted without any further permission from Dove Medical Press Limited, provided the work is properly attributed. For permission for commercial use of this work, please see paragraphs 4.2 and 5 of our Terms.
© 2021 The Author(s). This work is published and licensed by Dove Medical Press Limited. The full terms of this license are available at https://www.dovepress.com/terms.php and incorporate the Creative Commons Attribution - Non Commercial (unported, v3.0) License.
By accessing the work you hereby accept the Terms. Non-commercial uses of the work are permitted without any further permission from Dove Medical Press Limited, provided the work is properly attributed. For permission for commercial use of this work, please see paragraphs 4.2 and 5 of our Terms.