")
Back to Journals » Patient Preference and Adherence » Volume 14
Quality of Pediatric Healthcare Services and Associated Factors in Felege-Hiwot Comprehensive Specialized Hospital, North-West Ethiopia: Parental Perception
Authors Takele A, Adamu A , Debalkie D
Received 8 June 2020
Accepted for publication 18 August 2020
Published 18 September 2020 Volume 2020:14 Pages 1649—1658
DOI https://doi.org/10.2147/PPA.S264106
Checked for plagiarism Yes
Review by Single anonymous peer review
Peer reviewer comments 2
Editor who approved publication: Dr Johnny Chen
Ayenew Takele Alemu, Ayinengida Adamu Walle, Desta Debalkie Atnafu
Department of Health System Management and Health Economics, School of Public Health, Bahir Dar University, Bahir Dar, Ethiopia
Correspondence: Desta Debalkie Atnafu Email [email protected]
Background: Poor quality of pediatric healthcare services at health facilities is a major contributing factor to child morbidity and mortality in low- and middle-income countries, including Ethiopia, and it brings parental dissatisfaction. Eliciting parents’ perception is an important method used to assess functionality or quality of pediatric healthcare services. Thus, the objective of this study was to assess the perceived quality of pediatric healthcare services and to identify factors for it in Felege-Hiwot Comprehensive Specialized Hospital, Northwest Ethiopia.
Methods: A facility-based cross-sectional study was conducted among parents of childhood patients from September 15, 2019 to October 15, 2019; 407 participants were recruited. Stratified random sampling was used to select respondents and data were collected using face-to-face interviews. Frequencies, percentages, and means with standard deviations were used to describe profiles of respondents. Both bi-variable and multivariable logistic regressions were used to model the odds of perceived quality of pediatric healthcare services.
Results: The proportion of perceived quality of pediatric healthcare services was 57.6% (95% CI:52.6– 62.3%). College and above parental education status (AOR=5.22, 95% CI:2.39– 11.38), urban residency (AOR=3.35, 95% CI:1.97– 5.72), outpatient services (AOR=2.52, 95% CI:1.35– 4.71), and surgical illnesses (AOR=2.18, 95% CI:1.28– 3.73) were independent determinants for increased parental lower perceived level of quality. The odd of parental lower perceived level of quality was 2.42-times greater in those parents who did not prefer the hospital for revisiting (AOR=2.42, 95% CI:1.36– 4.30).
Conclusion: Perceived quality of healthcare services in the hospital was low compared to the national plan which reflected that childhood patients did not receive optimal care. Educational status, place of residence, service delivering unit, illness type, and intention of hospital preference were independent determinants for parental perceived quality of pediatric healthcare service delivery. Continuous and periodic parental feedback should be considered in order to assess their satisfaction which in turn is an insight for quality improvement to be taken by the facility managers.
Keywords: perception, quality, pediatric service, Felege-Hiwot Hospital, Ethiopia
Introduction
The Institute of Medicine (1990) has defined healthcare quality as
the degree to which health services for individuals and populations increase the likelihood of desired health outcomes and are consistent with current professional knowledge.1
Because of advancement in technology and medical sciences of the current world, healthcare organizations are highly demanded to provide quality healthcare services.2 Service quality is considered as important factor for the success and survival of organizations3 as it ensures loyalty to users and maintains its competitive advantage.4 Customers who receive quality healthcare services will trust and revisit the healthcare organizations. Healthcare service quality also contributes a lot to the successful implementation of universal health coverage. According to WHO (2018), “access without quality can be considered an empty universal health coverage promise”.5
For the last three decades, the main goal and focus of the Ethiopian health system were about improving access and coverage of essential preventive and curative healthcare services. But today, high attention is given to the quality of healthcare services at all levels of the system. This is ascertained by the Ethiopian health sector transformation plan (HSTP) which has launched quality of care as one of its core goals. Striving consistent and high quality of care to all patients regardless of their differences in socioeconomic status and geographic location was mentioned as a cornerstone of the HSTP.6 It has also prioritized to set quality standards and protocols targeting 100% achievement as a national plan.7
Quality of services in a health sector is generally categorized as technical quality and functional quality.8 The technical quality refers to the type of services or procedures offered to patients, whereas functional quality means the way through which services are reached by patients. Patients do have their own expectations about the service delivery process and hence they are considered as evaluators of the functional quality attributes of healthcare delivery system.9
Therefore, eliciting the service users’ perception is an important method of measuring the functional aspect of healthcare service quality (HCSQ).10 Hospital HCSQ is basically measured by collecting feedback on the services delivered from different perspectives.11 For pediatrics healthcare services, it is the perceptions of parents or caregivers of the sick children that is required to measure its quality.12–14 Parents’ perspective would be considered to adequately assess the factors affecting hospital pediatric healthcare service quality where the children are being received.
Parents’ perception about quality of healthcare services might be influenced by different factors. Socio-demographic characteristics such as age, sex, educational level, occupation, and residence were reported as factors associated with perception of healthcare service quality.14–17 History of patients’ hospitalization,14,18 differences of service units, and patients’ illnesses type19 were also identified as predictors for perceived quality of health services.
Even if healthcare services are delivered at an affordable cost and in a well-resourced facility, they will not bring the desired outcomes unless they drives quality. Poor HCSQ affects the trust of the community being served and, consequently, their future utilization of the service wastes time and money, and most critically undermines the effectiveness of universal health coverage.2,5 A deficiency in the quality of pediatric healthcare services at health facilities is a major contributing factor for child mortality in low- and middle-income countries, including Ethiopia.20
Although integrated pediatrics healthcare service initiatives have been established in most hospitals of Ethiopia, delivering quality is still under question. To the best of the investigators’ search in Ethiopia, there is scant evidence on the topic. Despite the government’s effort to improve healthcare services provision, the community is increasingly demanding for quality pediatric healthcare services. Therefore, this study was reasonably conducted to generate evidence on functional quality of pediatric healthcare services in Felege-Hiwot comprehensive specialized hospital (FHCSH). The study was aimed to assess the level of perceived quality of pediatric health services and identify the associated factors.
Methods and Materials
Study Setting and Participants
The study was conducted at FHCSH. It is located in Bahir Dar City and 480 Km to the North West of Addis Ababa, the capital city of Ethiopia. The hospital was established 55 years ago and is currently providing comprehensive healthcare services. It serves a population of more than 7 million in the region. The pediatrics department has a total of 118 beds. It is providing integrated healthcare services to patients of pediatric age group (patients below 15 years of age) in its outpatient department (OPD), emergency triaging assessment and treatment (ETAT), inpatient department (IPD), and neonate’s intensive care unit (NICU). The department is currently staffed by 62 nurses, 14 general practitioners, three pediatricians, and other supportive staff. According to the 2018/19 year budget report, a total of 7,356 childhood patients were seen from July, 2018 to December, 2019; with a monthly attendance of 1,226. Since children are not capable enough to perceive service quality received and respond appropriately, the participants for this study were parents or caregivers of childhood patients. The parents of all childhood patients who have exited (discharged) with fully completed services were included, whereas parents of childhood patients with incomplete services and referral slips to other institutions were excluded from the study.
Study Design and Period
A facility-based cross-sectional study design was conducted from September 15 to October 15, 2019 in Felege-Hiwot Comprehensive Specialized Hospital, Bahir Dar City, North west Ethiopia.
Sample Size Determination and Sampling Procedure
The total sample size required for the study was determined by using the formula that is a single population proportion considering the following assumptions: proportion (p)=59.8% (parental level of satisfaction in quality of pediatrics care),17 margin of error=5%, and α at 95% confidence interval. After adding 10% for non-response rate, the total sample size was estimated to be 407 parents.
A stratified random sampling procedure was employed. Participants were stratified into four groups based on the place (unit) where patients received the services: emergency (ETAT), outpatient (OPD), inpatient (IPD), and neonatal (NICU) attendants. The estimated average monthly patient flow was used to calculate the sampling interval (N=1226). After service units had been stratified, study participants from each stratum were selected using systematic random sampling technique every K value of three among discharged patients; K=N/n=1226/407=3.01, ie, K~3. Finally considering the patients order of discharge as a sampling frame, the parent or caregiver of every third patient was recruited (Figure 1).
 |
Figure 1 Schematic diagram of sample size allocation into service delivering units of pediatrics department, FHCSH, 2019. |
Data Collection Procedure and Studied Variables
An English version questionnaire comprised of four dimensions was adapted from the validated tool of HEALTHQUAL model.21 The adapted English version questionnaire was translated into the local language, Amharic, and then re-translated back into English to ensure its consistency. Inter-item correlation coefficients among items were lower than 0.60 reflecting that each item independently measures the unique characteristic of service quality. The questionnaire was pre-tested in another health facility (Tibebe Giyon Specialized Teaching Hospital) on 5% of the sample for the purpose of improving the questionnaire with regard to simplicity of understanding and its flow. The data was collected using a face-to-face interview by three BSc nurses who were working out of the hospital.
Scale reliability analysis was performed by calculating Cronbach’s alpha value for the overall and each subscale to test internal consistency. The calculated Cronbach’s alpha values for all the subscales exceeded 0.70 and it was 0.93 for the overall scale, which reflects the presence of excellent internal consistency.22 The outcome variable for this study was the perceived quality of pediatric healthcare services. The independent variables were socio-demographic variables (age, sex, educational background, occupation, and place of residence), service delivering units (OPD, ETAT, IPD, & NICU), patient-related variables (illness type, payment status, history of hospital contact, and frequency of hospital visit), and parent-related variables (relationship to the patient, distance traveled in Km, and preference to revisit the hospital).
Operational Definitions
Parents
Refers to any caregiver, guardian, or attendant who accompanied the pediatric patient at the time of the interview.
Diseases Category
Refers to the classification of illnesses under which diseases diagnosed for childhood patients are included. For the present study, a secondary data from patients’ folder was used to know individual patients illness type. Then, the specified disease type was recorded under four major categories as medical, surgical, orthopedic and related and mental illnesses accordingly.
Perceived Quality of Pediatric Healthcare Services
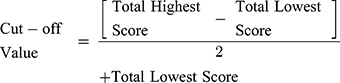
Refers to parents’ views about the functional quality of services delivered by FHCSH pediatrics department to their child. It was measured by a total of 30 items of five-Point Likert-scale questions. The questionnaire measured four dimensions of quality, namely: tangibility (8 items), empathy (7 items), efficiency (7 items), and safety (8 items). Respondents were allowed to score 1–5 for each item (1=poor, 2=fair, 3=good, 4=very good, and 5=excellent). Then responses of each item were summed up to get the total scores for overall and each subscale. The overall and subscale summed scores were, then, categorized into high and low levels by using cut-off values calculated by a demarcation threshold formula.17,23,24
Data Management and Analysis
Data were entered using Epi-Data version 3.1 and exported to SPSS version 23 for analysis. Frequency, mean, and standard deviation were used for summarizing results. Simple and multiple binary logistic regression analyses were computed to assess associations between dependent and independent variables. Variables which had a P-value of less than 0.25 in bi-variable logistic regression analysis were taken for multivariable analysis. Model fitness was checked by Hosmer and Lemeshow goodness of fit test (P=0.84). Adjusted odds ratio (AOR) with 95% confidence interval (CI) was used to interpret the strength of associations.
Ethical Considerations
Ethical clearance was obtained from Bahir Dar University, college of medicine and health sciences ethical review board before conducting the study. The study was adhered to tenets of the Declaration of Helsinki. A support letter was also obtained from Amhara public health institute (reference number: APHI/03/464). Letter of permission was received from the office of the chief executive officer (CEO) of FHCSH. Verbal and written informed consent was obtained from study participants during data collection and each participant was informed about the right to refuse and withdraw from interview at any time. The data collection procedure was anonymous, and their privacy was also kept. The data available from the contact author are de-identified.
Results
A total of 401 parents (caregivers) were interviewed in the study resulting in a 98.52% response rate.
Socio-Demographic Characteristics
Out of the total participants, 246 (61.3%) were female respondents. The participants had a mean age of 33.76±8.69 years. A significant number of respondents (32.2%) did not have formal education. About two fifths (40.9%) of the respondents were farmers, while a minority of the respondents were physical laborers, accounting for 6.2% of the total participants. Two hundred and twelve respondents (52.9%) were rural dwellers (Table 1).
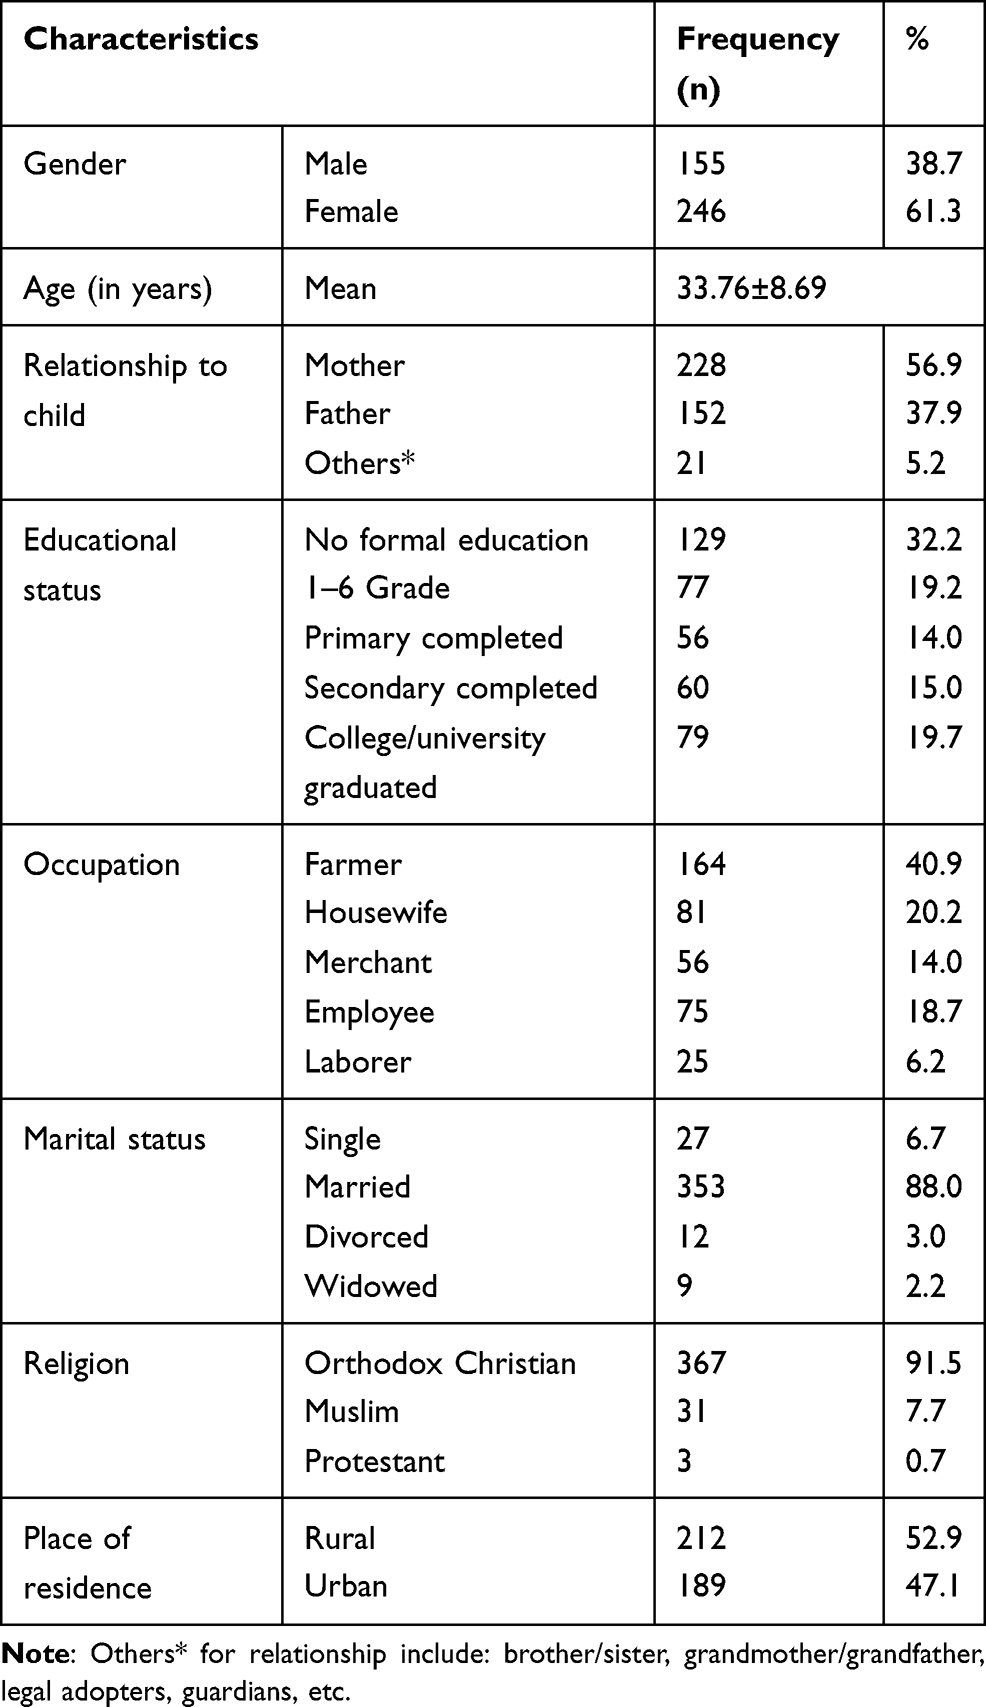 |
Table 1 Socio-Demographic Characteristics of Respondents Involved in Perceived Quality Assessment of Pediatric Healthcare Services at FHCSH, September 2019 (n=401) |
Patients’ Characteristics
Out of 401 patients involved in this study, 208 (51.9%) were males. One hundred and ninety-six patients (48.9%) had a history of visits to the hospital. The pediatrics’ illnesses were classified into four major categories of diseases. Accordingly, the majority of patients (64.8%) had a diagnosis of diseases under the classification of medical illnesses, followed by surgical illnesses, which accounted for 18.2%. Two hundred sixty-nine patients (67.1%) obtained services free of charge (Table 2).
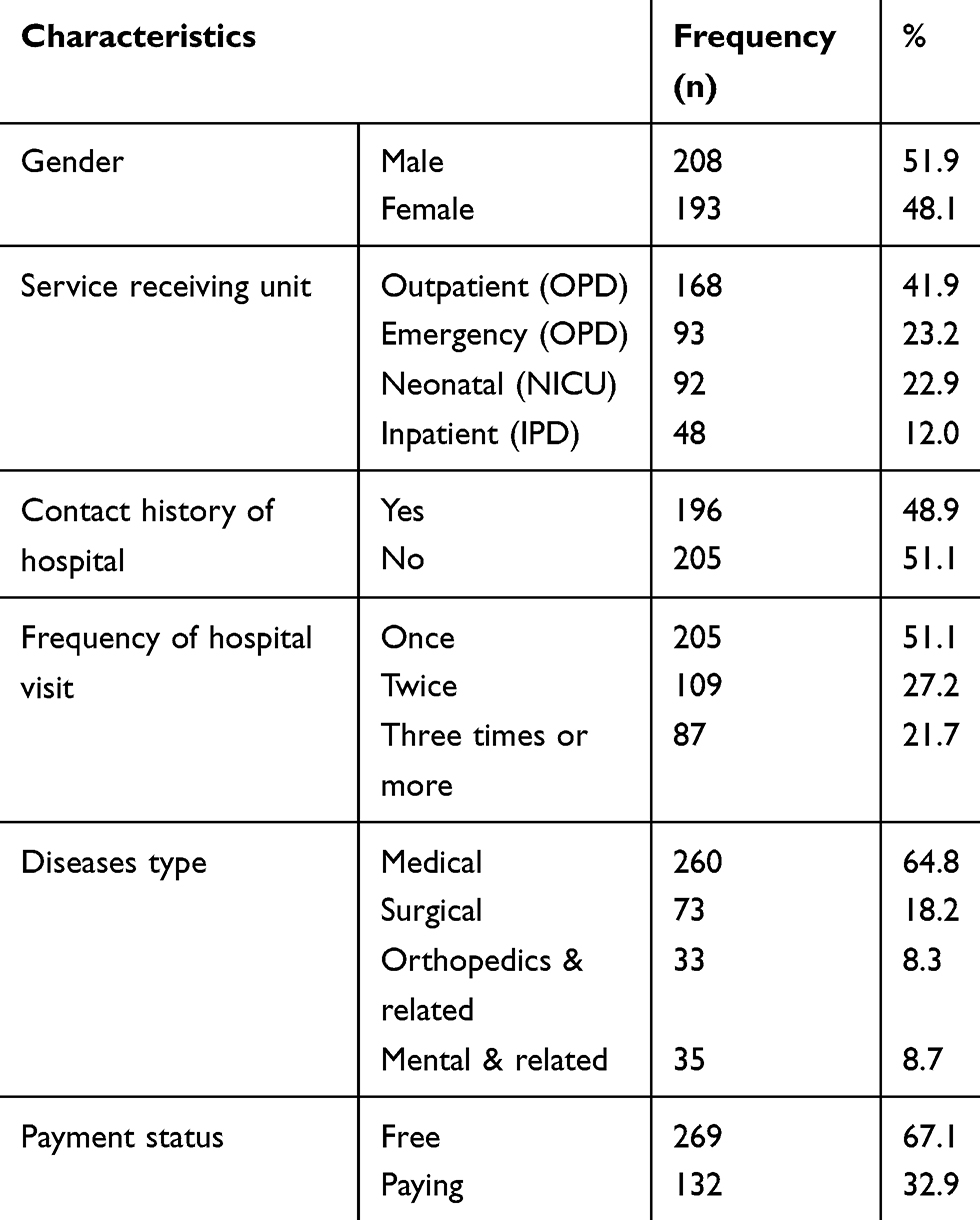 |
Table 2 Patient-Related Characteristics During Perceived Quality Assessment of Pediatric Healthcare Services at FHCSH, September 2019 (n=401) |
Service-Related Characteristics
Two hundred and fifty-six parents (63.8%) responded that the physician explained what their child’s health condition was. The parents were also asked to rate their level of satisfaction with the overall services that their children received. Two hundred and twelve parents (52.9%) were satisfied, 127 (31.7%) were fairly satisfied, and 62 (15.5%) were not satisfied. About 311 parents (77.6%) intended to prefer and revisit the hospital for the future consumption of pediatrics healthcare services.
Perceived Quality of Pediatric Healthcare Services
The mean Likert-scale score of overall items was 3.06 with a standard deviation of ±0.55.
Tangibility
For this subscale the mean Likert scale score was 2.77±0.66. Parental perception in the item of medical equipment availability showed negative valence (below a cut-off value 3.0) with a mean score of 2.93±1.02. Parents’ ratings of the item “availability of comfortable facilities” is low (mean score=2.91±0.95). The physical appealing of hospital compound was rated as low with a mean score of 2.55±1.03. Parents also rated the item “service units are well indicated directionally” as poor with a mean score of 2.38±0.97. The items under this dimension that were rated by respondents as the most poor include availability of water sources and well-functioning clean toilets with mean scores of 1.76±0.93 and 2.01±0.98, respectively. Other items were scored positively with a maximum mean score of 3.93±0.92 for “professional dressing’s attractiveness and neatness”.
Empathy
This subscale’s mean score was 3.23±0.68. The item that was scored best was the providers’ intention of understanding and considering patients’ situation, with a mean score of 3.72±0.91. Parents perception on the item statement “sense of showing closeness and friendliness” showed minimal positive valence (mean score=3.06).
Efficiency
The observed mean Likert-scale score was 3.05±0.58. Under this dimension, the item scored as low perceived quality of healthcare was “availability of drugs and medical goods”, with a mean score of 1.99±0.99. Parental perception also showed negative valence to the items “convenient facility for treatment procedures” and “short waiting time”, with mean scores of 2.89±0.94 and 2.68±1.12, respectively. The maximum mean score was observed for the item statement “efforts for proving appropriate treatment methods” having a mean score of 3.56±0.85.
Safety
The mean Likert-scale score for this dimension was calculated to be 3.23±0.64. Specifically, to item statements, the highest mean score was observed for doctors’ competency of not making a misdiagnosis followed by nurses’ competency of not making mistakes, with 3.65±0.93 and 3.55±0.87 mean scores, respectively. Item scales “safe and comfortable environment” and “facilities safely free from infection” were rated as poor by parents, with 2.85±0.95 and 2.96±0.99 mean scores,respectively.
Level of Perceived Quality
The overall level of quality was assessed by computing the total from the 30 items for each respondent and using demarcation threshold formula as a cut-off value (threshold value) to classify the total score as high or low quality. Accordingly, it was observed that 231 (57.6%) respondents (95% CI:52.6–62.3%) rated the pediatric health services as high quality.
The perceived quality was also calculated for each quality dimension based on their subscale totals and respective cut-point values. The least and the highest level of quality was for tangibility and safety dimensions having 33.4% and 63.6%, respectively (Table 3).
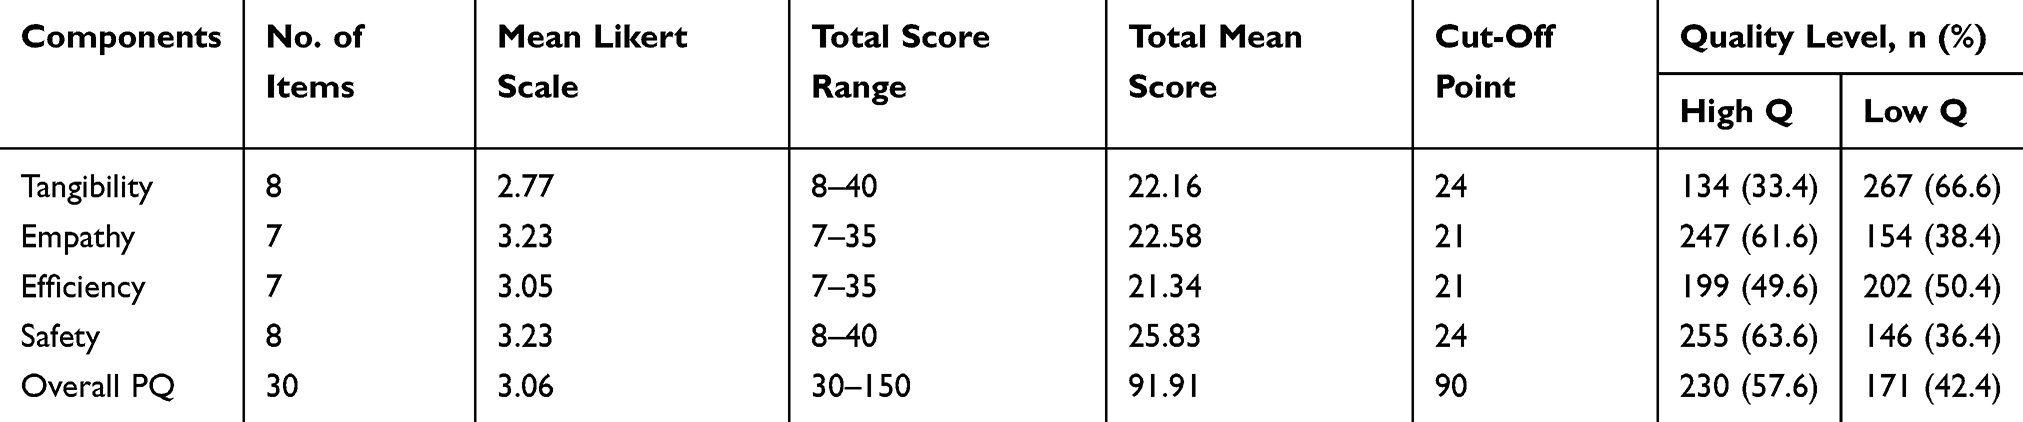 |
Table 3 Subscale and Overall Level of Perceived Quality in Pediatrics Healthcare Service at FHCSH, September 2019 (n=401) |
Factors Associated with Perceived Lower Level of Quality in Pediatrics Healthcare Services
To identify statistically significant independent predictors of perceived quality of pediatric healthcare services, a multivariable logistic regression model was used. The variables remained in the final multivariable model include: parents’ educational status, residence, disease category, service unit, and preference to revisit the hospital in the future. However, payment status, distance traveled in kilometers, and marital status were not found in the multivariable model. The odds of rating the level of pediatric healthcare service quality as low were 2.42-times higher in those parents who did not prefer to revisit the hospital (AOR=2.42, 95% CI:1.36–4.30). The odds of perceiving low quality of pediatric healthcare services were 3.27- and 5.22-fold higher among parents who completed secondary education (AOR=3.27, 95% CI:1.52–7.04) and college or university attendants (AOR=5.22, 95% CI:2.39–11.38), respectively. The odds of low perceived quality of pediatric healthcare services was 3.35-times higher in caregivers of urban residents (AOR=3.35, 95% CI:1.97–5.72). Being a caregiver at OPD (AOR=2.52, 95% CI:1.35–4.71) and ETAT (AOR=2.33, 95% CI:1.15–4.74) service unit increased the rating of quality of pediatric healthcare services as low by 2.52- and 2.33-fold, respectively. The odds of perceiving quality of pediatric healthcare services as low was 2.18-fold higher among surgical patient caregivers (AOR=2.18, 95% CI:1.28–3.73) (Table 4).
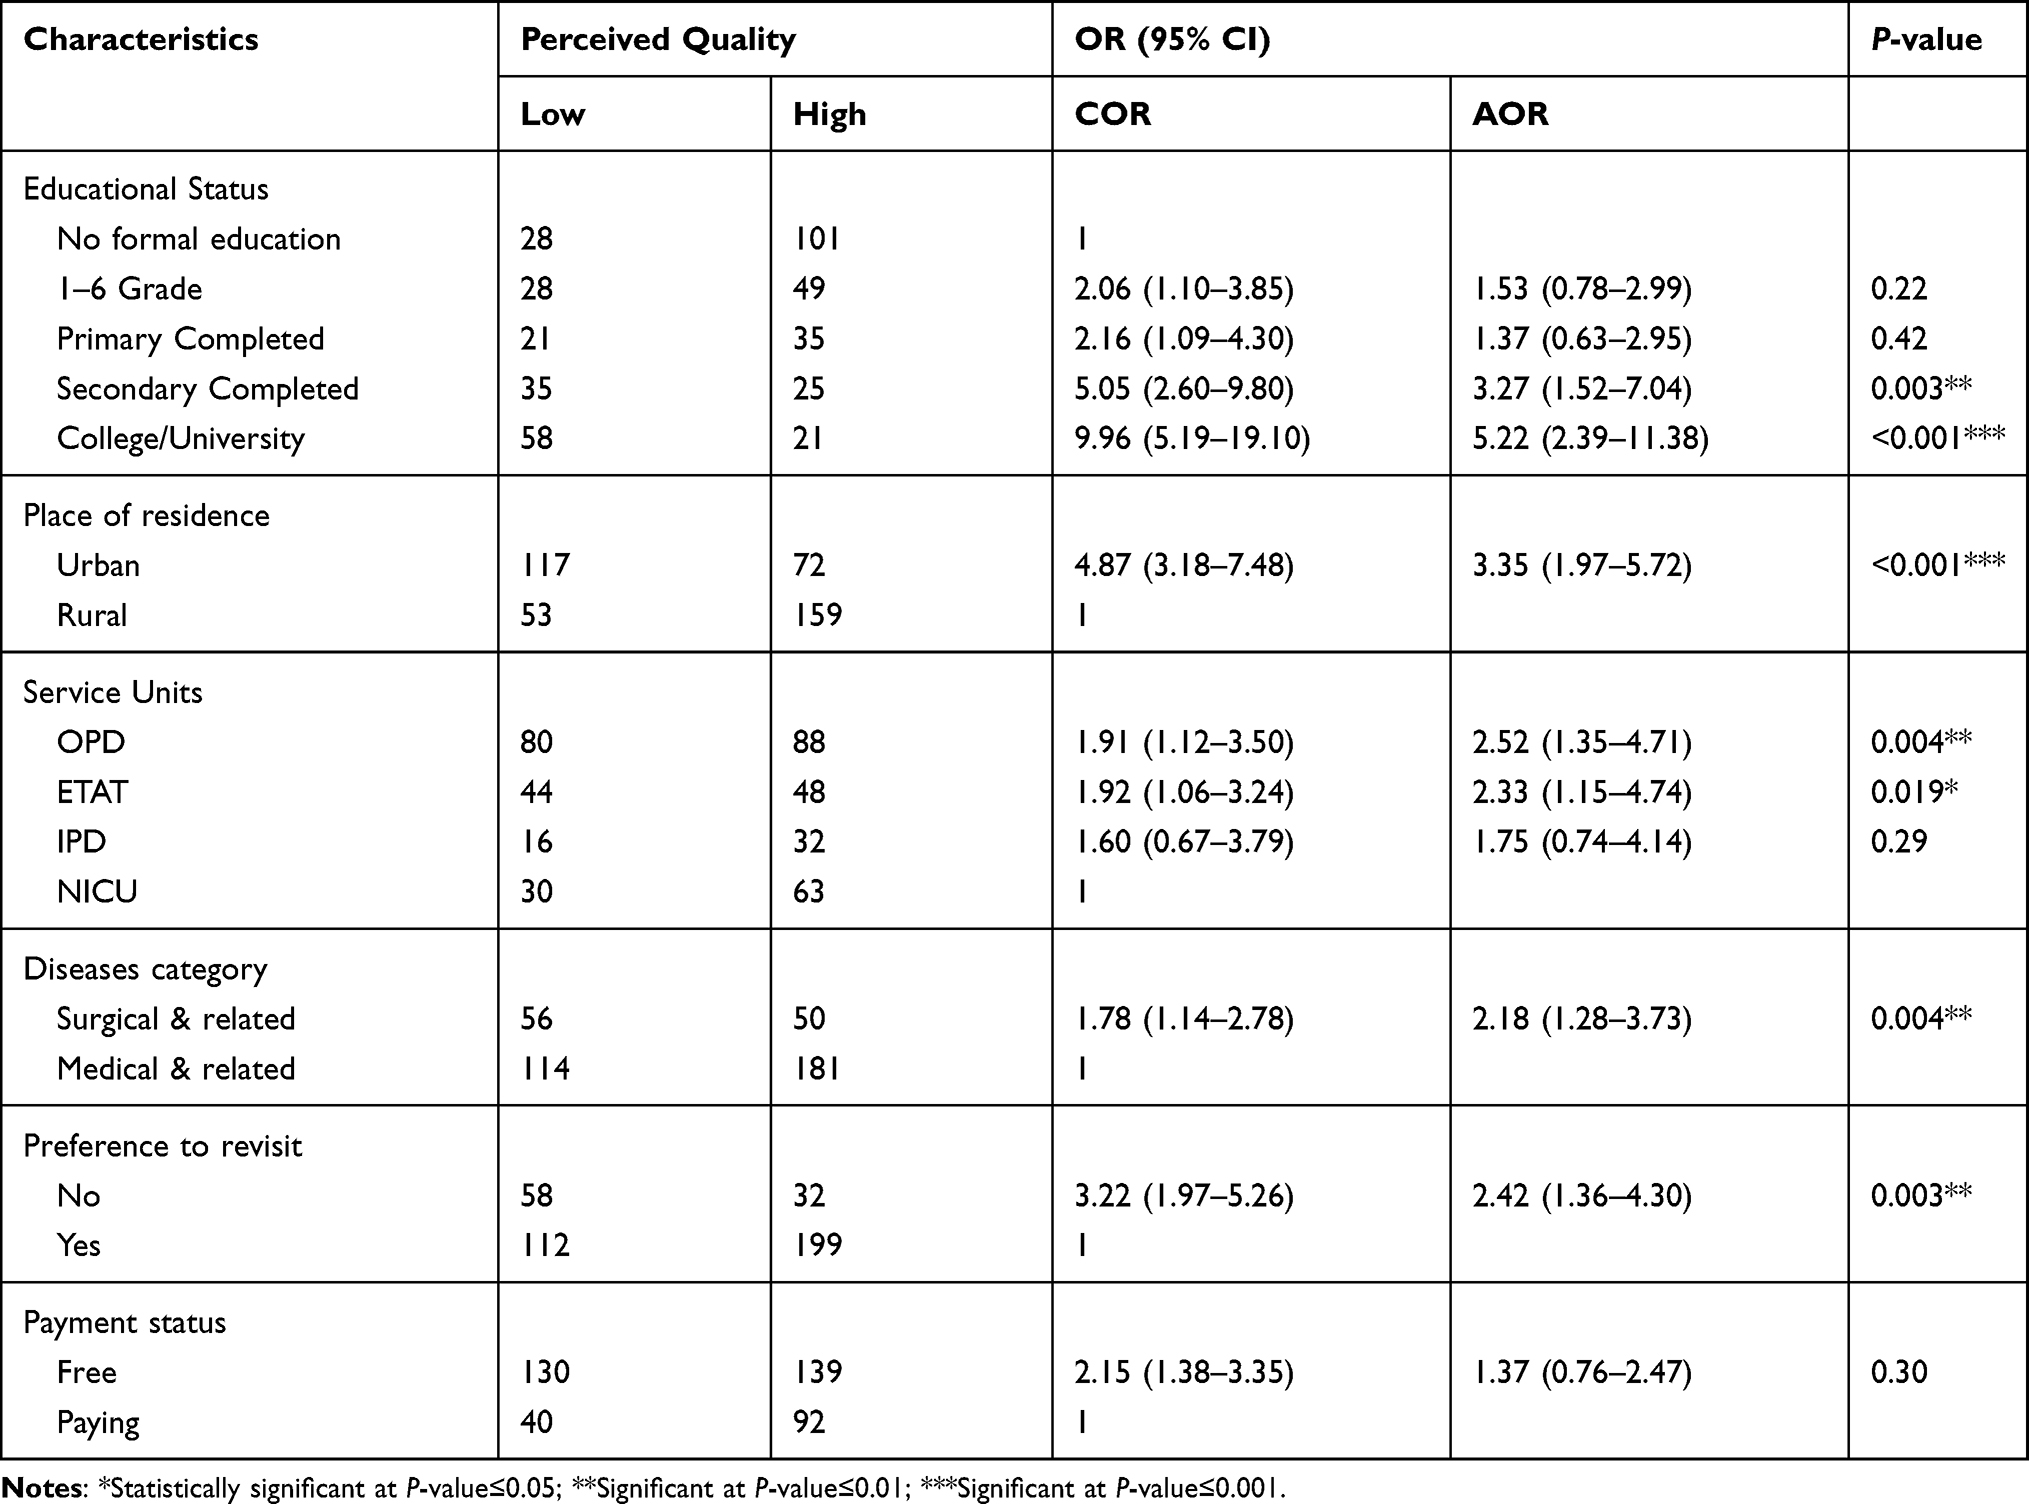 |
Table 4 Multivariable Binary Logistic Regression Analysis for Factors Associated with Parental Lower Perception of Quality in Pediatrics Healthcare Services in FHCSH, September 2019 |
Discussion
The overall level of perceived quality was investigated to be 57.6% (95% CI:52.6–62.3%). This finding is in line with other studies conducted in Black Lion Specialized Hospital (Addis Ababa, Ethiopia) and Kenyatta Hospital (Kenya) that showed the overall level of parental perception in quality of pediatric care was 59.8% and 57.9%, respectively.14,17 However, it is lower when compared to the findings from India which reported the overall level of healthcare service quality to be 88.9%.25 The mean score of overall perceived quality, 3.06±0.55, is also lower than a finding from Israel-Aina et al16 which reported the overall mean score of parental perception was 4.35±0.43. The reason for this discrepancy might be due to difference in organizational culture and underlying economic issues of hospitals. The overall level of perceived quality in the present study is generally lower than the national plan.7 This finding indicated that quality is not adequately driven and not yet able to deliver optimal healthcare services to childhood patients as per the recommendation of MOH in which the quality of healthcare issues was clearly dictated in the HSTP.6
Tangibility as a quality dimension had an overall mean score of 2.77±0.66, which is in a negative valence (below cut-off value 3.0) indicating there are gaps in physical evidence of quality. This finding is low when compared to another studies conducted in Bangladesh and Vietnam which reported the overall mean scores of tangibility were 3.49±1.005 and 3.95±0.595, respectively.26,27 The possible explanation for this difference could be due to the infrastructure and facilities difference between hospitals being compared.
Furthermore, the study critically has evidenced that drugs and medical equipment availability have negative valences with mean scores of 1.99±0.99 and 2.93±1.021, respectively. The finding is quite comparable with the study from Bangladesh which assessed drugs and medical goods availability in a children’s hospital with a negative valence of mean score 2.36±1.19.26 Other studies by Keiza et al14, from Kenya, Goyal P et al25, from India and Baltussen28, from Burkina Faso also reported that drug and medical equipment availability were the commonest barriers of quality of healthcare services delivery in the hospitals.
Convenience by facilities for treatments and procedures was also scored below the threshold value (mean=2.89±0.944). Similar findings like lack of adequate facilities and unsuitable providers’ offices were reported as barriers of delivering quality services.14,28,29
Above all, quality assessment in all dimensions showed moderate-to-poor findings (from 63.6% for safety to 33.4% for tangibility) and this reflects that less effort has been exhibited for quality improvement initiatives. This has an implication that those health system quality indicators, effectiveness, safety, people-centeredness, timeliness, equity, accessibility, and efficiency were not adequately emphasized and addressed. It is far away from the theoretical framework and health system strategy that is health facilities must strive to achieve high performance by driving quality of healthcare services.5,30
The odd of perceived quality of healthcare services as low was greater among parents who have higher educational status. The explanation for these findings might be attributed to the difference in their insight and expectation towards the healthcare services that they are actually receiving. This finding is congruent with studies conducted in Kenyatta hospital, Benin teaching hospital, and Marshal University hospital.14,16,31 Likewise, studies conducted in Ethiopia, Black lion specialized hospital, and Jimma zone had reported in the same way.15,17
Significant difference in quality perception among parents was also observed by their place of residence. Parents who were urban dwellers showed a lower level of perceived quality than rural. This was supported by the studies carried out in Kenya and Ethiopia, Jimma zone.14,15
The type of service units where patients were being served was a determent for perceived quality of healthcare services and, hence, getting services at OPD and ETAT units were statistically correlated with perceived lower level of quality which in turn showed the less effort exhibition in outpatient and emergency services regarding quality. This results were agreed with another study conducted in Sweden which supported that parents of inpatients presented significantly higher quality perception than parents of outpatients.18 The explanation for this fact might be attributed to the lack of prompt service, long waiting time for test results, queues due to high patient flow, etc.
Significant differences among parents in quality perception were also attributed by type of illnesses diagnosed for their children. Specifically, the odds of parental lower perception in pediatric healthcare services quality was 2.18-times greater in those parents whose children were served for surgical services, and this agrees with the study conducted in Iran.19 It has an implication that the hospital in general neglects patients with surgical cases despite the hospital’s rank.
Similarly to the finding of another study, respondents who never preferred the hospital to revisit showed significantly lower rating in perceived quality than those who intended to prefer.32 On the other hand, the descriptive results showed that the majority of respondents (77.6%) intended to prefer the hospital for future use despite the fact that only half of the respondents (52.9%) were satisfied on the treatments provided to their children. This controversial result might be implying the fact that communities in which the respondents selected were lacking alternative public hospitals providing comprehensive and advanced healthcare services. This study was not conducted without any limitations. As the study was cross-sectional, the factors do not establish a temporal relationship; therefore, inference of causation is not possible. Since the study aimed on functional aspects of healthcare services delivery, technical parameters were not well addressed.
Conclusion
Perceived quality of healthcare services in the hospital was low compared to the national plan which reflected that childhood patients did not receive optimal care. Educational status, place of residence, service delivering unit, illness type, and intention of hospital preference were independent determinants for parental level of perceived quality of pediatric healthcare services delivery. The study also identified that there was a lower perceived quality of services in outpatient services and surgical patients. Therefore, further strategies have to focus on urban residence; outpatient service and surgical service delivery and those well-educated so as to grow healthy children by insuring quality pediatric healthcare service. Continuous and periodic parental feedback should be considered in order to assess their satisfaction, which in turn is an insight for quality improvement to be taken by the facility managers.
Abbreviations
AOR, Adjusted Odds Ratio; BSc, Bachelor of Science; CEO, Chief Executive Officer; CI, Confidence Interval; COR, Crude Odds Ratio; ETAT, Emergency Triaging Assessment and Treatment; FHCSH, Felege Hiwot Comprehensive Specialized Hospital; HCSQ, Health Care Services Quality; HSTP, Health Sector Transformation Plan; HSTQ, Health Sector Transformation in Quality; Km, Kilometer; MOH, Ministry of Health; IPD, In Patient Department; NICU, Neonate Intensive Care Unit; OPD, Out Patient Department; SD, Standard Deviation; SPSS, Statistical Package for Social Sciences; WHO, World Health Organization.
Data Sharing Statement
Data of this study are available without restriction. Contact this e-mail: [email protected] when needed.
Ethics Approval and Consent to Participate
This study was approved by the IRB of Bahir Dar University and the study adhered to tenets of the Declaration of Helsinki. Written and verbal informed consent was also obtained from the study participants before conducting this study.
Acknowledgments
We would like to acknowledge Bahir Dar University, Amhara Public Health Institute, data collectors and supervisor and participants involved in the study.
Author Contributions
All authors made substantial contributions to the conception and design, acquisition of data, or analysis and interpretation of data; took part in drafting the article or revising it critically for important intellectual content; agreed to submit to the current journal; gave final approval of the version to be published; and agree to be accountable for all aspects of the work.
Disclosure
The authors have declared that no competing interests exist in this study.
References
1. Institute of Medicine. Medicare: A Strategy for Quality Assurance. Washington, DC: IOM, The National Academies; 1990:1.
2. World Health Organization. Quality of Care: A Process for Making Strategic Choices in Health System. WHO Press; 2006.
3. Untachai S. Modeling service quality in hospital as a second order factor, Thailand. Procedia Soc Behav Sci. 2013;88:118–133. doi:10.1016/j.sbspro.2013.08.487
4. Alimana N, Mohamadb WN. Linking service quality, patients’ satisfaction and behavioral intentions: an investigation on private healthcare in Malaysia. Procedia Soc Behav Sci. 2016;224:141–148. doi:10.1016/j.sbspro.2016.05.419
5. Delivering Quality Health Services. A Global Imperative for Universal Health Coverage. Geneva: World Health Organization, Organization for Economic Co-operation and Development, and the World Bank; 2018. Licence: CC BY-NC-SA 3.0 IGO.
6. Federal Ministry of Health (Ethiopia). Health sector transformation plan, 2015/16-2019/20 (EFY 2008–2012); 2015.
7. Federal Ministry of Health (Ethiopia). Health Sector Transformation in Quality: A Guide to Cascade Quality Improvement Activities in Ethiopian Health Facilities; 2016:1
8. Gronroos C. A service quality model and its marketing implications. Eur J Mark. 1984;18(4):36–44. doi:10.1108/EUM0000000004784
9. Buttle F. SERVQUAL: review, critique, research agenda. Eur J Mark. 1996;30(1):8–32. doi:10.1108/03090569610105762
10. Schneider B, White S. Service Quality: Research Perspectives. T house and Oaks, CA: Sage; 2004.
11. Lee DH, Kim KK. Assessing healthcare service quality: a comparative study of patient treatment types. Int J Qual Innov. 2017;3(1). doi:10.1186/s40887-016-0010-5
12. Rifkin L, Wolf MH, Lewis CC, Pantell RH. Children’s perceptions of physicians and medical care: two measures. J Pediatr Psychol. 1988;13:247–254. doi:10.1093/jpepsy/13.2.247
13. Schwab ME, Stone K. Conceptual and methodological issues in the evaluation of children’s satisfaction with their mental health care. Eval Program Plann. 1983;6:283–289. doi:10.1016/0149-7189(83)90008-3
14. Keiza EM, Chege MN, Omuga BO. Assessment of parents’ perception of quality of pediatrics oncology inpatient care at Kenyatta National Hospital. Asia Pac J Oncol Nurs. 2017;4(1):29–37. doi:10.4103/2347-5625.199071
15. Beyene W, Jira C, Sudhakar M. Assessment of quality of health care in Jimma Zone, South-West Ethiopia. Ethiop J Health Sci. 2011;21.
16. Israel-Aina YT, Odunvbun ME, Aina-Israel O. Parental satisfaction with quality of health care of children with sickle cell disease at the University of Benin Teaching Hospital, Benin City. J Community Med Primary Health Care. 2017;29(2):33–45.
17. Tesfa G. Parental satisfaction concerning their child’s hospital care and associated factors in Black lion specialized Hospital, Addis Ababa, Ethiopia; 2015.
18. Ygge BM, Arnetz JE. Quality of paediatric care: application and validation of an instrument for measuring parents satisfaction with hospital care. Int J Qual Health Care. 2001;13(1):33–43. doi:10.1093/intqhc/13.1.33
19. Mosadeghrad AM. Factors affecting medical service quality. Iran J Public Health. 2013;43(2):210–220.
20. World Health Organization. Better hospital care for children: improving quality of paediatric care at fist-level referral hospitals in Angola, Ethiopia, Kyrgyzstan and Tajikistan: final technical report 2012–2015; 2016.
21. Lee DH. HEALTHQUAL: a multi-item scale for assessing healthcare service quality. Serv Bus. 2016;10(2). doi:10.1007/s11628-016-0317-2.
22. Gliem JA, Gliem RR. Calculating, interpreting, and reporting Cronbach’s alpha reliability coefficient for likert-type scales.
23. Akhtari-Zavare M, Abdullah MY, Tajuddin Syed KS, Salmiah H, Said Mohammad B. Patient satisfaction: evaluating nursing care for patients hospitalized with cancer in Tehran Teaching Hospitals, Iran. Glob J Health Sci. 2010;2(1):117–126. doi:10.5539/gjhs.v2n1p117
24. Chemir F, Alemseged F, Workineh D. Satisfaction with focused antenatal care service and associated factors among pregnant women attending focused antenatal care at health centers in Jimma town, Jimma zone, South West Ethiopia; a facility based cross-sectional study triangulated with qualitative study. BMC Res Note. 2014;7(164):2–8.
25. Goyal P, Singh N, Lukhmana S. Patient perception and satisfaction are prudent for assessment and improvement of hospital services: a cross sectional study among OPD patients at ESIC Medical College and Hospital, Faridabad, Haryana. Int J Community Med Public Health. 2017;4(11):4165–4168. doi:10.18203/2394-6040.ijcmph20174821
26. Andaleeb S. Caring for children: a model of healthcare service quality in Bangladish. Int J Qual Health Care. 2008;20(5):339–345. doi:10.1093/intqhc/mzn024
27. Dung Chu S, Sin Khong T. (2017) Measuring healthcare quality in big public hospital in Vietnam Country. J Hosp Med Manag. 2017;3(3):24.
28. Baltussen R. Perceived quality of care of primary health care services in Burkina Faso. Health Policy Plan. 2002;17(1).
29. Roshnee R, Ramsaran R. Identifying health care quality attributes. J Health Hum Adm. 2005;428–443.
30. Federal Ministry of Health (MOH). National health care quality strategy: transforming the Quality of Health Care in Ethiopia, 2016–2020.
31. Koontz VS Parental Satisfaction in a Pediatric Intensive Care Unit. [Theses, Dissertations and Capstones. Paper 695]; 2003
32. Al-Hussami M, Al-Momani M, Hammad S, Maharmeh M, Darawad M. Patients’ perception of the quality of nursing care and related hospital services. Health Primary Care. 2017;1(2):1–6.
 © 2020 The Author(s). This work is published and licensed by Dove Medical Press Limited. The full terms of this license are available at https://www.dovepress.com/terms.php and incorporate the Creative Commons Attribution - Non Commercial (unported, v3.0) License.
By accessing the work you hereby accept the Terms. Non-commercial uses of the work are permitted without any further permission from Dove Medical Press Limited, provided the work is properly attributed. For permission for commercial use of this work, please see paragraphs 4.2 and 5 of our Terms.
© 2020 The Author(s). This work is published and licensed by Dove Medical Press Limited. The full terms of this license are available at https://www.dovepress.com/terms.php and incorporate the Creative Commons Attribution - Non Commercial (unported, v3.0) License.
By accessing the work you hereby accept the Terms. Non-commercial uses of the work are permitted without any further permission from Dove Medical Press Limited, provided the work is properly attributed. For permission for commercial use of this work, please see paragraphs 4.2 and 5 of our Terms.