")
Back to Journals » Journal of Multidisciplinary Healthcare » Volume 7
Quality of life in patients with visual impairment in Ibadan: a clinical study in primary care
Authors Adigun K, Oluleye T, Ladipo M, Olowookere S
Received 11 July 2013
Accepted for publication 19 September 2013
Published 17 April 2014 Volume 2014:7 Pages 173—178
DOI https://doi.org/10.2147/JMDH.S51359
Checked for plagiarism Yes
Review by Single anonymous peer review
Peer reviewer comments 3
Kehinde Adigun,1 Tunji S Oluleye,2 Modupe MA Ladipo,1 Samuel Anu Olowookere3
1Department of Family Medicine; 2Department of Ophthalmology, University College Hospital, Ibadan; 3Department of Community Health, College of Health Sciences, Obafemi Awolowo University, Ile-Ife, Nigeria
Background: Visual function is important for optimal orientation in functional and social life, and has an effect on physical and emotional well-being. Visual impairment, therefore, leads to restrictions in all aspects of daily living and is related to quality of life. The aim of this study was to provide information on the causes of visual impairment in patients presenting to their family physician, the spectrum of impairment, and its impact on quality of life for these patients.
Methods: This descriptive cross-sectional study of 375 adult patients with ocular symptoms was performed in the general outpatient department of the University College Hospital, Ibadan, from July to September, 2009. After checking their presenting visual acuity, the patients were interviewed using the Vision-Related Quality of Life questionnaire to determine the impact of visual impairment on their quality of life. Ophthalmic examinations were performed to determine the causes of visual impairment. The results were analyzed using proportions and percentages.
Results: The main causes of visual impairment were cataracts (58.7%), refractive error (19.4%), and glaucoma (2.9%). Visual impairment was found to be associated with advancing age, low education, and unemployment (P<0.001). Most patients (85.1%) were found to have good quality of life overall. Quality of life was found to be poor in the domains of visual function (64.2%) and social interaction (50.9%). Quality of life was found to be related to the degree of visual impairment, ie, blind patients reported poor quality of life (41.4%) when compared with those having low vision (8.6%) or near normal vision (2.4%, P<0.001).
Conclusion: This study identified poor quality of life in patients with a higher degree of visual impairment. Family physicians need to identify these visually impaired patients early and make timely referrals.
Keywords: quality of life, visual impairment, blindness, low vision
Introduction
Visual function is important for optimal orientation in functional and social life, and has an effect on physical and emotional well-being.1 Man is primarily visually motivated for survival, and sight is thought to account for about 80% of the function of all the five senses combined.2 Therefore, visual impairment leads to restriction in all areas of life and in particular quality of life.3 “Visual impairment” refers to all degrees of reduction in vision,4 and could be further defined as “a vision loss that constitutes a significant limitation of visual capability resulting from disease, trauma, or a congenital or degenerative condition”.
In the primary care setting, most visual impairment can be corrected by conventional means, including refractive error correction and medication.5,6 The degree of impairment, personality, intelligence, background, and coexistence with other disabilities all have varying effects on the individual, and therefore people are affected differently by visual impairment. For many, loss of visual function can be devastating.
The term “quality of life” is popularly used to describe an individual’s overall sense of well-being, and includes aspects such as happiness and satisfaction with life as a whole. The World Health Organization defines quality of life as “the individual’s perception of their position in life in the context of the culture and value system in which they live and in relation to their goals, standards, expectations, and concerns”.7 Quality of life may be the most important outcome to assess when considering the effectiveness of treatment in patients, especially those with chronic or incurable diseases, and has become a central outcome for treatment, prevention, and support.8
The theory of quality of life explains it as consisting of a range of subjective and objective aspects. The subjective aspects of quality of life deal with well-being, satisfaction, happiness, and meaning of life, while the objective aspects can be assessed using factors such as conformity to cultural norms, fulfillment of needs, realization of life’s potential, and maintaining biological order, ie, the ability to function within a societal norm. Efforts to measure health expectancy have increased in parallel with increased life expectancy,9 leading to patient-based assessment of health-related quality of life and with a focus on the impact of a perceived health state on the ability to live a fulfilling life.8,10
Understanding the magnitude of the physical and psychosocial aspects of visual impairment requires a careful exploration of vision-related quality of life using a standardized instrument. Disability arising from visual impairment represents a major social, emotional, and economic burden for patients, their families, communities, and the nation overall. The outcome of this study identifies a need to improve quality of life in patients with visual impairment.
Materials and methods
Our study was designed to conform to the tenets of the Declaration of Helsinki and good clinical standards. Ethical approval was obtained from the Joint University of Ibadan/University College Hospital Ibadan institutional review committee before commencement of the study. Written informed consent was obtained from all participating patients.
The study was designed to be cross-sectional and descriptive, and was carried out in the general outpatient department at University College Hospital, Ibadan, Nigeria, from July to September, 2009. The sample size required was calculated using the Kish and Leslie formula, citing the existing prevalence rate of visual impairment as documented in a previous similar study.11 A minimum sample size of 375 was estimated. Inclusion criteria included new and review patients 18 years and older presenting with visual complaints to the general outpatient department. Pretested quality of life questionnaires were administered by the family physician. The study instrument was the standardized Visual Function and Quality of Life questionnaire designed to measure the impact of impaired vision on the patient’s ability to perform activities of daily living. Each patient’s presenting visual acuity was assessed using a Snellen chart placed 6 meters away from the participant in a well illuminated area. The tumbling E chart was used for illiterate patients. Slit-lamp examination, tonometry, and funduscopy were used by the ophthalmologist to confirm the diagnosis.
Results
Three hundred and seventy-five respondents presenting with ocular symptoms were recruited for the study. The male to female ratio was 1:1.1. The mean age of the respondents was 49.4±5.28 years (Table 1). The study found a 6.27% prevalence of visual impairment, 2.47% for blindness, and 3.8% for low vision. The most common causes of visual impairment were cataract (220, 58.7%), refractive error (73, 19.4%), and glaucoma (11, 2.9%).
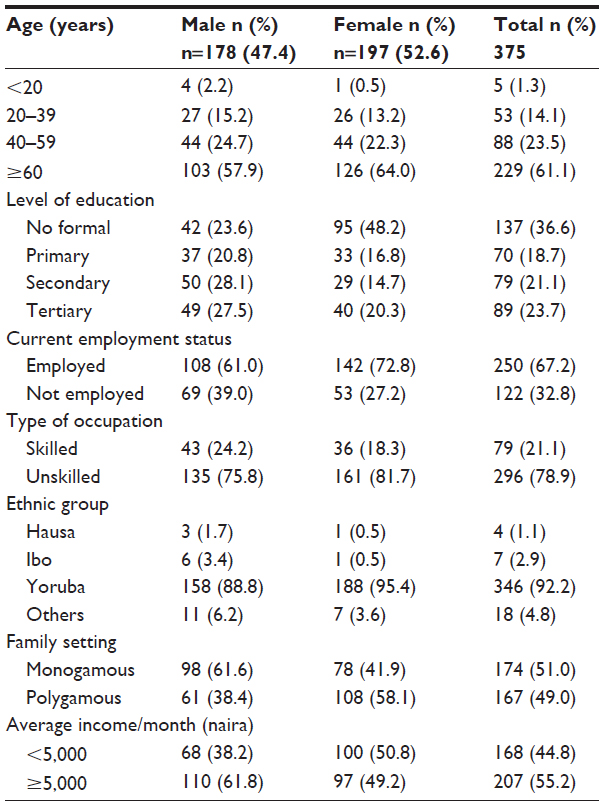 | Table 1 Sociodemographic distribution of respondents by sex |
Vision-related quality of life
A total of 315 patients (85.1%) had good vision-related quality of life (Table 2). The quality of life of respondents in the five domains, ie, visual function, self-care, social interaction, mobility, and mental status, are shown in Table 3. Two hundred and forty-one (64.2%) patients were found to have poor quality of life in the domain of visual function; 17 (4.5%) in the domain of self-care; 166 (42.9%) in the domain of mobility; 191 (50.9%) in the social interaction domain; and 171 (47.2%) in the mental well-being domain. Table 4 shows the relationship between visual impairment and quality of life. Visual impairment (visual acuity worse than 6/18) was associated with poor quality of life.
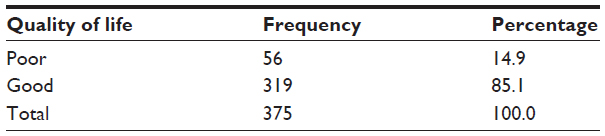 | Table 2 Overall vision-related quality of life of respondents |
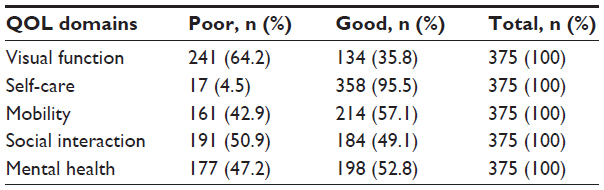 | Table 3 Quality of life of the respondents in five domains (visual function, self-care, social interaction, mobility, and mental status) |
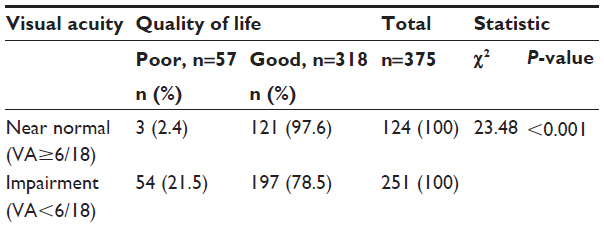 | Table 4 Association between visual acuity and quality of life |
Relationship between visual impairment and quality of life
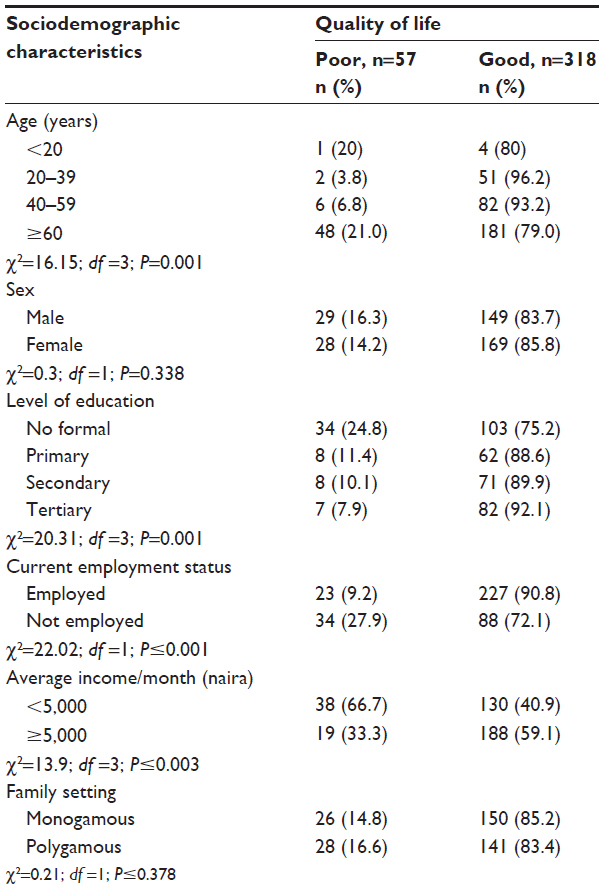
Table 5 shows the results of bivariate analysis for visual impairment and quality of life. A significantly greater number of patients with increasing visual impairment (54, 21.2%) had poor quality of life (χ2=23.48, P<0.001). Forty-one (41.4%) patients who were blind had poor quality of life compared with 13 (8.6%) with low vision and three (2.4%) with near normal vision. Unemployment and blindness were significantly associated with poor quality of life (χ2=22.02, P<0.001, Table 5).
 | Table 5 Relationship between sociodemographic characteristics and quality of life |
On logistic regression, being unemployed increased the likelihood of poor quality of life by 2.9-fold when compared with those who were employed. Similarly, those who were blind were about 24.4 times more likely than those with near normal vision to have poor quality of life. Having an income of less than 5,000 naira per month (about $1 per day) and being elderly (aged over 60 years) were associated with poor quality of life.
Discussion
The common causes of visual impairment in this study were cataract and refractive errors (Figure 1), which is consistent with the findings of previous studies.11,12 Overall quality of life scores were good, which is again in line with previous research on this subject.13,14 Quality of life scores were low for those with severe visual impairment and blindness, which is understandable. However, some patients with poor vision still had high scores, reflecting the fact that visual impairment alone may not explain low quality of life scores.
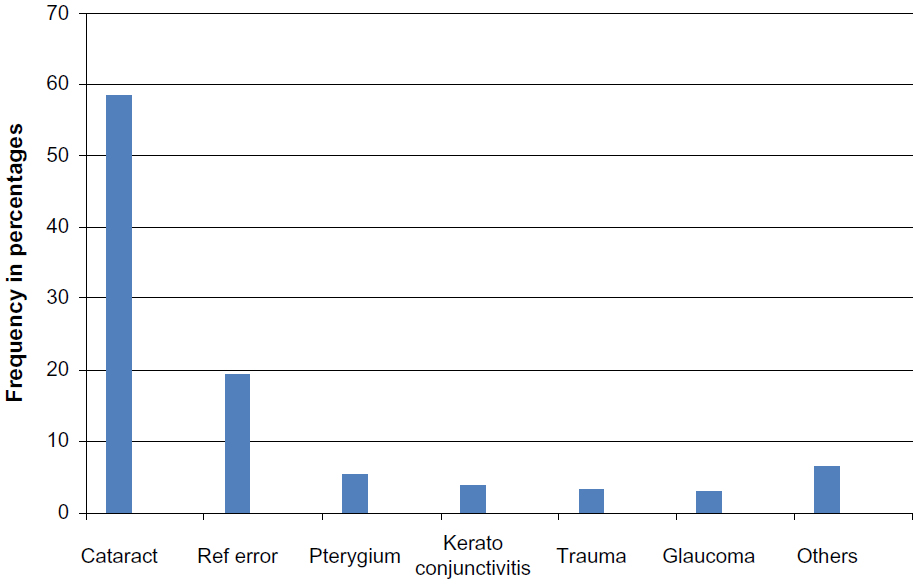 | Figure 1 Causes of visual impairment. |
Visual impairment is indeed a global health burden.3,15,16 Its impact on the social and psychological self is very evident, hence the quality of life of the affected individual. Inequalities in health mirror inequalities in the socioeconomic status of countries globally, and this is reflected in the global distribution of the prevalence of visual impairment.17 The majority of the millions of people affected by visual impairment reside in Asia and sub-Saharan Africa, with causes that are largely preventable and treatable.18,19 Visual impairment is the consequence of a functional loss of vision rather than being an eye disorder in itself.20 It has been estimated that loss of one eye equates to 25% impairment of the visual system and 24% impairment of the whole person, and that total loss of vision in both eyes equates to 100% visual impairment and 85% impairment of the whole person.21
Severe visual impairment (ie, being legally or totally blind) occurs at a rate of 0.06 per 1,000.22,23 Visual impairments have considerable economic impact, even in developed countries,12,19,32 and have been shown to have a negative effect on total health-related quality of life in various studies.24,25
Patients may not be aware of the connection between vision impairment and their other symptoms, or may not think their family physician is the appropriate person to address vision problems.26,27 Age has been found to be a significant factor in relation to visual impairment. The proportion of respondents with visual impairment increased from just a few in the group younger than 20 years to more than two thirds in those aged 60 years and older.
The self-reported quality of life score containing all the domains, ie, visual function, self-care, social interaction, mobility, and mental status, as recorded in the Vision-Related Quality of Life questionnaire, showed overall good quality of life among the respondents. However, quality of life was particularly poor in those with perceived severe visual impairment, and was associated with reduced functioning and social interaction. However, in spite of their handicap, almost all could care for themselves adequately.
More than half of those in the sample reported good quality of life in terms of mental well-being and mobility. Therefore, it is clear that although the respondents may have reported good quality of life overall, their quality of life differed in specific domains. The Proyecto VER study observed that visual acuity impairment, in both better-seeing and worse-seeing eyes, was associated with a decrease in quality of life domains, and the steepness of that decrease was associated with the level of visual impairment.28 A study that evaluated the effect of impaired vision on health-related quality of life in 1,361 elderly Taiwanese subjects reported that impaired vision was associated with significantly lower scores on the physical and social functioning scales.29 This is similar to the results of our study.
Family physicians have an essential role in assessing, identifying, treating, and preventing or delaying vision loss in the elderly.30 With our rapidly aging population, the number of people with visual impairment in the USA and worldwide is expected to increase, placing more demand on the family physician as the primary caregiver. Loss of vision is associated with depression, social isolation, falls, and medication errors.31,32 The vision-related adverse effects of commonly used medications, such as atropine and amitriptyline, should be considered when evaluating vision problems in elderly patients. Van Nispen et al have reported that musculoskeletal conditions, chronic obstructive pulmonary disease/asthma, and stroke predict a relatively rapid decline in health-related quality of life in the visually impaired.33 Adults, especially the elderly should be screened for vision problems every one to two years.34
Acknowledgment
The authors wish to acknowledge the staff and patients of the general outpatient department at University College Hospital, Ibadan, Nigeria, for their support during this study.
Disclosure
The authors report no conflicts of interest in this work.
References
Franke G, Esser J, Reimer J, Maehmer N. The psychological impact of visual impairment. In: Wahl HW, Schulze HE, editors. On the Special Needs of Blind and Low Vision Seniors. Amsterdam, The Netherlands; IOS Press; 2001. | |
Olusanya BA. The Eye and the Workplace. Ibadan, Nigeria: Faculty Lecture Series, University of Ibadan; 2009. | |
Bekibele CO, Gureje O. Impact of self reported visual impairment on quality of life in The Ibadan Study of Ageing. Br J Ophthalmol. 2008;92:612–615. | |
Gunaratne LA. Visual impairment: its effect on cognitive development and behaviour: a review of literature. Available from: http://www.intellectualdisability.info/physical-health/visual-impairment-its-effect-on-cognitive-development-and-behaviour. Accessed February 14, 2014. | |
Groenveld M. Effects of visual disability on behaviour and the family. In: Fielder AR, Best AB, Bax MC, editors. Management of Visual Impairment in Childhood. London, UK: Cambridge University Press; 1993. | |
Groenveld M. The dilemma of assessing the visually impaired child. Dev Med Child Neurol. 1990;32:1105–1109. | |
WHOQOL Group. Measuring quality of life: the development of the WHOQOL instrument. Geneva, Switzerland: World Health Organization; 1993. Available from: http://www.who.int/mental_health/media/68.pdf. Accessed February 14, 2014. | |
Lindholt JS, Ventegodt S, Hanneberg EW. Development and validation of Qol5 for clinical databases. A short, global and generic questionnaire based on an integrated theory of the quality of life. Eur J Surg. 2002;168:107–113. | |
Bone MR. International efforts to measure health capacity. J Epidemiol Community Health. 1992;46:555–558. | |
Ballinger M, Anderson R, Ceilla D, Amonson N. Developing and evaluating cross cultural instruments from minimum requirements to optimal models. Qual Life Res. 1993;2:457–459. | |
Kyari F, Murthy VSG, Selvaraj S, Clare EG, Mohammed MA. Prevalence of blindness and visual impairment in Nigeria: The National Blindness and Visual Impairment Survey. Invest Ophthalmol Vis Sci. 2009;50:2033–2039. | |
Ajayeoba AI, Scott SCO. Risk factors associated with eye disease in Ibadan, Nigeria. Afr J Biomed Res. 2002;5:1–3. | |
Polack S, Kuper H, Mathenge W, Fletcher A, Foster A. Cataract visual impairment and quality of life in a Kenyan population. Br J Ophthalmol. 2007;91:927–932. | |
Lliffe S, Kharicha K, Harari D, Swift C, Gillman G. Self reported visual function in healthy older people in Britain: an exploratory study of associations with age, sex, depression education and income. Fam Pract. 2005;22:585–590. | |
Reddy SC, Tajunisah I, Low KP, Karmila AB. Prevalence of eye diseases and visual impairment in urban population –a study from University of Malaya Medical Centre. Malaysian Family Physician. 2008;3:25–28. | |
Resnikoff S, Pascolini D, Etya’ale D, et al. Global data on visual impairment in the year 2002. Bull World Health Organ. 2004;82:844–851. | |
Dandonna L, Dandonna R. What is the global burden of visual impairment? BMC Med. 2006;4:6–10. | |
The Eye Diseases Prevalence Research Group. Causes and prevalence of visual impairment among adults in the United States. Arch Ophthamol. 2004;122:477–484. | |
Lighthouse International. Prevalence of vision impairment. Available from: http://www.lighthouse.org/research/statistics-on-vision-impairment/prevalence-of-vision-impairment/. Accessed February 14, 2014. | |
National Dissemination Center for Children with Disabilities. Disability Fact Sheet. January 2004; Available from: https://www.margaretkay.com/uploads/Visual_Impairments_Fact_Sheet.pdf. Accessed February 14, 2014. | |
Federal Office of Statistics. Poverty in Nigeria. In: Proceedings of the 1975 Annual Conference and Reflections on the Views from Kuru. Hamburg, Germany: Afrika Spectrum; 1986. | |
World Health Organization. Priority eye diseases. Geneva, Switzerland: World Health Organization. Available from: http://www.who.int/blindness/causes/priority/en/print.html. Accessed February 14, 2014. | |
Badr HE, Mourad H. Assessment of visual disability using WHO Disability Assessment Scale (WHO-DAS-11): role of gender. Br J Ophthalmol. 2009;93:1365–1370. | |
Bryon LL, Sharon LC, David DL. Reported visual impairment and risk of suicide. Arch Ophthamol. 2008;126:975–980. | |
Holden BA, Rao GN, Knox KM. Visual impairment: a correctable global burden. Med J Aust. 1997;167:351–352. | |
Ayanru JO. The ophthamologist: life and sight preservation from cradle to grave. Nigerian Journal of Ophthalmology. 2003;11:3–11. | |
Mba CJ. The health condition of older women in Ghana. A case study of Accra city. Journal of International Women Studies. 2006;8:171–184. Available from: http://vc.bridgew.edu/jiws/vol8/iss1/13/. Accessed February 14, 2014. | |
Broman AT, Munoz B, Rodriguez J, et al. The impact of visual impairment and eye disease on vision-related quality of life in a Mexican-American population: proyecto VER. Invest Ophthalmol Vis Sci. 2002;43:3393–3398. | |
Lin JC, Yu JH. Assessment of quality of life among Taiwanese patients with visual impairment. J Formos Med Assoc. 2012;111(10):572–579. | |
Taiwo OA, Cantley L. Impairment and disability evaluation: the role of the family physician. Am Fam Physician. 2008;77:689–694. | |
Nutheti R, Shamanna BR, Nirmalan PK, et al. Impact of impaired vision and eye disease on quality of life in Andhra Pradesh. Invest Ophthalmol Vis Sci. 2006;47:4742–4748. | |
Albert SM, Logdson RG. Assessing quality of life in Alzheimer’s disease: conceptual and methodological issues. J Ment Health Aging. 1999;5:3–6. | |
van Nispen RM, de Boer MR, Hoeijmakers JG, Ringens PJ, van Rens GH. Co-morbidity and visual acuity are risk factors for health-related QOL decline; five month follow up EQ-5D data of visually impaired older patients. Health Qual Life Outcomes. 2009;7:18. | |
Taylor HR. Fred Hollows lecture. Eye Care for the Community. Clin Experiment Ophthalmol. 2002;30:151–154. |
 © 2014 The Author(s). This work is published and licensed by Dove Medical Press Limited. The full terms of this license are available at https://www.dovepress.com/terms.php and incorporate the Creative Commons Attribution - Non Commercial (unported, v3.0) License.
By accessing the work you hereby accept the Terms. Non-commercial uses of the work are permitted without any further permission from Dove Medical Press Limited, provided the work is properly attributed. For permission for commercial use of this work, please see paragraphs 4.2 and 5 of our Terms.
© 2014 The Author(s). This work is published and licensed by Dove Medical Press Limited. The full terms of this license are available at https://www.dovepress.com/terms.php and incorporate the Creative Commons Attribution - Non Commercial (unported, v3.0) License.
By accessing the work you hereby accept the Terms. Non-commercial uses of the work are permitted without any further permission from Dove Medical Press Limited, provided the work is properly attributed. For permission for commercial use of this work, please see paragraphs 4.2 and 5 of our Terms.