")
Back to Journals » International Journal of Nanomedicine » Volume 15
Quality Assessment and Comparison of Plasma-Derived Extracellular Vesicles Separated by Three Commercial Kits for Prostate Cancer Diagnosis
Authors Pang B , Zhu Y , Ni J, Ruan J , Thompson J, Malouf D, Bucci J, Graham P , Li Y
Received 22 September 2020
Accepted for publication 7 November 2020
Published 15 December 2020 Volume 2020:15 Pages 10241—10256
DOI https://doi.org/10.2147/IJN.S283106
Checked for plagiarism Yes
Review by Single anonymous peer review
Peer reviewer comments 2
Editor who approved publication: Dr Thomas Webster
Supplementary video of "Plasma-derived EVs isolated by three commercial kits for PCa" [ID 283106].
Views: 111
Bairen Pang,1,2 Ying Zhu,1– 3 Jie Ni,1,2 Juanfang Ruan,4,5 James Thompson,1,6,7 David Malouf,2,6 Joseph Bucci,1,2 Peter Graham,1,2 Yong Li1,2,8
1St George and Sutherland Clinical School, UNSW Sydney, NSW 2052, Australia; 2Cancer Care Centre, St. George Hospital, Sydney, NSW 2217, Australia; 3School of Biomedical Engineering, University of Technology Sydney, NSW 2007, Australia; 4Electron Microscope Unit, UNSW Sydney, NSW 2052, Australia; 5School of Biotechnology and Biomolecular Sciences, UNSW Sydney, NSW 2052, Australia; 6Department of Urology, St George Hospital, Sydney, NSW 2217, Australia; 7Garvan Institute of Medical Research/APCRC, Sydney, UNSW 2010, Australia; 8School of Basic Medical Sciences, Zhengzhou University, Henan 450001, People’s Republic of China
Correspondence: Ying Zhu; Yong Li
Research and Education Centre, St George Hospital, 4– 10 South St, Kogarah, NSW 2217, Australia
Email [email protected]; [email protected]
Introduction: Current standard biomarkers in clinic are not specific enough for prostate cancer (PCa) diagnosis. Extracellular vesicles (EVs) are nano-scale vesicles released by most mammalian cells. EVs are promising biomarker source for PCa liquid biopsy due to its minimal invasive approach, rich information and improved accuracy compared to the clinical standard prostate-specific antigen (PSA). However, current EV separation methods cannot separate pure EVs and the quality characteristics from these methods remain largely unknown. In this study, we evaluated the quality characteristics of human plasma-derived EVs by comparing three clinical suitable separation kits.
Methods: We combined EV separation by commercial kits with magnetic beads capture and flow cytometry analysis, and compared three kits including ExoQuick Ultra based on precipitation and qEV35 and qEV70 based on size exclusion chromatography (SEC).
Results: Our results indicated that two SEC kits provided higher EV purity and lower protein contamination compared to ExoQuick Ultra precipitation and that qEV35 demonstrated a higher EV yield but lower EV purity compared to qEV70. Particle number correlated very well particularly with CD9/81/63 positive EVs for all three kits, which confirms that particle number can be used as the estimate for EV amount. At last, we found that several EV metrics including total EVs and PSA-specific EVs could not differentiate PCa patients from health controls.
Conclusion: We provided a systematic workflow for the comparison of three separation kits as well as a general analysis process in clinical laboratories for EV-based cancer diagnosis. Better EV-associated cancer biomarkers need to be explored in the future study with a larger cohort.
Keywords: extracellular vesicles, prostate cancer, lipoprotein, separation, protein biomarker, immunomagnetic beads
Introduction
Prostate cancer (PCa) is the most common solid-organ cancer and the second cause of cancer death in men, counting 1,276,106 new cases and causing 358,989 deaths in 2018 worldwide.1 The current diagnostic standard to confirm or exclude PCa is a 12–30 core template-guided needle biopsy of the prostate gland. This is an invasive procedure associated with risks including pain, complications of general anaesthesia, bleeding, psychological distress and post-biopsy infections.2,3 Prostate-specific antigen (PSA) is the current clinical standard for PCa screening and treatment monitoring, as many PCa cases are detected based on the elevated PSA level (>4 ng/mL) in the serum. However, a rise of PSA is also found in men with benign prostatic hyperplasia. Over-diagnosis and over-treatment of PCa due to the high false positive of PSA have become an awareness to the clinicians.4 Thus, finding novel biomarkers with higher specificity to complement or even replace serum PSA has attracted clinicians and researchers’ attention.
Extracellular vesicles (EVs) have shown their increasing promise as the next generation of biomarkers for PCa diagnosis and management.5–7 EVs consist of a heterogeneous population of lipid bilayer-encapsulated nanovesicles released by most mammalian cells. EVs are circulating within body fluids such as urine, blood, cerebrospinal fluid and saliva. Thus, EVs separated from cancer patients’ biological fluids are able to capture the entire heterogeneity of cancer and reflect the tumour change in real-time.8 The information cargos, including RNA, lipids, proteins and metabolites, carried by EVs are highly correlated to the status of EV parental cells.9–11 Therefore, tumour-derived EVs carry important biological information about the tumour and become promising biomarkers for personalised cancer diagnosis, prognosis and treatment monitoring.12,13
As a major resource of EVs, blood is of the most interest due to its great accessibility to clinicians, accurate reflection of the circulation status, and easy implementation for clinical analysis.14,15 Compared to serum, plasma is a more native sample to represent the real circulatory system as it avoids additional EV released from platelet during the clotting process associated with serum.14,16 However, plasma is a very challenging sample to work with. Substantial evidence shows the presence of a high degree of contaminants in vesicle isolates including non-EV proteins and lipoproteins regardless of the separation method used.17–19 It has been shown that lipoproteins are co-separated with EVs from plasma with several orders higher magnitude.20 Therefore, it is essential to evaluate the EV quality thoroughly when investigating a separation method before moving towards the actual clinical application.
Currently, differential ultracentrifugation (UC) is considered as a standard method for EV separation.21 However, UC is not suitable for clinical use as it is time-consuming, labour intensive, requiring special and expensive instrument.22–24 In particular, the EV yield from UC has shown to be very low, which cannot be used in some downstream analysis with limited sensitivity.21,24 To address the challenges for routine EV separation, numerous techniques have been developed. Among a variety of separation methods, size-exclusion chromatography (SEC) has been widely explored considering its relatively simple workflow, shorter operation time, and a good balance between the EV yield and purity.25 Polymer precipitation is another convenient method aiming towards maximising EV yield, but it usually introduces high levels of contaminations when using complex sample sources such as plasma.16 Whilst polymer precipitation combined with extra purification may be a good option to improve purity.
Numerous studies compared different EV separation methods and the International Society for EVs (ISEV) has established several guidelines for the standardisation of EV separation and quality assessment.26–28 However, only a few of these comparison works used actual cancer patient plasma samples with a thorough EV quality assessment in the scenario of clinical cancer diagnosis.29,30 In this study, we established a quantitative quality assessment using several separation kits suitable for clinical use that we are particularly interested in: ExoQuick® ULTRA (ExoQuick Ultra) which combines precipitation and resin purification and qEV/35nm (qEV35) and qEV/70nm (qEV70) as SEC-based method. The whole workflow is shown in the flow chart in Figure 1. We aim to provide a systematic guideline for the quality assessment and comparison of the separation methods based on several key parameters: EV yield, EV purity, lipoprotein contamination and protein contamination. The quantitative assessment of these parameters was carried out using immunomagnetic beads capturing following by flow cytometry analysis. We further showed that particle number is an appropriate estimate for EV amount in plasma, as it has good correlations with EV yields for all three kits. At last, we assessed the capability of several EV metrics including total EVs and PSA-specific EVs for differentiating PCa patients from healthy donors. From these findings, we hope to provide a systematic workflow and our insights for EV-based separation and analysis in the clinical setting, particularly for cancer diagnosis.
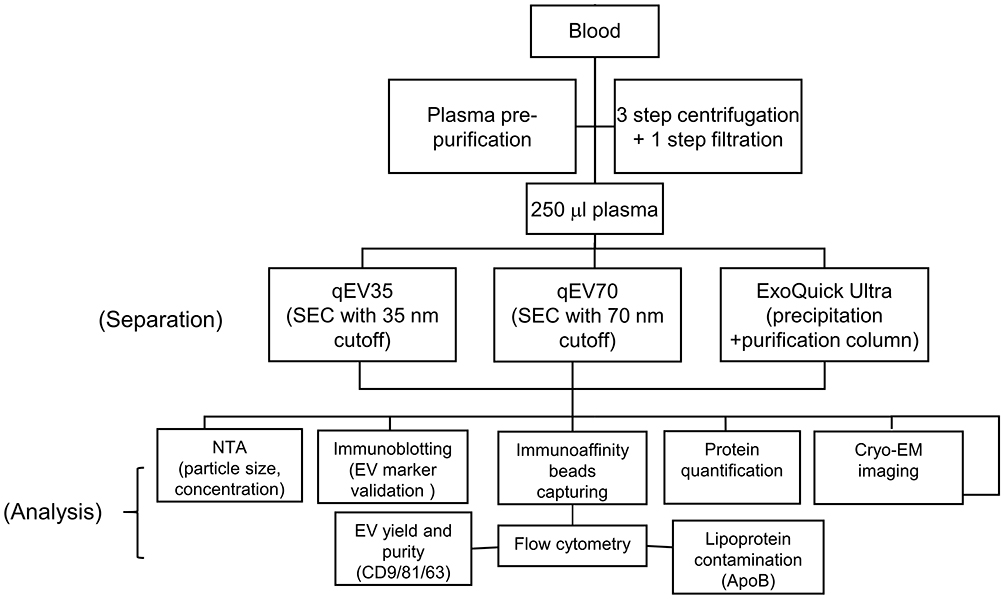 |
Figure 1 Flow chart of the whole workflow of EV separation and analysis. |
Materials and Methods
Clinical Samples
A total of 12 non-fasting individuals were enrolled in the study. Patients with localised PCa (n=6) were recruited from Hurstville Private Hospital (Sydney, NSW, Australia) according to South Eastern Sydney Local Health District Human Research Ethics Committee protocol with informed consent (HREC ref no: 12/131). Pathological information of PCa patients including serum PSA, risk group, Gleason score and tumour stage was obtained from Douglass Hanly Moir pathology lab (Macquarie Park, NSW, Australia). Age-/gender-matched healthy volunteers (n=6) were recruited from Australian Red Cross Blood Service (Agreement no: 18–07NSW-04, UNSW HC no: 180390). Peripheral blood was drawn into K2EDTA tubes (BD bioscience, San Jose, CA, USA). The blood was processed within 2 hours of blood collection. Plasma was extracted after the first centrifugation of the blood at 3000 rpm for 15 min at 4 °C. The plasma was immediately transferred into a clean tube without disturbing the buffy coat and followed by serial pre-purification steps at 4 °C as follows: Plasma was spun at 2000 × g for 20 min and the supernatant was centrifuged at 10,000 × g for 20 min to remove cells and debris. The supernatant was then filtered through 0.22 µm pore Ultrafree centrifugal filter (Merck KGaA, Darmstadt, Hesse, Germany) at 12,000 × g for 2 min. Aliquots of the purified plasma samples were stored at −80 ֯C and freeze-thawing was limited within two cycles for each sample.
Separation of EVs from Plasma
EVs from plasma from the same participant were separated by three kits for comparison (Figure 1): ExoQuick® ULTRA (System Biosciences, Palo Alto, CA, USA), qEV35 and qEV70 (IZON Science, Christchurch, Canterbury, New Zealand). EVs from 250 μL pre-purified plasma were separated according to the manufacture’s protocols. For qEV35 and qEV70 SEC columns, the purified plasma aliquot was loaded on the SEC column, and the 7–9 fraction (a total of 1.5 mL) sample was collected in the recommended EV elusion zone for consistent results and highest purity. Strategies for characterising different SEC fractions were provided in previous publications.24,31 Therefore, we followed the manufacturer's protocol in this study. A post-enrichment step to obtain a higher EV concentration was performed using Amicon® Ultra-4 10 KDa unit (Merck KGaA, Darmstadt, Hesse, Germany). For ExoQuick ULTRA, plasma samples were incubated with ExoQuick reagent for 30 min at 4 °C followed by a 10 min centrifugation at 3000 × g. Pellets were collected and resuspended in 200 μL Buffer B of ExoQuick Ultra. Another 200 μL Buffer A was added to resuspended EVs. The entire content was loaded to a pre-cleaned resin column with another 100 μL Buffer B added previously. After mixing, purified EVs were collected by centrifugation at 1000 × g for 2 min. All separated EVs were aliquoted and stored at −80 °C. EV samples are used within two freeze-thawing cycles for the following analysis.
Nanoparticle Tracking Analysis (NTA)
NTA was performed on NanoSight LM14 system (NanoSight Technology, Malvern, Worcestershire, UK) equipped with a 532 nm green laser for determining the EV concentration and size distribution. Briefly, 10 μL separated EV samples were diluted with freshly 0.22 μm filtered PBS and loaded into the detection chamber by syringe. The same settings were used: camera level: 11, detect threshold: 14, capture: 60 s, number of capture: 5, temperature: 25 °C. The data were processed by NTA software (NTA version 3.3; Malvern Instruments, Malvern, Worcestershire, UK). A series of known numbers of 100 nm silica microspheres (Polysciences, Inc, catalog No: 24,041–10, Warrington, PA, USA) were used for the calibration of our measurement before using any EV samples. EV isolates from three kits were diluted to the optimum NTA detection range (1–10 × 108 particles/mL) before measurement.32,33 The same Nanosight parameters were used for all samples for a consistent comparison. The original particle concentrations from the isolates were then calculated based on the measured concentrations and the dilution factor.
Protein Quantification Assay
Qubit protein assay kit (Life Technologies, catalog No. Q33211, Carlsbad, CA, USA) with the Qubit fluorometer was used for protein content quantification. The assay was performed according to the manufacture’s instruction. Briefly, 1–20 µL isolates were mixed with Qubit working solution to a final reaction volume of 200 µL. The reaction was incubated at room temperature for 15 min. Samples were read on a Qubit fluorometer after the calibration, which was done by the fluorometer automatically with three Qubit standards.
EV Antibody Array
The immunoblotting analyses of EV-specific markers were performed to validate the separated EVs using a commercial Exo-Check™ Exosome Antibody Array (Neuro) Mini (System Biosciences, Palo Alto, CA, USA). The same amount of EV preparations (12.5 μg) was added to the membrane-based blot array and the manufacturer’s instruction was followed. Briefly, EV sample was lysed by lysis buffer and labelled by the labelling reagent. The labelled EV sample was then washed through the column and blocked by 5 mL blocking buffer with mixing. An EV array membrane was incubated with 5 mL labelled EV lysate/blocking buffer mixture at 4 °C overnight with shaking. Membrane was washed with wash buffer and incubated with detection buffer in the next day followed by developing and imaging.
Conjugation of Streptavidin Magnetic Beads with Biotinylated ApoB
Anti-ApoB conjugated magnetic beads were used to specifically capture lipoproteins in the EV isolates.20 ApoB antibody (Abcam, catalog No. ab20898, biotinylated, Melbourne, VIC, Australia) was added to 1× PBS with 0.1% Tween 20 (1× PBST) to a final concentration of 20 μg/mL. 0.2 mL of streptavidin magnetic beads (4.5 μm, 1.0 × 10⁷/mL, ThermoFisher Scientific, catalog No. 10608D, Waltham, MA, USA) were washed with 1× PBST. 0.2 mL biotinylated ApoB antibody was incubated with the beads for 2 hr at 4 °C. The conjugated beads were washed with 1× PBST followed by a wash of 1× PBS with 2% BSA and stored in 0.2 mL of 1× PBS with 2% BSA at 4 °C.
Immunomagnetic Beads Capturing
Immunomagnetic beads capturing was applied to exploit EV quality based on the commonly used EV surface markers and lipoprotein contamination based on ApoB marker. The same particle numbers of EV samples measured by NTA were incubated with antibody-conjugated magnetic beads for the specific capturing in 200 µL PBS with 2% BSA overnight at 4 °C. A mixed capturing beads were used with the same beads numbers: 10 µL anti-CD9 magnetic beads (2.7 μm, 1.0 × 10⁷/mL, ThermoFisher Scientific, catalog No. 10620D, Waltham, MA, USA), anti-CD81 magnetic beads (2.7 μm, 1.0 × 10⁷/mL, ThermoFisher Scientific, catalog No. 10622D, Waltham, MA, USA) and customised ApoB magnetic beads (based on 4.5 μm streptavidin magnetic beads mentioned previously). The EV-captured beads were washed twice with PBS with 2% BSA. All the beads separation steps were performed on a MagJET separation rack (Thermo Fisher Scientific, Waltham, MA, USA).
Flow Cytometry Analysis of Beads Captured EV
After binding, EVs captured by magnetic beads were stained with respective detection antibody for flow cytometry analysis. The following antibodies were used: a mixture of APC-conjugated anti-CD9 (Thermo Fisher Scientific, catalog No. A15698, Waltham, MA, USA), anti-CD81 (Biolegend, catalog No. 349,510, San Diego, CA, USA) and anti-CD63 (Thermo Fisher Scientific, catalog No. A15712, Waltham, MA, USA) for a hybridised EV detection; Alexa Fluor 405-conjugated anti-PSA (Novus Biologicals, catalog No. NBP2-34549AF405, Littleton, CO, USA); FITC-conjugated anti-Apolipoprotein B (Abcam, catalog No. ab27637, Melbourne, VIC, Australia) for the detection of lipoprotein; The following isotype controls were used during the flow cytometry: APC-conjugated anti-Mouse IgG1 (Thermo Fisher Scientific, catalog No. MA518093, Waltham, MA, USA); Alexa Fluor 405-conjugated anti-Mouse IgG1 (R&D Systems, catalog No. IC002V, Minneapolis, MN, USA); FITC-conjugated anti-Goat IgG (Abcam, catalog No. ab37374, Melbourne, VIC, Australia). The detection antibodies were incubated with EV-captured beads at 4 °C in dark for 30 min. After staining, the beads were washed twice with 100 µL PBS with 2% BSA to remove residue stains in the solution. 500 µL PBS was added to the bead pellets for the analysis on FACS Canto II (Becton Dickinson, Franklin Lakes, NJ, USA) flow cytometry and the data were processed and analysed by FlowJo software (Version 10). By gating different groups in the scattering plot of flow cytometry data and using different fluorescence stains, we can analyse EVs and lipoproteins simultaneously (Figure S1a). We used the ratio between the geometric mean of fluorescence intensity (gMFI) from each marker and that from IgG isotype control to quantify each marker level (Figure S1b-d): Relative fluorescence intensity (RFI) = gMFI of detection Ab/gMFI of IgG isotype control.
Cryogenic Electron Microscopy (Cryo-EM)
Cryo-EM was used to determine the morphologies of EV samples. 4 μL EV isolates were applied to glow-discharged copper grids (Quantifoil R2/2, Quantifoil Micro Tools). The grids were blotted for 3 s at 4 °C with 90% humidity and plunged into liquid ethane using a Lecia EM GP device (Leica Microsystem, Wetzlar, Hesse, Germany). The vitrified samples were stored in liquid nitrogen (−196 °C) prior to cryo-TEM analysis. Cryo-EM data were collected on a Thermo Fisher Talos Arctica transmission electron microscope operated at 200 kV acceleration voltage. Images were recorded on a Falcon III detector (Thermo Fisher Scientific, Waltham, MA, USA).
Statistical Analysis
One-way ANOVA with post hoc multiple comparison correction was used to determine statistically significant differences among separation method groups and two-tail t-test was used between PCa patients and healthy controls. All analyses were performed with GraphPad Prism 7 (Graph Pad Software, San Diego, CA, USA). Data are plotted as mean ± SD. Statistical significance was indicated as follows: *P < 0.05, **P < 0.01, ***P < 0.001, ****P < 0.0001.
EV-TRACK
The relevant data was submitted to the EV-TRACK knowledgebase (EV-TRACK ID: EV200020), as suggested by a previous guideline.34
Results
We used the same volume of 250 μL plasma from the same participant for all the three separation kits in each separation. This pair-to-pair comparison from the same participant and repeated separation processing makes our comparisons more convincing and accurate. The comparison results among three different kits were from both PCa patients (n=6) and healthy donors (n=6).
Particle Size Distribution and Concentration
Nanoparticle tracking analysis (NTA) is the most widely used instrument for characterising the particle size and concentration of EV samples.32,33 Before using the EV samples, we used silica microspheres, which have a refractive index close to EVs for the calibration of our measurement as suggested by a previous report.33 Our analysis results showed a narrow particle size distribution and a good linear relationship between the theoretical and known particle concentrations (Figure S2). The calibration process confirms the reliability of our NTA measurements.
Detailed information for particle size distributions and related analysis is shown in Figure 2A–C. Each curve in Figure 2A was from an average of 12 samples including PCa patients and healthy controls (HC). The results indicate that the particle size distributions between qEV35 and qEV70 were similar in the range <130 nm, while qEV70 started to collect a larger portion of particles >130 nm compared to qEV35. Compared to the two SEC kits, the histogram from ExoQuick Ultra had an obvious peak shift to the larger size range, which indicates that it collected a greater portion of larger particle size composition or formed more aggregations during precipitation. The detailed size distributions are shown in Figure 2B by fractionating particles into 4 size ranges: <100 nm, 100–150 nm, 150–200 nm and >200 nm. The results suggest that the particles from 100–150 nm had the largest portion for all three kits and qEV35 collected the highest portion of particles in the <100 nm range. This is under expectation as qEV35 uses a smaller pore size as the cutoff so more smaller particles can be collected compared to qEV70.
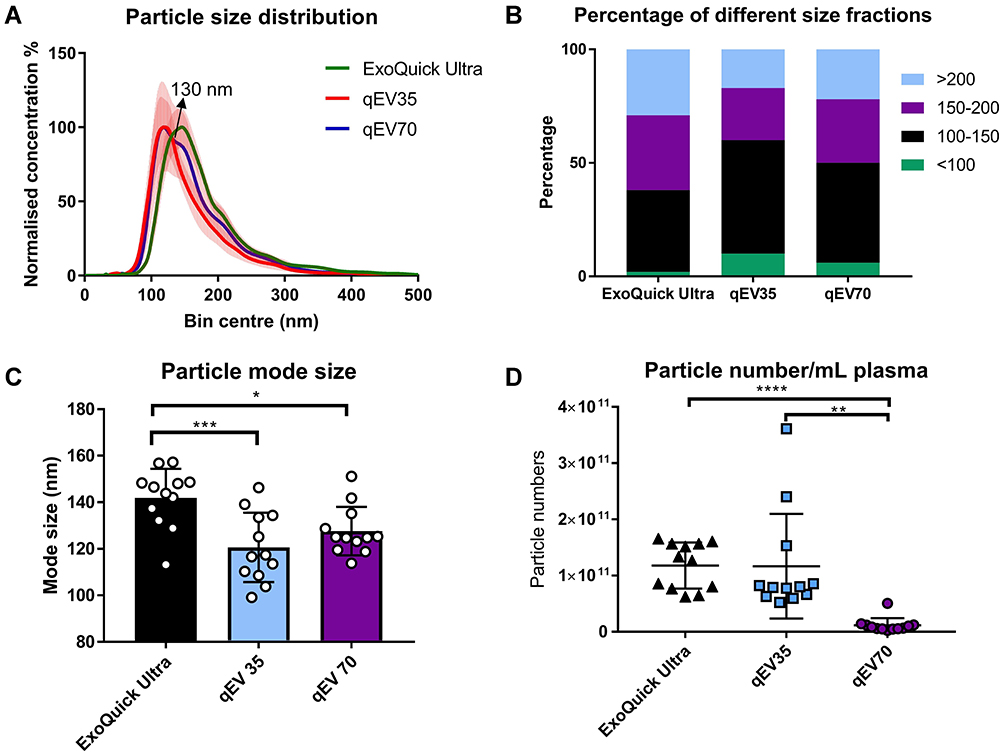 |
Figure 2 Particle size distribution and concentration of samples separated using three kits from both PCa patients (n=6) and HC (n=6). (A) Particle size distributions between qEV35 and qEV70 were similar in the range <130 nm, while qEV70 started to collect a larger portion of particles >130 nm. ExoQuick Ultra has an obvious peak shift to the larger size range. The histograms are presented as the average from 12 samples (solid curves) with standard error (vertical red error bar); (B) Percentage of total particles falls into 4 different size fractions: <100 nm, 100–150 nm, 150–200 nm, >200 nm. Particles from 100–150 nm have the largest portion for all three kits. qEV35 collected the highest portion of particles in the ≤ 100nm range. (C) Particle mode sizes: Exoquick Ultra 141.9 ± 12.5 nm, qEV35 120.6 ± 14.9 nm, and qEV70 127.7 ± 10.4 nm. The mode size from ExoQuick Ultra samples was significantly larger than those from the two SEC kits. No significant difference was found between qEV35 and qEV70 kits. (D) Particle concentrations calculated into per mL plasma. The number of particles was significantly lower (10 orders of magnitude lower) in qEV70 compared to qEV35 and ExoQuick Ultra. No significant difference between ExoQuick Ultra and qEV70. *P < 0.05, **P < 0.01, ***P < 0.001, ****P < 0.0001. One-way ANOVA with post hoc multiple comparison correction was used for c-d. |
It is noteworthy that there are still some particles >200 nm for all methods even though we used a 0.22 μm filter to filtrate the plasma before separation. The modal particle sizes for each method are presented in Figure 2C, with Exoquick Ultra 141.9 ± 12.5 nm, qEV35 120.6 ± 14.9 nm, and qEV70 127.7 ± 10.4 nm, respectively. The mode size from ExoQuick Ultra samples was significantly larger than those from the two SEC kits but there is no significant difference between qEV35 and qEV70 (One-way ANOVA). The particle concentrations in the original EV isolates are shown in Figure 2D. Obviously, the number of particles was significantly lower (10 orders of magnitude lower) in qEV70 compared to qEV35 and ExoQuick Ultra, and no significant difference was observed between qEV35 and ExoQuick Ultra (One-way ANOVA). As NTA is a non-specific method for all particles, it cannot distinguish EVs from similar size particles such as lipoprotein and protein aggregates.19 Therefore, we performed a more specific beads-based flow cytometry analysis to confirm if the higher particle numbers from qEV 35 and ExoQuick Ultra are associated with more EVs, which will be presented later in the paper.
EV Validation Using Immunoblotting and Cryo-EM
The ISEV suggested using different characterisation techniques to validate the EV presence such as common EV biomarkers and morphological structures using electron microscopy.26,27 To obtain a profile of EV protein content, a commercial protein array (Exo-Check™ Exosome Antibody Array) was used to determine the presence of commonly used EV markers CD81 and TSG101 and a negative marker calnexin (CANX) which should not be present in EVs of endosomal origin. The advantage of this array compared to standard Western blotting (WB) is that the results from different markers can be obtained in one membrane, which eliminates the errors introduced by operation variations between different membranes in standard WB. As shown in Figure 3, all three kits showed a positive signal in CD81 and TSG101. While qEV35 sample showed a slightly positive signal in CANX, samples from qEV70 and ExoQuick Ultra are negative to CANX. This negligible/slight CANX level indicates the absent or under-represented larger EV subtypes associated with compartments other than plasma membrane/endosomes under the secretory pathway.
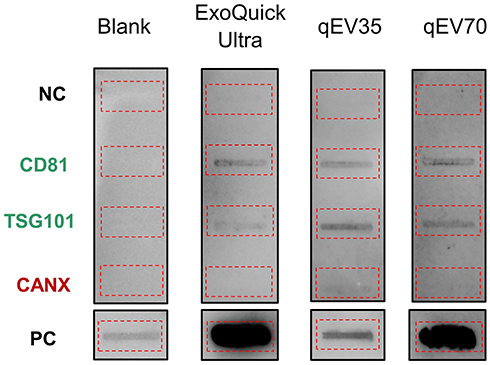 |
Figure 3 Representatives of immunoaffinity blotting for typical EV marker expression (12.5 μg protein loading). The EV samples from PCa patients showed the presence of CD81, TSG101 markers and absence of Calnexin (CANX) marker. Blank: assay running with PBS instead of sample. The red dotted boxes highlighted the location of individual blots. Abbreviations: PC, positive control; NC, negative control |
In addition, we also used cryo-EM to observe the morphologies of the EV isolates. Compared to conventional transmission EM which shows a “cup-shaped” structure, cryo-EM is more suitable for EVs as it maintains the original shape of EVs and allows a clear observation of the lipid bilayer structure. Importantly, cryo-EM allows the differentiation between EVs and other contaminations especially lipoproteins, as lipoproteins are shown as electron-dense particles without lipid bilayer.18 This feature is especially useful to inspect EV samples from plasma in which lipoproteins are the major contamination. We presented several representative cryo-EM images from isolates of the same PCa patient using the three kits (Figure 4). All the images confirmed the presence of EVs, which have clear bilayer structures (yellow and red arrows). Interestingly, EVs separated from plasma are highly heterogeneous in morphology from all three kits, including single vesicle (in Figure 4A, D, G), double vesicles (in Figure 4A and H), multilayer vesicles (in Figure 4B and E) and incomplete vesicles with partial bilayer (in Figure 4I). The multilayer-vesicle structure in Figure 4B (red arrow) was confirmed using 3D cryo-EM to exclude the possibility of overlapped EVs (Supplementary Video). This result of heterogeneous EV structures is consistent with previous studies that used cryo-EM to inspect EVs from both plasma and cerebrospinal fluid.18,35 In the background of Figure 4C–I, there are a large number of smaller dense particles without bilayer (white arrows). Similar structures were observed in the previous study by Yuana et al, which can be classified as very low-density lipoproteins (VLDL) and low-density lipoprotein (LDL) judging from their sizes.19 The presence of VLDL and LDL is consistent with previous reports which showed that SEC could only remove the small and most abundant high-density lipoprotein (HDL).20,30
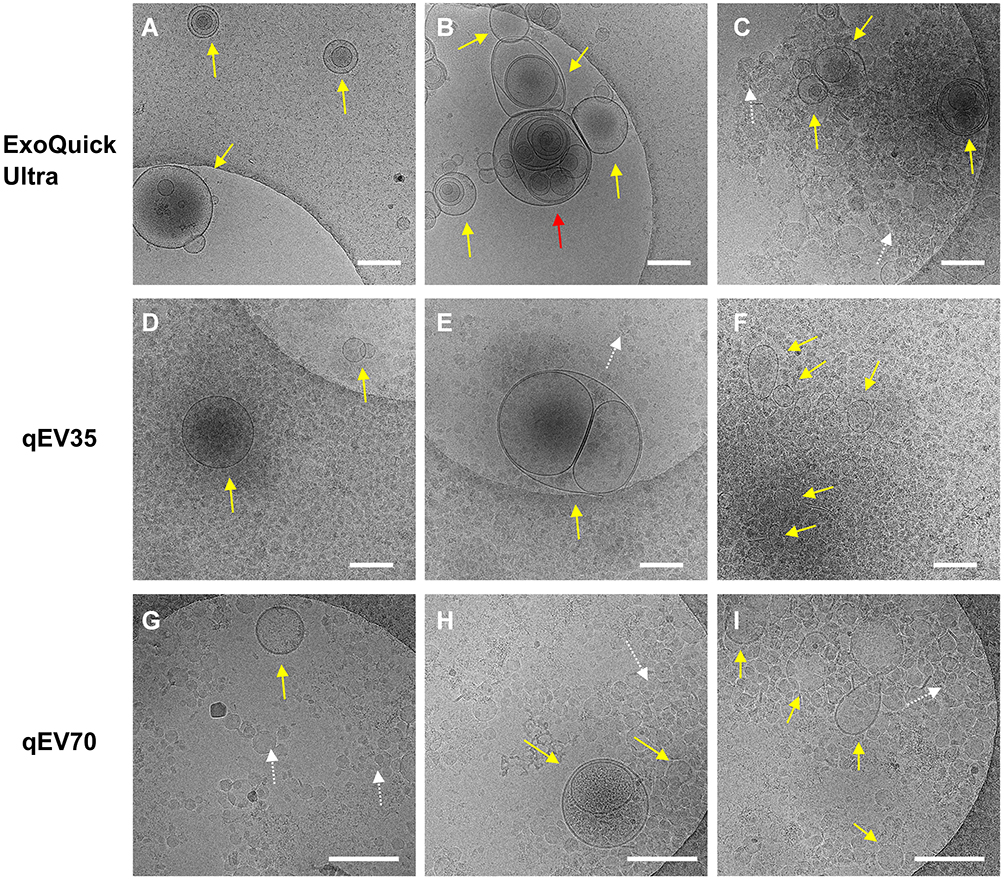 |
Figure 4 Representative Cryo-EM images showing different EV structures from the same PCa patient using the three kits. Samples from all three kits contain EVs (yellow and red arrows) with heterogenous structures such as single vesicles (A, D, G), double vesicles (A and H), multilayer vesicles (B and E) and incomplete vesicles (I). There are large numbers of electron-dense particles in the background (C–I) which are assumed to be lipoproteins in the background for samples from all three kits (white arrows). Scale bar: 200 nm. The multilayer-vesicle structure in (B) pointed by red arrow was characterised by 3D cryo-EM to exclude the possibility of overlapped EVs (Supplementary Video). |
Quality Assessment Using Immunomagnetic Microbeads Followed by Flow Cytometry
To assess the EV quality from the three separation kits, we employed magnetic microbeads to specifically capture targeted analytes based on immunoaffinity-binding, followed by a conventional flow cytometry analysis. We used a mixture of beads with two distinguished sizes: 2.7 μm beads with anti-CD9/CD81 to capture EVs and 4.5 μm beads with anti-ApoB to capture lipoproteins, so that EVs and lipoproteins can be interrogated simultaneously. We used a hybridised fluorescence detection with three commonly used EV markers (CD63, CD81 and CD9) to provide an overall EV quantification. The same number of particles measured by NTA was used as the loading dosage in bead incubation for a quantitative comparison between three kits. We used several key metrics based on the relative fluorescence intensity (RFI) from the detection markers to assess the separation quality of three kits: EV yield (CD63/9/81 level in the same plasma volume), EV purity (the ratio between EV yield and protein amount), lipoprotein contamination (ApoB level in the same plasma volume) and protein contamination (the protein amount in the same plasma volume). Details for flow cytometry quantification are discussed in the method section. All comparisons between the three kits were performed by one-way ANOVA with post hoc multiple comparisons.
The schematic of the immunomagnetic beads capture is shown in Figure 5A. The successful immunoaffinity binding between beads and EVs can be confirmed by our previous data using EVs separated from a pancreatic cancer cell line (PANC1). The scanning electron microscopy images in the right images in Figure 5A show that the surface of the bead coated with anti-CD9 (top image) was covered with brighter, small particulate structures which were the captured EVs, while the control IgG coated bead (bottom image) had negligible binding after incubation with EVs.
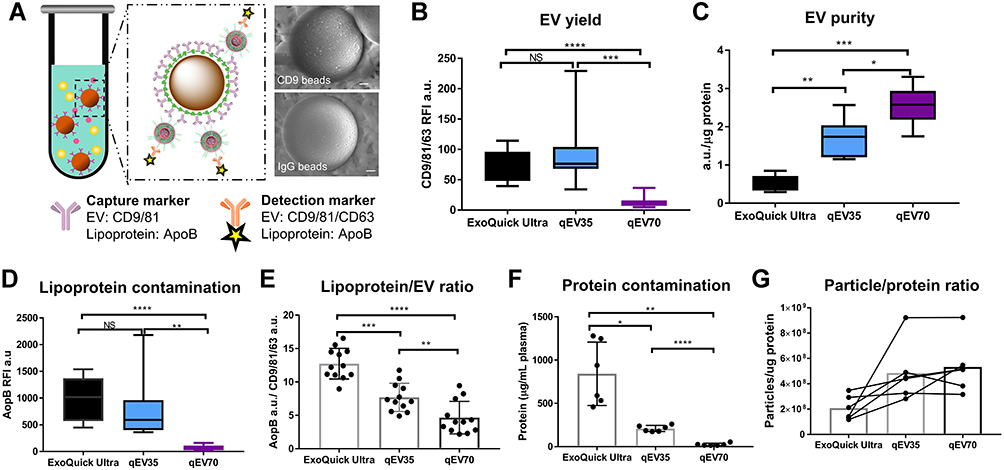 |
Figure 5 EV quality assessment from both PCa patients and HC samples from three different kits. (A) Schematic diagram of EVs capturing by immunomagnetic beads. Right: Scanning electron microscopy images of the EV binding on CD9 bead and negligible non-specific binding on IgG control bead. Scale bar: 500 nm. (B) Significant higher CD9/81/63 signals were detected in samples from qEV35 and ExoQuick Ultra compared to qEV70, suggesting a significantly higher EV yield. The EV yields from qEV35 and ExoQuick Ultra have no significant difference. (C) qEV70 provides a higher EV purity than the other two kits, while ExoQuick Ultra provided the lowest EV purity. (D and E) qEV70 provides the lowest lipoprotein contamination and Lipoprotein/EV ratio. (F) Protein contamination from ExoQuick Ultra is 4 times of that from qEV35 and 33 times of that from qEV70. (G) Particle/protein ratio shows ExoQuick Ultra provides the lowest purity. Sample number: n=12 for (B, D, E) (from 6 patients and 6 HC); n=6 for (C, F, G) (from 3 patients and 3 HC). *P < 0.05, **P < 0.01, ***P < 0.001, ****P < 0.0001. One-way ANOVA with post hoc multiple comparison correction was used for (B–F). |
EV quality. Figure 5B shows the EV yields from the same volume of 250 μL plasma. Significant higher CD9/81/63 signals were detected in samples from qEV35 and ExoQuick Ultra compared to qEV70, suggesting a significantly higher EV yield. The EV yields from qEV35 and ExoQuick Ultra have no significant difference, while the variation among different samples is quite large for qEV35. In contrast, the EV purity from qEV70 is higher than the other two kits, judging from its higher ratio between EV yield and the protein contamination as shown in Figure 5C. ExoQuick Ultra provided the lowest EV purity, which indicates the purification column accompanied by the precipitation kit could not improve the purity effectively compared with the SEC kits. We also employed the widely used particle number/protein ratio to evaluate the EV purity (Figure 5G), in which a higher ratio indicates a higher purity.36 The results are consistent with Figure 5C when using specific EV RFI in terms of ExoQuick Ultra providing the lowest purity compared to the two SEC kits.
Lipoprotein contamination. EVs significantly overlap with VLDL and chylomicrons in particle size and with HDL in particle density.19 Therefore, it is almost impossible to remove lipoproteins from EVs when using plasma sample. The amount of lipoproteins is several orders of magnitude higher than EVs,19 so it is very important to assess the lipoprotein contamination when using any separation methods. ApoB was chosen as a general biomarker to evaluate the lipoprotein contamination as previous work showed that LDL is predominant in the lipoprotein particles co-separated with EVs and that commercial anti-ApoB antibody can recognise apoB48 variant for chylomicrons and apoB100 variant for VLDL/LDL.19,20 Our results show that qEV70 provides the lowest lipoprotein contamination (obtained from the ApoB RFI) among all three separation kits (Figure 5D). When comparing the relative ratios between lipoproteins and EVs, qEV70 is also the lowest among the three kits (Figure 5E), which indicates qEV70 can provide the largest EVs portion relative to lipoproteins. These results indicate that even though SEC has been reported with the capability to remove the majority of HDL,16,31 it is not effective to remove other types of lipoproteins such as VLDL and LDL.
Protein contamination. As plasma is quite complex media to work with, it is inevitable that EV isolates contain other non-EV proteins such as free albumin if the separation method is only based on physical characteristics such as density, solubility or size. Thus quantification of the protein contamination can help evaluate the EV purity. Figure 5F shows that the protein contaminations from the three kits have an opposite order against EV purity shown in Figure 5C. The protein contamination from ExoQuick Ultra (841.52 μg) is remarkable higher, which is 4 times of that from qEV35 (209.94 μg) and 33 times of that from qEV70 (25.59 μg).
Overall, the quality assessment from the three separation kits shows that ExoQuick Ultra has the most contaminations especially non-EV proteins compared with the SEC method. This confirms that polymer precipitation is not recommended for pursuing high purity, even though a purification column is supposed to improve it. In contrast, qEV70 is the best option regarding the EV purity with the least non-EV protein contamination and lipoprotein contamination. qEV35 provides the best EV yield and can provide a balance between the yield and purity. The comparison between qEV35 and qEV70 indicates that the smaller pore size in SEC column with qEV35 does help with the collection of more EVs, but it also collects more contamination particles such as lipoproteins.
The Capability of Using Particle Number as the Estimate of EV Amount
For quantitative clinical analysis, it is important to choose the right estimate for the loading of equal EV amount to make the analytical results comparable. We initially chose particle number as the dosage due to a lack of sensitivity of commonly used protein quantification method such as bicinchoninic acid assay (BCA) assay from limited plasma volume. Therefore, it is very necessary to assess if the particle number has the capability to estimate EV amount for different separation kits.
The correlations of particle numbers to the EV amount (quantified by CD9/81/63 RFI) for each separation kit are plotted in Figure 6A–C. Strong positive correlations were observed for all the separation kits (ExoQuick Ultra: p<0.0001, R2=0.9186; qEV35: p<0.0001, R2=0.9557; qEV70: p<0.0001, R2=0.8774), which confirms that the particle number has the capability to reflect the actual EV amount from plasma. Thus, equal particle numbers can be used for EV loading for quantification. The correlations between measured particle number and protein amount were also investigated (Figure 6D–F). Among the three separation kits, only qEV70 provided a strong correlation (p<0.0001; Figure 6F). The lack of linearity with the other two kits may be due to the missing of more abundant smaller particles during NTA measurement which makes the actual particle measurement inaccurate.21 Therefore, for qEV70 both particle number and protein amount can be used to estimate EV amount; while for qEV35 and ExoQuick Ultra more investigation is required to examine if protein amount can be used as the estimate or not.
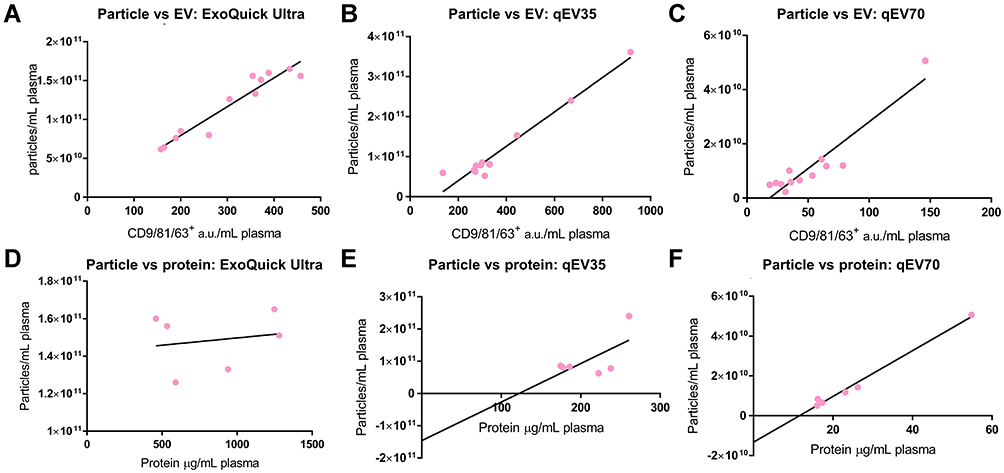 |
Figure 6 (A–C) Correlation between particles number and EV yield (from 6 patients and 6 HC). Strong positive correlations were observed for all the separation kits. (A) ExoQuick Ultra: R2=0.9186, P<0.0001; (B) qEV35: R2=0.9557, P<0.0001; (C) qEV70: R2=0.8774, P<0.0001. (D–F) Correlation of particles number to the protein amount (from 3 patients and 3 HC). Only qEV70 provided a strong correlation. (D) ExoQuick Ultra: R2=0.03332, P=0.7292; (E) qEV35: R2=0.4067, P=0.1731; (F) qEV70: R2=0.9875, P<0.0001. |
Differentiation Between PCa Patients and Healthy Donors
As our goal is to use EVs to improve PCa diagnosis, we looked at the capabilities of separated EVs for differentiating PCa patients with HC and compared the results from different separation kits. A table of PCa patients’ information was provided including ages, risk group, serum PSA level, Gleason score, and the tumour/node/metastasis (TNM) stage (Supplemental information, Table S1).
It is important and challenging to choose the right EV metrics for the differentiation of different separation methods. In circulation, tumour-derived EVs are mixed with EVs derived from normal cells, which might affect the ability to identify and analyse tumour-derived EVs. Therefore, it is critically important to select the right biomarkers from cancer-derived EVs for cancer diagnosis. Commonly used EV metrics from previous studies include the total EV content and cancer-specific EVs.38–40 In this study, we also investigated these metrics for the three separation kits. For cancer-specific EVs, we chose PSA as a starting point as it is the current clinical standard for PCa screening. We investigated if EVs carry PSA and whether PSA-specific EVs can assist the PCa diagnosis. This was achieved by staining EVs captured by CD9 and CD81 beads with anti-PSA antibodies, so that the PSA fluorescence signals are specifically from EVs instead of other co-separated free PSA.
The comparison (two-tail t-test) between different EV metrics among the three separation kits is shown in Figure 7. Strong fluorescence signals were observed in PSA stained EVs for all three kits, which confirms that EVs carry PSA on their surface (Figure S1d). However, no significant difference was observed between PCa patients and HC based on PSA-specific EVs for all the three kits (Figure 7A–C). This result indicates that similar with free PSA, PSA-specific EVs also lack the specificity to differentiate between PCa patients and HC, which is consistent with the previous study by Liu et al.41 We also attempted to use the ratio between PSA-specific EVs and total EVs, hoping for a more accurate evaluation of PSA-specific EVs, since samples from PCa patients contain both cancer-derived and normal EVs. As shown in Figure 7D–F, only qEV70 shows some difference between PCa patients and HC, yet HC shows a higher ratio of PSA+ EVs/Total EVs, which is not what we expected as a PCa patient usually has elevated PSA level (>4 ng/mL) in the serum compared to a healthy person. This again indicates that EV-associated PSA lacks the specificity to differentiate between PCa patients and HC. Total EVs could not be used to differentiate PCa patients and HC for all three kits either, as shown in Figure 7G–I. This is understandable considering again samples from PCa patients contain both cancer-derived and normal EVs. Therefore, other EV associated biomarkers with a higher specificity to differentiate between PCa patients and HC are to be explored in our future work with a larger cohort.
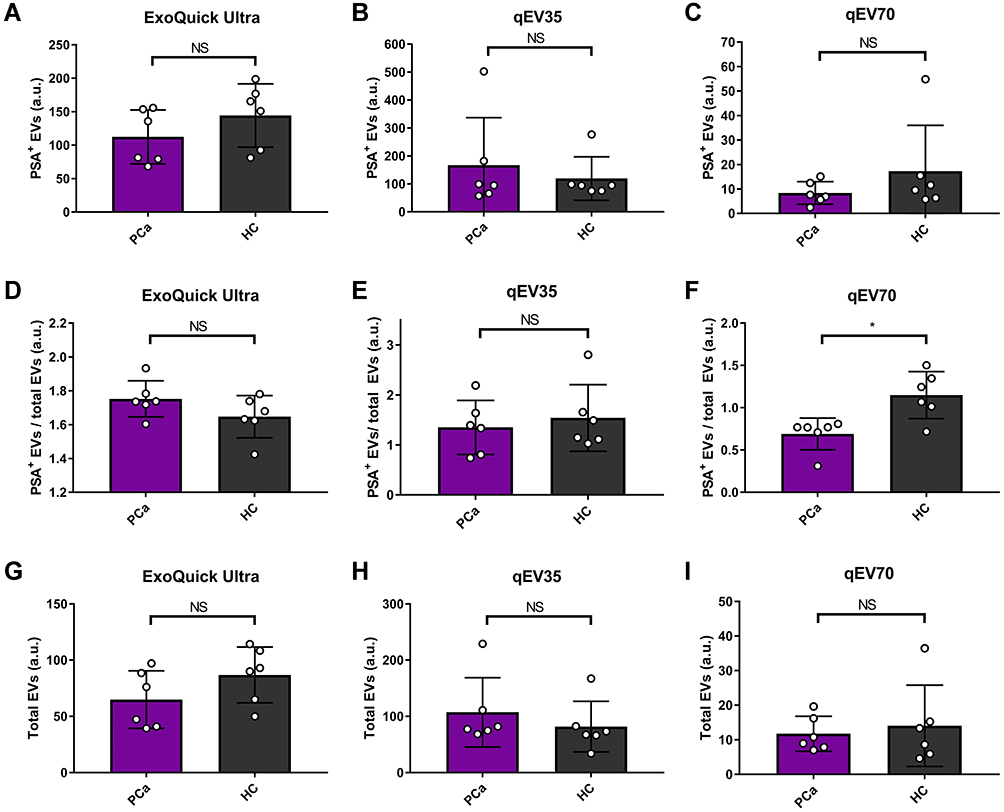 |
Figure 7 Comparison between PCa patients (n=6) and health control (n=6) using different EV metrics with three different kits. (A–C) PSA positive EVs, (D–F) PSA positive EVs/total EVs, and (G–I) Total EVs. No significant difference was observed between PCa patients and healthy controls (HC) based on PSA-specific EVs or total EVs for all the three methods. Only qEV70 shows some difference between PCa patients and HC when using PSA positive EVs/total EVs as the metrics. As different fluorescence stains in the detection marker were used for PSA and EVs (Alexa Fluor 405 for PSA and APC for EVs), the fluorescence signals from PSA is more intensive than EVs, which leads to the RFI ratio of PSA+ EV/total EV >1. *P < 0.05. Two-tail t-test was used for (A–I). |
Discussion
EVs have attracted tremendous attention as new biomarkers for liquid biopsy-based cancer diagnosis. For instance, Royo et al found that EVs protein markers (FLOT1, CD63) were alterated in urine samples from PCa patients (n=18), suggesting EVs are feasible for using a small volume of urine samples in the clinical setting.29 Melo et al analysed EVs from 190 pancreatic ductal adenocarcinoma (PDAC) patients and 32 breast cancer patients, and demonstrated a strong correlation between GPC1+ EVs and cancer, particularly for PDAC, inferring that GPC1+ EVs may serve as a potential biomarker to detect early stages of pancreatic cancer.38 These findings indicate the clinical significance of EV-associated biomarkers in cancer diagnosis. However, current EV diagnostic strategies are still far away from clinical translation. One important reason is that currently there is no standard method for EV separation, even though 190 distinct separation methods are used in previous studies.34 Choosing different separation methods may result in a different portion of EVs, co-separated lipoproteins and soluble proteins, which would affect downstream analysis such as protein and particle content, phenotype, and molecular cargos.29,37 Therefore, knowing the quality from the separation method is essential for choosing the suitable method and ensuring the accuracy of downstream applications. In this study, we provided a systematic protocol for a thorough investigation of the separation quality by a representative comparison between three attractive kits suitable for clinical use. Our strategy, using a combination of the commercially available separation kit with magnetic beads capture and flow cytometry analysis, provides a complete workflow for clinical EV analysis which can be easily and directly implemented in clinical laboratories.
SEC is gaining increasing popularity owning to its simple procedure compared to UC and a relatively good balance between EV purity and yield.21 We performed a pair-to-pair quantitative comparison of two popular SEC kits (qEV70 and qEV35) with a purification included polymer precipitation kit ExoQuick Ultra. We found that the SEC kits provided higher EV purity compared to ExoQuick Ultra. Exoquick Ultra provided an EV yield comparable with qEV35, but the EV purity was sacrificed with high levels of lipoprotein and protein contaminations. Between the two SEC kits, qEV70 provides the best EV purity while qEV35 provides the best EV yield. Researchers are suggested to choose the separation method depending on the downstream application. For instance, if the downstream analysis has high-enough sensitivity, qEV70 is a recommended method as it provides the highest purity. On the other hand, if the analysis requires a larger EV amount, qEV35 may be the better option with the highest yield. However, extra caution needs to be taken into consideration to ensure that the results are specifically from EVs instead of other contaminations such as lipoproteins.
Human plasma provides highly valuable information and clinical relevance which benefit the utilisation of EV-associated biomarker from lab bench to clinic bedside. However, plasma is a very challenging biofluid to work with as it is a complex medium with different contaminations especially lipoproteins which are several orders of magnitude higher than that of EVs.19 As lipoproteins share similar size and density with EVs, they are very difficult to remove using a single separation method based on physical characteristics. A combination of several separation methods is a trend, which has been applied in a lot of studies.15 Several proteins were reported as specific markers for a variety of lipoprotein subtypes, such as ApoA1, ApoB48 and ApoB100.17,20,42 ApoA1 is majorly associated with HDL, and previous researches have shown SEC can remove >95% HDL.19,31 Therefore, in this study, we used ApoB expression as the metrics to evaluate the lipoprotein level, which was also utilised by previous studies.20,43 Our results show that lipoproteins are inevitable for all three separation kits, and SEC which was reported to be effective to remove smaller HDL cannot remove other types such as LDL and VLDL sufficiently. This issue makes an extra step of immunoaffinity-based separation such as the immunomagnetic beads used in our study essential.
As the two SEC kits, qEV35 and qEV70, are based on two pore sizes targeting different cutoffs, we are interested in investigating the difference between their separation products. Our results showed that qEV35 indeed collected more particles <100 nm compared to qEV70 and ExoQuick Ultra, but there is no significant difference in the mode size between qEV35 and qEV70. This may be due to the lack of capability of NTA to measure the smaller size of particles <70–90 nm as reported in previous studies.21 Other more sensitive particle size analysis methods such as nano-flow cytometry may be capable of revealing the difference.21 qEV35 provided a higher particle number compared with qEV70, which comes from a combination of more EVs and more contaminations, as confirmed from the flow cytometry analysis. To reveal the actual portions of EVs and lipoproteins, fluorescence-based NTA to specifically measure different targets can be used.44
Extensive comparison of EV separation has been made in the past few years.21,24,29,45 However, most of the studies are based on single-step separated samples, which indicates that the analytes may be interfered by soluble proteins or other non-EV impurities. One unique aspect for our immunomagnetic beads capture followed by flow cytometry analysis is that this capture plus detection cocktail allows specific analysis of EVs. By this sandwich assay, we can target EVs based on their specific markers or tumour-derived EVs based on cancer markers, so that false-positive signals from non-EV component can be eliminated to a great extent. We also used a mixture of EV markers for both the capture and detection to avoid possible EV heterogeneity among different people (eg one participant only has CD81 positive EVs but not CD9 positive EVs or vice versa), yet EVs that only express CD63 may be missed.
In quantitative EV analysis such as EV-based clinical diagnosis, it is often critical to equally load the same EV amount for a reliable comparison of heterogenous samples to investigate the maker expression level. For example, previous studies have demonstrated that the fluorescence signal in flow cytometry was significantly affected by the number of EVs captured per beads.46 Protein amount and particle numbers are the two major loading dosages for quantitative EV analysis. Our results showed that the particle number measured by NTA has a linear relationship with EV amount measured by flow cytometry. This confirms our choice of using particle numbers as the dosage for EV loading. We also found that a linear relationship between protein amount and particle number only exists with qEV70 but not the other two separation kits. A failure of this linearity was also found from a previous study by Takov et al from certain SEC fractions.24 Therefore, it is important to investigate the correlation between the dosage and the analysis signal before making the decision about which dosage to use.
Our results and previous reports show that the EV quality and related analysis results largely depend on the separation method.29,37 However, no matter which method to use, the more significant aspect is whether the separated EVs can be used to generate clinically meaningful information. Although numerous studies compared different EV separation methods, surprisingly only a few of them employed plasma samples from cancer patients in the scenario of clinical cancer diagnosis.21,28–30,37 Therefore, we evaluated several EV metrics towards developing more accurate EV-based markers for improving PCa diagnosis and compared three separation kits. Unfortunately, these metrics could not differentiate PCa patients from HC. However, a larger number of samples are required before making any conclusive statement. Our ongoing work is to profile new cancer-specific biomarkers targeting cancer-derived EVs for a better differentiation between PCa patients and HC in a multiplexed way. Immunomagnetic beads-based capture followed by flow cytometry analysis is ideal for this purpose, as different fluorescence-encoded beads can be used from one sample and the results can be obtained from one analysis.47
In conclusion, we established a systematic assessment of the EV quality by comparing three latest commercially available separation kits. Our results show that EVs separated by the two SEC kits had a higher EV purity and lower protein contamination than those by ExoQuick Ultra. Between the two SEC kits, qEV35 demonstrated a higher EV yield, but with lower EV purity with a higher lipoprotein and protein contamination than qEV70. We particularly investigated the capability of using particle number to estimate the EV amount, which is important for quantitative clinical analysis. At last, we show that several common EV metrics including total EV level and PSA-specific EVs could not differentiate PCa patients from HC. Better EV associated cancer biomarkers are being investigated for this diagnosis purpose with a larger cohort in our following study.
We hope this work will raise awareness about the quality of EV preparations before conclusive statements are made on their biological functions or clinical meanings. We provided here a complete workflow for the benchmarking of separation methods, which can be easily adopted by other researchers in the community. The combination of EV separation using the commercial kit with magnetic-beads capture and flow cytometry analysis can be directly used as a general process used in clinical laboratories for EV-based cancer diagnosis.
Ethics Statement
The authors confirm that this study was approved by the South Eastern Sydney Local Health District Human Research Ethics Committee (12/131, 2020/ETH02456) and that all participants provided informed consent to take part in this study. We also confirm that this study complied with the Declaration of Helsinki.
Acknowledgments
This work is supported by the St. George Hospital Cancer Research Trust Fund and Prostate and Breast Cancer Foundation, and Cancer Institute NSW Early Career Fellowship (2017/EFC012, Y. Zhu). The authors would like to acknowledge the UIPA funding support from UNSW Sydney (B. Pang), the Microfluidics Laboratory in the School of Mechanical and Manufacturing Engineering at UNSW Sydney for the use of Nanosight instrument and the Electron Microscope Unit at UNSW Sydney for the use of the Cryo-EM Facility.
Disclosure
The authors declare no conflicts of interest in this work.
References
1. Bray F, Ferlay J, Soerjomataram I, Siegel RL, Torre LA, Jemal A. Global cancer statistics 2018: GLOBOCAN estimates of incidence and mortality worldwide for 36 cancers in 185 countries. CA Cancer J Clin. 2018;68(6):394–424.
2. Wade J, Rosario DJ, Macefield RC, et al. Psychological impact of prostate biopsy: physical symptoms, anxiety, and depression. J Clin Oncol. 2013;31(33):4235–4241. doi:10.1200/JCO.2012.45.4801
3. Medd JCC, Stockler MR, Collins R, Lalak A. Measuring men’s opinions of prostate needle biopsy. ANZ J Surg. 2005;75(8):662–664. doi:10.1111/j.1445-2197.2005.03477.x
4. Loeb S, Bjurlin MA, Nicholson J, et al. Overdiagnosis and overtreatment of prostate cancer. Eur Urol. 2014;65(6):1046–1055. doi:10.1016/j.eururo.2013.12.062
5. Giulietti M, Santoni M, Cimadamore A, et al. Exploring small extracellular vesicles for precision medicine in prostate cancer. Front Oncol. 2018;8:221. doi:10.3389/fonc.2018.00221
6. Pang B, Zhu Y, Ni J, et al. Extracellular vesicles: the next generation of biomarkers for liquid biopsy-based prostate cancer diagnosis. Theranostics. 2020;10(5):2309–2326. doi:10.7150/thno.39486
7. Prensner JR, Rubin MA, Wei JT, Chinnaiyan AM. Beyond PSA: the next generation of prostate cancer biomarkers. Sci Transl Med. 2012;4(127):127rv123–127rv123. doi:10.1126/scitranslmed.3003180
8. Wang J, Wuethrich A, Sina AAI, et al. Tracking extracellular vesicle phenotypic changes enables treatment monitoring in melanoma. Science Advances. 2020;6(9):eaax3223. doi:10.1126/sciadv.aax3223
9. Valadi H, Ekstrom K, Bossios A, Sjostrand M, Lee JJ, Lotvall JO. Exosome-mediated transfer of mRNAs and microRNAs is a novel mechanism of genetic exchange between cells. Nat Cell Biol. 2007;9(6):654–U672. doi:10.1038/ncb1596
10. Sódar BW, Kovács Á, Visnovitz T, et al. Best practice of identification and proteomic analysis of extracellular vesicles in human health and disease. Expert Rev Proteomics. 2017;14(12):1073–1090. doi:10.1080/14789450.2017.1392244
11. Puhka M, Takatalo M, Nordberg M-E, et al. Metabolomic profiling of extracellular vesicles and alternative normalization methods reveal enriched metabolites and strategies to study prostate cancer-related changes. Theranostics. 2017;7(16):3824–3841. doi:10.7150/thno.19890
12. Becker A, Thakur BK, Weiss JM, Kim HS, Peinado H, Lyden D. Extracellular vesicles in cancer: cell-to-cell mediators of metastasis. Cancer Cell. 2016;30(6):836–848.
13. An T, Qin S, Xu Y, et al. Exosomes serve as tumour markers for personalized diagnostics owing to their important role in cancer metastasis. J Extracellular Vesicles. 2015;4.
14. Witwer KW, Buzás EI, Bemis LT, et al. Standardization of sample collection, isolation and analysis methods in extracellular vesicle research. J Extracellular Vesicles. 2013;2.
15. Gardiner C, Vizio DD, Sahoo S, et al. Techniques used for the isolation and characterization of extracellular vesicles: results of a worldwide survey. J Extracellular Vesicles. 2016;5(1):32945. doi:10.3402/jev.v5.32945
16. Coumans FAW, Brisson AR, Buzas EI, et al. Methodological guidelines to study extracellular vesicles. Circ Res. 2017;120(10):1632–1648.
17. Yuana Y, Levels J, Grootemaat A, Sturk A, Nieuwland R. Co-isolation of extracellular vesicles and high-density lipoproteins using density gradient ultracentrifugation. J Extracellular Vesicles. 2014;3(1):23262. doi:10.3402/jev.v3.23262
18. Yuana Y, Koning RI, Kuil ME, et al. Cryo-electron microscopy of extracellular vesicles in fresh plasma. J Extracellular Vesicles. 2013;2(1):21494. doi:10.3402/jev.v2i0.21494
19. Simonsen JB. What are we looking at? Extracellular vesicles, lipoproteins, or both? Circ Res. 2017;121(8):920–922. doi:10.1161/CIRCRESAHA.117.311767
20. Sódar BW, Kittel Á, Pálóczi K, et al. Low-density lipoprotein mimics blood plasma-derived exosomes and microvesicles during isolation and detection. Sci Rep. 2016;6:24316. doi:10.1038/srep24316
21. Tian Y, Gong M, Hu Y, et al. Quality and efficiency assessment of six extracellular vesicle isolation methods by nano-flow cytometry. J Extracellular Vesicles. 2020;9(1):1697028. doi:10.1080/20013078.2019.1697028
22. Linares R, Tan S, Gounou C, Arraud N, Brisson AR. High-speed centrifugation induces aggregation of extracellular vesicles. J Extracell Vesicles. 2015;4(1):29509. doi:10.3402/jev.v4.29509
23. Van Deun J, Mestdagh P, Sormunen R, et al. The impact of disparate isolation methods for extracellular vesicles on downstream RNA profiling. J Extracell Vesicles. 2014;3(1):24858. doi:10.3402/jev.v3.24858
24. Takov K, Yellon DM, Davidson SM. Comparison of small extracellular vesicles isolated from plasma by ultracentrifugation or size-exclusion chromatography: yield, purity and functional potential. J Extracellular Vesicles. 2019;8(1):1560809. doi:10.1080/20013078.2018.1560809
25. de Menezes-neto A, Saez MJ, Lozano-Ramos I, et al. Size-exclusion chromatography as a stand-alone methodology identifies novel markers in mass spectrometry analyses of plasma-derived vesicles from healthy individuals. J Extracell Vesicles. 2015;4:27378. doi:10.3402/jev.v4.27378
26. Lötvall J, Hill AF, Hochberg F, et al. Minimal experimental requirements for definition of extracellular vesicles and their functions: a position statement from the international society for extracellular vesicles. J Extracellular Vesicles. 2014;3.
27. Théry C, Witwer KW, Aikawa E, et al. Minimal information for studies of extracellular vesicles 2018 (MISEV2018): a position statement of the international society for extracellular vesicles and update of the misev2014 guidelines. J Extracellular Vesicles. 2019;8(1):1535750.
28. Baranyai T, Herczeg K, Onodi Z, et al. Isolation of exosomes from blood plasma: qualitative and quantitative comparison of ultracentrifugation and size exclusion chromatography methods. PLoS One. 2015;10(12):e0145686. doi:10.1371/journal.pone.0145686
29. Royo F, Zuñiga-Garcia P, Sanchez-Mosquera P, et al. Different EV enrichment methods suitable for clinical settings yield different subpopulations of urinary extracellular vesicles from human samples. J Extracellular Vesicles. 2016;5(1):29497. doi:10.3402/jev.v5.29497
30. Stranska R, Gysbrechts L, Wouters J, et al. Comparison of membrane affinity-based method with size-exclusion chromatography for isolation of exosome-like vesicles from human plasma. J Transl Med. 2018;16(1):1. doi:10.1186/s12967-017-1374-6
31. Boing AN, van der Pol E, Grootemaat AE, Coumans FA, Sturk A, Nieuwland R. Single-step isolation of extracellular vesicles by size-exclusion chromatography. J Extracell Vesicles. 2014;3(1):23430. doi:10.3402/jev.v3.23430
32. Vestad B, Llorente A, Neurauter A, et al. Size and concentration analyses of extracellular vesicles by nanoparticle tracking analysis: a variation study. J Extracellular Vesicles. 2017;6(1):1344087. doi:10.1080/20013078.2017.1344087
33. Gardiner C, Ferreira YJ, Dragovic RA, Redman CWG, Sargent IL. Extracellular vesicle sizing and enumeration by nanoparticle tracking analysis. J Extracellular Vesicles. 2013;2(1):19671. doi:10.3402/jev.v2i0.19671
34. Van Deun J, Mestdagh P, Agostinis P, et al. EV-TRACK: transparent reporting and centralizing knowledge in extracellular vesicle research. Nat Methods. 2017;14(3):228–232. doi:10.1038/nmeth.4185
35. Emelyanov A, Shtam T, Kamyshinsky R, et al. Cryo-electron microscopy of extracellular vesicles from cerebrospinal fluid. PLoS One. 2020;15(1):e0227949. doi:10.1371/journal.pone.0227949
36. Webber J, Clayton A. How pure are your vesicles? J Extracellular Vesicles. 2013;2(1):19861. doi:10.3402/jev.v2i0.19861
37. Freitas D, Balmaña M, Poças J, et al. Different isolation approaches lead to diverse glycosylated extracellular vesicle populations. J Extracellular Vesicles. 2019;8(1):1621131. doi:10.1080/20013078.2019.1621131
38. Melo SA, Luecke LB, Kahlert C, et al. Glypican-1 identifies cancer exosomes and detects early pancreatic cancer. Nature. 2015;523(7559):177–182. doi:10.1038/nature14581
39. Dong X, Chi J, Zheng L, et al. Efficient isolation and sensitive quantification of extracellular vesicles based on an integrated ExoID-Chip using photonic crystals. Lab Chip. 2019;19:2897–2904. doi:10.1039/C9LC00445A
40. Liang K, Liu F, Fan J, et al. Nanoplasmonic quantification of tumour-derived extracellular vesicles in plasma microsamples for diagnosis and treatment monitoring. Nature Biomedical Engineering. 2017;1:0021. doi:10.1038/s41551-016-0021
41. Liu C, Zhao J, Tian F, et al. Low-cost thermophoretic profiling of extracellular-vesicle surface proteins for the early detection and classification of cancers. Nat Biomed Eng. 2019;3(3):183–193.
42. Dashty M, Motazacker MM, Levels J, et al. Proteome of human plasma very low-density lipoprotein and low-density lipoprotein exhibits a link with coagulation and lipid metabolism. Thromb Haemost. 2014;112(03):518–530. doi:10.1160/TH13-02-0178
43. Welton JL, Webber JP, Botos L-A, Jones M, Clayton A. Ready-made chromatography columns for extracellular vesicle isolation from plasma. J Extracellular Vesicles. 2015;4(1):27269. doi:10.3402/jev.v4.27269
44. Dragovic RA, Collett GP, Hole P, et al. Isolation of syncytiotrophoblast microvesicles and exosomes and their characterisation by multicolour flow cytometry and fluorescence nanoparticle tracking analysis. Methods. 2015;87:64–74. doi:10.1016/j.ymeth.2015.03.028
45. Brennan K, Martin K, FitzGerald SP, et al. A comparison of methods for the isolation and separation of extracellular vesicles from protein and lipid particles in human serum. Sci Rep. 2020;10(1):1039. doi:10.1038/s41598-020-57497-7
46. Campos-Silva C, Suárez H, Jara-Acevedo R, et al. High sensitivity detection of extracellular vesicles immune-captured from urine by conventional flow cytometry. Sci Rep. 2019;9(1):2042. doi:10.1038/s41598-019-38516-8
47. Koliha N, Wiencek Y, Heider U, et al. A novel multiplex bead-based platform highlights the diversity of extracellular vesicles. J Extracellular Vesicles. 2016;5(1):29975. doi:10.3402/jev.v5.29975
 © 2020 The Author(s). This work is published and licensed by Dove Medical Press Limited. The full terms of this license are available at https://www.dovepress.com/terms.php and incorporate the Creative Commons Attribution - Non Commercial (unported, v3.0) License.
By accessing the work you hereby accept the Terms. Non-commercial uses of the work are permitted without any further permission from Dove Medical Press Limited, provided the work is properly attributed. For permission for commercial use of this work, please see paragraphs 4.2 and 5 of our Terms.
© 2020 The Author(s). This work is published and licensed by Dove Medical Press Limited. The full terms of this license are available at https://www.dovepress.com/terms.php and incorporate the Creative Commons Attribution - Non Commercial (unported, v3.0) License.
By accessing the work you hereby accept the Terms. Non-commercial uses of the work are permitted without any further permission from Dove Medical Press Limited, provided the work is properly attributed. For permission for commercial use of this work, please see paragraphs 4.2 and 5 of our Terms.