")
Back to Journals » International Journal of Chronic Obstructive Pulmonary Disease » Volume 12
Pulmonary rehabilitation for COPD improves exercise time rather than exercise tolerance: effects and mechanisms
Authors Miki K , Maekura R, Kitada S , Miki M , Yoshimura K, Yamamoto H, Kawabe T, Kagawa H, Oshitani Y, Satomi A, Nishida K, Sawa N, Inoue K
Received 24 December 2016
Accepted for publication 9 March 2017
Published 3 April 2017 Volume 2017:12 Pages 1061—1070
DOI https://doi.org/10.2147/COPD.S131061
Checked for plagiarism Yes
Review by Single anonymous peer review
Peer reviewer comments 2
Editor who approved publication: Dr Richard Russell
Keisuke Miki,1 Ryoji Maekura,1 Seigo Kitada,1 Mari Miki,1 Kenji Yoshimura,1 Hiroshi Yamamoto,2 Toshiko Kawabe,2 Hiroyuki Kagawa,1 Yohei Oshitani,1 Akitoshi Satomi,1 Kohei Nishida,1 Nobuhiko Sawa,1 Kimiko Inoue2
1Department of Respiratory Medicine, 2Department of Rehabilitation Medicine, National Hospital Organization, Toneyama National Hospital, Toyonaka, Japan
Background: COPD patients undergoing pulmonary rehabilitation (PR) show various responses. The purpose of this study was to investigate the possible mechanisms and predictors of the response to PR in COPD patients.
Methods: Thirty-six stable COPD patients underwent PR including a 4-week high-intensity exercise training program, and they were evaluated by cardiopulmonary exercise testing. All patients (mean age 69 years, severe and very severe COPD 94%) were classified into four groups by whether the exercise time (Tex) or the peak oxygen uptake (VO2) increased after PR: two factors increased (both the Tex and the peak VO2 increased); two factors decreased; time only increased (the Tex increased, but the peak VO2 economized); and VO2 only increased (the Tex decreased, but the peak VO2 increased). Within all patients, the relationships between baseline variables and the post-to-pre-change ratio of the time–slope, Tex/(peak minus resting VO2), were investigated.
Results: Compared with the two factors increased group (n=11), in the time only increased group (n=18), the mean differences from pre-PR at peak exercise in 1) minute ventilation (VE) (P=0.004), VO2 (P<0.0001), and carbon dioxide output (VCO2) (P<0.0001) were lower, 2) VE/VO2 (P=0.034) and VE/VCO2 (P=0.006) were higher, and 3) the dead space/tidal volume ratio (VD/VT) and the dyspnea level were similar. After PR, there was no significant difference in the ratio of the observed peak heart rate (HR) to the predicted peak HR (220 – age [years]) between the two groups. A significant negative correlation with the baseline time–slope (r=-0.496, P=0.002) and a positive correlation with the baseline body mass index (BMI) (r=0.496, P=0.002) were obtained.
Conclusions: PR in COPD patients improves Tex rather than exercise tolerance, economizing oxygen requirements, resulting in reduced ventilatory requirements without cardiac loads followed by reduced exertional dyspnea. In addition, the time–slope and BMI could be used to predict PR responses beforehand.
Keywords: cardiopulmonary exercise testing, oxygen requirement, ventilatory equivalents, body weight, carbon dioxide output
Introduction
Exercise intolerance with dyspnea is a major complaint of patients with advanced COPD.1–4 It has been clearly demonstrated that pulmonary rehabilitation (PR), as an essential non-pharmacologic treatment option for COPD, increases exercise tolerance and reduces dyspnea.1–4 However, the responses to PR vary significantly and may be unique.1–5 It has been reported that some COPD patients receive little or no benefit at all from PR, although the definition of non-responders to PR needs to be considered.1–5 In addition, it has been reported that, regardless of whether exercise tolerance was improved in COPD patients on PR, their dyspnea was reduced or their endurance time was prolonged.1,6–8 In other words, a high exercise tolerance might not be necessary to exercise for a long time. How to identify the possible mechanisms or predictors related to the response to PR is of great interest in the care of COPD patients, and it has not yet been clearly elucidated.
Given that physical exercise requires gas exchange involving the interaction of the ventilatory, cardiovascular, and muscle systems, two parameters (peak oxygen uptake [ O2] and exercise time to exhaustion [Tex]) might characterize total exercise ability.9 Evaluating physical exercise might depend on the peak O2–Tex relationship rather than the peak O2 or Tex alone, because it has been reported that, to reach a certain O2 during exercise, COPD patients had a longer time than normal subjects, that is, COPD patients could not increase O2 steeply.10,11 Furthermore, keeping in mind that exercise for a long time with the economized O2 requirement might be efficient exercise, it was hypothesized that careful consideration of the peak O2–Tex relationship might be useful for providing detailed evaluations of PR or predicting the degree of response to PR in COPD patients. The Tex equivalent for increased O2 was designed to assess the effectiveness of PR. Figure 1 shows the Tex standardized by the increase of O2 from resting to peak exercise during cardiopulmonary exercise testing (CPET), that is, Tex/ΔO2 (time–slope). As a first purpose of this study, the mechanism by which the responses to PR vary greatly in COPD patients, especially how exercise time but not exercise tolerance improves after PR, was investigated, classifying eligible patients into four groups by whether the Tex or the peak O2 was increased after PR: two factors increased (both the Tex and the peak O2 increased); two factors decreased; time only increased (the Tex increased but the peak O2 economized); and O2 only increased (the Tex decreased but the peak O2 increased), as shown in Figure 2. Second, whether baseline parameters including the time–slope would be good predictors of the response to PR in COPD patients were investigated.
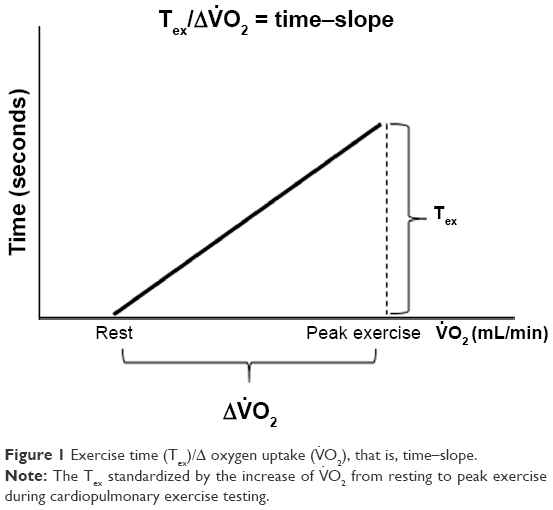 | Figure 1 Exercise time (Tex)/Δ oxygen uptake ( |
 | Figure 2 The effects of PR on peak |
Methods
Subjects
All 121 COPD patients who underwent the PR program for the first time were recruited for the study, and they were evaluated both before and after PR in the National Hospital Organization, Toneyama National Hospital (Japan), between January 2000 and March 2016. A total of 36 patients who were evaluated by CPET with the same protocol (for more detail, refer to the “CPET” section) were retrospectively analyzed. Figure 3 shows the study design as a flow diagram. The primary diagnosis of COPD was confirmed using the Global Initiative for Chronic Obstructive Lung Disease (GOLD) definition and classification.12 Patients were excluded from this study if they had a diagnosis of 1) bronchial asthma, 2) active infection, 3) severe heart disease, or 4) a history of lung resection. Moreover, COPD patients were excluded if there were changes in the drug regimen within 4 weeks before PR, if new treatment was added during PR, or if they were unstable due to other reasons. All patients gave comprehensively their written, informed consent for the procedures of PR and CPET. The study protocol complied with the Declaration of Helsinki. The institutional review board of the NHO’s Toneyama National Hospital approved this study (approval number: 1604).
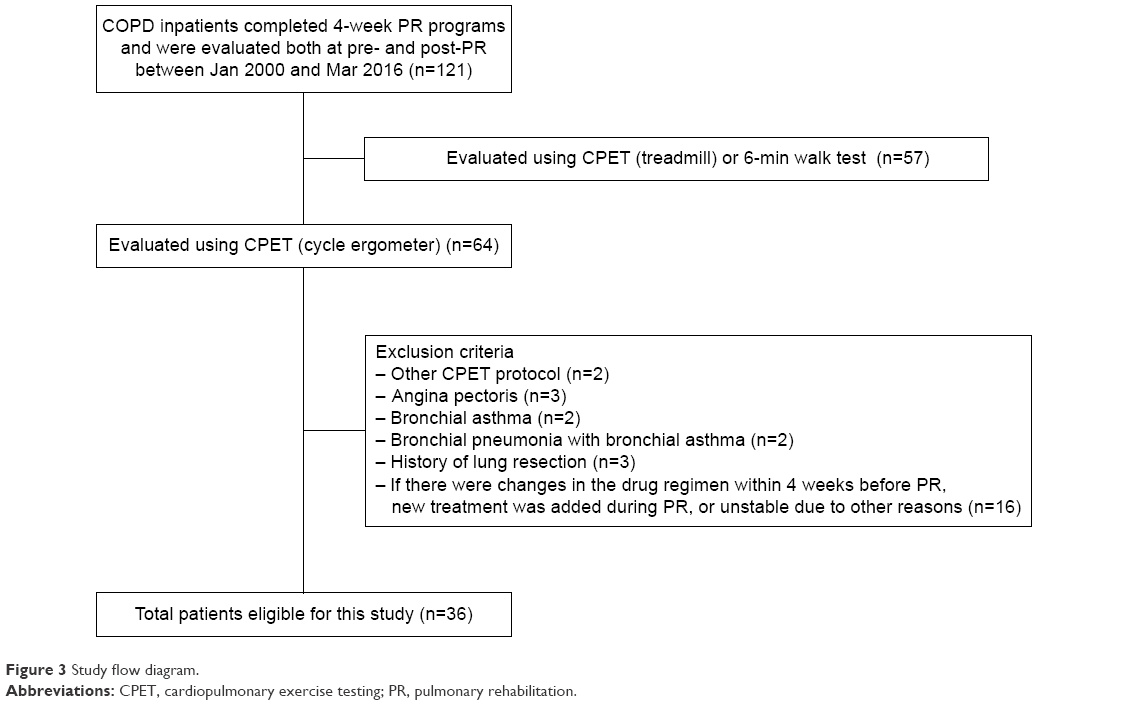 | Figure 3 Study flow diagram. |
Pulmonary function tests
Pulmonary function tests were performed within 1 week before and after PR, as previously described.13
PR
PR consisted of four components on an inpatient basis as previously described:14 1) education and instruction; 2) physical therapy; 3) exercise training; and 4) occupational therapy. Exercise training was conducted in three sets daily, every weekday for 4 weeks (20 days) at high-intensity targets with electromechanically braked cycle ergometers. The initial exercise level of each set was set for 6 min at the work rate corresponding to 60% of the peak O2 obtained on the baseline CPET. As tolerated by the patient, the exercise duration was first increased to 10 min. Second, the training work rate was increased by 5 W and then extended to the work rate corresponding to 80% of the baseline peak O2. If the patient found the set intolerable, it was reduced to its previous setting.
CPET
Symptom-limited incremental exercise tests were performed using an electrically braked cycle ergometer (CV-1000SS; Lode, Groningen, the Netherlands) and a CPET system (Vmaxs-29C; CareFusion 207, Palm Springs, CA, USA) before and after PR with a similar protocol, that is, 2-min increments to 10 W and the same air conditions. Before CPET, patients were asked to make their maximal efforts. To achieve reliable data, CPET was performed until subject exhaustion without encouragement, especially during exercise. All patients were asked to maintain a speed of ~60 rpm on the cycle ergometer, looking at the rpm meter. Pre-exercise resting measurements were taken during the steady-state period after at least 3 min of breathing using a mask. Ventilatory values were measured on a breath-by-breath basis and are presented as 30-s averages at rest, during exercise at 2-min intervals, and at the end of exercise. Intensities of dyspnea (Borg scale) were assessed at rest, during the last 15 s of each exercise stage, and at the end of exercise. At the baseline CPET evaluation of all patients, arterial blood was collected at rest, during the last 15 s of each exercise stage, and at the end of exercise. Arterial blood samples for blood gas analyses and plasma lactate were taken as previously described.13 Immediately after exercise, all patients were asked in a non-leading fashion about which symptoms (exertional dyspnea, leg discomfort, or others) caused them to stop the exercise.
Data analysis and statistical analysis
The anaerobic threshold (AT) was determined for each patient from a plot of CO2 and O2 during exercise (the V-slope technique), which was obtained by the agreement of two independent investigators. Iso-time was defined as the highest equivalent exercise time achieved during CPETs performed before and after PR. The time–slope was determined as the ratio of Tex standardized by ΔO2 (peak minus resting O2) during CPET (Tex/ΔO2). Classifying all patients into four groups by whether the Tex or the peak O2 was increased after PR, the relationship was investigated between the post-to-pre-change ratio of Tex and the post-to-pre-change ratio of peak O2 (Figure 2). To compare the baseline characteristics before PR between the two factors increased group (both the Tex and the peak O2 increased) and the time only increased group (the Tex increased, but the peak O2 economized), Fisher’s exact tests and Wilcoxon rank-sum tests were used. The distribution of reasons for stopping exercise was assessed using Fisher’s exact t-tests. The results after PR were compared with the pre-PR results within each group using paired t-tests, and the mean differences in outcome parameters between the two groups were analyzed using unpaired t-tests. To assess the relationships between baseline parameters and the ratio of the time–slope at post-PR to the time–slope at pre-PR, Spearman’s rank correlation coefficients were used. Data were expressed as mean ± SD, unless otherwise specified. A P<0.05 was considered significant (SAS 9.1.3; SAS Institute, Inc., Cary, NC, USA).
Results
The characteristics of the 36 patients are shown in Table 1. Most patients were male (97%) with severe-to-very severe airways obstruction (94%) according to the GOLD stages. All patients were ex-smokers. Home oxygen therapy was required for three patients.
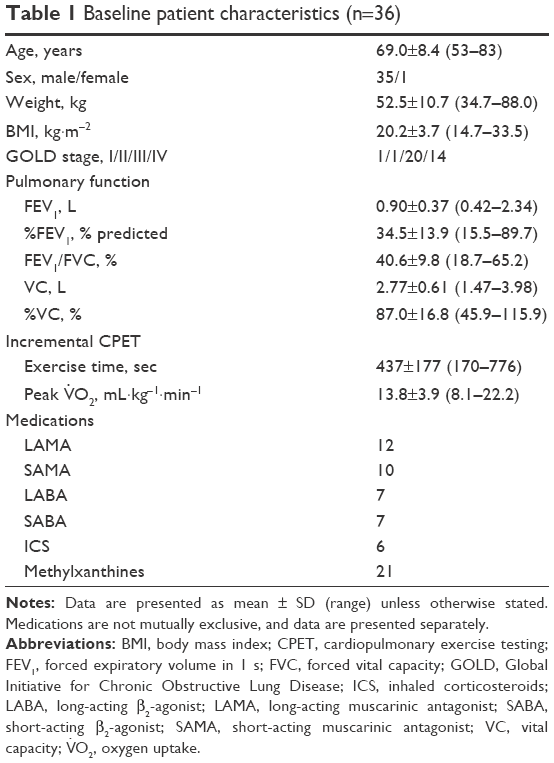 | Table 1 Baseline patient characteristics (n=36) |
First, the effects of PR on O2 and Tex were investigated across all patients. Figure 2 shows the relationship between the post-to-pre-change ratio of Tex and the post-to-pre-change ratio of peak O2. After PR, most patients (80%) increased Tex; of note, 18 patients (50%) increased Tex but reduced peak O2.
Second, to investigate why PR improved Tex, reducing exercise tolerance in COPD patients, the response to PR was compared between the time only increased group (the Tex increased, but the peak O2 economized) (n=18) and the two factors increased group (both the Tex and the peak O2 increased) (n=11), as shown in Figure 2. There was no significant difference in the percentage of total work performed during PR to the target work (the work rate corresponding to 80% of the baseline peak O2× total estimated time; time only increased group: 57.0%±28.5% vs two factors increased group: 65.0%±14.3%, P=0.429). Before PR, there were no differences in the characteristics and pulmonary functions between the two groups (Table 2). After PR, the distribution of reasons for stopping exercise was not different between the two groups (time only increased group: dyspnea [n=7, 39%], leg discomfort [n=11, 61%] vs two factors increased group: dyspnea [n=5, 45%], leg discomfort [n=6, 55%]). Although there was no significant difference in the resting response of PR between the groups, the mean difference (post-PR minus pre-PR) in the E/CO2 at rest was increased in the time only increased group (within-group: P<0.05). At peak exercise and iso-time, the mean difference in dyspnea level was improved in each group, but there was no significant difference between the groups (Tables 3 and 4). At peak exercise, the VD/VT was relatively low and similar in both groups (Table 3). Compared with the two factors increased group, in the time only increased group, the mean differences in 1) O2 (at peak exercise, P<0.0001; at iso-time, P<0.0001; at AT, P=0.0001), CO2 (at peak exercise, P<0.0001; at iso-time, P=0.0003; at AT, P=0.0003), and E (at peak exercise, P=0.004) were lower, 2) E/O2 (at peak exercise, P=0.034; at iso-time, P=0.047) and E/CO2 (at peak exercise, P=0.006; at iso-time, P=0.017) were higher, and 3) ΔFO2, which was calculated by the inspired gas oxygen concentration (FiO2) minus expired gas oxygen concentration (FeO2), was lower (at peak exercise, P=0.0002; at iso-time, P=0.006; Tables 3 and 4; Figure 4). After PR, there was no difference in the ratio of observed peak heart rate (HR) to predicted peak HR (220 – age [years]) between the two groups (time only increased group: 81.7% vs the two factors increased group: 84.4%, P=0.578).
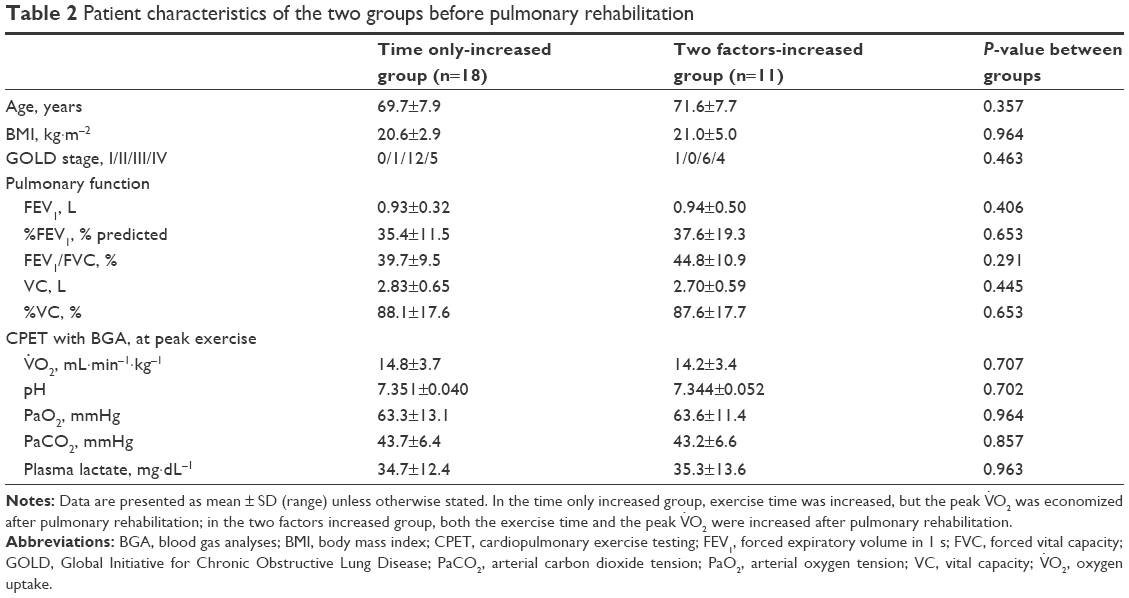 | Table 2 Patient characteristics of the two groups before pulmonary rehabilitation |
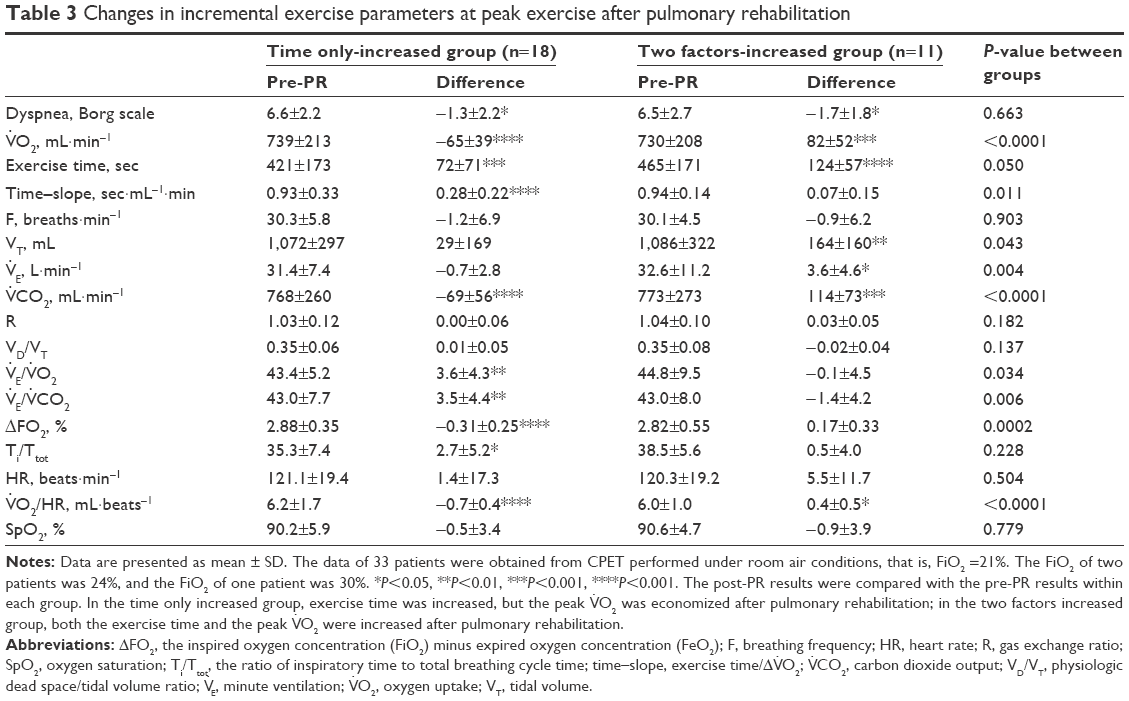 | Table 3 Changes in incremental exercise parameters at peak exercise after pulmonary rehabilitation |
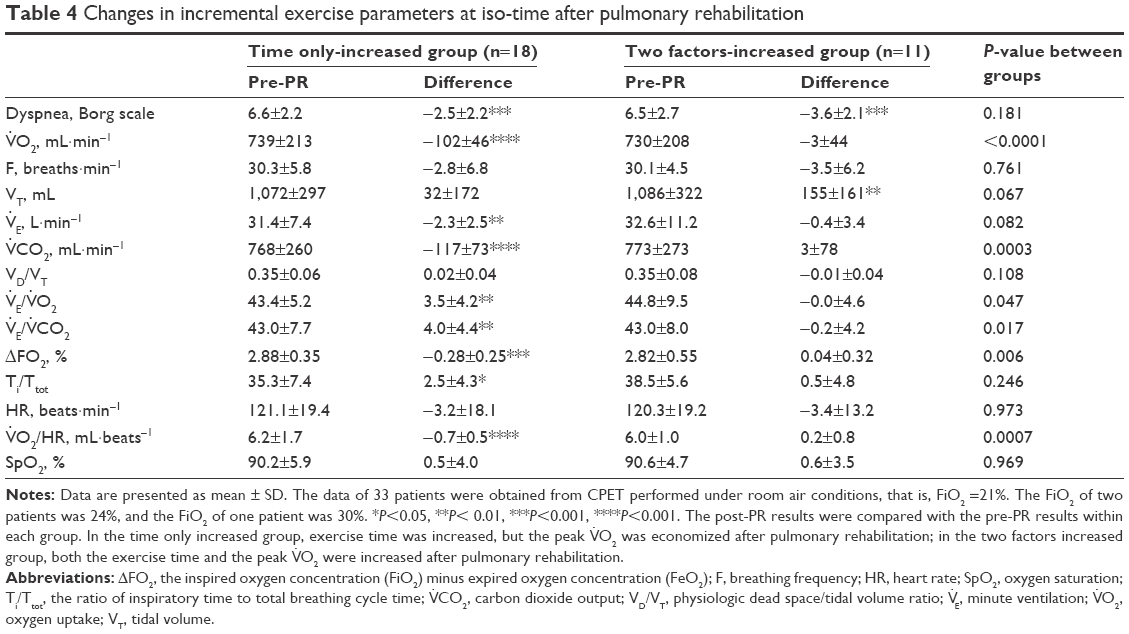 | Table 4 Changes in incremental exercise parameters at iso-time after pulmonary rehabilitation |
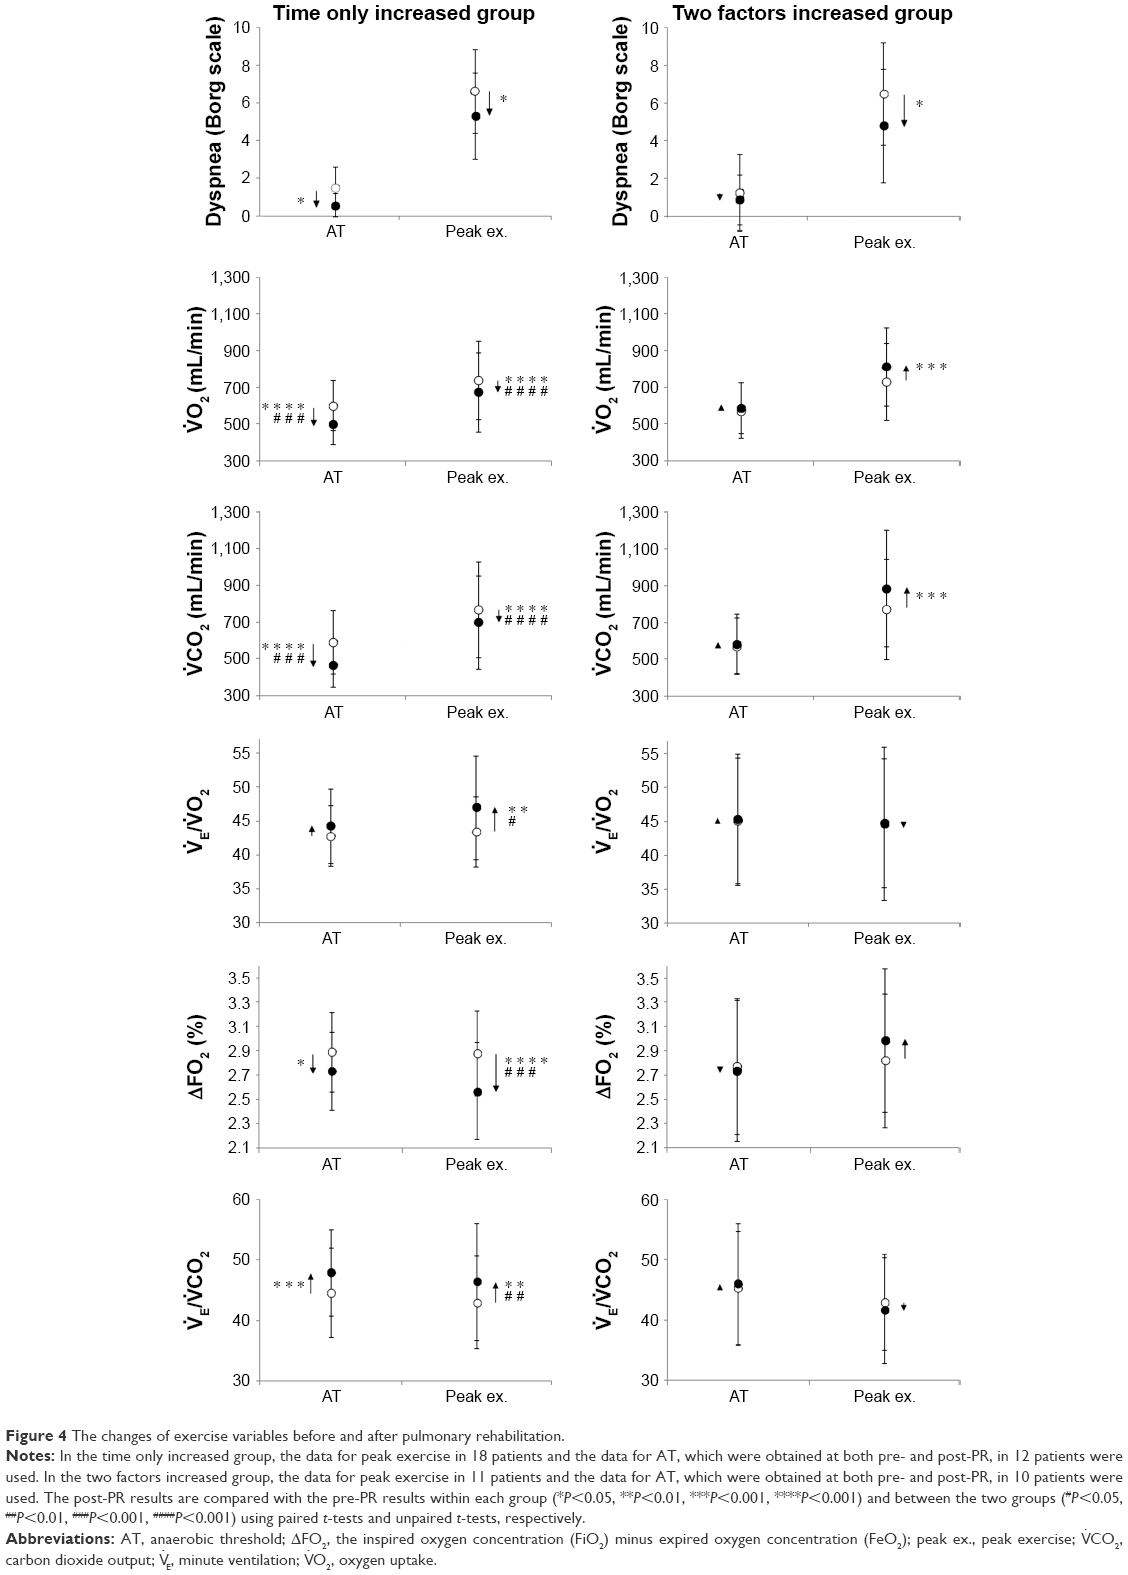 | Figure 4 The changes of exercise variables before and after pulmonary rehabilitation. |
Third, within all patients, to confirm the clinical predictors of responders who could exercise more efficiently after PR, the relationship between baseline variables and the post-to-pre-change ratio of the time–slope was investigated. A significant negative correlation with the baseline time–slope (r=−0.496, P=0.002; Table 5; Figure 5) and a positive correlation with body mass index (BMI) (r=0.496, P=0.002) were obtained (Table 5).
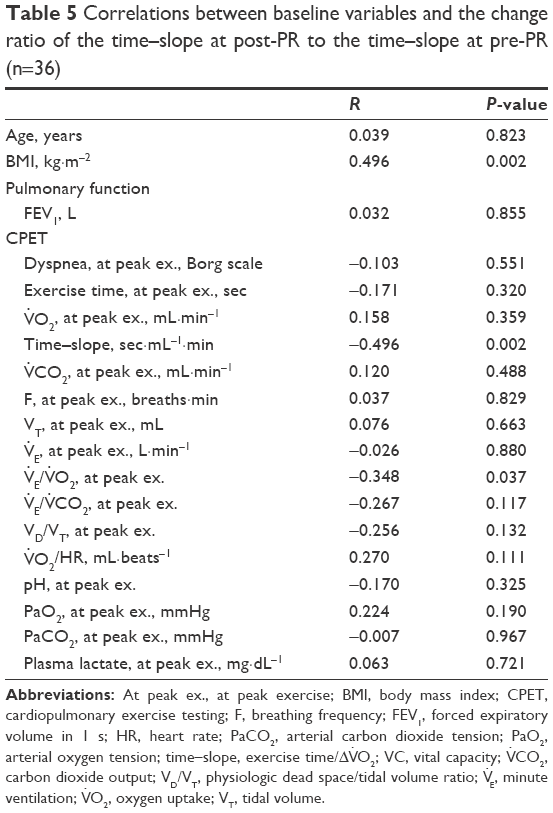 | Table 5 Correlations between baseline variables and the change ratio of the time–slope at post-PR to the time–slope at pre-PR (n=36) |
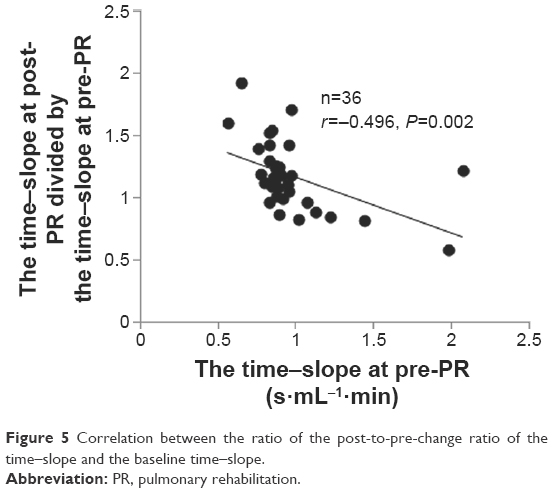 | Figure 5 Correlation between the ratio of the post-to-pre-change ratio of the time–slope and the baseline time–slope. |
Discussion
This study shows that 1) in half of the COPD patients in the present study, PR increased Tex, but reduced peak O2. The effectiveness of PR might lie in improving Tex rather than exercise tolerance. As one of the key mechanisms, both required O2 and CO2 were reduced during exercise after PR, resulting in reduced ventilatory requirements without cardiac loads, which in turn might make it possible to exercise more efficiently for a long time with decreasing dyspnea. The exertional improvement was reflected in increases of E/O2 and E/CO2, and the decreases of VD/VT and ΔFO2 (the difference between the inspired gas oxygen concentration and expired gas oxygen concentration), and 2) the relationship between baseline variables and the post-to-pre-change ratio of the time–slope was investigated. A significant negative correlation with the baseline time–slope and a positive correlation with the baseline BMI were obtained, which could help predict COPD patients’ response to PR.
The most striking evidence is that PR increased Tex with economized O2 and CO2 during exercise in half of the present study population, although it has been clearly demonstrated that PR increases exercise tolerance in COPD patients.1,3,4 In the time only increased group, the E was reduced after PR at peak exercise, and both O2 and CO2 were also reduced during exercise, resulting in increases of the E/O2 ratio and the E/CO2 ratio. This phenomenon was different from the data that were evaluated by Casaburi et al1 using incremental exercise testing in severe COPD. The E/O2 ratio and E/CO2 ratio, both of which have been used to evaluate the degree of disease or the effect of interventions in COPD, have again been investigated with interest.15–18 To investigate what is meant by the high ventilatory equivalent ratios obtained during exercise after PR, the factors that contribute to the change in the numerator (the reduced E) and the change in the denominator (the reduced O2 and CO2) should be considered, taking into account some mechanisms. First, generally, high ventilatory equivalent ratios are obtained when wasted ventilation occurs. In this study, however, a reduced ventilatory requirement was obtained after PR. This phenomenon may be explained by the finding at peak exercise that, although compared with the two factors increased group, the mean difference from pre-PR in VT was lower in the time only increased group (P=0.043), the reduced mean difference in breathing frequency was similar in the two groups (Table 3). Furthermore, of note, despite the high ventilatory equivalent ratios, relatively low VD/VT ratios during exercise were obtained after PR in the time only-increased group. The mean difference in the VD/VT ratio was similar in the two groups after PR during CPET (Tables 3 and 4). Second, the timing during CPET at which the ventilatory requirement ratios were evaluated should also be confirmed, considering its lowest value (nadir) in the hyperbolic curve. Since Neder et al17 reported that the nadir values were reached at peak exercise in all GOLD stage III and IV patients, it might mean that evaluation for ventilatory requirement ratios might be enough at peak exercise in such a group. In this study, however, at peak exercise as well as at iso-time, the higher ventilatory equivalent ratios obtained were similar. In addition, it should be confirmed whether they stopped exercise far before the assumed nadir. In this study, the Tex after PR was prolonged enough in each group, and the level of dyspnea was similar in the two groups; that is, these data do not show that higher ventilatory equivalent ratios were obtained due to too short Tex. Third, high ventilatory equivalent ratios were also reported in patients with cardiac disease, which decreases cardiac output.19 However, there may be no clinically significant difference in cardiac function between the two groups, since after PR, the peak HR and the ratio of observed peak HR to predicted peak HR were similar in both groups. Fourth, O2 is determined by analysis of expired gas, including FiO2 and FeO2. ΔFO2 (FiO2 minus FeO2) was investigated as an outcome variable in this study. After PR, a significant reduction in ΔFO2 was obtained in the time only increased group during exercise (Tables 3 and 4; Figure 4). This phenomenon means that, because the level of FiO2 is generally constant, the level of FeO2 was increased after PR, that is, lesser oxygen could not only be achieved, but it was adequate for exercise in the time only increased group, given that the ventilatory requirements were reduced without significant cardiac loads, as discussed earlier. If so, the reasons why higher ventilatory equivalent ratios were obtained might include a reduced metabolic requirement, for example, by peripheral skeletal muscles, for a given exercise, resulting in the economized O2 followed by the resultant economized CO2.
Not only cardioventilatory dysfunction but also muscle dysfunction might explain exercise intolerance as a major consequence of COPD. It has been reported that a shift from type I (slow-twitch) fibers to type II (fast-twitch) fibers occurs commonly in advanced COPD.20 It was reported that, after PR, the proportion of type IIb fibers decreased in COPD patients, and the proportion of type I fibers increased, especially in non-cachectic COPD patients.21 Of note, using neuromuscular blockade to block type I fibers, Krustrup et al22 demonstrated that type II-dominant fibers, which were obtained after blocking type I fibers, required higher muscle O2. These reports might help to understand the findings that the O2 and CO2 were economized after PR in the time only increased group, if PR could increase the proportion of type I fibers. In addition to the exercise responses, from the resting condition, a higher ventilatory equivalent ratio was confirmed in the time only increased group (Tables 3 and 4; Figure 4); that is, there may have been a reduced peripheral oxygen requirement from the resting condition. Furthermore, it was also reported that muscle capillarity, which is related to blood flow and oxygen delivery, was reduced in advanced COPD, and PR increased capillarity.21,23 Given the above findings, the phenomena in this study might be explained by the theory that an economized peripheral oxygen requirement at a given exercise might probably occur because of the change in a fiber-type profile and/or the peripheral oxygen delivery PR might induce, which in turn might be followed by the resultant economized carbon dioxide elimination. Additional studies are needed to confirm this theory.
Investigating the predictors of the response to PR may be clinically useful. Figure 2 shows whether exercise tolerance improved and that Tex was prolonged in the present population; both of which seem independent, but they are clinically important outcomes.9 In this study, the post-to-pre-change rate of the time–slope was negatively correlated with the baseline time–slope and positively correlated with BMI, which in turn, importantly, was not correlated with baseline Tex or baseline peak O2 alone (Table 5, Figure 5). This means that underweight patients who have a high baseline time–slope might gain less benefit from PR based on whether their baseline exercise tolerances or Tex were or were not adequate. It has been reported that the obtained value of peak O2 during CPET was almost the same with different exercise loads in severe COPD, that is, the slopes of O2–Tex were different.24,25 Therefore, more attention needs to be given to the ratio between Tex and ΔO2 during exercise, and further studies should be conducted using different exercise loads to assess the benefit of PR. Nevertheless, the time–slope would potentially contribute to predicting the degree of the PR response beforehand.
This study had some limitations. First, this study was retrospective, and the number of subjects was small. A large prospective study should be conducted. Second, the duration of PR including exercise training was short. A more effective exercise training program, considering its duration, intensity, and frequency, should be explored in the future. Third, this study was primarily performed in patients with severe-to-very severe airflow limitation. Whether the present findings hold true for the total spectrum of COPD patients, evaluating not only cardioventilatory function but also peripheral oxygen delivery function, as in skeletal muscle, should be investigated and recommended as a future research direction in the field of PR.
Conclusion
As one of the key mechanisms, by which the effect of PR on Tex rather than exercise tolerance was confirmed in half of the COPD patients in this study, both O2 and CO2 were economized during exercise after PR, resulting in a reduced ventilatory requirement without cardiac loads, followed by decreasing dyspnea. The exertional improvement was reflected in 1) the increases of E/O2 and E/CO2 and 2) the decreases of VD/VT and the difference between the inspired gas oxygen concentration and expired gas oxygen concentration. In addition, the time–slope and BMI would potentially contribute as predictors of the response to PR beforehand. A better understanding of the physiologic benefits of PR will lead to more appropriate treatment that will improve exercise tolerance, as well as quality of life, by increasing physical activity levels.
Acknowledgments
The authors received no specific funding for this study. The authors would like to thank Mr K Tsuguchi (CMIC-PMS Co., Ltd, Tokyo, Japan), who had no relevant conflicts of interest, for performing the statistical analysis. The authors would also like to thank Ms S Ito and Ms S Sakaguchi for their help with the CPET measurements.
Disclosure
The authors report no conflicts of interest in this work.
References
Casaburi R, Porszasz J, Burns MR, Carithers ER, Chang RS, Cooper CB. Physiologic benefits of exercise training in rehabilitation of patients with severe chronic obstructive pulmonary disease. Am J Respir Crit Care Med. 1997;155(5):1541–1551. | ||
Celli BR, Decramer M, Wedzicha JA, et al; ATS/ERS Task Force for COPD Research. An official American Thoracic Society/European Respiratory Society statement: research questions in COPD. Eur Respir J. 2015;45(4):879–905. | ||
Laveneziana P, Palange P; ERS Research Seminar Faculty. Physical activity, nutritional status and systemic inflammation in COPD. Eur Respir J. 2012;40(3):522–529. | ||
Spruit MA, Singh SJ, Garvey C, et al. An official American Thoracic Society/European Respiratory Society statement: key concepts and advances in pulmonary rehabilitation. Am J Respir Crit Care Med. 2013;188(8):e13–e64. | ||
Garrod R, Ford K, Daly C, Hoareau C, Howard M, Simmonds C. Pulmonary rehabilitation: analysis of a clinical service. Physiother Res Int. 2004;9(3):111–120. | ||
Mahler DA, Ward J, Mejia-Alfaro R. Stability of dyspnea ratings after exercise training in patients with COPD. Med Sci Sports Exerc. 2003;35(7):1083–1087. | ||
Porszasz J, Emtner M, Goto S, Somfay A, Whipp BJ, Casaburi R. Exercise training decreases ventilatory requirements and exercise-induced hyperinflation at submaximal intensities in patients with COPD. Chest. 2005;128(4):2025–2034. | ||
Puente-Maestu L, Sanz ML, Sanz P, Ruíz de Oña JM, Rodríguez-Hermosa JL, Whipp BJ. Effects of two types of training on pulmonary and cardiac responses to moderate exercise in patients with COPD. Eur Respir J. 2000;15(6):1026–1032. | ||
Neder JA, Jones PW, Nery LE, Whipp BJ. Determinants of the exercise endurance capacity in patients with chronic obstructive pulmonary disease. The power-duration relationship. Am J Respir Crit Care Med. 2000;162(2 Pt 1):497–504. | ||
Nery LE, Wasserman K, Andrews JD, Huntsman DJ, Hansen JE, Whipp BJ. Ventilatory and gas exchange kinetics during exercise in chronic airways obstruction. J Appl Physiol Respir Environ Exerc Physiol. 1982;53(6):1594–1602. | ||
Palange P, Forte S, Onorati P, et al. Effect of reduced body weight on muscle aerobic capacity in patients with COPD. Chest. 1998;114(1): 12–18. | ||
Global Initiative for Chronic Obstructive Lung Disease. GOLD 2017 Global Strategy for the Diagnosis, Management and Prevention of COPD. Available form: http://goldcopd.org/gold-2017-global-strategy-diagnosis-management-prevention-copd/. Accessed February 25, 2017. | ||
Miki K, Maekura R, Hiraga T, et al. Acidosis and raised norepinephrine levels are associated with exercise dyspnoea in idiopathic pulmonary fibrosis. Respirology. 2009;14(7):1020–1026. | ||
Maekura R, Hiraga T, Miki K, et al. Personalized pulmonary rehabilitation and occupational therapy based on cardiopulmonary exercise testing for patients with advanced chronic obstructive pulmonary disease. Int J Chron Obstruct Pulmon Dis. 2015;10:1787–1800. | ||
Elbehairy AF, Ciavaglia CE, Webb KA, et al. Pulmonary gas exchange abnormalities in mild chronic obstructive pulmonary disease. Implications for dyspnea and exercise intolerance. Am J Respir Crit Care Med. 2015;191(12):1384–1394. | ||
Neder JA, Alharbi A, Berton DC, et al. Exercise ventilatory inefficiency adds to lung function in predicting mortality in COPD. COPD. 2016;13(4):416–424. | ||
Neder JA, Arbex FF, Alencar MC, et al. Exercise ventilatory inefficiency in mild to end-stage COPD. Euro Respir J. 2015;45(2):377–387. | ||
Puente-Maestu L, Palange P, Casaburi R, et al. Use of exercise testing in the evaluation of interventional efficacy: an official ERS statement. Eur Respir J. 2016;47(2):429–460. | ||
Sullivan MJ, Cobb FR. The anaerobic threshold in chronic heart failure. Relation to blood lactate, ventilatory basis, reproducibility, and response to exercise training. Circulation. 1990;81(1 Suppl):II47–II58. | ||
Maltais F, Decramer M, Casaburi R, et al. An official American Thoracic Society/European Respiratory Society statement: update on limb muscle dysfunction in chronic obstructive pulmonary disease. Am J Respir Crit Care Med. 2014;189(9):e15–e62. | ||
Vogiatzis I, Simoes DC, Stratakos G, et al. Effect of pulmonary rehabilitation on muscle remodelling in cachectic patients with COPD. Eur Respir J. 2010;36(2):301–310. | ||
Krustrup P, Secher NH, Relu MU, Hellsten Y, Söderlund K, Bangsbo J. Neuromuscular blockade of slow twitch muscle fibres elevates muscle oxygen uptake and energy turnover during submaximal exercise in humans. J Physiol. 2008;586(24):6037–6048. | ||
Saey D, Michaud A, Couillard A, et al. Contractile fatigue, muscle morphometry, and blood lactate in chronic obstructive pulmonary disease. Am J Respir Crit Care Med. 2005;171(10):1109–1115. | ||
Benzo RP, Paramesh S, Patel SA, Slivka WA, Sciurba FC. Optimal protocol selection for cardiopulmonary exercise testing in severe COPD. Chest. 2007;132(5):1500–1505. | ||
Puente-Maestu L, Garcia de Pedro J, Martinez-Abad Y, Ruíz de Oña JM, Llorente D, Cubillo JM. Dyspnea, ventilatory pattern, and changes in dynamic hyperinflation related to the intensity of constant work rate exercise in COPD. Chest. 2005;128(2):651–656. |
 © 2017 The Author(s). This work is published and licensed by Dove Medical Press Limited. The full terms of this license are available at https://www.dovepress.com/terms.php and incorporate the Creative Commons Attribution - Non Commercial (unported, v3.0) License.
By accessing the work you hereby accept the Terms. Non-commercial uses of the work are permitted without any further permission from Dove Medical Press Limited, provided the work is properly attributed. For permission for commercial use of this work, please see paragraphs 4.2 and 5 of our Terms.
© 2017 The Author(s). This work is published and licensed by Dove Medical Press Limited. The full terms of this license are available at https://www.dovepress.com/terms.php and incorporate the Creative Commons Attribution - Non Commercial (unported, v3.0) License.
By accessing the work you hereby accept the Terms. Non-commercial uses of the work are permitted without any further permission from Dove Medical Press Limited, provided the work is properly attributed. For permission for commercial use of this work, please see paragraphs 4.2 and 5 of our Terms.