")
Back to Journals » Clinical Interventions in Aging » Volume 12
Psychometric properties of the Persian version of Social Adaptation Self-evaluation Scale in community-dwelling older adults
Authors Farokhnezhad Afshar P , Foroughan M, Vedadhir A, Ghazi Tabatabaie M
Received 4 December 2016
Accepted for publication 9 February 2017
Published 27 March 2017 Volume 2017:12 Pages 579—584
DOI https://doi.org/10.2147/CIA.S129407
Checked for plagiarism Yes
Review by Single anonymous peer review
Peer reviewer comments 2
Editor who approved publication: Dr Richard Walker
Pouya Farokhnezhad Afshar,1 Mahshid Foroughan,1 AbouAli Vedadhir,2 Mahmood Ghazi Tabatabaie2
1Department of Gerontology, Iranian Research Center On Aging, University of Social Welfare and Rehabilitation Sciences, Tehran, Iran; 2Department of Anthropology, Faculty of Social Sciences, University of Tehran, Tehran, Iran
Introduction: The Social Adaptation Self-evaluation Scale (SASS) is used to measure social function and social motivation in depressed patients. There is little attention to social function in the treatment of depression. The aim of this study was to assess the validity and reliability of the Persian version of SASS (P-SASS) for older adults.
Participants and methods: This is a cross-sectional and methodological study. The participants were 550 community-dwelling older adults living in Tehran who were selected randomly from the primary health care centers. To assess the psychometric properties of SASS, we first did translation and cross-cultural adjustment on SASS and then used P-SASS and the Geriatric Depression Scale (GDS) for gathering data. A number of analyses, including Pearson’s correlation, exploratory factor analysis, and Cronbach’s α, and receiver operating characteristic curve were used to manage the data with the IBM SPSS Statistics V.22.
Results: The mean age of the participants was 66.09±6.67 years, and 58.9% of them were male. The Cronbach’s α was 0.97. The test–retest reliability correlation coefficient was 0.78. Principal component analysis showed that P-SASS consists of two components. P-SASS score showed a significant negative correlation with GDS (r=-0.91, P<0.01), which suggests good convergent validity. The P-SASS cutoff point was 28 (sensitivity: 0.97 and specificity: 0.94).
Conclusion: P-SASS has good reliability and validity for older adults. So, it can be considered as an appropriate tool to evaluate the social function and social motivation of older persons with and without depression.
Keywords: reliability, validity, Social Adaptation Self-evaluation Scale, older adult, social function
Introduction
In recent decades, the decline in fertility and mortality rates has led to a worldwide increase in population aging.1 Population aging is rapidly becoming a global issue.2 The number of older people (aged ≥65 years) was ~590 million at the end of the last century.3 It is expected that the older population will reach 1.2 billion by the year 2025.4
The physical and mental health comorbidities increase with age.5 Depression is a common problem in later life. There are various estimates of the prevalence of depression in the older population; ~1%–10% of community-dwelling older adults have symptoms of depression.6–9
The cause of depression in older adults is still not well understood.10 The risk factors for depression in older adults have been categorized into the following three groups: biological factors (such as genetics, medical conditions, and age-related changes), psychological factors (such as personality and unusual sleep patterns), and social factors (such as retirement and social isolation).7 Biochemical changes such as decreased serotonin, dopamine, and norepinephrine levels occur in the normal brain aging process.11 Various chronic illnesses are also major depression risk factors in older adults (eg, arthritis, cardiac disease, and cancer).12 In contrast, some serious psychosocial changes occur during aging, which can profoundly alter the life routines and activities, and they are challenges for older people (eg, retirement).10,13 Retirement is usually an age-related life event that has a great impact on activity patterns, social networks, and financial resources of people.14 It reduces the person’s social interactions, as well as physical activities, and increases the risk of social isolation and depression.9 A nonvoluntary retirement induces the sense of losing control and can lead to higher anxiety and lower self-esteem in the person.15 It has been shown that retirement is associated with the feeling of loss and chronic depression.16
There are a variety of tools for the screening of depression in older people, such as the Geriatric Depression Scale (GDS) and the Patient Health Questionnaire-9 (PHQ-9).9 Currently, in the clinical settings, the most emphasis is put on the pharmacological treatments of depressive symptoms and less attention is given to the interventions promoting social function and social motivation,17,18 whereas social function impairment is one of the most important depression consequences in older adults.19
Mental illnesses lead to impaired function. There are various scales to measure functional status.20 Social motivation predicts social behaviors and function.17,21 Social function reflects the people’s ability to interact with their surroundings and their ability to perform their roles successfully. Hence, impaired social functioning is one of the most important aspects of depression and needs to be assessed carefully, along with social motivation. This assessment may act as a preliminary step for designing and implementing appropriate interventions and monitoring their effectiveness.21
Bosc et al22 developed a 20-item scale to assess social motivation and behavior. They called it Social Adaptation Self-evaluation Scale (SASS). Later, it was found that SASS is also sensitive to changes in social function.18 SASS assesses social motivation and social behavior in the following multiple domains:23 job interest or homework interest, work enjoyment, interest in hobbies, quality of spare time, family-seeking behavior, family relationship quality, gregariousness, relationship-seeking behavior, external relationship quality, external relationship appreciation, social attractiveness, social compliance, community involvement, social inquisitiveness, intellectual interest, communication difficulties, rejection sensitivity, vainness, difficulties in coping with resources, and control of surroundings.
The score for each question is between 0 and 3; the minimum score is 0 and the maximum score is 60. Higher scores demonstrate a healthier social function. In the original study, it was found that SASS had just one component. The Cronbach’s α coefficient was 0.74, and test–retest reliability showed no significant difference between the first and second SASS releases (P>0.05).22
In this study, our aim was to evaluate the reliability and validity of the Persian version of SASS (P-SASS) in community-dwelling older adults residing in the metropolitan of Tehran.
Participants and methods
This is a cross-sectional and methodological study that was conducted between September 2015 and March 2016. Reasons for choosing Tehran as the research setting were as follows: maximum ethnocultural diversity and the use of Persian language as the main medium of verbal communication in this metropolis (regardless of the different accents and dialects).
Participants
The participants included community-dwelling older adults (aged ≥60 years) who were living in Tehran and receiving health care services from primary health care centers. There are 110 primary health centers in Tehran that are working under the supervision of the Medical Universities. We randomly selected 40 centers. The participants were chosen randomly from among those who were referred to primary health care centers. The sample size was 550 people. All participants gave informed written consent (this study was a part of another more comprehensive study). It was approved by the Ethics Committee of the University of Social Welfare and Rehabilitation Sciences in Tehran during April to December 2015 (Ref. IR.USWR.REC.1394.1). The participants were given all the necessary information about the aims and the process of study and informed of their rights to stay or leave the study whenever they wanted. Then, they were asked to fill out the questionnaires. These questionnaires included SASS and the GDS.
Tools
We translated the SASS into Persian based on the translation model of the Chinese version of SASS.17 First, the SASS was translated into Persian by a translator, who was fluent in both Persian and English. Then, another expert translator did a back translation from Persian to English. Items of both versions (original and back translated) were compared and revised by the research team and a psychologist unfamiliar with SASS. The research team revised the items in such a way that would be compatible with the social and cultural norms of Iran. Finally, the Persian version of the scale was evaluated in terms of reliability and validity.
We used the Persian version of the GDS for convergent and discriminant validity using the known-group approach. The 15-item GDS has been validated in Iran previously. The Cronbach’s α was 0.90. The test–retest correlation coefficient was 0.58 after 2 weeks. A cutoff point of 8 was obtained with sensitivity and specificity of 0.90 and 0.84, respectively.24 In this study, the Cronbach’s α of the scale equaled 0.92.
Statistical analysis
For data management and analysis, IBM SPSS Statistics V.22 was used. The exploratory factor analyses were used for evaluating construct validity, and the Pearson’s correlation coefficient was used for evaluating convergent validity. Reliability is measured with a test-retest correlation.
Results
Descriptive statistics
The mean age of the participants was 66.09±6.67 years (60–94 years). The sex ratio was 1.43 (324 men vs 226 women). Most of the participants were married (78.4%), 12% of them were single, 6.4% of them were divorced, and 3.2% of them were widowed. Education levels of the participants were as follows: 14.5% illiterate, 27.6% primary education, 22.2% secondary education, 26.5% national diploma, 4% college study, 3.8% bachelor degree, and 1.3% Master’s and PhD degrees. There were significant positive correlations between P-SASS and self-rated health and self-rated economic condition (Table 1).
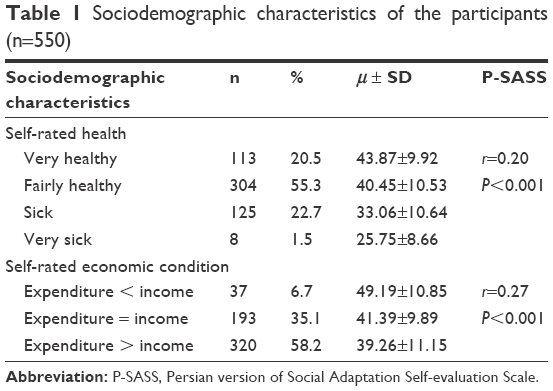 | Table 1 Sociodemographic characteristics of the participants (n=550) |
Construct validity
Exploratory factor analysis
We performed a principal component analysis (PCA) on the 20 items using Varimax orthogonal rotation for assessing the structural validity. Kaiser–Meyer–Olkin (KMO) tests of sampling adequacy and Bartlett tests of sphericity showed that the data were appropriate for exploratory factor analysis (KMO: 0.97, df: 190, P<0.001). The exploratory factor analysis demonstrated that the scale has two major components. The first component had eigenvalues =12.53, which explained 62.64% of the variance. The second component had eigenvalues =1.65, which explained 8.23% of the variance. Detailed results are shown in Tables 2 and 3 and Figure 1.
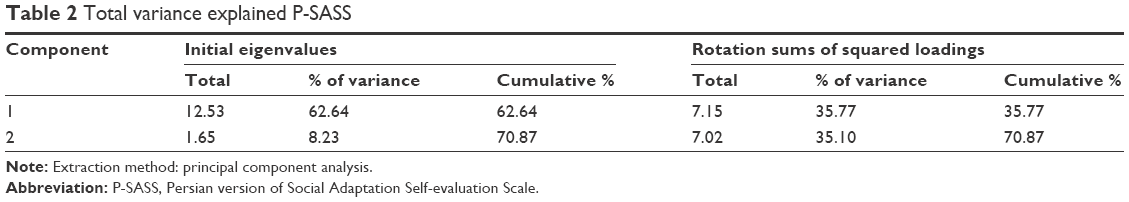 | Table 2 Total variance explained P-SASS |
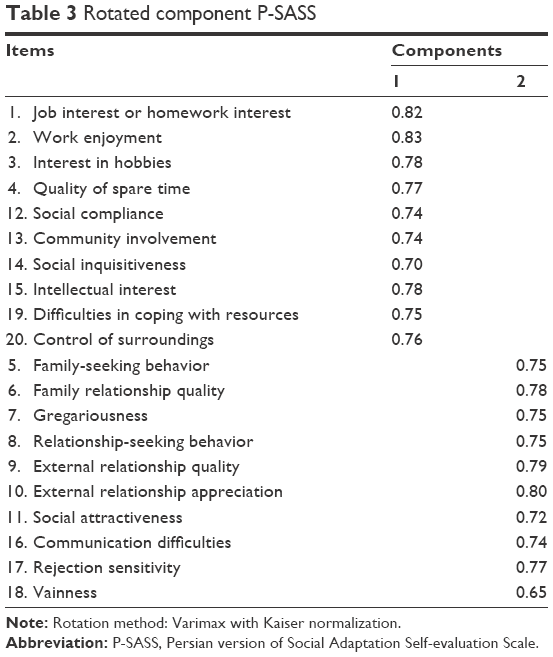 | Table 3 Rotated component P-SASS |
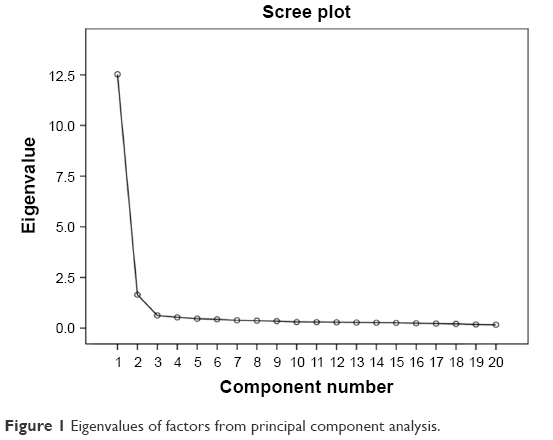 | Figure 1 Eigenvalues of factors from principal component analysis. |
Convergent and discriminant validity
The mean P-SASS total score was 39.26±11.15, and the mean GDS score was 5.91±3.01. The Pearson’s correlation analysis revealed that P-SASS has a significant negative relationship with GDS (r=−0.90, P<0.01). Table 4 shows the discriminant validity in the depressed and nondepressed people.
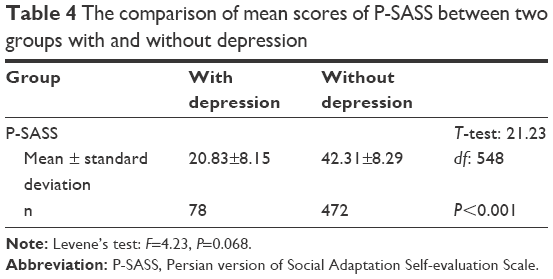 | Table 4 The comparison of mean scores of P-SASS between two groups with and without depression |
Reliability
To assess the reliability of the scale, an internal consistency approach was taken. It was assessed using the Cronbach’s α coefficient. In total, the Cronbach's α was 0.97. The Cronbach’s α of components 1 and 2 were 0.96 and 0.95, respectively. Table 5 demonstrates Cronbach’s α coefficient for each item. The Pearson’s correlation coefficient for test–retest reliability was 0.78 after 2 weeks (P<0.001).
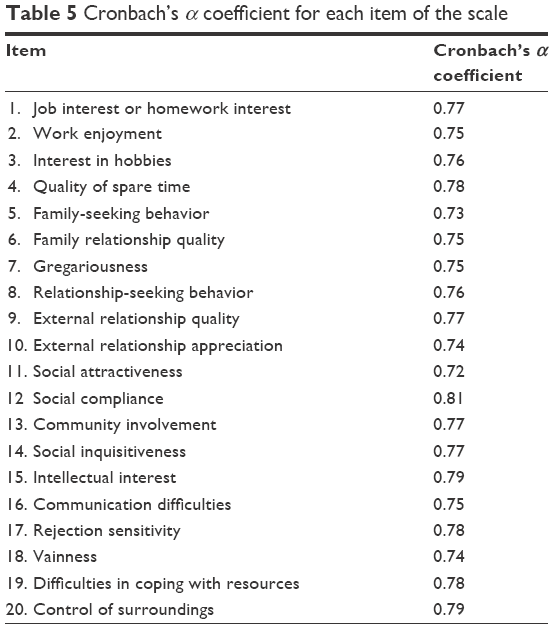 | Table 5 Cronbach’s α coefficient for each item of the scale |
Cutoff point
According to the receiver operating characteristic curve, the cutoff point was 27–28 with sensitivity and specificity measures 0.97 and 0.94, respectively (positive predictive value =0.98, negative predictive value =0.84) (Figure 2 and Table 6).
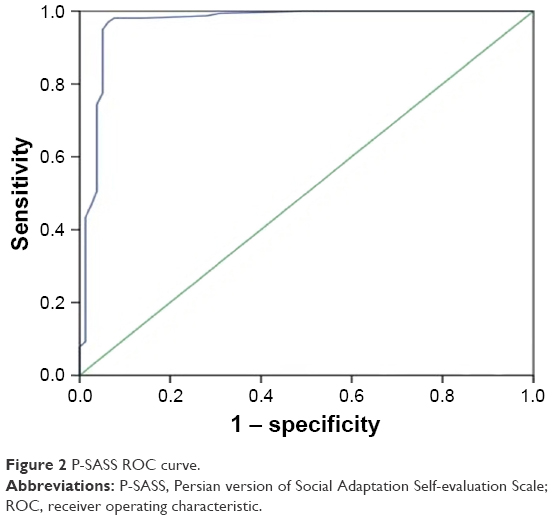 | Figure 2 P-SASS ROC curve. |
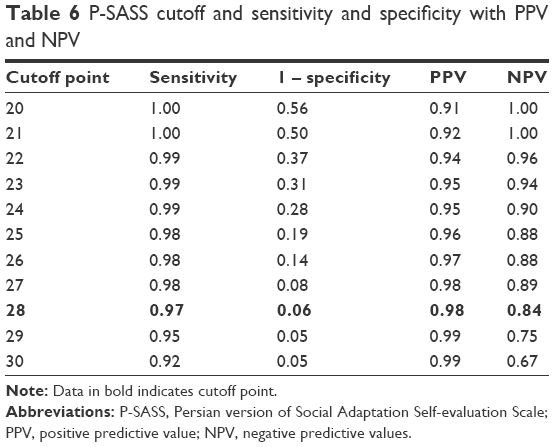 | Table 6 P-SASS cutoff and sensitivity and specificity with PPV and NPV |
Discussion
This study revealed that the P-SASS has good psychometric properties. The calculated Cronbach’s α (0.97) suggested a very good internal consistency of the P-SASS and was similar to the findings of other studies (0.74–0.97).17,18,22
There was a significant negative correlation between P-SASS and GDS; this means that with the increase in GDS scores, the P-SASS scores decrease. Ueda et al18 and Tse and Bond17 also found that the Beck Depression Inventory score has a significant negative correlation with SASS score. There was a significant difference in P-SASS scores between the two groups (with and without depression) (P<0.001); Levene’s test results indicate the relative equality of variance between the two groups. This finding showed appropriate discriminant validity.
In this study, the optimal cutoff point was 27–28. The cutoff point in the original study was 35.22 Ueda et al18 reported a cutoff point of 25–26 in Japanese version SASS (12). These differences could be related to the differences in age structure of the study populations and their sociocultural contexts too. Also, the use of different tools could be another reason to explain the differences (in this study, we used the GDS and not Beck Depression Inventory).
The PCA showed that the Persian version of SASS (P-SASS) has two components. Bosc et al found that SASS has three components, but they only considered one component because the first component explained the higher variance (32% versus 8% and 5%).22 Bech et al25 reported that SASS has three factors. In a study of Tse and Bond, the PCA showed that Chinese-SASS had the following two components: the first component explained ~65% of the variance and the second component explained 5% of the variance. Hence, the second component included just one item; Tse and Bond17 suggested that the SASS has one component. In this study, the first component and the second component explained 62.64 and 8.23% of the variance, respectively; and each factor had 10 items. Accordingly, we called the first component as the “activities quality” and the second component as the “relationships quality” and proposed that P-SASS has two factors.
In this study, it was found that social function correlated with health status and economic conditions. Low socioeconomic status is associated with mental disorders (eg, anxiety and depression).5,26 Socioeconomic status affects social networks, social relations, control of surrounding, and well-being.27,28 Therefore, a low socioeconomic status leads to a decrease in social function. Cheng et al (2002)29 obtained similar results in older adults.
Conclusion
The P-SASS is a suitable instrument for evaluating social function in older adults. P-SASS has two factors and good internal consistency and stability. P-SASS has a good sensitivity and specificity for the cutoff point of 27–28.
A limitation of our study was the small number of depressed people in this study. We used the GDS to assess the validity of P-SASS. It is suggested that the SASS be evaluated by clinical diagnosis.
Acknowledgment
The research team appreciates the older adults and health care officials who helped us in conducting this research.
Disclosure
The authors report no conflicts of interest in this work.
References
Prettner K. Population aging and endogenous economic growth. J Popul Econ. 2013;26(2):811–834. | ||
Kowal P, Chatterji S, Naidoo N, et al. Data resource profile: the World Health Organization Study on global AGEing and adult health (SAGE). Int J Epidemiol. 2012;41(6):1639–1649. | ||
Afshar PF, Asgari P, Shiri M, Bahramnezhad FA. Review of the Iran’s elderly status according to the census records. Galen Med J. 2016;5(1):1–6. | ||
Liu Y-E, Norman IJ, While AE. Nurses’ attitudes towards older people: a systematic review. Int J Nurs Stud. 2013;50(9):1271–1282. | ||
Barnett K, Mercer SW, Norbury M, Watt G, Wyke S, Guthrie B. Epidemiology of multimorbidity and implications for health care, research, and medical education: a cross-sectional study. Lancet. 2012;380(9836):37–43. | ||
Luppa M, Sikorski C, Luck T, et al. Age-and gender-specific prevalence of depression in latest-life–systematic review and meta-analysis. J Affect Disord. 2012;136(3):212–221. | ||
Rodda J, Boyce N, Walker Z. The Old Age Psychiatry Handbook. 1th ed. England: John Wiley & Sons; 2008. | ||
Spar JE, La Rue A. Clinical Manual of Geriatric Psychiatry. 1st ed. Arlington, VA: American Psychiatric Publishing; 2007. | ||
Fillit HM, Rockwood K, Woodhouse K. Brocklehurst’s Textbook of Geriatric Medicine and Gerontology. 7th ed. Philadelphia: Elsevier Health Sciences; 2010. | ||
Gareri P, De Fazio P, De Sarro G. Neuropharmacology of depression in aging and age-related diseases. Ageing Res Rev. 2002;1(1):113–134. | ||
Meltzer CC, Smith G, DeKosky ST, et al. Serotonin in aging, late-life depression, and Alzheimer’s disease: the emerging role of functional imaging. Neuropsychopharmacology. 1998;18(6):407–430. | ||
Bisschop MI, Kriegsman DM, Deeg DJ, Beekman AT, van Tilburg W. The longitudinal relation between chronic diseases and depression in older persons in the community: the Longitudinal Aging Study Amsterdam. J Clin Epidemiol. 2004;57(2):187–194. | ||
Settersten RA, Angel JL. Handbook of Sociology of Aging. 1st ed. New York: Springer; 2011. | ||
Wang M. The Oxford Handbook of Retirement. New York: Oxford University Press; 2012. | ||
van der Heide I, van Rijn RM, Robroek SJ, Burdorf A, Proper KI. Is retirement good for your health? A systematic review of longitudinal studies. BMC Public Health. 2013;13(1):1–11. | ||
Kendler KS, Karkowski LM, Prescott CA. Causal relationship between stressful life events and the onset of major depression. Am J Psychiatry. 1999;156(6):837–841. | ||
Tse WS, Bond AJ. Psychometric analysis of the Chinese version of Social Adaptation Self-evaluation Scale (C-SASS). Psychiatry Res. 2007;153(3):277–281. | ||
Ueda N, Suda A, Nakagawa M, et al. Reliability, validity and clinical utility of a Japanese version of the Social Adaptation Self-evaluation Scale as calibrated using the Beck Depression Inventory. Psychiatry Clin Neurosci. 2011;65(7):624–629. | ||
Keller M. Role of serotonin and noradrenaline in social dysfunction: a review of data on reboxetine and the Social Adaptation Self-evaluation Scale (SASS). Gen Hosp Psychiatry. 2001;23(1):15–19. | ||
Weissman MM, Olfson M, Gameroff MJ, Feder A, Fuentes M. A comparison of three scales for assessing social functioning in primary care. Am J Psychiatry. 2001;158(3):460–466. | ||
Bosc M. Assessment of social functioning in depression. Compr Psychiatry. 2000;41(1):63–69. | ||
Bosc M, Dubini A, Polin V. Development and validation of a social functioning scale, the Social Adaptation Self-evaluation Scale. Eur Neuropsychopharmacol. 1997;7(1):S57–S70. | ||
Dubini A, Bosc M, Polin V. Do noradrenaline and serotonin differentially affect social motivation and behaviour? Eur Neuropsychopharmacol. 1997;7(1):S49–S55. | ||
Malakouti K, Fathollahi P, Mirabzadeh A, Salavati M, Kahani S. Validation of Geriatric Depression Scale (GDS-15) in Iran. Res Med. 2006;30(4):361–369. | ||
Bech P, Lunde M, Undén M. Social Adaptation Self-evaluation Scale (SASS): psychometric analysis as outcome measure in the treatment of patients with major depression in the remission phase. Int J Psychiatry Clin Pract. 2002;6(3):141–146. | ||
Miech RA, Caspi A, Moffitt TE, Wright BRE, Silva PA. Low socioeconomic status and mental disorders: a longitudinal study of selection and causation during young adulthood. Am J Sociol. 1999;104(4):1096–1131. | ||
Ajrouch KJ, Blandon AY, Antonucci TC. Social networks among men and women: the effects of age and socioeconomic status. J Gerontol B Psychol Sci Soc Sci. 2005;60(6):S311–S317. | ||
Pinquart M, Sörensen S. Influences of socioeconomic status, social network, and competence on subjective well-being in later life: a meta-analysis. Psychol Aging. 2000;15(2):187–224. | ||
Cheng Y, Chi I, Boey K, Ko L, Chou K. Self-rated economic condition and the health of elderly persons in Hong Kong. Soc Sci Med. 2002;55(8):1415–1424. |
 © 2017 The Author(s). This work is published and licensed by Dove Medical Press Limited. The full terms of this license are available at https://www.dovepress.com/terms.php and incorporate the Creative Commons Attribution - Non Commercial (unported, v3.0) License.
By accessing the work you hereby accept the Terms. Non-commercial uses of the work are permitted without any further permission from Dove Medical Press Limited, provided the work is properly attributed. For permission for commercial use of this work, please see paragraphs 4.2 and 5 of our Terms.
© 2017 The Author(s). This work is published and licensed by Dove Medical Press Limited. The full terms of this license are available at https://www.dovepress.com/terms.php and incorporate the Creative Commons Attribution - Non Commercial (unported, v3.0) License.
By accessing the work you hereby accept the Terms. Non-commercial uses of the work are permitted without any further permission from Dove Medical Press Limited, provided the work is properly attributed. For permission for commercial use of this work, please see paragraphs 4.2 and 5 of our Terms.