")
Back to Journals » Neuropsychiatric Disease and Treatment » Volume 16
Psychometric Properties of the Chinese Version of the Intolerance of Uncertainty Inventory in Chinese College Students
Authors Li S, Yang F, Li P, Wang X , Dai J, Deng Y
Received 19 June 2020
Accepted for publication 12 September 2020
Published 29 October 2020 Volume 2020:16 Pages 2579—2589
DOI https://doi.org/10.2147/NDT.S268313
Checked for plagiarism Yes
Review by Single anonymous peer review
Peer reviewer comments 2
Editor who approved publication: Dr Jun Chen
Siya Li,1 Feilong Yang,2 Peihuan Li,1 Xiang Wang,3 Ji Dai,4 Yunlong Deng1,2
1Department of Clinical Psychology, The Third Xiangya Hospital, Central South University, Changsha, Hunan 410013, People’s Republic of China; 2Psychosomatic Health Institute, The Third Xiangya Hospital, Central South University, Changsha, Hunan 410013, People’s Republic of China; 3Medical Psychological Center, The Second Xiangya Hospital, Central South University, Changsha, Hunan 410011, People’s Republic of China; 4Mental Health Education Center, Hunan University of Technology and Business, Changsha, Hunan 410205, People’s Republic of China
Correspondence: Yunlong Deng
Department of Clinical Psychology, The Third Xiangya Hospital, Central South University, No. 138 Tongzipo Road, Yuelu District, Changsha, Hunan 410013, People’s Republic of China
Tel +86 18975186178
Fax +86 731 88618487
Email [email protected]
Background: Intolerance of uncertainty (IU) is considered to be associated with emotional disorders, such as generalized anxiety disorder (GAD), depression, obsessive compulsive disorder (OCD), and social anxiety. Therefore, a comprehensive instrument to measure IU is needed. The purposes of the present study were as follows: 1) developing a Chinese version of the Intolerance of Uncertainty Inventory (CIUI) and 2) measuring the reliability and validity of CIUI.
Methods: We translated the Intolerance of Uncertainty Inventory (IUI) into Chinese. A sample consisting of Chinese college students from three universities was used to evaluate the internal consistency, test–retest reliability, and validity of the CIUI. Participants answered the CIUI, IUS-12, GAD-7, BDI-II, and PSWQ. Exploratory factor analysis (EFA) and confirmatory factor analysis (CFA) were run to explore the factor structure of CIUI.
Results: The results demonstrated an acceptable internal consistency for CIUI (Part A of CIUI [CIUIA]: α = 0.920; Part B of CIUI [CIUIB]: α = 0.947) and test–retest reliability (CIUIA: ICC = 0.788; CIUIB: ICC = 0.859). The results of EFA and CFA all supported a two-factor structure for CIUIA (Intolerance of the unexpected and difficulty waiting in an uncertain situation and Intolerance of uncertainty and of uncertain situations) and a four-factor structure for CIUIB (Overestimation, Control, Uncertainty makes one feel stressful, and Reassurance), and acceptable validity was obtained.
Conclusion: The CIUI is an appropriate instrument for measuring IU in Chinese populations. Future studies should confirm the psychometric properties using a comprehensive sample.
Keywords: intolerance of uncertainty, reliability, validity, Chinese population
Introduction
Uncertainty can be seen everywhere in daily life. It cannot be completely avoided. Monat et al1 defined uncertainty as the period of anticipation prior to confrontation with a potentially harmful event. Available evidence support the idea that uncertainty is a powerful stressor with psychological and physiological consequences for the individual.2,3 Dugas et al4 defined intolerance of uncertainty (IU) as an excessive tendency of an individual to consider unacceptable the possibility that a negative event may occur, however small the probability of its occurrence. People who are intolerant of uncertainty may react negatively to uncertain situations and events on an emotional, cognitive, and behavioral level.5 However, individuals do not react to uncertainty on the same level because of the individual differences between them.6
The Role of IU
Researchers regard IU as a shared vulnerability factor for emotional disorders.2,7 IU has been demonstrated to have a strong relationship with worry, which is the hallmark symptom of generalized anxiety disorder (GAD).8 Even after controlling other factors related to worry, IU plays a unique role in worry.9,10 Considerable evidence has suggested that IU is related to GAD,11,12 obsessive compulsive disorder (OCD),13,14 social anxiety,15–17 panic disorder, and agoraphobia.18–20 Krohne21 suggested that intolerance of uncertain negative events might be a driving force behind some cognition and behaviors (eg, worry, compulsions, and reassurance seeking) related to anxiety disorders.
In addition to its association with various anxiety disorders, IU also plays an important role in depression.22–25 According to a study by Miranda and Mennin,26 symptoms of depression are linked to greater certainty in anticipating both negative future outcomes and an absence of positive future outcomes. Individuals who do not tolerate uncertainty of possible negative future events may need to eliminate uncertain outcomes by increasing the certainty of negative future events happening. It is possible that individuals who are intolerant of uncertainty use repetitive thinking, which is related to depression, to reduce their uncertainty. Furthermore, repetitive thought may promote deep processing of affect-relevant schemas and amplify affective states. The current literature also suggests that IU may act as a mediator24 and it may benefit to treatment of numerous emotional disorders.27
The Instruments to Measure IU
The Intolerance for Uncertainty Scale (IUS) is the most widely used instrument to measure uncertainty. It was developed by Freeston et al28 in France, and it contains 27 items. It is a self-report measurement assessing general emotional, cognitive, and behavioral reactions to ambiguous and uncertain situations. It has demonstrated excellent internal consistence (Cronbach’s α = 0.91), and its test–retest reliability is 0.78. Carleton et al29 developed a shorter version of IUS that contains 12 items. The IUS only measures the general reaction to uncertain situations, and it may bias the link between the structure of IU and anxiety disorders.30 Thus, a more comprehensive instrument for measuring IU is needed.
To solve the problems of IUS, Gosselin et al30 developed the Intolerance of Uncertainty Inventory (IUI) for a French sample. IUI is an instrument that measures not only general reactions to uncertainty but also the tendency to consider uncertainty as unacceptable. Emotional character items were excluded to avoid bias of construct measured and the association between IU and emotional problems. IUI consists of two parts: Part A (15 items) assesses the excessive tendency of an individual to consider uncertainty in life or the possibility that a negative event may occur as unacceptable. Part B (30 items) assesses six cognitive and behavioral manifestations or consequences of IU: overestimation of the probability that a negative event will occur, avoidance, worry, reassurance seeking, doubt, and control. Results have supported its good psychometric properties. The Cronbach’s α for Parts A and B were 0.92 and 0.96, respectively. The 5-week test–retest correlations were 0.76 and 0.75 for Part A and Part B, respectively. The IUI was replicated in an English sample.31 A unitary factor structure of IUIA and three-factor structure containing 20 items of IUIB were identified in this sample. In an Italian sample,32 a unidimensional structure for Part A and a bifactor model for Part B were identified. The reliability and validity of IUI has been proven by several versions. Furthermore, the IUI has been widely used in studies. However, there is currently no comprehensive instrument to measure uncertainty in China. Developing a Chinese version of IUI for the Chinese population would be useful and necessary.
The aim of our study was to 1) translate the English version of IUI into Chinese, 2) test the reliability and validity of the Chinese version of the Intolerance of Uncertainty Inventory (CIUI) in a Chinese sample, and 3) use a hierarchical regression model to assess the incremental validity of the subscales of IUI Part B for several dependent variables.
Methods
Participants
Convenience sampling was used to recruit participants from three universities in Hunan Province, China. We obtained the informed consent from participants and asked them to complete the questionnaire which included the needed scales. In all, 1300 undergraduate students participated, and 1230 undergraduate students completed the full questionnaire with no missing data. The effective return ratio was 94.6%. To test test–retest reliability, 90 students who completed the whole questionnaires at the first attempt were selected to measure the CIUI again after 3 weeks, and 82 completed the CIUI. The effective return ratio was 91.1%. Information about age and gender was obtained from all participants. The local ethics committee approved the research protocol, and the study was conducted in accordance with the Declaration of Helsinki.
Measures
The Chinese Version of IUI
The original IUI consists of two parts: Part A, containing 15 items that assess excessive tendency to consider uncertainty to be unacceptable and Part B, containing 30 items that assess six cognitive and behavioral manifestations or consequences of IU. All items are rated on a 5-point Likert scale ranging from 1 (not at all typical) to 5 (completely typical). We obtained permission from the original author of IUI to translate the IUI into the Chinese version and to conduct a thorough research using the Chinese sample. First, two psychological researchers translated the original English version of IUI into Chinese. Second, the translation’s surface-level relevance to the construct of interest and whether each item was translated in a manner suitable to Chinese culture were examined by two psychological professors. Third, a professional translator who had not read the English version of IUI back-translated the CIUI into English, and then the author of the original IUI reviewed and modified the back-translated version until the meaning of items was the same as the original version of IUI. A pilot test was conducted to ensure that participants understood the meaning of the items in the Chinese version.
Intolerance of Uncertainty Scale-12
IUS28 is a 27-item scale evaluating the general reactions of uncertainty. The IUS-1229 is a short version of the original version of IUS, and it is highly correlated with the IUS-27. IUS-12 is rated on a 5-point Likert scale ranging from 1 (not at all characteristic of me) to 5 (entirely characteristic of me), and it has demonstrated excellent internal consistency (α = 0.91). The Chinese version of IUS-1233 has good reliability and validity. The Cronbach’s α is 0.878, and the 5-week reliability is 0.78. The Chinese version of IUS-12\was used to evaluate convergent validity.
Penn State Worry Questionnaire
The PSWQ34 is a 16-item scale to evaluate generality, excessiveness, and the uncontrollability of worry. It is rated on a Likert Scale ranging from 1 (not at all typical of me) to 5 (very typical of me). Eleven items directly measure worry, and 5 items indirectly measure it. Good internal consistency and test–retest reliability have been demonstrated. The Cronbach α in clinical35 and undergraduate samples are all ≥0.86, and the test–retest reliability of an undergraduate sample is 0.92. The Chinese version of PSWQ36 also represents good reliability and validity. The Cronbach’s α coefficient is 0.89, and 8-week test–retest correlation is 0.87. We used the Chinese version of PSWQ to assess convergent validity.
Generalized Anxiety Disorder-7 Questionnaire
GAD-737 is a 7-item scale assessing the severity of GAD. Each item is rated on a 4-point scale ranging from 0 (not at all) to 3 (nearly every day). The total score is in the range of 0–21, and scores of 5–9,10–14, and ≥15 indicate mild, moderate, and severe anxiety, respectively. Various versions of GAD-7 have all demonstrated excellent internal consistency and the Cronbach’s α is in the range of 0.89–0.92.37–39 The Chinese version of GAD-739 exhibits good reliability and validity. The Cronbach’s α is 0.90, and the test–retest reliability is 0.76. The Chinese version of GAD-7 was used to evaluate convergent and divergent validity.
Beck Depression Inventory II
The Beck Depression Inventory (BDI)-II40 is a 21-item scale evaluating affective, somatic, and cognitive symptoms of depression. A 4-point Likert scale ranging from 0 to 3 is used to rate each item, with higher total scores indicating greater severity. Scores of 0–13, 14–19, 20–28, and 29–63 indicate minimal or no depression, mild, moderate, and severe depression, respectively. BDI-II exhibits good psychometric properties.41 The Cronbach’s α and test–retest reliability of the Chinese version of BDI-II42 are 0.85 and 0.73, respectively. We used this scale to assess convergent and divergent validity.
Data Analysis
Item Analysis and Reliability
To test the homogeneity of CIUI, item-total statistics were conducted for all items, and we used 0.3 as the cutoff for the corrected item-correlations. The reliability of CIUIA and CIUIB was measured by internal consistency and test–retest reliability. Internal consistency was assessed using Cronbach’s alpha coefficient, and intraclass correlation coefficient (ICC) was used to assess test–retest reliability.
Validity
Factor analysis was performed to explore and confirm the structure of the CIUIA and CIUIB, respectively. To conduct exploratory factor analysis (EFA) and confirmatory factor analysis (CFA), we randomly divided 1230 participants into two evenly divided groups (n = 615). The EFA using principal axis factoring (PAF) and Promax rotation was performed in Group 1. Eigenvalues and scree plots were employed to identify the number of factors. The EFA was conducted using SPSS 26.0. Mplus 8.0 was used to perform CFA in Group 2 to confirm the structure identified by EFA. For convergent validity, Pearson’s correlation coefficient was employed to test the correlation between the two parts of CIUI and IUS-12, PSWQ, GAD-7, and BDI-II. GAD-7 and BDI-II were also used to test whether the scores of CIUI could distinguish the participants with different level of anxiety and depression using one-way ANOVA. We used one-way ANOVA to test the divergent validity of CIUI. A hierarchical regression model was conducted to evaluate whether the incremental validity of the subscales of Part B beyond Part A was significant.
Results
Item Analysis and Descriptive Statistics
No missing data existed for the 1230 participants. The result of item-total statistics demonstrated that all the corrected item-total correlations were above the recommended 0.3 cutoff value. The corrected item-total correlation of CIUIA and CIUIB ranged from 0.408 to 0.772 and 0.532 to 0.767, respectively. The skew and kurtosis coefficients of all items of CIUI fell within the recommended range, which should not be above 3 and 10 separately,43,44 indicating that the distribution of each item was close to normality. The skew coefficients of CIUI ranged from −0.153 to 1.088, whereas the kurtosis coefficients ranged from −0.758 to 0.762. In terms of gender, 815 participants (66%) were female, and 415 (34%) were male. As indicated in Table 1, the mean age was 19.64 ± 1.468 (mean ± SD) years, ranging from 17 to 24. Independent samples t-test was used to determine gender differences in CIUI scores. The results of t-test revealed no significant differences between the scores for males and females. CIUIA: t = −1.650, P > 0.05; CIUIB: t = −1.940, P > 0.05. Mean and SD for each scale are presented in Table 1.
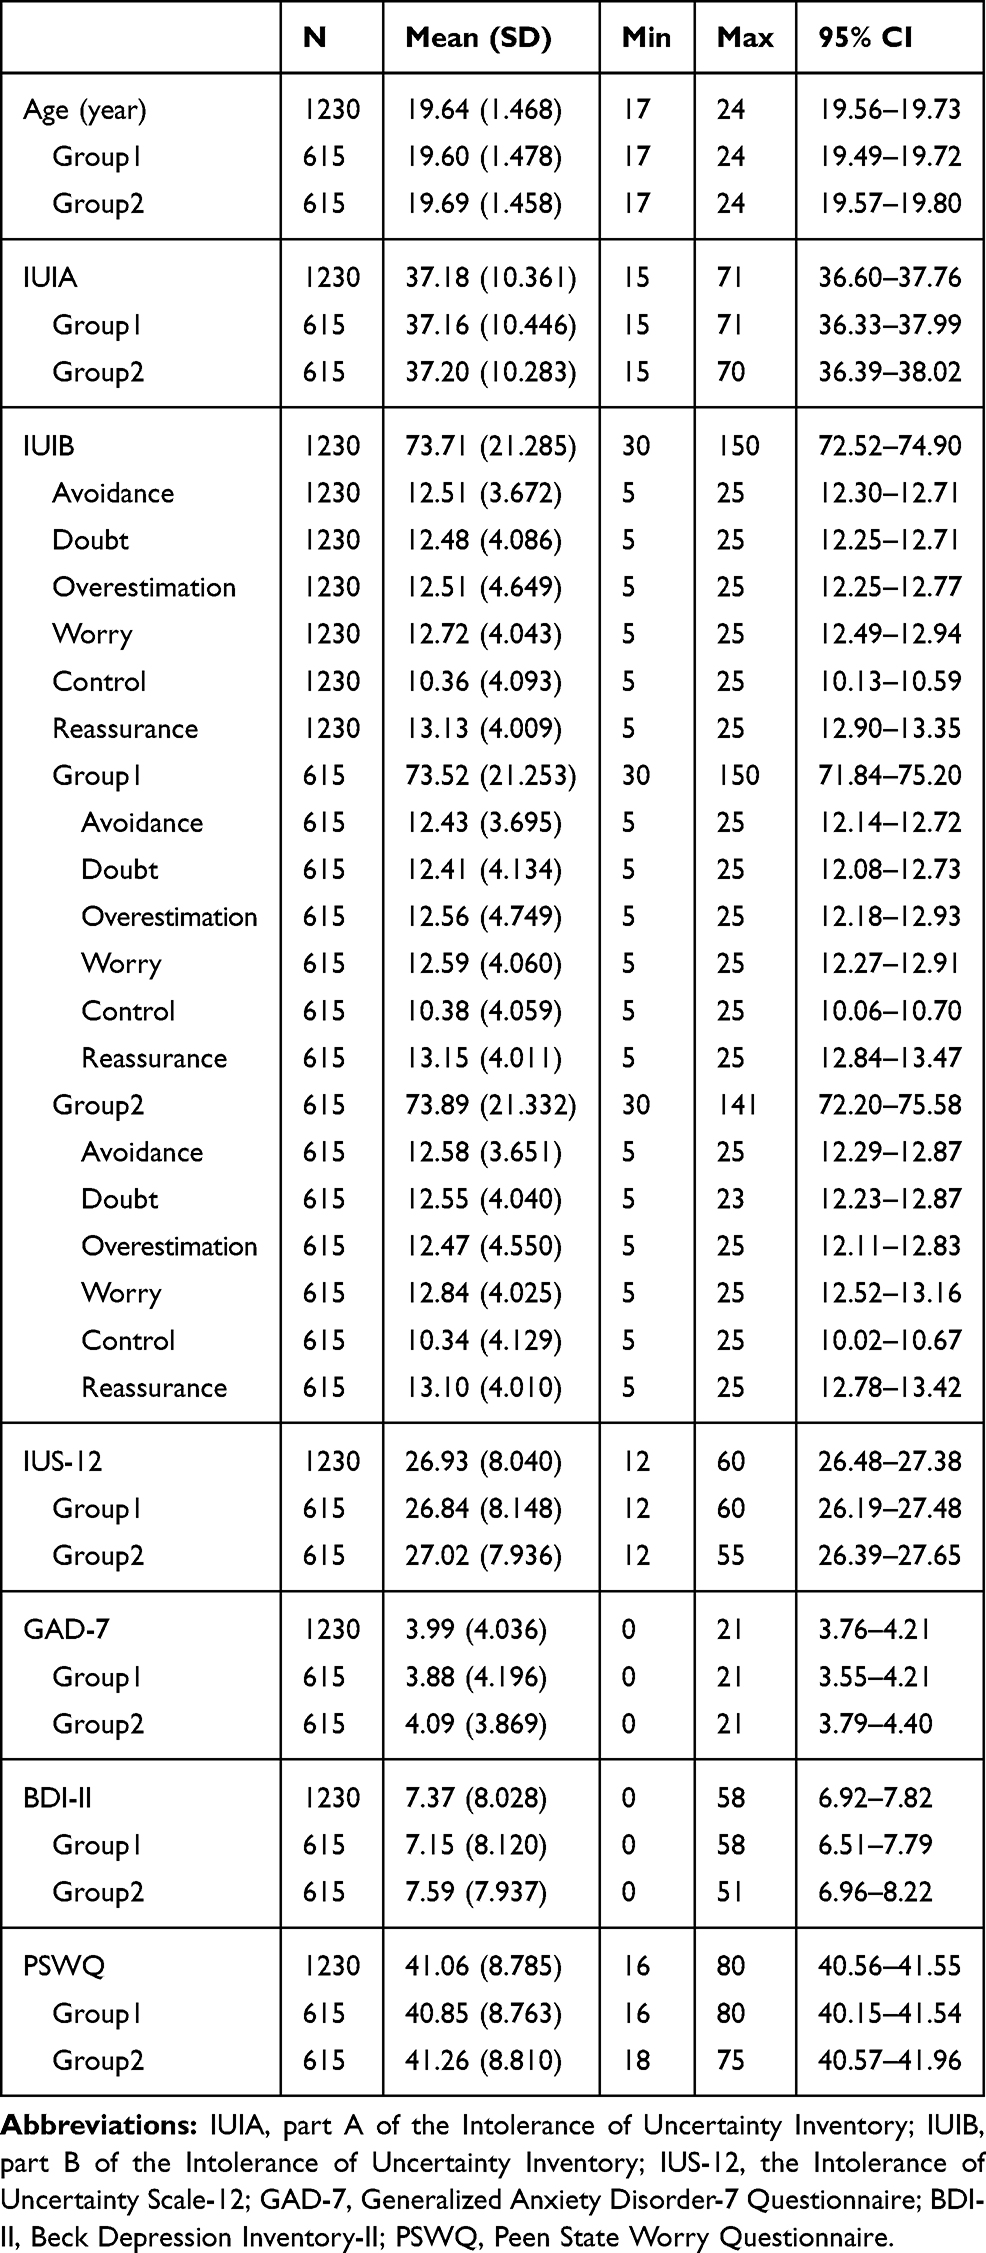 |
Table 1 Descriptive Statistics for Age and Measurements |
Validity
Exploratory Factor Analysis
Group 1 (n = 615) was used to perform EFA. The Bartlett’s sphericity test (χ2 = 4816.322, P < 0.001) and the Kaiser-Mayer-Olkin score (KMO = 0.932) of CIUIA indicated that the data was suitable for EFA. The first EFA result of CIUIA suggested a two-factor structure. However, the factor loading of Item 15 was not above the 0.4 cutoff criterion.45 We deleted Item 15 and conducted EFA again. The results of the second EFA also suggested a two-factor structure, which accounted for 51.991% of the variance. The eigenvalues and scree plot all supported the two-factor structure. The factor loading of the model in the pattern matrix and structure matrix are presented in Table 2. The two factors of CIUIA are: Factor 1: intolerance of the unexpected and difficulty waiting in an uncertain situation (9 items); Factor 2: intolerance of uncertainty and of uncertain situations (5 items).
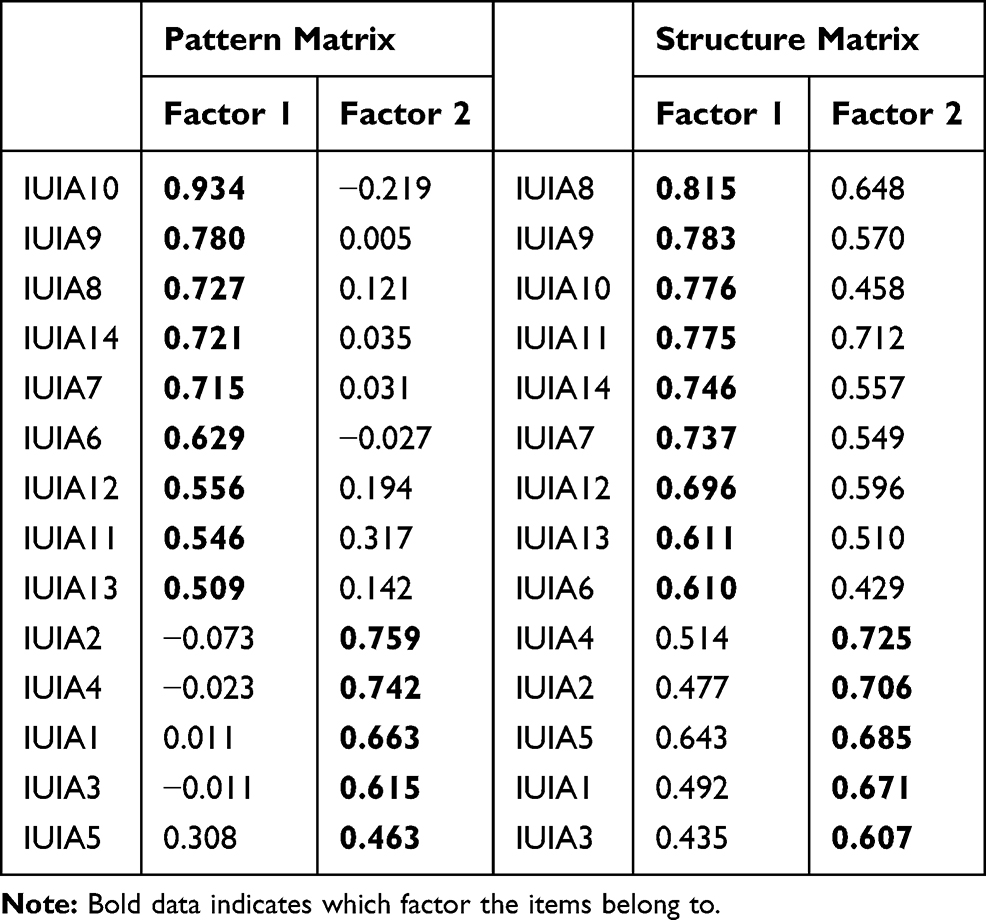 |
Table 2 The Pattern Matrix and Structure Matrix of CIUIA |
The results of Bartlett’s sphericity test (χ2=12,803.264, P < 0.001) and the Kaiser-Mayer Olkin score (KMO = 0.960) of CIUIB indicated that the data were suitable for EFA. According to the EFA results, we deleted 9 items which factor loadings not above the 0.4 cutoff value. Then, the latter EFA result suggested a four-factor structure containing 21 items. The four-factor stricture accounted for 59.915% of the variance, and the eigenvalues and scree plot all supported the four factors. The factor loading of the model in pattern matrix and structure matrix are shown in Table 3. The four factors included Overestimation (5 items), Control (5 items), Uncertainty makes one feel stressful (7 items), and Reassurance (4 items).
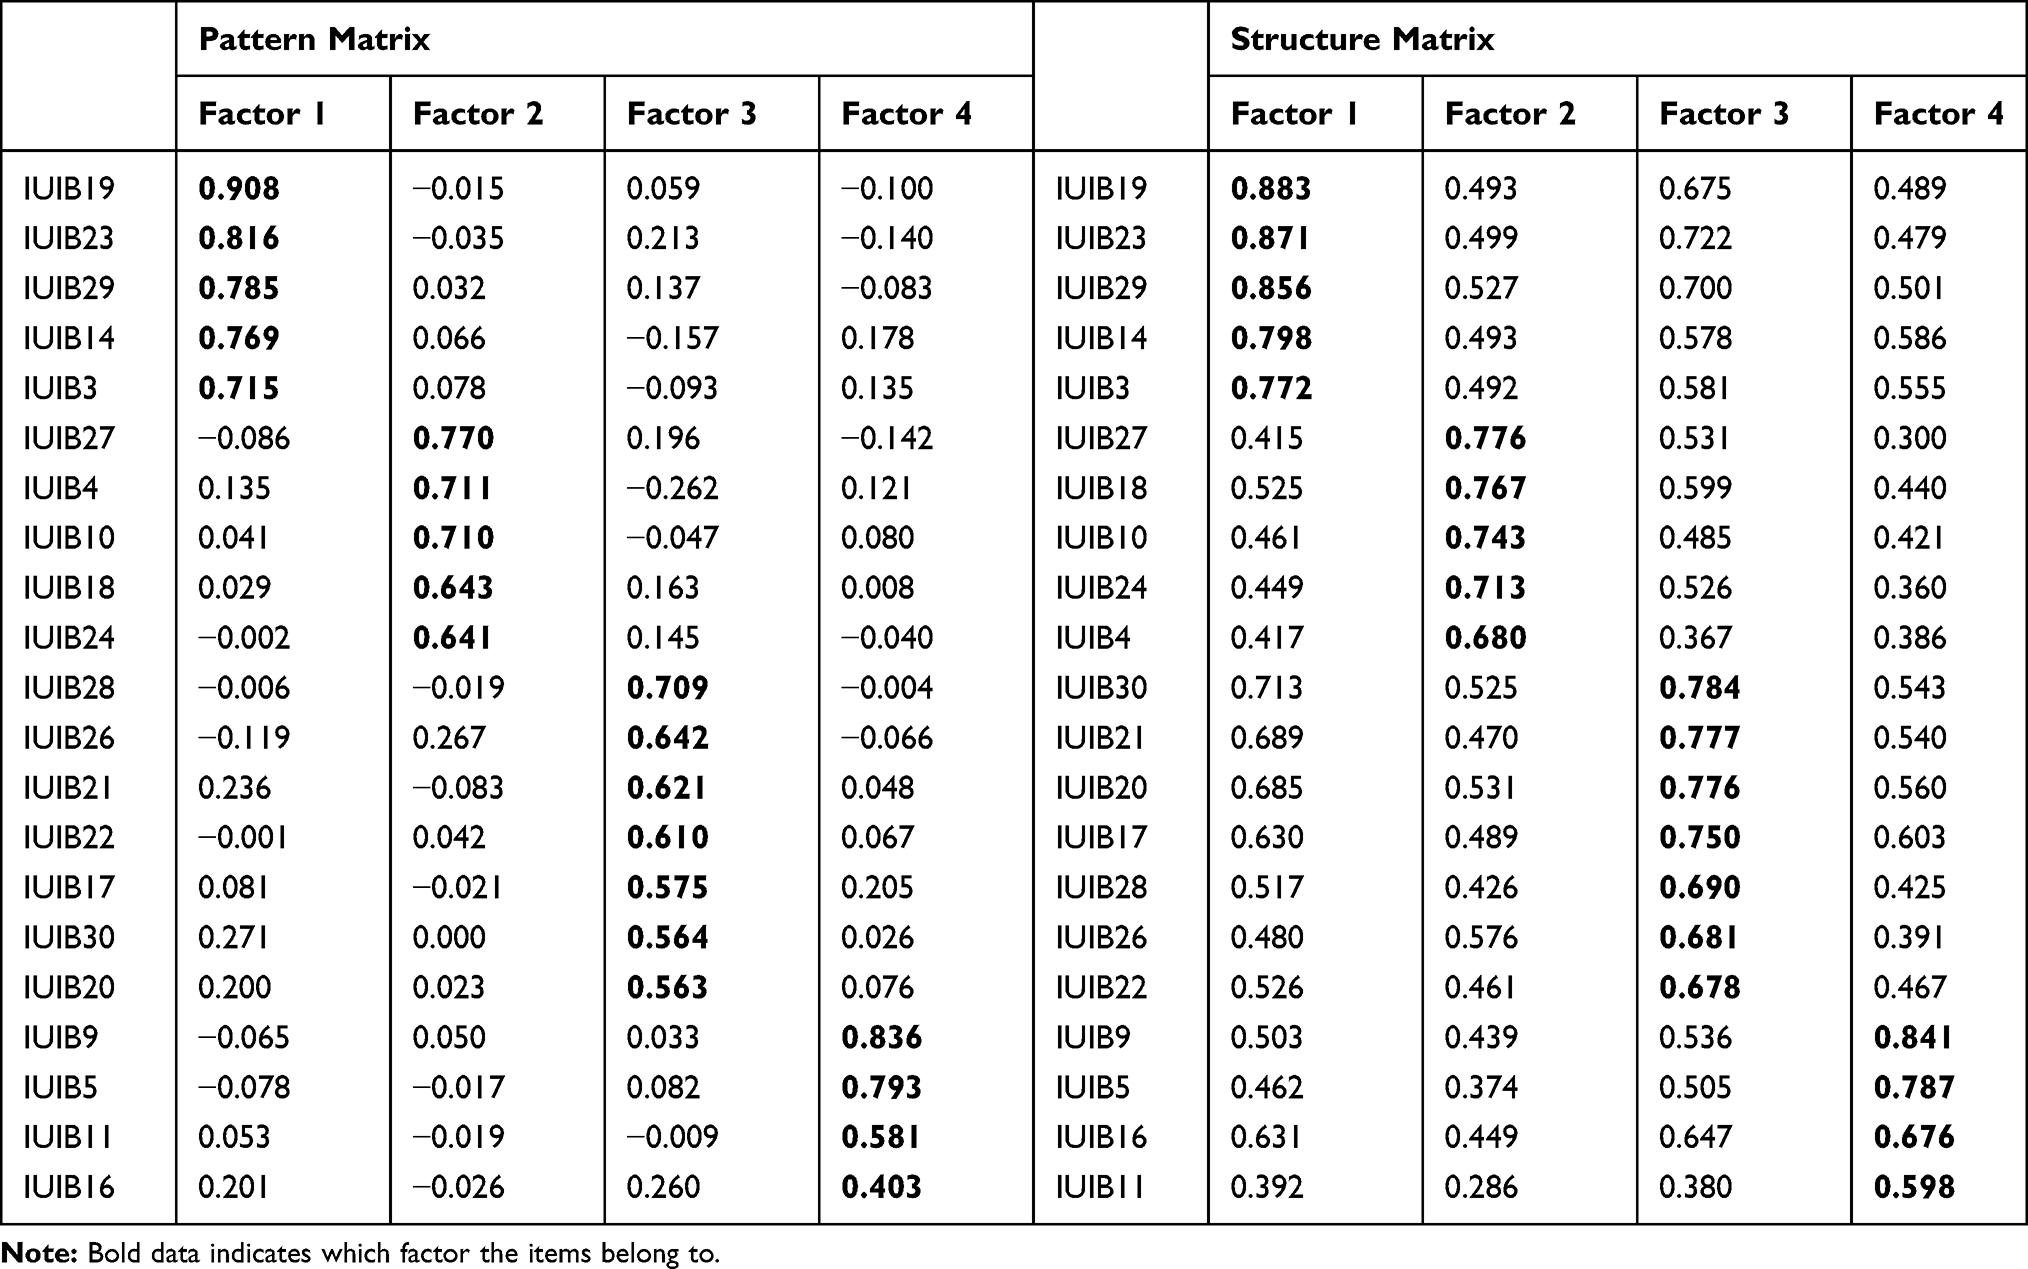 |
Table 3 The Pattern Matrix and Structure Matrix of CIUIB |
Confirmatory Factor Analysis
Group 2 (n = 615) was used to confirm the structure identified by EFA. Maximum likelihood estimation was used in CFA. We employed the following cutoffs of χ2/df ≤ 5, CFI ≥ 0.9, RMSEA ≤ 0.08, and SRMR ≤ 0.0546 to evaluate the fitness of the model we were interested in. As shown in Table 4, the results of CFA indicated that the models for both CIUIA and CIUIB identified by EFA fitted the data well. We also performed CFA for the unitary structure of CIUIA and for the original six-factor structure of CIUIB. The results indicated that the unitary structure of CIUIA also fitted the data after allowing the error correlation between Items 3 and 5. However, the two-factor structure of CIUIA appeared to fit the data better than the unitary structure. The original six-factor structure of CIUIB did not fit the data.
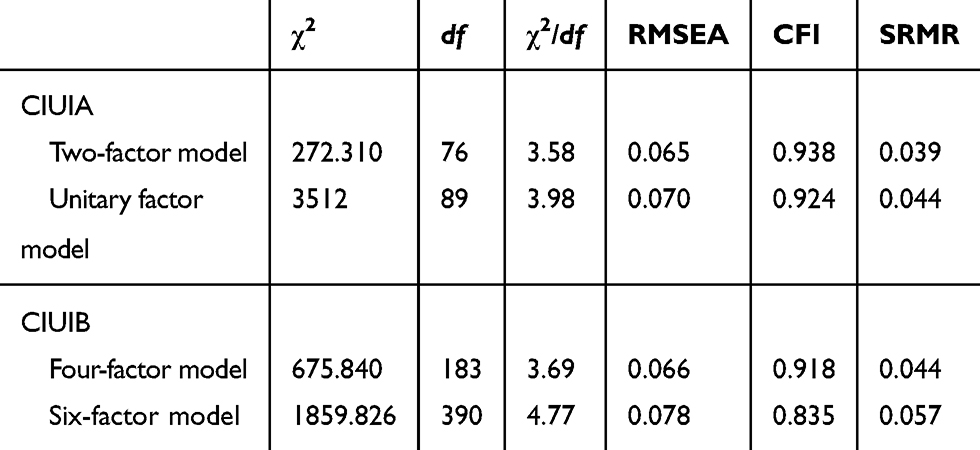 |
Table 4 Fitting Index of Models (n=615) |
Convergent and Divergent Validity
Pearson correlations between subscales of CIUI and several relative variances were calculated. As shown in Table 5. The Pearson’s correlation coefficient between CIUIA, CIUIB, IUS-12, GAD-7, BDI-II, and PSWQ ranged from 0.408 to 0.823, and all of them were significant (P < 0.01). The results of Pearson correlations supported the convergent validity of CIUI.
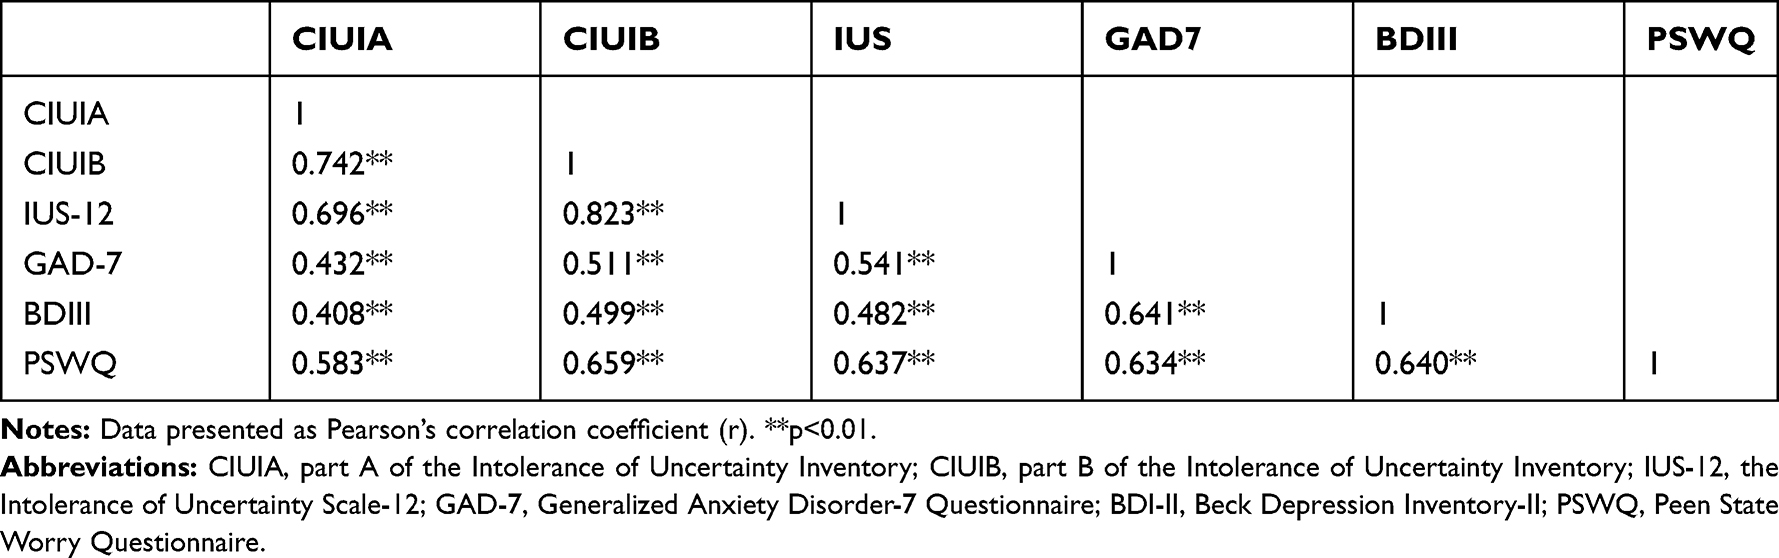 |
Table 5 Pearson Correlations Between Scales |
A one-way ANOVA was run to test whether the scores of CIUI could distinguish different populations. The GAD-7 and BDI-II were used to divide the severity of anxiety and depression, respectively. We divided participants into no anxiety, mild anxiety, and moderate to severe anxiety groups according to the standards of GAD-7. Furthermore, using BDI-II standards, we also divided participants into three groups for depression: no depression, mild depression, and moderate to severe depression groups. We combined the moderate groups and severe groups because the number of participants with severe anxiety or depression was far less than participants in the other groups. The results are presented in Tables 6 and 7. They indicated a significant difference among people with varied levels of anxiety or depression in CIUI scores and that the CIUI was an effective instrument to distinguish the different levels of IU among different people. The results of one-way ANOVA supported the divergent validity of CIUI.
 |
Table 6 Results of One-Way ANOVA and Post Hoc Tests Among Population with Anxiety (n=1230, M±SD) |
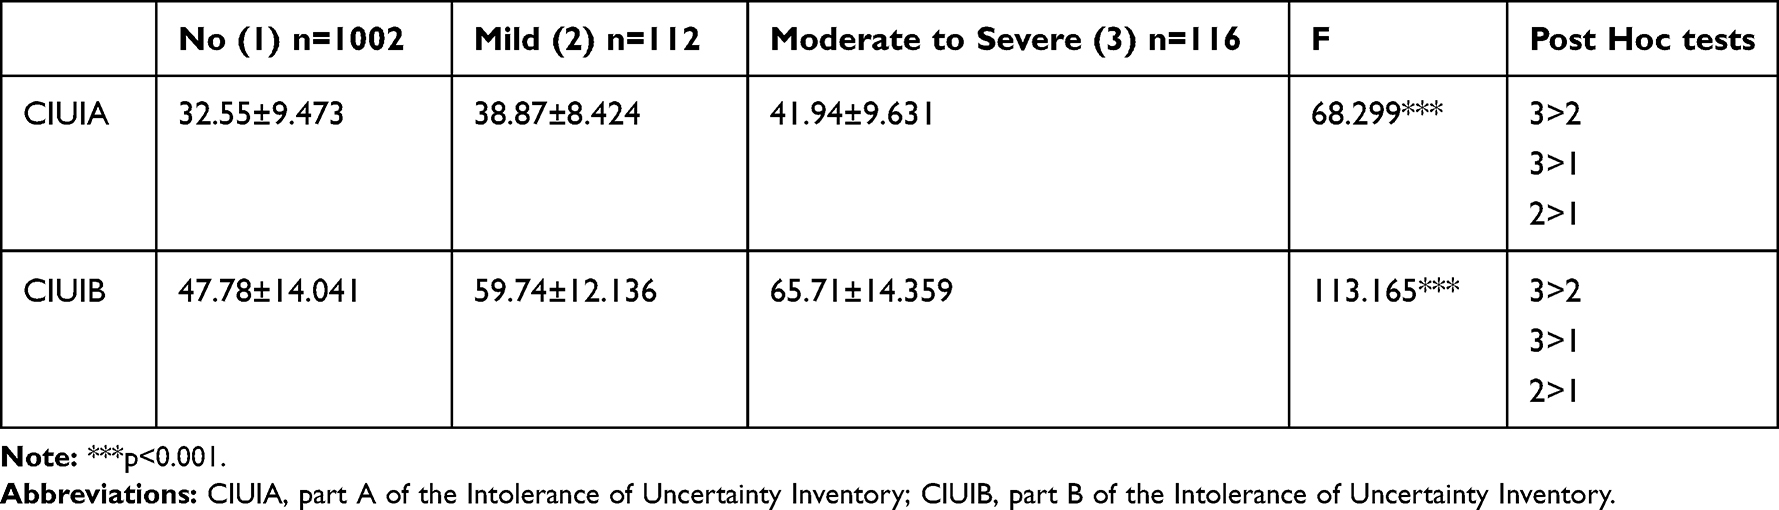 |
Table 7 Results of One-Way ANOVA and Post Hoc Tests Among Population with Depression (n=1230, M±SD) |
Reliability
Cronbach’s α was used to assess internal consistency. The alpha of CIUIA was 0.920, whereas the alpha of CIUIA factors were 0.908 and 0.805 for Factor 1 and Factor 2, respectively. The alpha reliabilities of CIUIB was 0.947, and the factor’s alpha ranged from 0.821 to 0.916 (Overestimation: α = 0.916; Control: α = 0.860; Uncertainty makes one feel stressful: α = 0.888; Reassurance: α = 0.821).
The 3-week test–retest reliability was evaluated by intraclass correlation coefficient (ICC). The reliability coefficient of CIUIA was 0.788, whereas the test–retest reliability of Factor 1 and Factor 2 were 0.774 and 0.724, respectively. The test–retest reliability of CIUIB was 0.859 and the reliability of Control, Overestimation, Uncertainty makes one stressful, and Reassurance were 0.870, 0.851, 0.840, and 0.773, respectively. The test–retest reliability of CIUI reflected moderate to good temporal stability for CIUI factors.
Regression Results
The incremental validity of the original six subscales of IUIB beyond IUIA total score for each dependent variable (GAD-7, BDI-II, and PSWQ) was conducted in the first regression. We employed the unitary structure as the structure for IUIA. In this regression, we entered the IUIA total score into Block 1 and entered all original subscales of IUIB into Block 2 to evaluate whether the subscales of IUIB accounted for an additional significant amount of variance. We used the variance inflation factor (VIF), tolerance index, and condition number κ to evaluate if the multicollinearity problem existed. The cutoff of VIF was equal to or above 5, and the tolerance index was regarded as the reciprocal of VIF. A condition number κ that was greater or equal to 30 indicated a severe multicollinearity.47 The results of the first regression revealed no severe multicollinearity, and the VIF of all factors were below 5 and ranged from 2.007 to 4.308, and the condition number κ were all below 30, ranging from 10.161 to 21.478. As depicted in Table 8, IUIB subscales accounted for an additional statistically significant amount of variance in all dependent variables. However, the associations between subscales of IUIB and each dependent variable differed. For GAD-7, Avoidance, Doubt, Worry, and Control were significant. For BDI-II, Doubt, Overestimation, Worry, and Reassurance were significant. For PSWQ, Avoidance, Doubt, Overestimation, and Worry were significant.
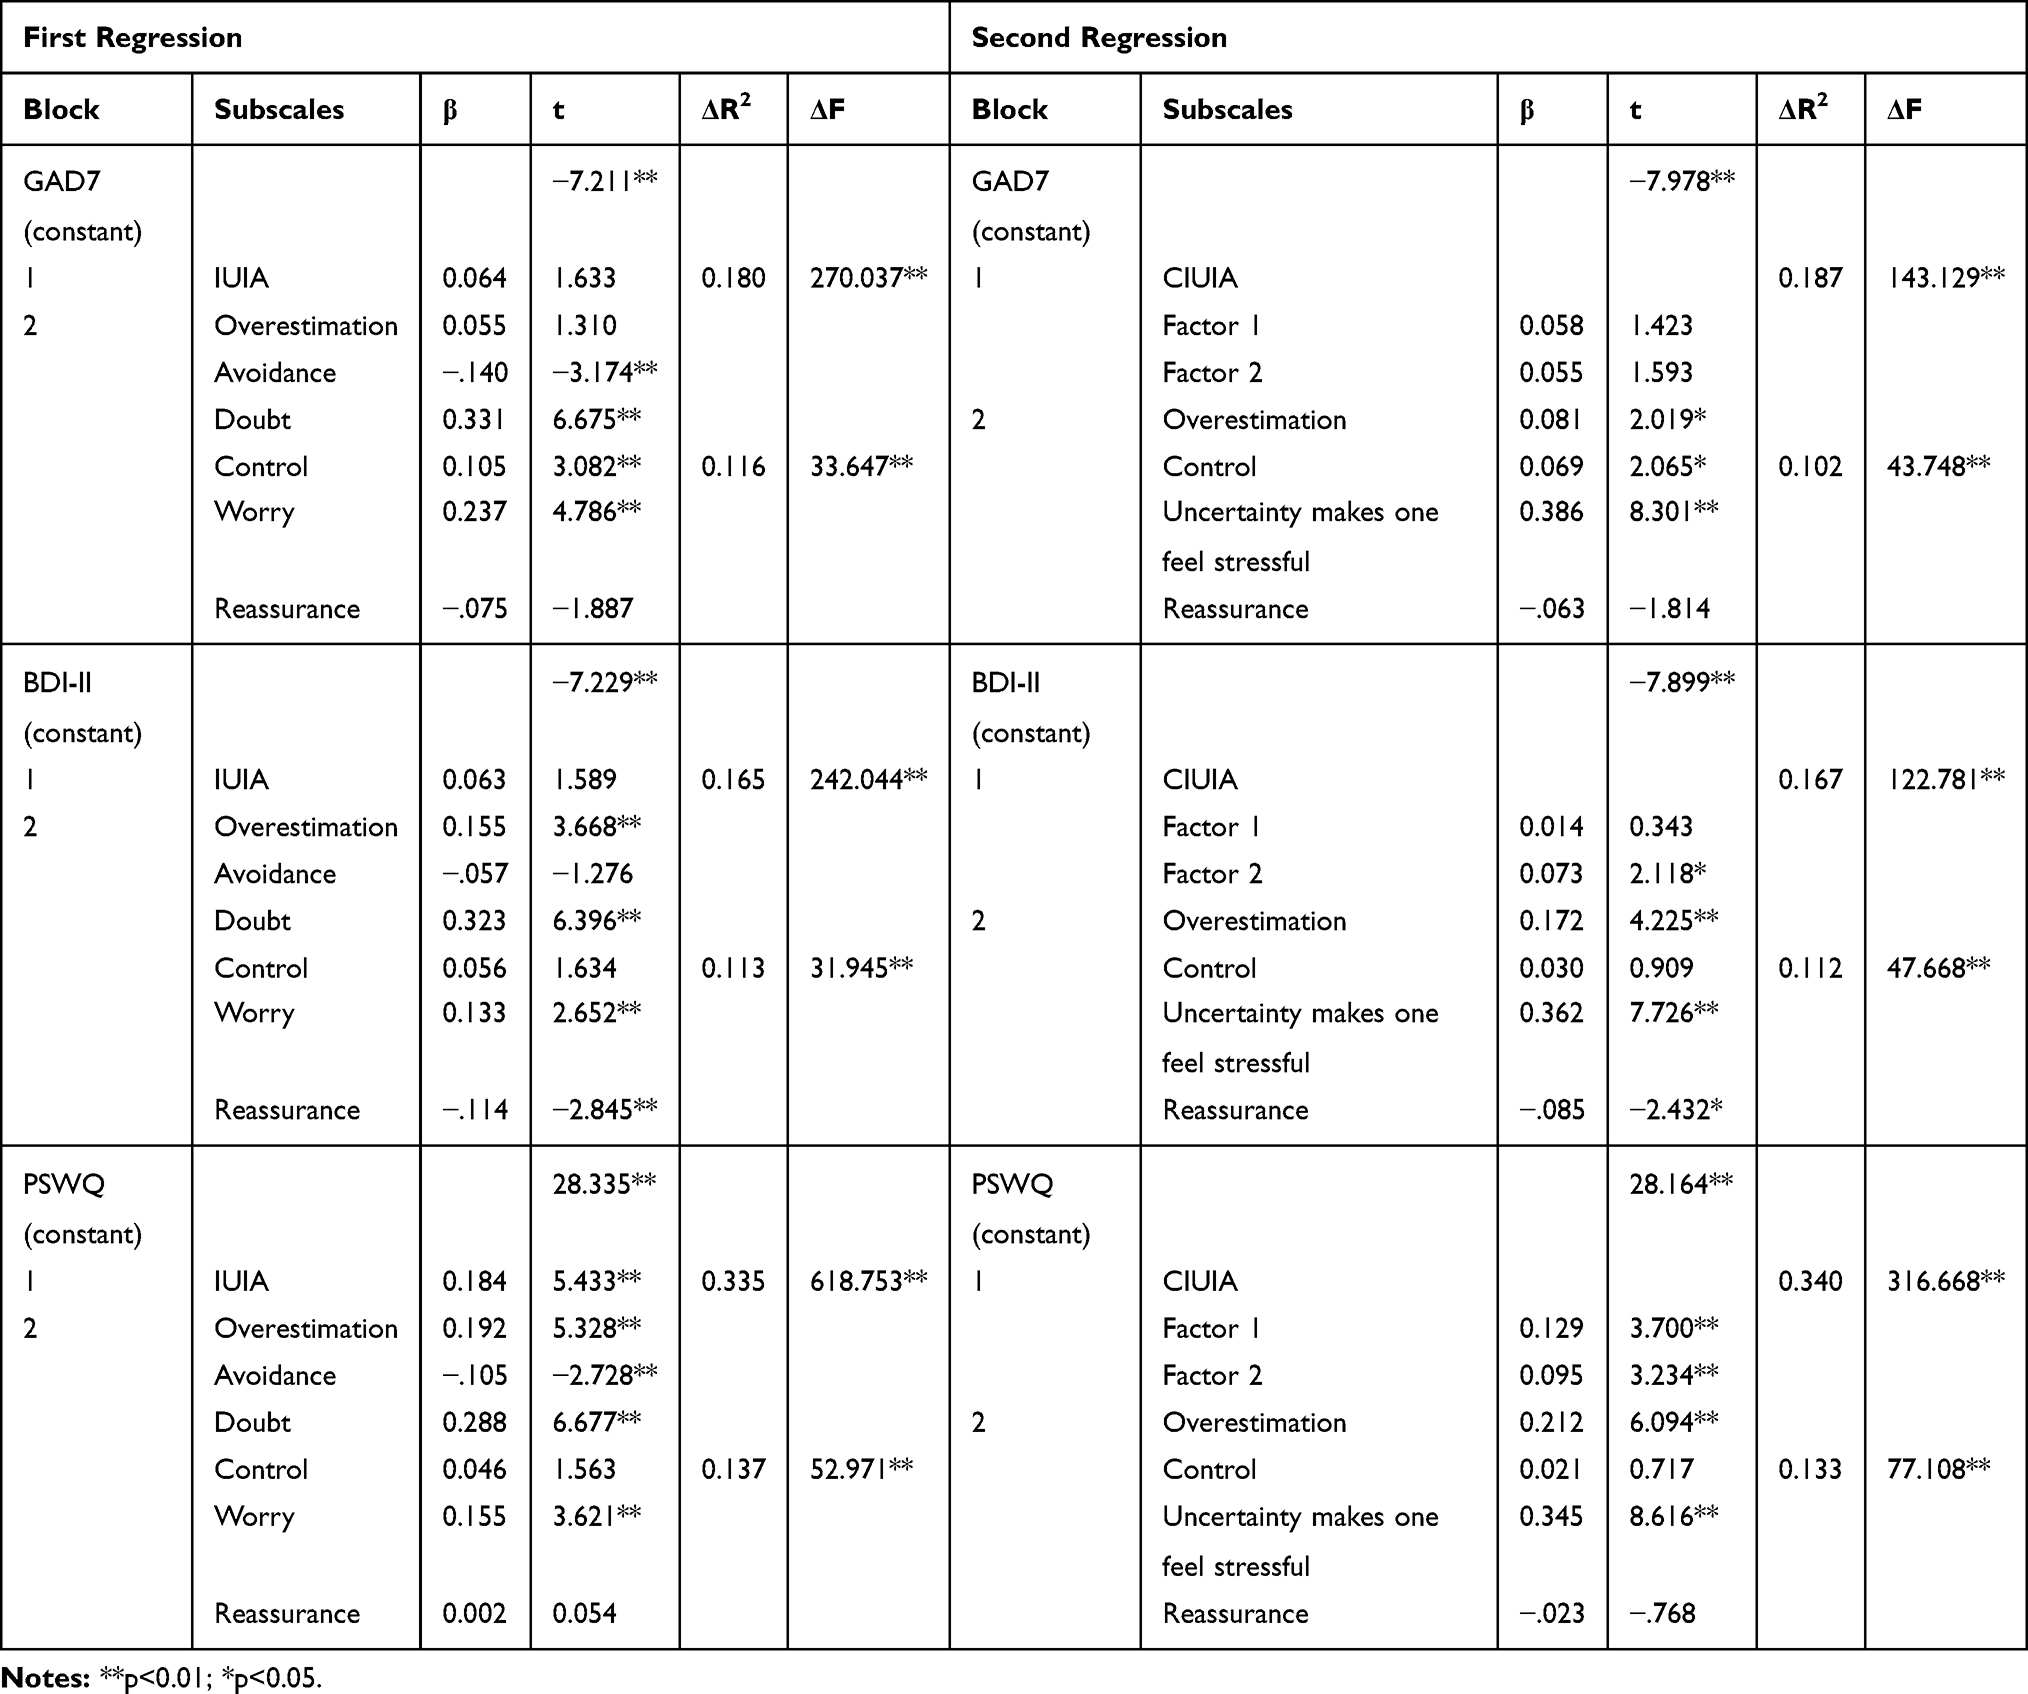 |
Table 8 Regression Results |
The second regression was performed to evaluate the incremental validity of four subscales of CIUIB beyond two subscales of CIUIA for each dependent variable (GAD-7, BDI-II, and PSWQ). We entered subscales of CIUIA into Block 1 and subscales of CIUIB into Block 2. All the VIF and condition number κ values fell within the recommended range. The VIF ranged from 1.908 to 3.726, and the condition number k ranged from 9.138 to 18.438. The results indicated that in all dependent variables, CIUIB subscales accounted for an additional statistically significant amount of variance. The association between factors of CIUIB and each dependent variable is depicted in Table 8. For GAD-7, Overestimation, Control, and Uncertainty makes one feel stressful were all significant. For BDI-II, Overestimation, Uncertainty makes one feel stressful, and Reassurance was significant. For PSWQ, Overestimation and Uncertainty makes one feel stressful were significant.
Discussion
In the current study, we developed the CIUI, and its psychometric properties were examined. A total of 1230 Chinese college students were enrolled, and good psychometric properties were obtained for this sample.
After translating the English version of IUI into Chinese version, we randomly divided 1230 participants into two equal groups. An EFA was performed for Group 1 (n = 615). The results of CIUIA demonstrated a two-factor structure. Items 6–14 loaded onto Factor 1 (intolerance of the unexpected and difficulty waiting in an uncertain situation), and Items 1–5 loaded onto Factor 2 (intolerance of uncertainty and of uncertain situations). Item 15 was deleted because of its weak factor loading. Inconsistent with the original factor structure of IUIA, Items 8, 9, and 11 loaded onto Factor 1. Such results were unsurprising. What will happen next (items 8 and 9) and uncertainty in life (item 11) are related to both the present and the future. However, the future is unpredictable: People who desire to eliminate the uncertainty of the future need to experience a waiting period to find certain information regarding the future to be free from uncertain situations. The waiting period is difficult for them. As a result, Items 8, 9, and 11 loading onto Factor 1 seems reasonable. The two-factor structure of CIUIA was supported by the subsequent CFA conducted in Group 2 (n = 615). Furthermore, the unitary factor structure was also supported by the CFA. It indicated that the unitary and two-factor structure may both be latent to the structure of CIUIA.
The EFA of CIUIB was also conducted in Group 1. A four-factor structure containing 21 items was obtained. The nine other items were deleted because of weak factor loadings. The four factors were as follows: Overestimation (5 items), Control (5 items), Uncertainty makes one feel stressful (7 items), and Reassurance (4 items). The factor Uncertainty makes one feel stressful consisted of Worry, Doubt, and Avoidance. It may be the result of the high correlation between Worry, Doubt, and Avoidance. The Pearson’s correlation coefficient ranged from 0.772 to 0.806. The redundant items may be deleted to stabilize the factor structure. It may be that Worry, Doubt, and Avoidance are more related to cognitive components and that the following actions are influenced by them. The higher the level of worry and doubt, the higher the tendency for individuals to consider avoiding uncertainty. The later CFA performed in Group 2 confirmed the four-factor structure of CIUIB. The original six-factor structure of IUIB was also examined by CFA. The result did not support the six-factor structure of IUIB and the cultural differences between the Western sample and Eastern sample may be one reason for this. In Chinese culture, Worry, Doubt, and Avoidance cannot be clearly distinguished from each other and are instead closely associated. Furthermore, the timing of their appearance cannot be distinguished clearly because they often appear together. Therefore, it seems reasonable that the six-factor structure would not fit the data. The results of CFA indicated that the four-factor structure of CIUIB identified through EFA was the more stable latent structure in Chinese college students.
CIUIA and CIUIB all demonstrated adequate reliability. According to the recommended cutoff, alpha values equal to or lower than 0.6 were seen as unacceptable.48 The Cronbach’s alpha coefficient of CIUIA and CIUIB were 0.920 and 0.947 in total, respectively. Furthermore, it was 0.805–0.908 for the two subscales of CIUIA and 0.821–0.916 for the four subscales of CIUIB. It demonstrated good to excellent internal consistency for CIUI. The three-week test–retest reliability supported the temporal stability of CIUI. An ICC of 0.1 or lower was considered as indicating no consistency, between 0.11 and 0.40 was poor, between 0.4 and 0.6 was ordinary, between 0.61 and 0.80 was moderate, and greater than 0.8 was good.49 The ICC values of CIUIA were 0.788 in total and 0.724–0.744 for the two subscales. The ICC value of CIUIB was 0.859 in total and 0.773–0.870 for the four subscales. Adequate validity was also obtained from the Pearson’s correlation coefficient between CIUI, IUS-12, GAD-7, BDI-II, and PSWQ. The coefficient ranged from 0.408 to 0.823 and were all statistically significant (P < 0.01). Meanwhile, the one-way ANOVA showed there were significant differences among groups of anxiety in CIUI scores and the significant differences also existed in groups of depression (P < 0.001). According to these results, the CIUI is an effective instrument to measure intolerance of uncertainty among Chinese college students.
In the hierarchical regression analysis, the incremental validity of the six subscales of IUIB identified by original version and the four subscales of CIUIB identified by EFA were assessed. In the first regression, which assessed the incremental validity of the original six IUIB subscales, IUIA accounted for a larger significant variance for all dependent variables (GAD-7, BDI-II, and PSWQ) than IUIB. It may be evidence that the excessive tendency of an individual to consider uncertainties in life as unacceptable, measured by IUIA, is an important factor for negative moods. IUIB also accounts for an additional significant variance for all dependent variables, although the role of each subscale of IUIB in each dependent variable differed. For GAD-7, Avoidance, Doubt, Worry, and Control may be important predictors of GAD. Doubt, Overestimation, Worry, and Reassurance may play a crucial role in depression as measured by BDI-II, whereas Avoidance, Doubt, Overestimation, and Worry may influence worry as measured by PSWQ. The different links between the subscales of IUIB and the dependent variables may benefit the treatment of emotional disorders. It is worth noting that the IUI accounted for 47.2% of PSWQ, whereas it accounted for only 27.8% of BDI-II and 29.6% of GAD-7. It may suggest that IU is more related to worry than GAD and depression and that IU may influence GAD by worry.
The second regression assessing the incremental validity of the four CIUIB subscales also demonstrated that CIUIA accounted for a larger significant variance than CIUIB and the four CIUIB subscales accounted for an additional variance for GAD-7, BDI-II, and PSWQ. For GAD-7, Overestimation, Control, and Uncertainty makes one feel stressful may play an important role, whereas Overestimation, Uncertainty makes one feel stressful, and Reassurance may predict depression as measured by BDI-II. Furthermore, Overestimation and Uncertainty makes one feel stressful may be key predictors of PSWQ. The four subscales accounted for a comparable amount of variance in the six CIUIB subscales (47.3% for PSWQ, 27.9% for BDI-II, and 28.9% for GAD-7). It may indicate that the four-factor structure of CIUIB is appropriate for Chinese contexts.
The limitations of the present study should be pointed out. First, we only included college students in our study. We cannot know whether different age and education levels would influence the level of IU. Furthermore, numerous participants were healthy, and how the factor structure of CIUI would behave in clinical settings remains unclear. Future studies should replicate the factor structure of the present study in both community and clinical samples. Second, further studies should replicate the factor structure of CIUIA in a more comprehensive sample to determine a more stable factor structure between the unitary factor structure and two-factor structure. Third, we evaluated only the traditional psychometric properties of the CIUI. Future studies are needed to also examine the clinimetric properties (eg, clinical validity, sensitivity to change, and scalability).50,51 Finally, longitudinal studies should be designed in the future to test whether the level of IU will change in different life phases and whether changes in situation would influence IU.
Although there were several limitations in the present study, CIUI demonstrated adequate reliability and validity for a sample of Chinese college students, and the evidence of an association between IU and mood disorders may enable a better understanding of the role of IU. In conclusion, CIUI is an appropriate tool to measure IU among college students in China.
Ethical Approval
The Institutional Review Board (IRB) of Third Xiangya Hospital approved the study.
Acknowledgments
We would like to thank Mr. You Haiyang, Ms. Li Xueqin, and Mr. Zhang Haowei for their help in data collection.
Disclosure
The authors report no conflicts of interest in this work.
References
1. Monat A, Averill JR, Lazarus RS. Anticipatory stress and coping reactions under various conditions of uncertainty.. J Pers Soc Psychol. 1972;24(2):237–253. doi:10.1037/h0033297
2. Gentes EL, Ruscio AM. A meta-analysis of the relation of intolerance of uncertainty to symptoms of generalized anxiety disorder, major depressive disorder, and obsessive–compulsive disorder. Clin Psychol Rev. 2011;31(6):923–933. doi:10.1016/j.cpr.2011.05.001
3. Greco V, Roger D. Uncertainty, stress, and health. Pers Individ Dif. 2003;34(6):1057–1068. doi:10.1016/S0191-8869(02)00091-0
4. Dugas MJ, Gosselin P, Ladouceur R. Intolerance of uncertainty and worry: investigating specificity in a nonclinical sample. Cognit Ther Res. 2001;25(5):551–558. doi:10.1023/A:1005553414688
5. Ladouceur R. The role of intolerance of uncertainty in etiology and maintenance. Cheminform. 2004;30(43):143–163.
6. Folkman S, Lazarus RS. If it changes it must be a process: study of emotion and coping during three stages of a college examination. J Pers Soc Psychol. 1985;48(1):150–170.
7. Carleton RN. The intolerance of uncertainty construct in the context of anxiety disorders: theoretical and practical perspectives. Expert Rev Neurother. 2012;12(8):937–947.
8. Dugas MJ. Experimental manipulation of intolerance of uncertainty: a study of a theoretical model of worry. Behav Res Ther. 2000;38(9):933–941.
9. Buhr K, Dugas MJ. Investigating the construct validity of intolerance of uncertainty and its unique relationship with worry. J Anxiety Disord. 2006;20(2):222–236.
10. Bukowski WM. Understanding adolescent worry: the application of a cognitive model. J Abnorm Child Psychol. 2007;31(1):55–64.
11. Thibodeau N. Specificity of generalized anxiety disorder symptoms and processes. Behav Ther. 2015;30(2):191–207.
12. Norton GR. Hierarchical model of generalized and specific vulnerabilities in anxiety. Cogn Behav Ther. 2005;32(2):82–94.
13. Holaway RM, Heimberg RG, Coles ME. A comparison of intolerance of uncertainty in analogue obsessive-compulsive disorder and generalized anxiety disorder. J Anxiety Disord. 2006;20(2):158–174. doi:10.1016/j.janxdis.2005.01.002
14. Tolin DF, Abramowitz JS, Brigidi BD, Foa EB. Intolerance of uncertainty in obsessive-compulsive disorder. J Anxiety Disord. 2003;17(2):233–242. doi:10.1016/S0887-6185(02)00182-2
15. Boelen PA, Reijntjes A. Intolerance of uncertainty and social anxiety. J Anxiety Disord. 2009;23(1):130–135. doi:10.1016/j.janxdis.2008.04.007
16. Carleton RN, Collimore KC, Asmundson GJG. “It’s not just the judgements—It’s that I don’t know”: intolerance of uncertainty as a predictor of social anxiety. J Anxiety Disord. 2010;24(2):189–195. doi:10.1016/j.janxdis.2009.10.007
17. Riskind JH, Tzur D, Williams NL, Mann B, Shahar G. Short-term predictive effects of the looming cognitive style on anxiety disorder symptoms under restrictive methodological conditions. Behaviour Research and Therapy. 2007;45(8):1765–1777. doi:10.1016/j.brat.2006.12.007
18. Carleton RN, Fetzner MG, Hackl JL, McEvoy P. Intolerance of uncertainty as a contributor to fear and avoidance symptoms of panic attacks. Cognitive Behaviour Therapy. 2013;42(4):328–341. doi:10.1080/16506073.2013.792100
19. Carleton RN, Sharpe D, Asmundson GJG. Anxiety sensitivity and intolerance of uncertainty: requisites of the fundamental fears? Behaviour Research and Therapy. 2007;45(10):2307–2316. doi:10.1016/j.brat.2007.04.006
20. Mahoney AEJ, McEvoy PM. Trait versus situation-specific intolerance of uncertainty in a clinical sample with anxiety and depressive disorders. Cognitive Behaviour Therapy. 2012;41(1):26–39. doi:10.1080/16506073.2011.622131
21. Krohne HW. Vigilance and cognitive avoidance as concepts in coping research. J Anxiety Disord. 1993;154:24.
22. Mahoney AEJ, McEvoy PM. A transdiagnostic examination of intolerance of uncertainty across anxiety and depressive disorders. Cognitive Behaviour Therapy. 2012;41(3):212–222. doi:10.1080/16506073.2011.622130
23. Dugas MJ, Schwartz A, Francis K. Brief report: intolerance of uncertainty, worry, and depression. Cognit Ther Res. 2004;28(6):835–842. doi:10.1007/s10608-004-0669-0
24. van der Heiden C, Melchior K, Muris P, Bouwmeester S, Bos AER, van der Molen HT.A hierarchical model for the relationships between general and specific vulnerability factors and symptom levels of generalized anxiety disorder. J Anxiety Disord. 2010;24(2):284–289. doi:10.1016/j.janxdis.2009.12.005
25. Mahoney AEJ, McEvoy PM, Moulds ML. Psychometric properties of the Repetitive Thinking Questionnaire in a clinical sample. J Anxiety Disord. 2012;26(2):359–367. doi:10.1016/j.janxdis.2011.12.003
26. Miranda R, Mennin DS. Depression, generalized anxiety disorder, and certainty in pessimistic predictions about the future. Cognit Ther Res. 2007;31(1):71–82. doi:10.1007/s10608-006-9063-4
27. McEvoy PM, Mahoney AEJ. Achieving certainty about the structure of intolerance of uncertainty in a treatment-seeking sample with anxiety and depression. J Anxiety Disord. 2011;25(1):112–122. doi:10.1016/j.janxdis.2010.08.010
28. Freeston MH, Rhéaume J, Letarte H, Dugas MJ, Ladouceur R. Why do people worry? Pers Individ Dif. 1994;17(6):791–802. doi:10.1016/0191-8869(94)90048-5
29. Carleton RN, Norton MA, Asmundson GJG. Fearing the unknown: a short version of the Intolerance of Uncertainty Scale. J Anxiety Disord. 2007;21(1):105–117. doi:10.1016/j.janxdis.2006.03.014
30. Gosselin P, Ladouceur R, Evers A, Laverdiere A, Routhier S, Tremblay-Picard M. Evaluation of intolerance of uncertainty: development and validation of a new self-report measure. J Anxiety Disord. 2008;22(8):1427–1439. doi:10.1016/j.janxdis.2008.02.005
31. Carleton RN, Gosselin P, Asmundson GJG. The Intolerance of Uncertainty Index: replication and extension with an English sample.. Psychol Assess. 2010;22(2):396–406. doi:10.1037/a0019230
32. Lauriola M, Mosca O, Trentini C, Foschi R, Tambelli R, Carleton RN. The Intolerance of Uncertainty Inventory: validity and comparison of scoring methods to assess individuals screening positive for anxiety and depression. Front Psychol. 2018;9:388. doi:10.3389/fpsyg.2018.00388
33. Zhang YJ, Song JB, Gao YT, Wu SJ, Song L, Miao DM. Reliability and validity of the intolerance of uncertainty scale-short form in university students. Chin J Clin Psychol. 2017;25(02):285–288.
34. Meyer TJ, Miller ML, Metzger RL, Borkovec TD. Development and validation of the Penn State Worry Questionnaire. Behaviour Research and Therapy. 1990;28(6):487–495. doi:10.1016/0005-7967(90)90135-6
35. Brown TA, Antony MM, Barlow DH. Psychometric properties of the Penn State Worry Questionnaire in a clinical anxiety disorders sample. Behaviour Research and Therapy. 1992;30(1):33–37. doi:10.1016/0005-7967(92)90093-V
36. Zhong J, Wang C, Li J, Liu J. Penn State Worry Questionnaire: structure and psychometric properties of the Chinese version. J Zhejiang Univ Sci B. 2009;10(3):211–218. doi:10.1631/jzus.B0820189
37. Spitzer RL, Kroenke K, Williams JBW, Löwe B. A brief measure for assessing generalized anxiety disorder – The GAD-7. Arch Intern Med. 2006;166(10):1092–1097. doi:10.1001/archinte.166.10.1092
38. Kertz S, Bigda-Peyton J, Bjorgvinsson T. Validity of the Generalized Anxiety Disorder-7 Scale in an acute psychiatric sample. Clin Psychol Psychother. 2013;20(5):456–464.
39. Wang Y, Cheng R, Zhang L. Evaluation of the reliability and validity of the generalized anxiety disorder 7-item scale among inpatients in general hospital. J Clin Psychiatry. 2018;28(03):168–171.
40. Beck AT. An inventory for measuring depression. Arch Gen Psychiatry. 1961;4(6):561–571. doi:10.1001/archpsyc.1961.01710120031004
41. Mostafa Alim S, Ahmed MN, Mullick MSI, Chowdhury NF, Akhter F, Alam MS. Validation of the Bangla version of Beck Depression Inventory-II. Brain and Behavior. 2020;10(3):e01563. doi:10.1002/brb3.1563
42. Yang WH, Wu DJ, Peng F. Application of Chinese version of Beck Depression Inventory-II to Chinese first-year college students. Chin J Clin Psychol. 2012;20(06):762–764.
43. Kline RB, Little TD. Principles and practice of structural equation modeling. Guilford Press. 2011;1254.
44. Wang X, Dai L, Yin M, Deng Y. The factor structure, reliability and validity of the Chinese version of the Van Dream Anxiety Scale. Neuropsychiatr Dis Treat. 2018;15:57–67. doi:10.2147/NDT.S192891
45. Enders CK, Bandalos DL. The relative performance of full information maximum likelihood estimation for missing data in structural equation models. Structural Equation Modeling: A Multidisciplinary Journal. 2001;8(3):430–457. doi:10.1207/S15328007SEM0803_5
46. Hu L-T, Bentler PM. Cutoff criteria for fit indexes in covariance structure analysis: conventional criteria versus new alternatives. Structural Equation Modeling: A Multidisciplinary Journal. 1972;24(2):1–55. doi:10.1080/10705519909540118
47. Yu H, Jiang S, Land KC. Multicollinearity in hierarchical linear models. Soc Sci Res. 2007;45:118–136. doi:10.1016/j.ssresearch.2015.04.008
48. Zwaanswijk W, Veen VC, Vedder P. The Youth Psychopathic Traits Inventory: a bifactor model, dimensionality, and measurement invariance. Assessment. 2017;24(7):932–944. doi:10.1177/1073191116632340
49. Shrout PE. Measurement reliability and agreement in psychiatry. Stat Methods Med Res. 1998;7(3):301–317. doi:10.1177/096228029800700306
50. Carrozzino D, Svicher A, Patierno C, Berrocal C, Cosci F. The Euthymia Scale: a clinimetric analysis. Psychother Psychosom. 2019;88(2):119–121.
51. Carrozzino D, Patierno C, Fava GA, Guidi J. The Hamilton Rating Scales for Depression: a critical review of clinimetric properties of different versions. Psychother Psychosom. 2020;89(3):133–150.
 © 2020 The Author(s). This work is published and licensed by Dove Medical Press Limited. The full terms of this license are available at https://www.dovepress.com/terms.php and incorporate the Creative Commons Attribution - Non Commercial (unported, v3.0) License.
By accessing the work you hereby accept the Terms. Non-commercial uses of the work are permitted without any further permission from Dove Medical Press Limited, provided the work is properly attributed. For permission for commercial use of this work, please see paragraphs 4.2 and 5 of our Terms.
© 2020 The Author(s). This work is published and licensed by Dove Medical Press Limited. The full terms of this license are available at https://www.dovepress.com/terms.php and incorporate the Creative Commons Attribution - Non Commercial (unported, v3.0) License.
By accessing the work you hereby accept the Terms. Non-commercial uses of the work are permitted without any further permission from Dove Medical Press Limited, provided the work is properly attributed. For permission for commercial use of this work, please see paragraphs 4.2 and 5 of our Terms.