")
Back to Journals » Neuropsychiatric Disease and Treatment » Volume 10
Psychometric evaluation of the Sheehan Disability Scale in adult patients with attention-deficit/hyperactivity disorder
Authors Cole T, Coon C, DeMuro C, McLeod L, Gnanasakthy A
Received 1 October 2013
Accepted for publication 26 November 2013
Published 19 May 2014 Volume 2014:10 Pages 887—895
DOI https://doi.org/10.2147/NDT.S55220
Checked for plagiarism Yes
Review by Single anonymous peer review
Peer reviewer comments 3
Theresa Coles,1 Cheryl Coon,1 Carla DeMuro,1 Lori McLeod,1 Ari Gnanasakthy2
1Patient-Reported Outcomes, RTI Health Solutions, Research Triangle Park, NC, 2Novartis Pharmaceuticals, East Hanover, NJ, USA
Abstract: Inattention and impulsivity symptoms are common among adults with attention-deficit/hyperactivity disorder (ADHD), which can lead to difficulty concentrating, restlessness, difficulty completing tasks, disorganization, impatience, and impulsiveness. Many adults with ADHD find it difficult to focus and prioritize. Resulting outcomes, such as missed deadlines and forgotten engagements, may ultimately impact the ability to function at work, school, home, or in a social environment. The European Medicines Agency guidelines for evaluating medicinal products for ADHD recommend inclusion of both functional outcomes, such as school, social, or work functioning, and outcomes related to symptoms of ADHD in clinical studies of novel medication primary efficacy endpoints. Due to its performance in other disease areas and the relevance of its items as evidenced by content validity analyses, the Sheehan Disability Scale (SDS) was chosen to assess functional impairment in ADHD. The aim of this study was to investigate the psychometric properties of the SDS, used as a brief measure of functional impairment in a number of psychiatric disorders, in adult patients with ADHD. To the authors' knowledge, this is the first study to evaluate the reliability of the SDS (based on Cronbach's coefficient alpha and test-retest reliability), its validity (construct and known-groups validity), and its ability to detect change in this patient population. This study also established a preliminary responder definition for the SDS in this study population to determine when change can be considered clinically beneficial in a clinical trial setting. The psychometric results support the use of the SDS subscales (items 1–3) and total score (sum of items 1–3) in an ADHD population. In addition, the evaluation provides evidence for a three-point preliminary responder definition for the SDS and further evidence of its responsiveness in adults with ADHD. Altogether, the results indicate that the SDS is a simple and easy-to-score scale that would have great utility in future clinical trials for monitoring functional impairment in adults with ADHD.
Keywords: Sheehan Disability Scale, adult attention-deficit/hyperactivity disorder, psychometric validation
Introduction
Attention-deficit/hyperactivity disorder (ADHD) is one of the most common psychiatric disorders, with an estimated childhood prevalence of 4%–12% in the US1 and an adult prevalence of 2.5%–4.2% in the world.2–4
The diagnostic criteria for ADHD in the Diagnostic and Statistical Manual of Mental Disorders (DSM) have changed over time. Most recently, ADHD examples in the DSM-IV (Fourth Edition) apply to elementary-aged children only. It is now understood that ADHD persists into adolescence and adulthood. To mark this change, the DSM-V (Fifth Edition) uses an updated definition that includes adult experiences and requires fewer symptoms (five instead of six out of nine inattention symptoms and five instead of six of nine hyperactivity and impulsivity symptoms) for a reliable adult diagnosis from age 12 years onwards (instead of age 7 years). The new definition is believed to improve the reliability of diagnoses. With the new definition, it may be possible to facilitate continuity of ADHD care from childhood through adulthood, therefore providing improved treatment outcomes.
Symptoms of inattention and impulsivity are common among adults with ADHD, and can lead to difficulty with concentration or focus, difficulty completing tasks, disorganization, impatience, and impulsive behavior. Many adults with ADHD find it difficult to focus and prioritize, leading to outcomes such as missed deadlines and forgotten meetings or social engagements. These outcomes may ultimately impact the ability to function at work, school, home, or in a social environment. The European Medicines Agency guidelines for evaluating medicinal products for ADHD recommend that a functional outcome, such as school, social, or work functioning, be included as a primary efficacy endpoint as well as an outcome related to symptoms of ADHD in clinical studies of novel medication. Due to its performance in other disease areas, the Sheehan Disability Scale (SDS) was chosen to assess functional impairment in this study.
The SDS was developed in 1983 as a brief measure of functional impairment in a number of psychiatric disorders (eg, panic disorder, social phobia, major depression, alcohol dependence) to measure the impact of treatment on disability in both clinical trials and clinical practice. It is used extensively in a range of psychiatric disorders, including in adults with ADHD, but there is no evidence currently available to indicate that the SDS has been specifically validated in adults with ADHD. Qualitative work to support the content validity of the SDS items in adults with ADHD has been conducted by RTI Health Solutions. These data support the relevance and importance of these items included in the SDS for use in adult patients with ADHD.
The aim of this study was to investigate the psychometric properties of the SDS in adult patients with ADHD. As such, it is the first study to evaluate the reliability, validity, and ability of the SDS to detect change in this patient population. This study also established a preliminary responder definition for the SDS in this study population to determine when change can be considered to be clinically beneficial in a clinical trial setting.
Materials and methods
Study design
Post hoc analysis of data from the first 9 weeks of a 40-week randomized, double-blind, placebo-controlled, multicenter Phase IIIb clinical trial was performed to assess the psychometric properties of the SDS. Recruitment for the clinical trial took place between November 2010 and March 2012.
The trial included a prerandomization period and three treatment periods (fixed-dosing, optimal-dosing, withdrawal-dosing). Patients were randomized to one of four treatment arms (MPH-LA (modified-release methylphenidate) 40 mg/day, 60 mg/day, 80 mg/day, or placebo). Period 1 comprised 9 weeks, and consisted of a 3-week titration period and a 6-week fixed-dose stage (40 mg/day, 60 mg/day, 80 mg/day, or placebo). The clinical trial was designed to confirm the clinically effective dose range and maintenance of effect of MPH-LA and to evaluate its safety profile compared with placebo in adult patients with childhood-onset ADHD. This large randomized, controlled trial was the first to examine outcomes reported by clinicians, patients, and family members in the same population using a novel study design with co-primary endpoints and functional and symptomatic assessments. In adults with childhood-onset ADHD, MPH-LA 40, 60 and 80 mg/day led to a beneficial impact on family life, work life and social life, as shown by SDS total score improvement, compared to placebo, at the end of the 9-week double-blind dose confirmation phase. Similar, overall improvements in ADHD as measured on the DSM-IV Attention-Deficit/Hyperactivity Disorder Rating Scale (DSM-IV ADHD RS) total score at the end of the 9-weeks were observed. The benefits observed with MPH-LA in the short term period of the study were maintained when dose-optimized treatment was continued for 6 months. A complete description of the trial, including detailed results has been published by Huss and colleagues, 2013.5
Only data from period 1 are considered for these psychometric analyses. In addition, because the evaluation was focused on the properties of the SDS rather than the efficacy of MPH-LA, treatment group comparisons were not conducted for all the psychometric analyses.
Approximately 700 adult patients with a diagnosis of confirmed childhood-onset ADHD were enrolled in the trial. This study includes 462 of those patients in the intent-to-treat sample who completed period 1 by an interim data cut in June 2012. The intent-to-treat sample (ie, full analysis set) during period 1 was defined as all randomized patients who took one dose of study medication in period 1.
Patient characteristics
Key demographic and patient characteristics were tabulated to describe the sample. Patient ages ranged from 18 to 60 years, with a mean of 35.8±11.6 years. Male patients outnumbered female patients (54% versus 46%). Most patients lived in the US or Germany (84.8%), with other countries including Belgium, Columbia, Denmark, Norway, Singapore, South Africa, and Sweden. White was the most frequently reported race (93%).
Measures
The following paper-based outcome measures were administered throughout the trial.6 Data from three timepoints during period 1 (screening, baseline and week 9) were used for the psychometric evaluation.
Sheehan Disability Scale
The SDS (Table 1) is a five-item, self-rated questionnaire designed to measure the extent to which a patient’s disability due to an illness or health problem interferes with work/school, social life/leisure activities, and family life/home responsibilities.7 In the first three items, respondents are asked to indicate how much their symptoms have disrupted their regular activities over the past week in each of these areas using a rating scale for each item, ranging from 0 (not at all) to 10 (extremely). Each subscale (a work disability, a social life disability, a family life disability) can be scored independently or combined into a single total score (sum of the nonmissing responses for items 1–3) representing a global impairment rating, ranging from 0 to 30, with higher scores indicative of significant functional impairment. Subscale scores greater than 5 suggest impairment in that subscale area.8 The final two items ask patients about the number of days on which their symptoms caused them to miss school and/or work and the number of days on which their symptoms caused them to be underproductive at school and/or work (these items were not included in the SDS total score). For this clinical trial, before responding to SDS items 1–3, patients were verbally instructed to recall the past 7 days, while items 4–5 refer to the last week within the item wording.
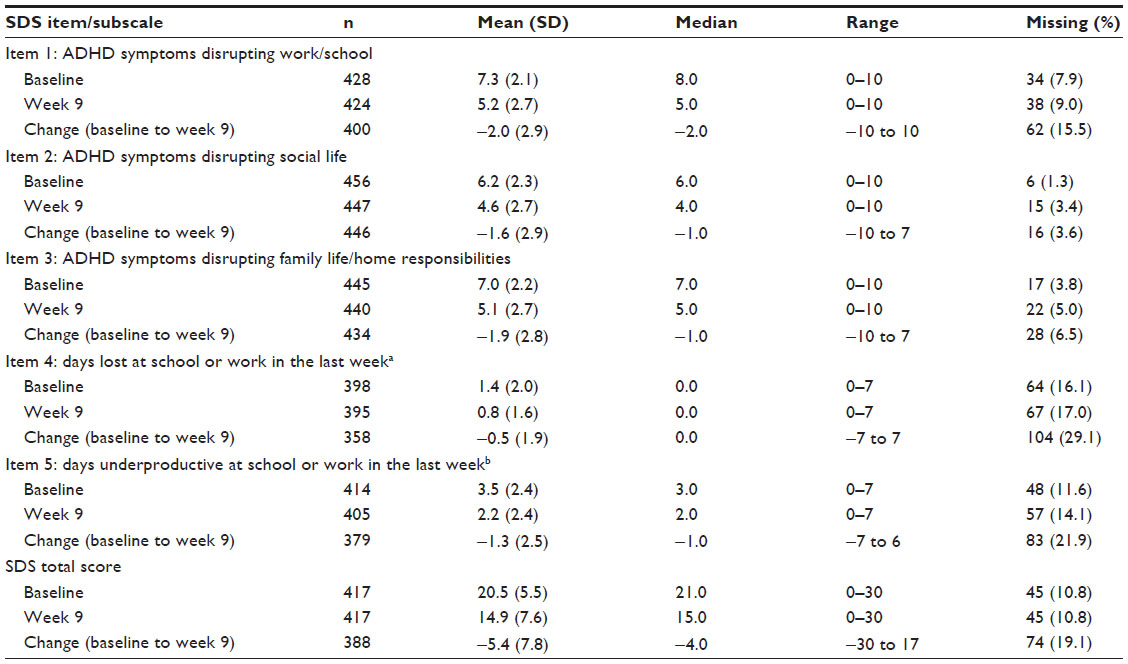 | Table 1 SDS descriptive statistics |
DSM-IV ADHD rating scale
The DSM-IV ADHD rating scale is a clinician-reported instrument designed to assess ADHD symptoms using 18 ordinal scale items with four response options directly adapted from the DSM-IV ADHD symptom list. The wording of the original items was modified to use with patients who have adult ADHD.9 Clinicians record the frequency of each symptom as reported by the patient for the past 7 days from “rarely or never” to “very often”. Three summary scores may be derived: an inattention subscore (range 0–27), a hyperactivity/impulsivity subscore (range 0–27), and a total score (range 0–54). Higher scores indicate worse ADHD symptoms. A total score ≥30 on the DSM-IV ADHD rating scale at screening and baseline was required for inclusion in the trial.
CGI-I
The Clinical Global Impressions Scale for Global Improvement (CGI-I) is a clinician-rated instrument designed to assess the overall change of illness relative to baseline on a 1 (“very much improved”) to 7 (“very much worse”) scale, providing a consistent comparison of the current status to the baseline status.10
CGI-S
The Clinical Global Impressions Scale for Severity of Illness (CGI-S) is a clinician-rated instrument designed to assess the patient’s current illness state on a 1 (“normal, not at all ill”) to 7 (“among the most extremely ill patients”) scale.10
ASRS version 1.1
The World Health Organization Adult Self-Report Scale (ASRS) symptom checklist11,12 is an 18-item tool to screen for probable ADHD in adults. The ASRS checklist asks respondents to indicate how they have felt and conducted themselves over the past 6 months in terms of frequency of inattention or hyperactivity symptoms, which are rated from 0 (“never”) to 4 (“very often”). The checklist is divided into two parts and results in an inattention subscore (range 0–36), a hyperactivity/impulsivity subscore (range 0–36), and a total score based on the full scale (range 0–72).
Analytic methods
Descriptive statistics for SDS
Descriptive statistics, with frequencies and percentages, were reported to assess the distribution of scores and possible floor/ceiling effects (where by 40% of respondents at most endorse one extreme and less than 5% endorse the opposite extreme) for the SDS items.
Structure of SDS: inter-item correlations
To assess the structure of the SDS, Pearson correlations were computed between continuous SDS items (items 1–3) and Spearman correlations were computed for correlations involving SDS items measured as a count (items 4 and 5). It was anticipated that all SDS items would be at least moderately correlated (>0.30), with inter-item correlations greater than 0.80 indicating potential redundancy.
Reliability of SDS
The reliability of the SDS was assessed by estimating internal consistency using Cronbach’s coefficient alpha.13 An estimate was computed using items 1–3 at baseline and week 9, and was expected to be between 0.70 and 0.90 and similar across time points. Further, to assess the extent to which the SDS items correlated with the SDS total score, item-total correlations for items 1–3 of the SDS were each correlated with the total SDS score (minus that item). Given that the SDS has been validated in other populations, strong item-scale correlation coefficients (ie, >0.50) were anticipated. Test-retest reliability was computed for a subgroup of patients in whom clinicians reported that their condition was stable (ie, “unchanged”) from baseline to week 9 on the CGI-I. Intraclass correlation coefficients from a two-way (subjects × time) random-effects analysis of variance (ANOVA) were used for this assessment.14
Construct validity of SDS
Correlations (ie, Pearson correlations for two continuous variables, polyserial correlations for a continuous variable with a categorical variable, Spearman correlations when at least one count variable is present) between the SDS total and subscale scores and among the DSM-IV ADHD rating subscales, CGI-I, CGI-S, and ASRS subscales were conducted to examine the construct validity of the SDS. Inferences about the patterns of correlation between the measures were made to demonstrate convergent validity. Cohen’s criteria15 were used to differentiate levels of hypothesized strength of the correlations. It was hypothesized that the SDS would correlate highly (r>0.50) with the DSM-IV ADHD rating because the SDS aims to measure consequences of the symptoms measured in this rating. The CGI-I and ASRS were anticipated to yield high correlations with the SDS, and the CGI-S was hypothesized to yield a moderate correlation (r>0.40) with the SDS because the CGI-S is a general measure of illness.
Known-groups validity
ANOVAs were used to examine mean differences in the SDS total score, as well as items 1–3, between patients classified into subgroups defined to be distinct. A priori hypotheses based on these subgroups were: patients whose DSM-IV ADHD rating scale scores were greater than 0.25 of a standard deviation (SD) above the mean would have more severe ADHD symptoms and impairment (ie, higher SDS scores) than those with DSM-IV ADHD rating scale scores more than 0.25 of an SD below the mean; lower levels of mental illness in the clinician-reported CGI-S would be associated with lower average SDS scores; patients whose ASRS scores were greater than 0.25 SD above the mean would have more severe ADHD symptoms and impairment (ie, higher SDS scores) than those with ASRS scores more than 0.25 of an SD below the mean. The magnitude of differences between the DSM-IV ADHD rating scale-defined and ASRS-defined groups was characterized by Cohen’s d effect size estimates.
Ability of SDS to detect change
A variant of the responsiveness statistic devised by Guyatt et al16 was computed to establish the responsiveness of the SDS total scores and scores on items 4 and 5 using change from baseline to week 9 based on improved patients (“very much improved”, “much improved”, “minimally improved”), unchanged patients (“no change”), and worsened patients (“very much worse”, “much worse”, “minimally worse”) on the CGI-I.
Preliminary SDS responder definition
Two methods were used to estimate a preliminary responder definition for clinically meaningful change. The first was an anchor-based method examining the average change in scores on the SDS for patients whose clinicians reported the patient as “minimally improved” in their level of disability on the CGI-I. The second involved distribution-based methods (eg, standard error of measurement [SEM] and one-half of an SD for the average SDS scores at baseline) were used as supplementary methods for defining responders on the SDS. A cumulative distribution function plot examined the magnitude of differences between treatment groups at the preliminary SDS responder definition location.
Conventions of analysis
All analyses, except for the cumulative distribution function plots, were performed blinded from a treatment indicator using non-last observation carried forward records from the intent-to-treat sample (ie, full analysis set). Analyses were conducted using SAS for Windows version 9.2 or later (SAS Institute, Inc, Cary, NC, USA).17
Ethics
Eligible patients were required to provide consent to participate in the clinical trial, which was approved by an institutional review board or independent ethics committee. Ethics approval for these analyses was granted by the institutional review board at RTI Health Solutions.
Results
SDS descriptive statistics
Table 1 displays the SDS descriptive statistics at baseline, week 9, and for the change from baseline to week 9. At baseline, mean scores for items 1, 2, and 3 were above 6, indicating significant functional impairment, but at week 9, mean scores showed improvement by at least 1.5 units lower than at baseline. Total scores also improved from baseline to week 9, with a mean change of 5.4 units. Patients scored higher on item 1 than the other items contributing to the total score, indicating that ADHD symptoms had disrupted school or work more than social and family life responsibilities. Mean responses to item 4 indicated improvement from baseline (1.4 days) to week 9 (0.8 days), with 55.8% of patients reporting no missed days at baseline and 69.1% of patients reporting no missed days at week 9. The number of unproductive days at school or work (item 5) improved by 1.3 days, on average, between baseline and week 9.
Frequencies and percentages of each of the five items of the SDS were also examined. No evidence of floor or ceiling effects was observed. The proportion of missing data on the SDS was low for the first three items (<10%) but not low for items 4 and 5, which asked about school or work.
SDS structure: inter-item correlations
Table 2 presents an inter-item correlation matrix of SDS items. All baseline and week 9 correlations were in the expected range: above 0.30, indicating associated items, and below 0.80 (r<0.80), which usually indicates item redundancy. The strongest correlations were observed between items 1–3 (baseline, 0.53–0.62; week 9, 0.76–0.79).
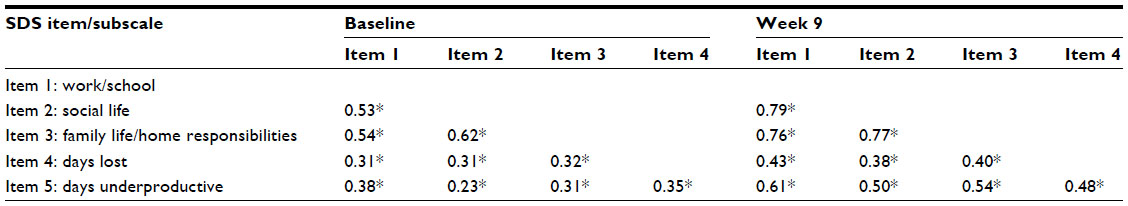 | Table 2 SDS inter-item correlations |
Although all correlations met the hypothesized threshold of 0.30, week 9 correlations were stronger than baseline correlations. This was likely due to skewness in ADHD symptom severity at baseline, which was regulated by the inclusion and exclusion criteria in the trial. Thus, this anomaly was an expected product of the limited range due to inclusion and exclusion criteria or a factor related to regression to the mean after treatment and should not be seen as implying any structural differences of the SDS from baseline to week 9.
SDS reliability
Estimates of the internal consistency reliability, as measured by Cronbach’s alpha, ranged from 0.79 (95% confidence interval [CI] 0.76–0.82) at baseline to 0.91 (95% CI 0.90–0.93) at week 9. The baseline estimate suggested that SDS items were highly consistent and reliable. Although alpha was slightly above the recommended range18 at week 9, there was insufficient justification to remove any item. All item-total correlations were strong and met the proposed magnitude threshold of r>0.50 at baseline (0.59–0.66) and week 9 (0.81–0.83). Again, the pattern of week 9 correlations was greater than those at baseline. Table 3 displays test-retest results for SDS items and total score. The test-retest reliability of the total SDS score achieved the threshold of 0.7019 for multi-item scales, with a value of 0.72 for the screening-to-baseline calculation (Table 3).
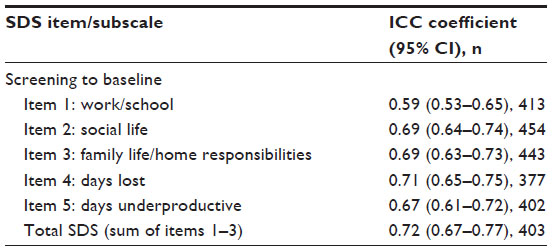 | Table 3 SDS test-retest reliability: item-level and total SDS |
SDS construct validity
As hypothesized, correlations between the SDS and the DSM-IV ADHD rating scale were above 0.50 at week 9, with the highest correlations between the total scores (0.71), as shown in Table 4. The SDS correlated strongly with the CGI-I at week 9 as expected, and exceeded the hypothesized moderate strength at week 9 for the CGI-S (all r>0.50). All correlations between the SDS and the ASRS were strong (r>0.50), with the highest being between the SDS total score and the ASRS total score at week 9 (r>0.77). The weakest correlations were observed between the SDS total score and the hyperactivity and impulsivity scales of the DSM-IV ADHD rating scale and the ASRS. This finding emphasizes the ability of the SDS to differentiate functional ability, given that school and work and school functions are more related to attention than hyperactivity or impulsivity.20
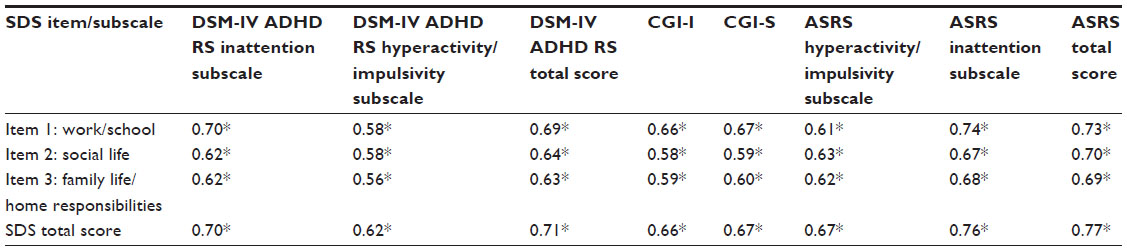 | Table 4 SDS construct validity correlations at week 9 |
Known-groups validity
Known-group results by SDS item and total SDS score across the DSM-IV ADHD rating scale subgroups were statistically significant (Table 5). The SDS total scores were higher on average for the more severe group than for the less severe group, suggesting that the SDS was capable of discriminating the highest and lowest levels of ADHD disability. The corresponding Cohen’s d effect size for the baseline comparison was 0.4 and reached 1.8 at week 9.
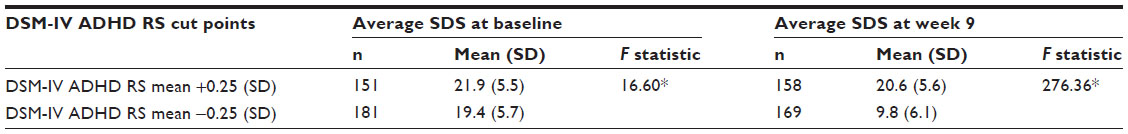 | Table 5 Known-groups ANOVAs for the SDS total score based on the DSM-IV ADHD RS |
As expected, lower levels of mental illness in the CGI-S were associated with lower average SDS scores. The ANOVA results were statistically significant for the SDS total score (F=63.25, P<0.01) and all SDS items, providing evidence that the SDS can distinguish between severity levels of ADHD illness.
As hypothesized, patients whose ASRS scores were more than 0.25 SD above the mean had more severe ADHD symptoms and impairment (ie, higher SDS scores) than those with ASRS scores more than 0.25 SD below the mean (Table 6). The difference in the total SDS scores between the two ASRS groups was statistically significant, providing evidence that the SDS was sensitive enough to differentiate levels of ADHD symptom severity as measured by the patient. The corresponding Cohen’s d effect size for the baseline comparison was 1.2 and reached 2.1 at week 9.
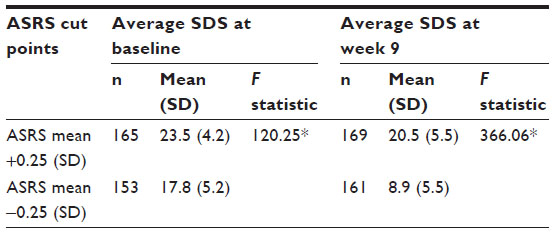 | Table 6 Known-groups item-level ANOVAs for the SDS total score based on the ASRS |
Ability of SDS to detect change
In patients whose ADHD was rated as improved according to the clinician on the CGI-I, average SDS scores decreased from baseline to week 9, indicating improvement in impact of ADHD symptoms (Table 7). Patients who worsened over this time according to the CGI-I also reported worsening (ie, increase) on SDS average scores. Patients whose clinicians reported no change on the CGI-I had relatively consistent scores (ie, change near zero). Guyatt’s statistics were strong (>0.80) for most SDS item and total scores when comparing improved versus unchanged scores. Statistics involving the unchanged group could not be interpreted owing to a small sample size (n=10, Table 7).
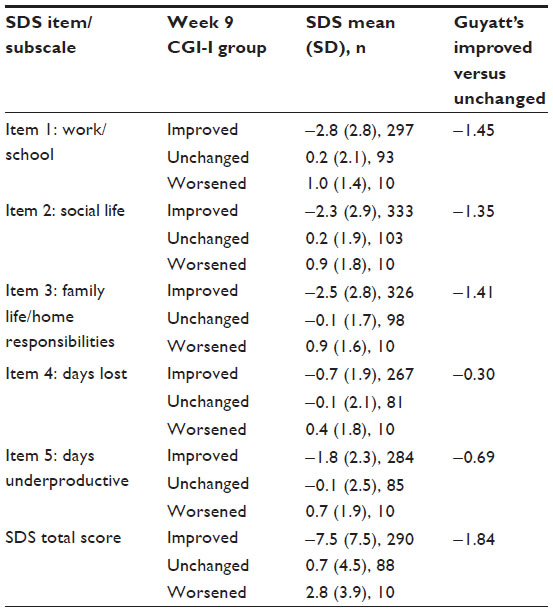 | Table 7 Ability of SDS to detect change |
Preliminary SDS responder definition
Anchor-based method
Of the 76 patients who showed “minimally improved” ADHD symptoms at week 9 according to the clinician, the associated change in average SDS total scores from baseline to week 9 was −2.53 (SD, 4.6, Table 8). The appropriateness of using the week 9 CGI-I item was supported by negative change in SDS total scores (improvement) in the improved categories on the CGI-I and positive change in SDS total scores (worsening) in the worsened categories. The CGI-I approach also suggested an approximately three-point change for defining a responder on the SDS.
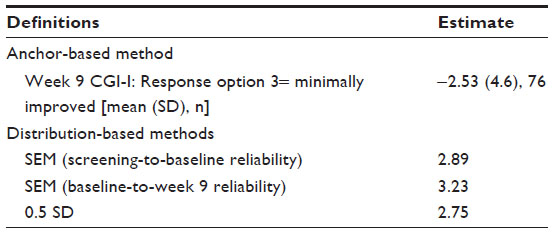 | Table 8 Responder threshold estimates |
Distribution-based method
The SEM provided support for a three-point change (SEM baseline to week 9 and screening to baseline). The use of a 0.5 SD unit change in the average SDS scores yielded an estimate of 2.75 and supported a three-point change.
Cumulative distribution function
The cumulative distribution function plot in Figure 1 shows the cumulative percentage of patients achieving each SDS change score. A negative change is associated with improvement over time. The treatment groups being shifted to the left of the placebo group indicate that a greater proportion of patients in the treatment group achieve more improvement than the placebo group. The 95% CIs show that the three active treatment lines differ significantly from the placebo line between the values of −2 and −6, thus providing additional support for a three-point SDS responder definition.
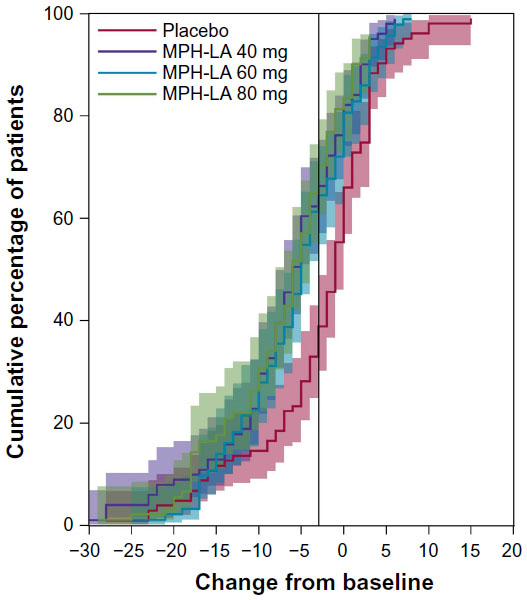 | Figure 1 Cumulative distribution function. |
Discussion
The results of these psychometric analyses support the use of the SDS subscales (items 1–3) and total score (sum of items 1–3) in an ADHD population and are consistent with other published psychometric evaluations with different patient populations.20–22 As with the previous investigations, the validity and reliability of the tool, as well as the factor structure, are supported by these analyses and contribute to the body of evidence supporting the use of the SDS in adult patients with ADHD. Prior to this work, to our knowledge, there were no published data to support this context of use for the SDS. These results should be considered in the context of a number of considerations. First, the inclusion and exclusion criteria of this clinical trial restrict the sample to patients with a certain level of ADHD severity as measured by the DSM-IV ADHD rating scale, resulting in limited variance for all ADHD-related measures at baseline and weaker baseline psychometric results versus the week 9 results. Week 9 responses are more heterogeneous and are the focus of this evaluation. Second, missing data are observed in some measures but not in others, and should be interpreted with caution, because missing data are likely owing to a nonrandom interim sampling of the full analysis dataset.
A previous psychometric evaluation of the SDS in bipolar disorder found 4.05 to be a meaningful change using a distribution-based approach.21 This evaluation provides evidence for a three-point preliminary responder definition for the SDS. It is reflective of an anchor-based approach to identifying change and is supported by the cumulative distribution function curve, but this SDS responder definition should be confirmed in future samples in ADHD.
The SDS has been psychometrically evaluated in a number of populations,22 and this study supports the utility of this scale in an additional group, ie, adults with ADHD. The SDS is a short, simple, and easy-to-score scale that has been successfully evaluated on reliability, validity, and responsiveness in adults with ADHD. The SDS should be considered as an appropriate short-scale measure of functional impairment for future studies evaluating medicinal products for ADHD.
Disclosure
This work was conducted while Cheryl Coon was an employee of RTI Health Solutions. Dr Coon is currently employed by Adelphi Values. The authors report no conflicts of interest in this work.
References
Green M, Wong M, Atkins D, et al. Diagnosis of attention deficit/hyperactivity disorder: technical review 3. Agency for Health Care Policy and Research publication 99-0050. Rockville, MD: US Department of Health and Human Services; 1999. Available from: http://www.ncbi.nlm.nih.gov/books/NBK44173/. Accessed November 27, 2013. | |
Simon V, Czobor P, Balint S, Meszaros A, Bitter I. Prevalence and correlates of adult attention-deficit hyperactivity disorder: meta-analysis. Br J Psychiatry. 2009;194:204–211. | |
Kessler RC, Adler LE, Ames M, et al. The prevalence and effects of adult attention deficit/hyperactivity disorder on work performance in a nationally representative sample of workers. J Occup Environ Med. 2005;47:565–572. | |
Fayyad J, de Graaf R, Kessler R, et al. Cross-national prevalence and correlates of adult attention-deficit hyperactivity disorder. Br J Psychiatry. 2007;190:402–409. | |
Huss M, Ginsberg Y, Tvedten T, et al. Methylphenidate Hydrochloride Modified-Release in Adults with Attention Deficit Hyperactivity Disorder: A Randomized Double-Blind Placebo-Controlled Trial. Adv Ther. 2013;31(TBC): In press. | |
Kumar V, Ginsberg Y, Tvedten T, et al. RIT-AB -38509 40-week, double-blind, placebo-controlled, efficacy and safety study of methylphenidate hydrochloride modified release (MPH-LA) in adult ADHD: study design. Poster presented at the 4th ADHD Congress, June 6–9, 2013, Milan, Italy. | |
Sheehan DV. The Anxiety Disease. New York, NY, USA: Charles Scribners Sons; 1983. | |
Williams JBW. Mental health status, functioning and disabilities measures. In: American Psychiatric Association Task Force. Handbook of Psychiatric Measures. Washington, DC, USA: American Psychiatric Association; 2000. | |
American Psychiatric Association. Diagnostic and Statistical Manual of Mental Health Disorders. 4th ed. Washington, DC, USA: American Psychiatric Association; 1994. | |
Guy W. Clinical global impressions. In: Guy W. ECDEU Assessment Manual for Psychopharmacology. Revised [DHEW Publ No ADM 76-338]. Rockville, MD, USA: US Department of Health, Education, and Welfare; 1976. | |
Adler LA, Kessler RC, Spencer T. Adult ADHD Self-Report Scale-v1.1 Symptom Checklist. New York, NY, USA: World Health Organization; 2003. Available from: http://www.med.nyu.edu/Psych/training/adhd.html. Accessed July 22, 2010. | |
Kessler RC, Adler L, Ames M, et al. The World Health Organization Adult ADHD Self-Report Scale (ASRS): a short screening scale for use in the general population. Psychol Med. 2005;35:245–256. | |
Cronbach LJ. Coefficient alpha and the internal structure of tests. Psychometrika. 1951;16:297–334. | |
Schuck P. Assessing reproducibility for interval data in health-related quality of life questionnaires: which coefficient should be used? Qual Life Res. 2004;13:571–586. | |
Cohen J. Statistical Power Analysis for the Behavioral Sciences. 2nd ed. Hillsdale, NJ, USA: Lawrence Erlbaum Associates; 1988. | |
Guyatt GH, Walter SD, Norman G. Measuring change over time: assessing the usefulness of evaluative instruments. J Chronic Dis. 1987;40:171–178. | |
SAS Institute, Inc. SAS proprietary software, version 9.2. Cary, NC, USA: SAS Institute, Inc; 2008. | |
Streiner DL, Norman GR. Health Measurement Scales: A Practical Guide to their Development and Use. 2nd ed. New York, NY, USA: Oxford University Press; 1995. | |
Nunnally JC, Bernstein IH. Psychometric Theory. 3rd ed. New York, NY, USA: McGraw-Hill; 1994. | |
Leon A, Olfson M, Portera L, Farber L, Sheehan D. Assessing psychiatric impairment in primary care with Sheehan Disability Scale. Int J Psychiatry Med. 1997;27:93–105. | |
Luciano J, Bertsch J, Salvador-Carulla L, et al. Factor structure, internal consistency and construct validity of the Sheehan Disability Scale in Spanish primary care sample. J Eval Clin Pract. 2010;16:895–901. | |
Arbuckle R, Frye MA, Brecher M, et al. The psychometric validation of the Sheehan Disability Scale (SDS) in patients with bipolar disorder. Psychiatry Res. 2007;169:163–174. | |
Sheehan KH, Sheehan DV. Assessing treatment effects in clinical trials with the discan metric of the Sheehan Disability Scale. Int Clin Psychopharmacol. 2008;23:70–83. |
 © 2014 The Author(s). This work is published and licensed by Dove Medical Press Limited. The full terms of this license are available at https://www.dovepress.com/terms.php and incorporate the Creative Commons Attribution - Non Commercial (unported, v3.0) License.
By accessing the work you hereby accept the Terms. Non-commercial uses of the work are permitted without any further permission from Dove Medical Press Limited, provided the work is properly attributed. For permission for commercial use of this work, please see paragraphs 4.2 and 5 of our Terms.
© 2014 The Author(s). This work is published and licensed by Dove Medical Press Limited. The full terms of this license are available at https://www.dovepress.com/terms.php and incorporate the Creative Commons Attribution - Non Commercial (unported, v3.0) License.
By accessing the work you hereby accept the Terms. Non-commercial uses of the work are permitted without any further permission from Dove Medical Press Limited, provided the work is properly attributed. For permission for commercial use of this work, please see paragraphs 4.2 and 5 of our Terms.