")
Back to Journals » Journal of Hepatocellular Carcinoma » Volume 8
PRRC2A Promotes Hepatocellular Carcinoma Progression and Associates with Immune Infiltration
Authors Liu X, Zhang Y, Wang Z, Liu L, Zhang G, Li J , Ren Z, Dong Z, Yu Z
Received 3 September 2021
Accepted for publication 17 November 2021
Published 1 December 2021 Volume 2021:8 Pages 1495—1511
DOI https://doi.org/10.2147/JHC.S337111
Checked for plagiarism Yes
Review by Single anonymous peer review
Peer reviewer comments 4
Editor who approved publication: Dr Manal Hassan
Xin Liu,1– 3,* Yize Zhang,2,3,* Zenghan Wang,1– 3 Liwen Liu,1– 3 Guizhen Zhang,1– 3 Jianhao Li,1– 3 Zhigang Ren,1– 3 Zihui Dong,2,3 Zujiang Yu1– 3
1Department of Infectious Diseases, The First Affiliated Hospital of Zhengzhou University, Zhengzhou, Henan Province, People’s Republic of China; 2Precision Medicine Center, The First Affiliated Hospital of Zhengzhou University, Zhengzhou, Henan Province, People’s Republic of China; 3Gene Hospital of Henan Province, The First Affiliated Hospital of Zhengzhou University, Zhengzhou, Henan Province, People’s Republic of China
*These authors contributed equally to this work
Correspondence: Zujiang Yu; Zihui Dong Email [email protected]; [email protected]
Purpose: Hepatocellular carcinoma (HCC) has high morbidity and poor prognosis due to the propensity of recurrence and metastasis. Emerging studies have confirmed that proline-rich coiled-coil2A (PRRC2A) plays a crucial role in tumorigenesis and immunoregulation. However, its expression status and biological functions in HCC remain poorly documented.
Methods: The presence and prognostic value of PRRC2A were determined by a tissue microarray (TMA) cohort and multiple databases, mainly from The Cancer Genome Atlas (TCGA), Gene Expression Omnibus (GEO), Clinical Proteomic Tumor Analysis Consortium (CPTAC). Functional enrichment analysis was applied to identify the mechanisms of PRRC2A in HCC. The biological function of PRRC2A in HCC progression in vitro was determined by CCK-8, colony formation, EdU, transwell migration and invasion assays. Moreover, the Estimation of STromal and Immune cells in Malignant Tumor tissues using Expression data (ESTIMATE), single-sample gene set enrichment analysis (ssGSEA), tumor immune dysfunction and exclusion (TIDE) algorithms, immunophenoscore (IPS) and public available immunotherapy cohorts were performed to classify their associations with tumor-infiltrating immune cells and immunotherapy.
Results: PRRC2A was upregulated in HCC at both mRNA and protein levels. High PRRC2A expression was correlated with poor prognosis and could be an independent risk factor. Functional enrichment analysis demonstrated that elevated PRRC2A was significantly correlated with the activation of various oncogenic pathways. Additionally, in vitro experiments confirmed that silencing PRRC2A could suppress the proliferation and metastasis capacities of HCC cells. More importantly, PRRC2A was negatively associated with many anti-tumor immune cells, but positively related to the expression of markers of exhaustive T cells. And HCC patients with high PRRC2A were more likely to be nonresponsive to immunotherapy.
Conclusion: This study explored the predictive value and biological roles of PRRC2A in HCC progression and indicated that it might be a potential biomarker for HCC patients and a predictor for immunotherapy.
Keywords: hepatocellular carcinoma, PRRC2A, prognosis, immune infiltration, immunotherapy
Introduction
Hepatocellular carcinoma (HCC) comprises up to 90% of all primary hepatic malignancies.1 It is ranked as the third cause of cancer-related death in the world.2 Although recent advances in surgical resection and medical treatments, the overall survival rate remains poor due to metastasis and recurrence after surgery or other treatments.3 Hence, it is urgent to study the pathophysiological mechanisms contributing to HCC, which could lead the way for the development of biomarkers and treatment strategies.
PRRC2A (Proline-rich coiled-coil2A), also named BAT2, is one of the genes localized near those coding for TNF alpha and TNF beta and within the human major histocompatibility complex (MHC) class III region.4 PRRC2A has been defined as the increased risk of developing rheumatoid arthritis (RA), an auto-immune disease.5 In addition, a single nucleotide polymorphism of PRRC2A was associated with ER-positive breast cancer,6 lung cancer,7 and non-Hodgkin lymphoma.8 However, its expression profiles and molecular functions in HCC have not yet been elucidated.
In our study, the expression and functions of PRRC2A in HCC through bioinformatics data mining, clinical tissues, and in vitro experiments have been investigated. Results suggested that higher PRRC2A expression correlated to worse prognosis, higher proliferation and metastasis capacities of HCC cells and less responsive possibilities to immunotherapy. Thus, PRRC2A could be a potential biomarker for HCC and might be a promising therapeutic target for HCC patients by ameliorating tumor immunosuppression.
Materials and Methods
HCC Databases Acquire and Processing
Gene expression profile (HTSeq-Counts, 371 HCC tissues and 50 normal specimens) was retrieved from The Cancer Genome Atlas (TCGA) database (https://portal.gdc.cancer.gov/) and subsequently quantified using R software via the transcript per million (TPM) method. Log2 (TPM+1) was used for further analysis. The detailed clinicopathologic information was obtained using the c-BioPortal website (http://cbioportal.org),9 an open-access database for the interactive investigation of multidimensional cancer genomics datasets. For the TCGA-LIHC cohort, a total of 365 patients with the corresponding clinical characteristics were enrolled in our study. Exclusion criteria were as follows: (i) “0” gene expression value for PRRC2A and (ii) insufficient overall survival information. Five HCC RNA sequencing datasets (all from the same platform: GPL570) were acquired from Gene Expression Omnibus (GEO) database (http://www.ncbi.nlm.nih.gov/geo/), as shown in Table S1. Moreover, one dataset about liver cancer received anti-PD1 treatment on mouse (GSE120714) was also downloaded from GEO database and pan-cancer expression data of PRRC2A was obtained from the Tumor IMmune Estimation Resource (TIMER) 2.0 website (https://cistrome.shinyapps.io/timer/).10
Patients and Specimens
The HCC tissue microarray (TMA) cohort (80 paired HCC tissues and adjacent liver tissues) was constructed. All specimens used in the study were gathered from patients who underwent surgical resection at the First Affiliated Hospital of Zhengzhou University, China. The patients neither had any history of other malignancies nor received any treatment when enrolled in this study. The protocol was approved by the Institutional Review Board of the First Affiliated Hospital of Zhengzhou University.
Immunohistochemistry (IHC)
IHC staining was performed as described.11 In brief, TMA section was deparaffinized and rehydrated. Then the antigen was retrieved in citrate buffer pH 6 and 1% bovine serum albumin (BSA, Solarbio, Beijing, China) was applied to prevent nonspecific binding. Subsequently, the section was treated with rabbit polyclonal antibody anti-PRRC2A (1:100 dilution; Abcam, UK) overnight at 4°C. The secondary antibody (Proteintech Group, China) was added for incubation at room temperature, and then diaminobenzidine (DAB) solution (Dako Denmark) was applied for staining. Nuclear staining was performed using Harris hematoxylin. The final score for PRRC2A staining was evaluated based on the intensity and the proportion of positively stained cells from 1+ to 4+. The scores from 1+ to 2+ were defined as low PRRC2A expression group, whereas a score of 3+ to 4+ was defined as high PRRC2A expression group.
Cell Culture, Transfection, and Selection
Cells were received from the Cell Bank of the Chinese Academy of Science (Shanghai, China) and cultured in Dulbecco’s modified Eagle’s medium (DMEM) medium containing 10% (vol/vol) fetal bovine serum (FBS, Gibco, Grand Island, USA), 100 U/mL Penicillin/Streptomycin (Corning, USA) in a 5% CO2 humidified incubator at 37 °C. PRRC2A silencing was achieved by using a specific lentiviral vector containing a short hairpin RNA (shRNA) targeting PRRC2A (Hanbio Tech, Shanghai, China). Transfection was done as previously described.11 Selection for PRRC2A sh-RNA (sh-PRRC2A) or negative control (sh-NC) transfected cells were processed using puromycin at a concentration of 2ug/mL. The specific sequences were exhibited as follows: sh-NC: 5ʹ-TTCTCCGAACGTGTCACGTAA-3ʹ; PRRC2A-sh1: 5ʹ-CCCAACACCAGAGACAGAACCTGAA-3ʹ; PRRC2A-sh2: 5ʹ-GGGAATTCCGCAGTTACCGAGAGTT-3ʹ; PRRC2A-sh3: 5ʹ-GAGACTGCATCAGAGAGCAGTGACT-3ʹ.
Quantitative Real-Time PCR (qRT-PCR)
Cells were treated as previously indicated and processed as described previously.11 The related expression of PRRC2A was evaluated using 2−ΔΔCt method. The primers were as follows: PRRC2A-Forward: 5ʹ-TGGCAGCAGCAGTGGAGGAG-3ʹ; PRRC2A-Reverse: 5ʹ-TGGAGGACGACTTCGGTTCTTGG-3ʹ; GAPDH-Forward: 5ʹ-AGCCACATCGCTCAGACAC-3ʹ; GAPDH-Reverse: 5ʹ-GCCCAATACGACCAAATCC-3ʹ.
Immunofluorescence (IF)
Cells seeded in 24-well plates were fixed with 4% paraformaldehyde for 15 min and then placed in 0.5% Triton X-100 for 20 min to permeabilize. After blocking with phosphate buffered saline (PBS) containing 1% BSA, cells were incubated with anti-PRRC2A (Santa Ctuz, sc-373747,1:10 dilution) antibody at 4°C overnight followed by secondary antibodies (Proteintech Group, China) for 1 hour. Subsequently, the nuclei were counterstained with DAPI (Solarbio, Beijing, China) for 5 min. Finally, the images were obtained by a fluorescence microscope (Olympus, Tokyo, Japan).
Cell Invasion and Migration Assay
Cell invasion and migration assays were conducted using transwell chambers with 8-um pores (Corning, USA) coated/not coated with Matrigel (1:40 by DMEM medium, Corning, USA). 3×10⁴ cells mixed in DMEM medium without FBS were plated into upper sections. DMEM medium with 20% FBS was loaded in the lower chambers. After 24h incubation, cells were fixed with paraformaldehyde for 20 min and stained with crystal violet for 15 min. The cells were counted using an optical microscope.
Cell Proliferation Assays
In terms of the Cell Counting Kit-8 (CCK-8) assay, 3 × 10³ cells were cultured in 96-well plates and incubated with CCK-8 reagent (Dojindo, Kyushu, Japan) for 2h at 37°C. Cell viability was measured with absorbance at a wavelength of 450 nm (A450) on a Spectrophotometer at 24h, 48h, 72h, and 96h.
For colony formation assay, 6-well plates were used to seed HCC cells (1 × 10³ cells per well) and cultured for 14 days. Then, the colonies were fixed and stained, and an optical microscope was used to count the number of cell colonies.
For EdU assay, all procedures were achieved following the instruction of the Cell-Light™ EdU Apollo®567 In Vitro Imaging Kit (Ribobio, Guangzhou, China). The EdU positive cells were captured by fluorescence microscopy (Olympus, Tokyo, Japan).
Gene Expression Profiling Interactive Analysis (GEPIA) and Clinical Proteomic Tumor Analysis Consortium (CPTAC) Database
GEPIA12 is an online interface tool to explore and visualize the specific genes expression and underlying function in 33 types of human neoplasm based on TCGA and Genotype-Tissue Expression (GTEx) data. Here, a survival map and survival analysis were used to determine the relationship of PRRC2A expression levels with overall survival (OS) and disease-free survival (DFS). In addition, survival analysis of PRRC2A expression at protein level was also plotted using the CPTAC database (https://cptac-data-portal.georgetown.edu/), a large-scale proteomic and genomic or proteogenomics database.13
Oncomine Database
As the largest oncogene chip database, Oncomine (http://www.oncomine.org)14 dataset integrated data-mining platform, containing 715 gene expression data sets. The mRNA expression and DNA copy number of PRRC2A were determinedly the Oncomine 4.5 database, including Roessler Liver, Roessler Liver 2, Guichard Liver, GuichardLiver2 and TCGA Liver.
HCCDB
HCCDB (http://lifeome.net/database/hccdb)15 is a free website to examine particular gene expressions in HCC, which includes 15 datasets covering around 4000 clinical tissues to construct a global differential gene expression overview of HCC.
The cBio Cancer Genomics Portal (c-BioPortal) Analysis
With 225 cancer studies at present, c-BioPortal (http://cbioportal.org)16 is an open-access database for the interactive investigation of multidimensional cancer genomics datasets. c-BioPortal was used to examine the overview of PRRC2A alterations in the TCGA-LIHC dataset.
UALCAN
UALCAN (http://ualcan.path.uab.edu)17 is applied to explore particular query gene(s) expression between tumor and normal tissues, and in various tumor sub-groups such as tumor grade, stage, and other clinicopathological characteristics.
Survival Analysis
The R packages: survminer and survival calculated the best cut-off value to divide the HCC patients into high and low groups according to PRRC2A expression levels. Kaplan–Meier analysis with the Log rank test was conducted to compare the survival differences between the two groups. Univariate and multivariate Cox proportional hazards regression analyses were further applied to estimate the clinical significance of PRRC2A on prognosis indication.
Establishment of a Nomogram for Prognostic Prediction
Based on the univariate and multivariate Cox regression analyses results, a program was devised to determine the probability of 1-, 3-, and 5-year OS for HCC patients with the R package “RMS.”18 Calibration curves were applied to assess the prediction performance.
Functional Pathway Enrichment Analysis
R package: limma was first conducted to calculate the differentially expressed genes in PRRC2Alow and PRRC2Ahigh group with the criteria of |Log2Foldchange| > 1 and P-value < 0.05. Next, Kyoto Encyclopedia of Genes and Genomes (KEGG) and Gene ontology (GO) enrichment analyses were performed to determine the potential pathways that PRRC2A might be involved. R package: clusterProfiler19 was also used for Gene set enrichment analysis (GSEA) analysis with the KEGG, GO, and HALLMARKER gene sets that were downloaded from the molecular signatures database (MSigDB, http://software.broadinstitute.org/gsea/msigdb/index.jsp). The rank criterion was false discovery rate (FDR)< 0.05, and 1000 simulations were done.
Single Sample GSEA (ssGSEA)
ssGSEA computes the population of immune cells in a tumor specimen based on gene expression data and R package: gsva.20 TCGA-LIHC dataset was used to evaluate the immune cell infiltration levels. Spearman rank correlation analysis was performed to determine the relationship between PRRC2A levels and 28 types of immune cells infiltration levels. The R packages: heatmap and ggplot were then used to visualize their correlations according to the coefficient.
Estimation of STromal and Immune Cells in Malignant Tumor Tissues Using Expression Data (ESTIMATE) Analysis
Estimation for Immune Score, Stromal Score, and ESTIMATE Score of each HCC sample was carried out with R package: ESTIMATE, which suggests that a lower score represents a less amount of the corresponding component in the tumor microenvironment.21
Analysis of the Tumor Immune Dysfunction and Exclusion and Immunophenoscore (IPS) Evaluation
The Tumor immune dysfunction and exclusion (TIDE) algorithm22 was conducted to explore the correlation of PRRC2A with TIDE scores and to predict the response possibility between PRRCA2low and PRRC2Ahigh group to immune checkpoint inhibitor. Additionally, we analyzed the relationships of PRRC2A expression with several clinical cohorts received immunotherapy through the TIDE website. The IPS was performed to predict the possibility of response to immunotherapy using the R software.
Statistical Analysis
SPSS 23.0 software (IBM Corp., Armonk, NY, USA), GraphPad Prism 7 (San Diego, CA, USA), and R software (version 3.6.7) were applied for statistical analysis or visualization. Differences between PRRC2A expressions in different groups were calculated using the Student’s t-test. Spearman correlation was performed to identify the relationship of PRRC2A with other genes, ESTIMATE score, TIDE score, and immune cell infiltration. P-value <0.05 was considered as statistically significant.
Ethics Statement
The studies involving human participants were approved by Ethics Committee of the First Affiliated Hospital of Zhengzhou University and was conducted in accordance with the Declaration of Helsinki. Written informed consent was obtained from the patients.
Results
The Landscape of PRRC2A mRNA Expression and Its Prognosis in Various Human Tumors
To explore the expression status of PRRC2A in tumors, the results from TIMER 2.0 online tool revealed that PRRC2A was frequently elevated in breast cancer (BRCA), colorectal cancer (COAD), prostate adenocarcinoma (PRAD) and liver hepatocellular carcinoma (LIHC), etc. (Figure 1A). Subsequently, according to the GEPIA database, high PRRC2A expression was correlated with poor OS in adrenocortical carcinoma (ACC), kidney renal clear cell carcinoma (KIRC), LIHC, pancreatic adenocarcinoma (PAAD) and sarcoma (SARC) (Figure 1B and D). Furthermore, worse DFS was found in ACC, LIHC, and PRAD with high PRRC2A expression group (Figure 1C and D). These results suggested that PRRC2A could have crucial prognostic value for multiple cancers. Hence, HCC was selected for further analysis due to its obvious elevated expression and prognostic role in both OS and DFS.
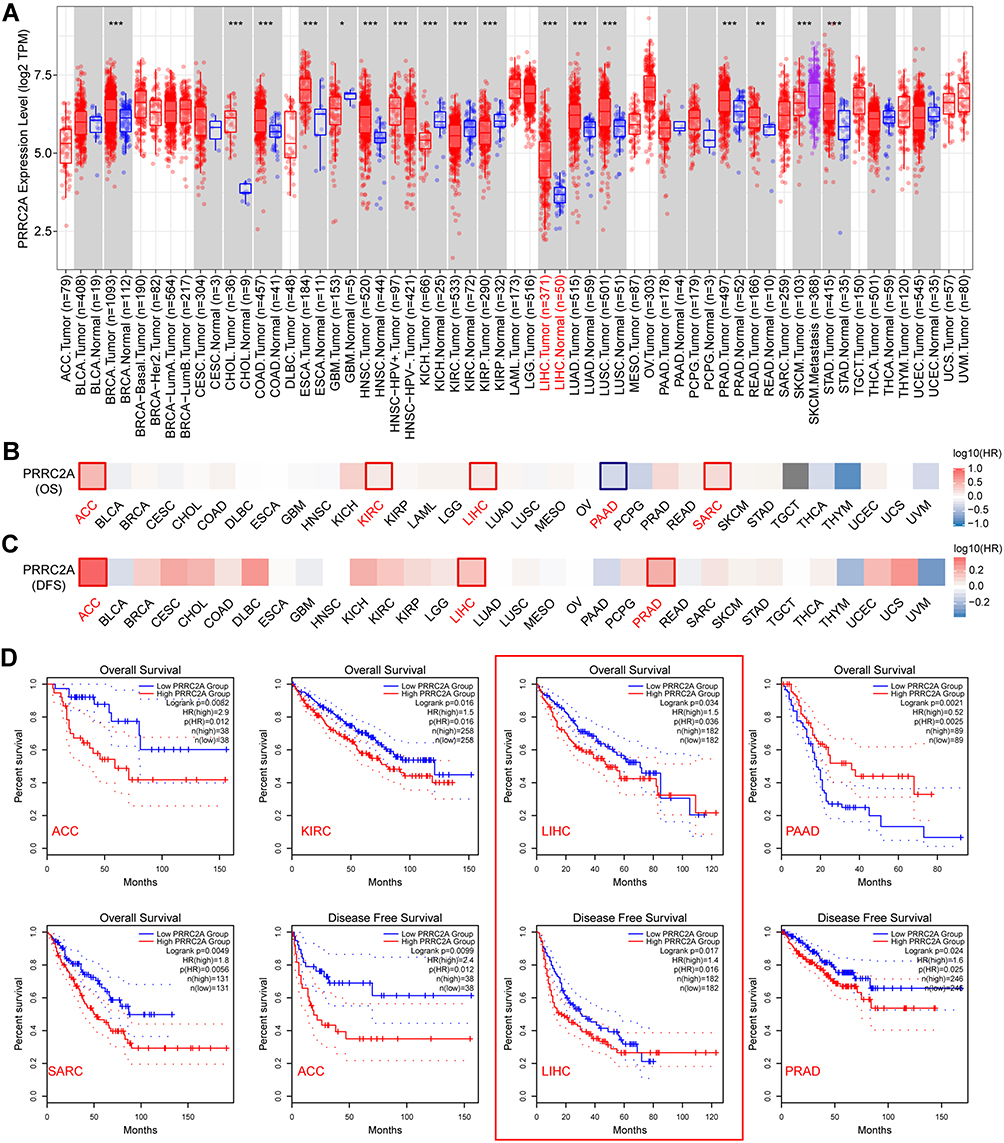 |
Figure 1 PRRC2A mRNA expression pattern and its clinical value in pan-cancer. (A) PRRC2A mRNA expression was frequently dysregulated in human solid tumors in TCGA pan-cancer analysis. (B and C) Survival map of PRRC2A expression in 33 common types of human tumors on overall survival (OS) (B) and disease-free survival (DFS) (C). (D) Survival analysis showed PRRC2A expression was inversely correlated with prognosis of ACC, KIRC, LIHC, SARC, PRAD except PAAD. *P < 0.05, **P < 0.01, ***P < 0.001. |
Validation of PRRC2A High Expression in HCC
In addition to the above findings, paired samples in the TCGA-LIHC cohort also confirmed high PRRC2A expression levels in HCC tissues (Figure 2A). Similar results were observed in relevant data sets retrieved from Oncomine, GEO and HCCDB databases (Figures S1A–C and S2A). Next, the underlying mechanism of PRRC2A dysregulation in HCC was explored. cBioPortal was used to investigate the types and frequency of PRRC2A alterations in the TCGA-LIHC dataset, shown with an OncoPrint plot (Figure S3A). As shown in Figure S3B–F, amplification was significantly associated with upregulated PRRC2A mRNA expression according to the results from cBioPortal and Oncomine database. Moreover, increased PRRC2A promoter methylation could significantly attenuate PRRC2A gene expression (Figure S3G). Results from UALCAN confirmed that the methylation of PRRC2A was much lower in HCC tissues than that in normal specimens (Figure S3H). The higher tumor stage or differentiation grade, the less the methylation level (Figure S3I and J). Collectively, abnormally high PRRC2A expression might play an important role in HCC development.
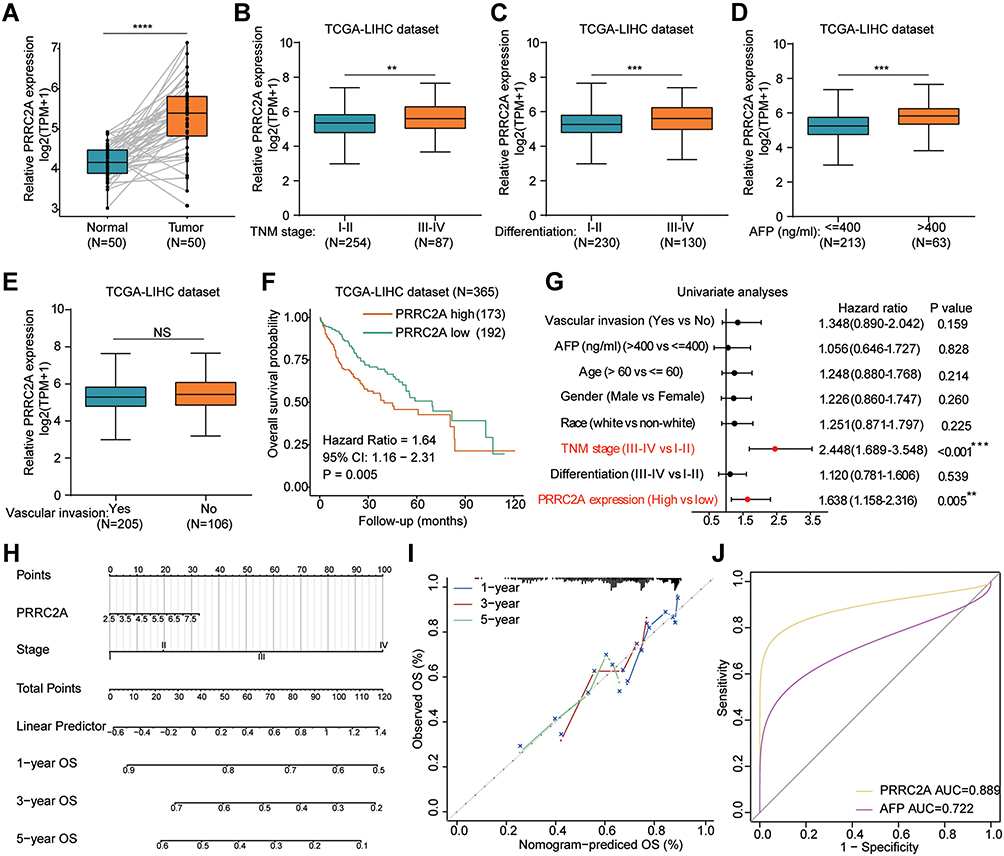 |
Figure 2 Association of PRRC2A mRNA expression with clinical features in TCGA-LIHC dataset. (A) Expression of PRRC2A in paired HCC and normal tissues in TCGA-LIHC cohort. (B–E) The level of PRRC2A in TNM stage (B), differentiation (C), AFP level (D) and vascular invasion (E). (F) The Kaplan–Meier curves about the correlation between PRRC2A expression and OS. (G) Univariate analyses of PRRC2A expression and other clinical characteristics for OS. (H) Nomogram for HCC 1-, 3- and 5-year OS. (I) Calibration curve. (J) The ROC curves of PRRC2A and AFP. **P < 0.01, ***P < 0.001, ****P < 0.0001. Abbreviation: NS, not significance (P > 0.05). |
High PRRC2A Was Positively Correlated with Clinicopathologic Features and Predicted Poor Prognosis in HCC
The correlation between the mRNA expression of PRRC2A and clinicopathological features was further investigated. High PRRC2A was positively associated with advanced TNM stage, poor differentiation grade, high AFP level but not vascular invasion (Figure 2B–E). In consistent with the results from the GEPIA database, Kaplan–Meier analysis indicated that patients with elevated PRRC2A levels had poorer OS and DFS based on the best cut-off value obtained by R packages-survminer and survival (Figures 2F and S2B). Furthermore, results from univariate and multivariate Cox regression analyses of the TCGA-LIHC dataset showed that PRRC2A could potentially act as an independent prognosticator in OS (Figure 2G and Table 1) and DFS (Figure S2C). TNM stage and PRRC2A expression for nomogram construction were selected to predict the 1-, 3-, and 5-year OS based on the TCGA-LIHC cohort (Figure 2H). Its estimation efficiency on the mortality of HCC was confirmed by the calibration curve (Figure 2I). As shown in Figure 2J, the Receiver Operating Characteristic (ROC) curves demonstrated that PRRC2A has greater power in terms of diagnosis for HCC than AFP. Thus, overall, PRRC2A played an essential role in HCC diagnosis and predicting HCC patients’ prognosis.
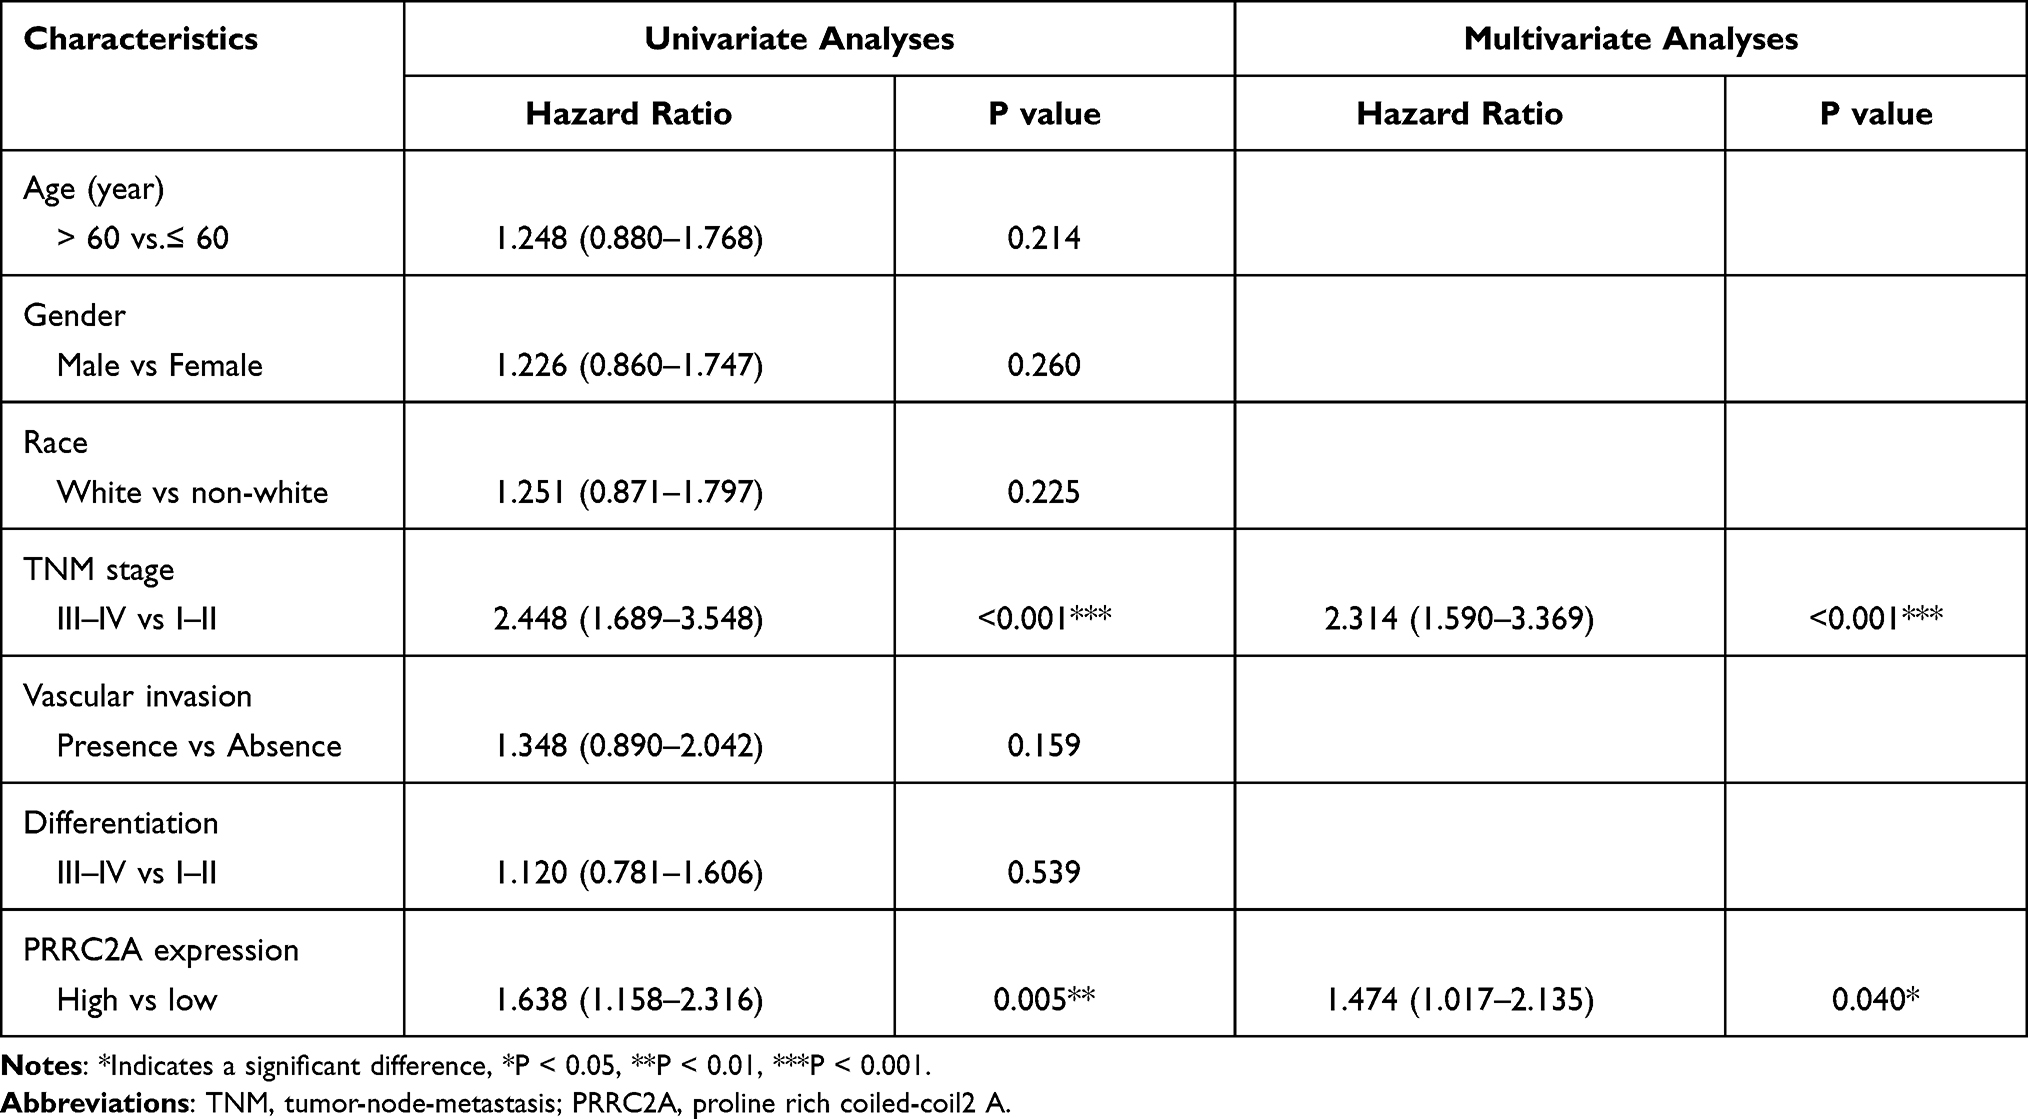 |
Table 1 Univariate and Multivariate Analyses of PRRC2A mRNA Expression for Overall Survival in HCC Patients from TCGA-LIHC Cohort |
High PRRC2A Was More Likely to Speed Up HCC Progression at the Protein Level
IHC analysis was applied in a larger TMA cohort containing 80 pairs of HCC samples to evaluate PRRC2A protein expression. Seventy-four pairs were finally retained according to the criteria that if one of the paired tissues is detached, both will be removed, and the clinical data are shown in Table 2. PRRC2A protein was distinctly upregulated in HCC tissues compared with adjacent liver tissues and inversely related to the prognosis of HCC patients (Figure 3A–C), which was further validated through analysis data of the HCC proteomics from the CPTAC database (Figure 3D and E). In addition, high PRRC2A protein expression might be a potential indicator for HCC patients living status (P = 0.055), however, no significant associations were observed among PRRC2A protein expression and age, gender, TNM stage, cirrhosis, or tumor size (Figure 3F). Moreover, the univariate analyses of our TMA cohort showed that both PRRC2A and TNM stage were associated with OS (Figure 3G). The data also confirmed that PRRC2A was an independent predictor in OS for HCC patients by multivariate analyses (Table 3). ROC curves showed that PRRC2A was more accurate than AFP in HCC diagnosis (Figure 3H). Collectively, PRRC2A was significantly overexpressed in HCC tissues at protein levels and could act as a novel predictor for HCC diagnosis and prognosis.
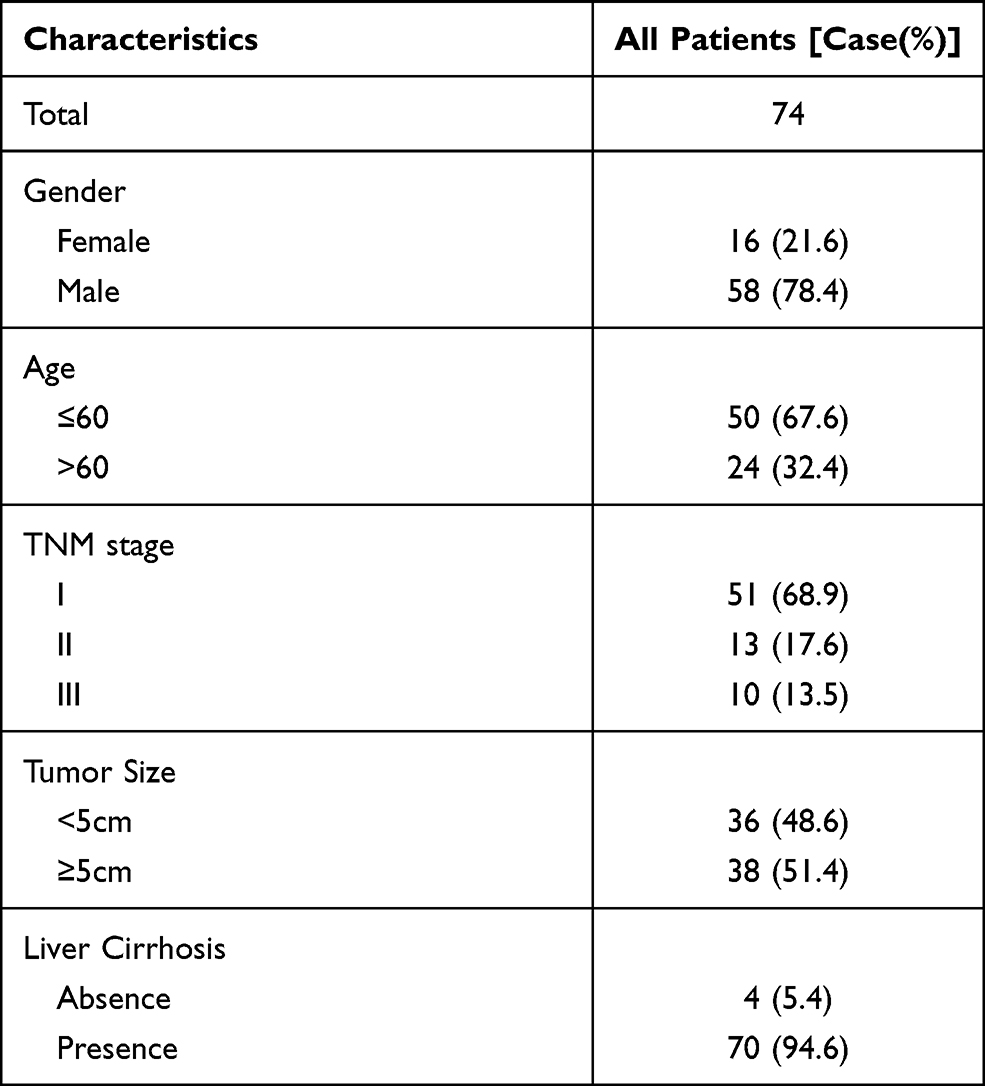 |
Table 2 Characteristics of 74 Patients in TMA Cohort |
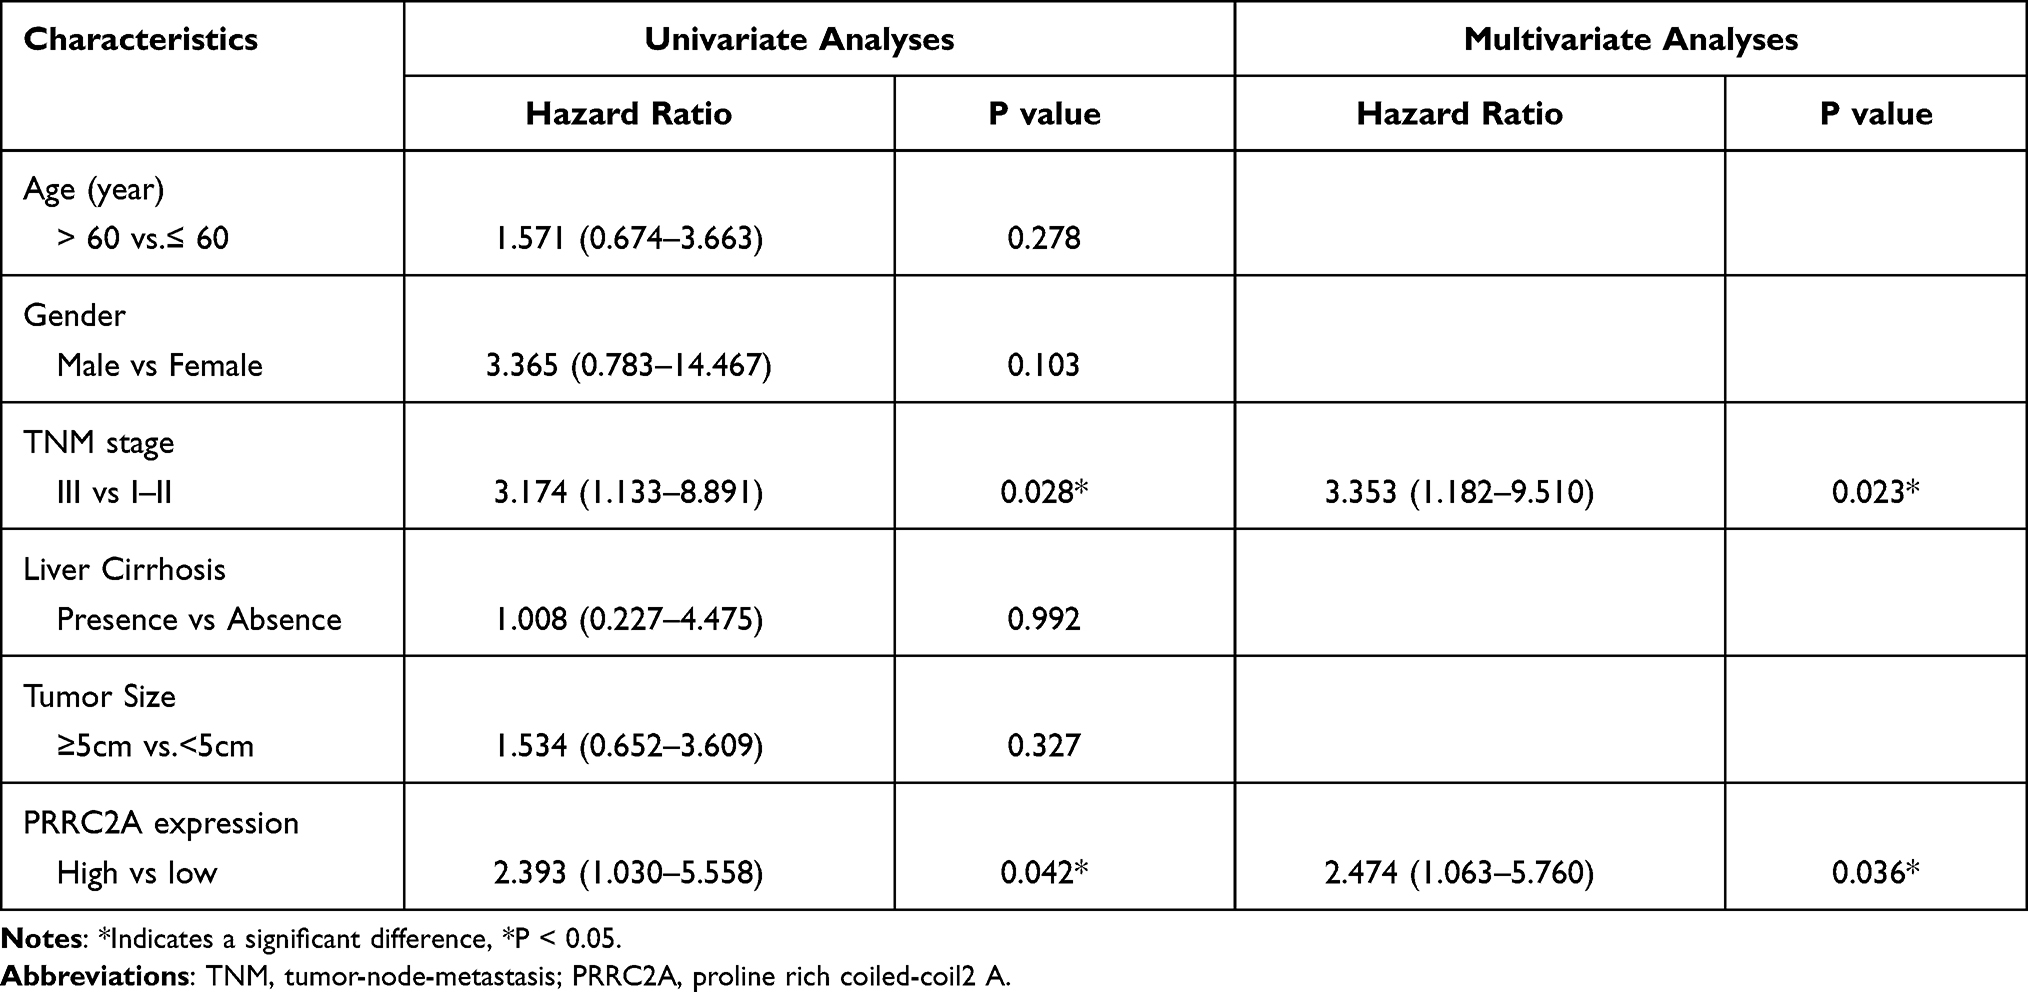 |
Table 3 Univariate and Multivariate Analyses of PRRC2A Protein Expression for OS in HCC Patients from TMA Cohort |
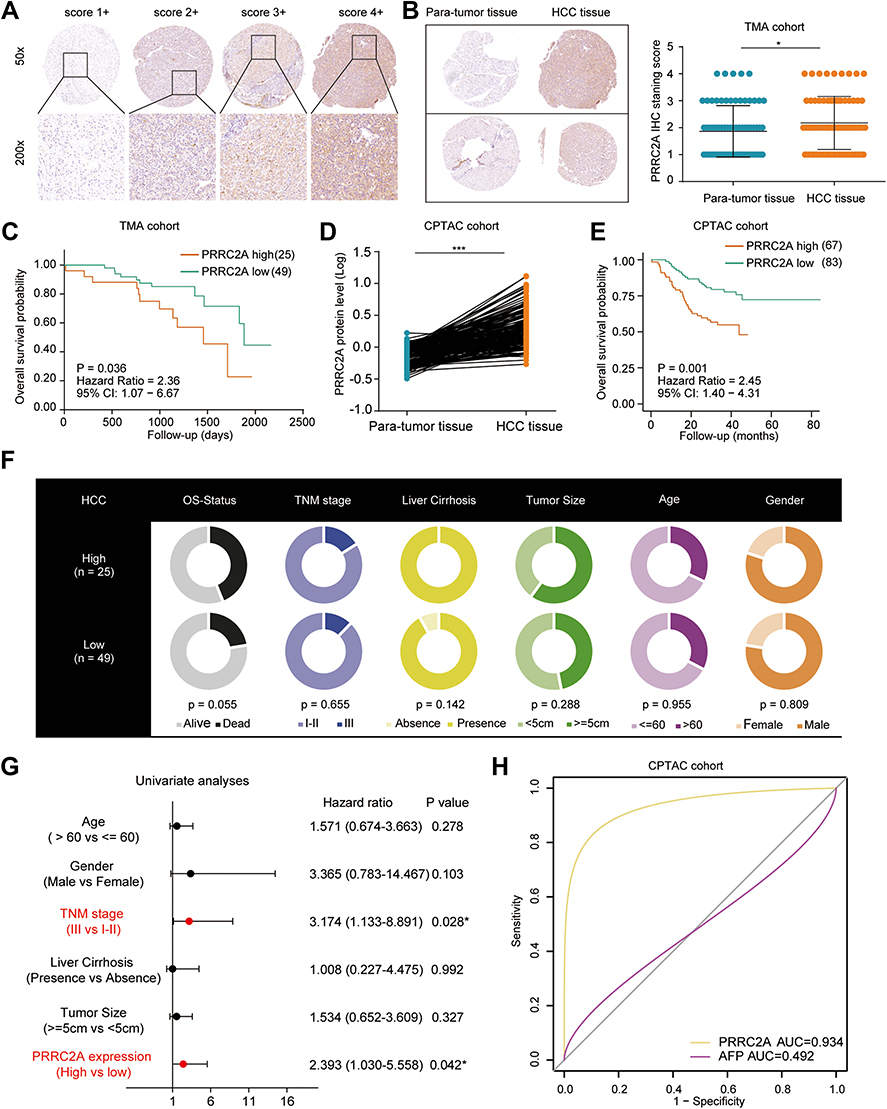 |
Figure 3 High PRRC2A was more likely to aggravate HCC progression at protein level. (A) The representative IHC images of PRRC2A in HCC tissues. (B) PRRC2A protein expression was higher in HCC tissues than para-tumor ones. (C) The Kaplan–Meier curves about the correlation between PRRC2A expression and OS. (D) The expression analysis of PRRC2A in CPTAC database. (E) The survival analysis of PRRC2A in CPTAC database. (F) The associations of PRRC2A with clinicopathological features in HCC patients. (G) Univariate analyses of PRRC2A expression and other clinical characteristics for OS. (H) The ROC curves of PRRC2A and AFP. *P < 0.05, ***P < 0.001. |
The Potential Molecular Mechanisms of PRRC2A in HCC Progression
Considering that PRRC2A might serve as an oncogene in HCC progression, bioinformatic analysis was performed to illustrate the underlying mechanisms based on PRRC2A expression in the TCGA-LIHC database. KEGG and GO analyses disclosed that PRRC2A was dominantly concerned with the cell cycle, DNA replication, and other cell proliferation-related pathways (Figure 4A and B). Moreover, GSEA analysis revealed that elevated PRRC2A expression was also associated with E2F_TARGETS, G2M_CHECKPOINT, DNA replication, tRNA export from nucleus and the activation of wnt/β-catenin and TGF-β signaling, which indicated that PRRC2A might play a pivotal role in promoting HCC development (Figure 4C–E, Tables S2 and S3). Furthermore, the relationship between PRRC2A expression and cell cycle and proliferation-related gene markers was explored. As shown in Figure 4F and Table 4, there were significantly positive correlation among PRRC2A and critical cell cycle and proliferation-related markers, including CCNA2, CCNB1, CCNC, CCNE1, CDK2, CDK4, CDK6 and MKi67. Overall, PRRC2A activated as an oncogene through the hyperactivation of multiple signaling pathways in HCC progression, especially cell cycle and proliferation pathways.
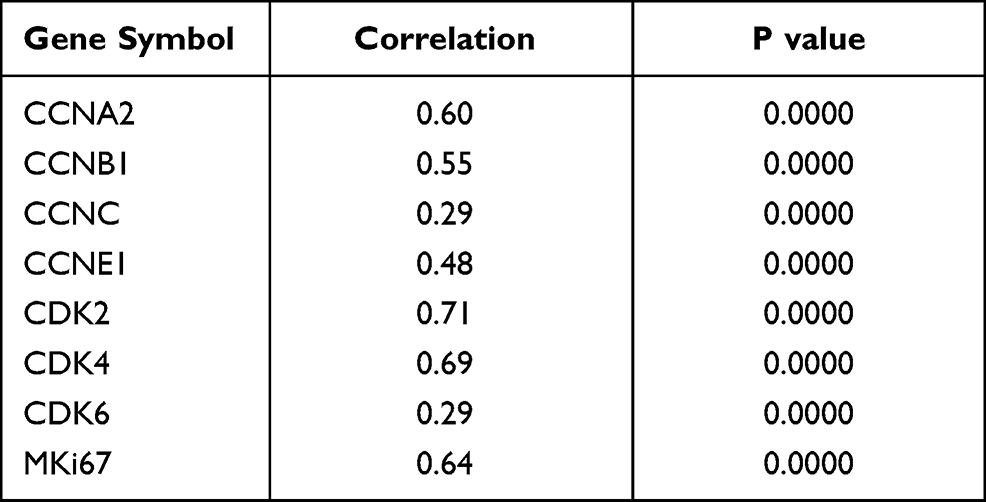 |
Table 4 The Correlation Analysis of PRRC2A and Cell Cycle Related Genes in TCGA-LIHC Dataset |
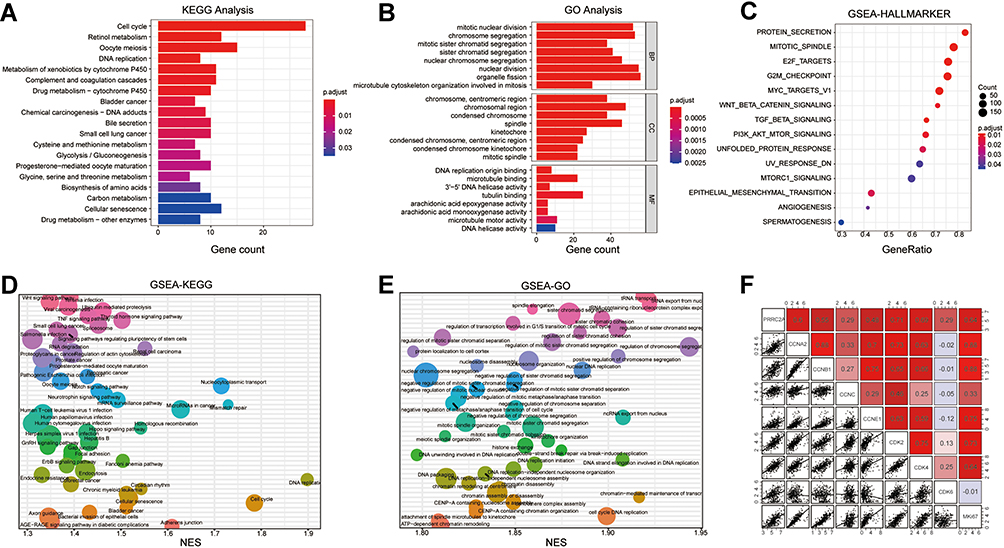 |
Figure 4 PRRC2A involved multiple biological pathways in HCC. (A) KEGG analysis. (B) GO analysis. (C) GSEA HALLMARKER analysis. (D) GSEA KEGG analysis. (E) GSEA GO analysis. (F) The correlation among PRRC2A and cell proliferation related gene markers. |
PRRC2A Silencing Suppressed Proliferation, Migration, and Invasion of HCC Cells in vitro
To illuminate the biological action of PRRC2A in HCC cells, the PRRC2A mRNA and protein expression in normal liver cell line (L02) and HCC cell lines (HCCLM3, BEL7402, Hep3B, and MHCC97H) were examined, and PRRC2A was highly expressed in HCC cell lines (Figures 5A and S4A). Then, HCCLM3 and MHCC97H cells were transfected with sh-PRRC2A or sh-NC lentivirus. qRT-PCR and IF detected the transfection efficacy, and PRRC2A-sh2 was used for further studies (Figures 5B and S4B). CCK-8 and colony formation assays were performed to evaluate the role of PRRC2A on the proliferation of HCC cells. Consequently, the growth ability of cells transfected with sh-PRRC2A was suppressed compared to the group with sh-NC (Figure 5C and D). Congruously, the EdU assay also showed that PRRC2A silencing could inhibit DNA replication (Figure 5E). Moreover, transwell assay revealed that knockdown of PRRC2A remarkably impeded the migration and invasion of HCC cells (Figure 5F and G). Above all, the data concluded that PRRC2A silencing could suppress HCC malignant progression in vitro.
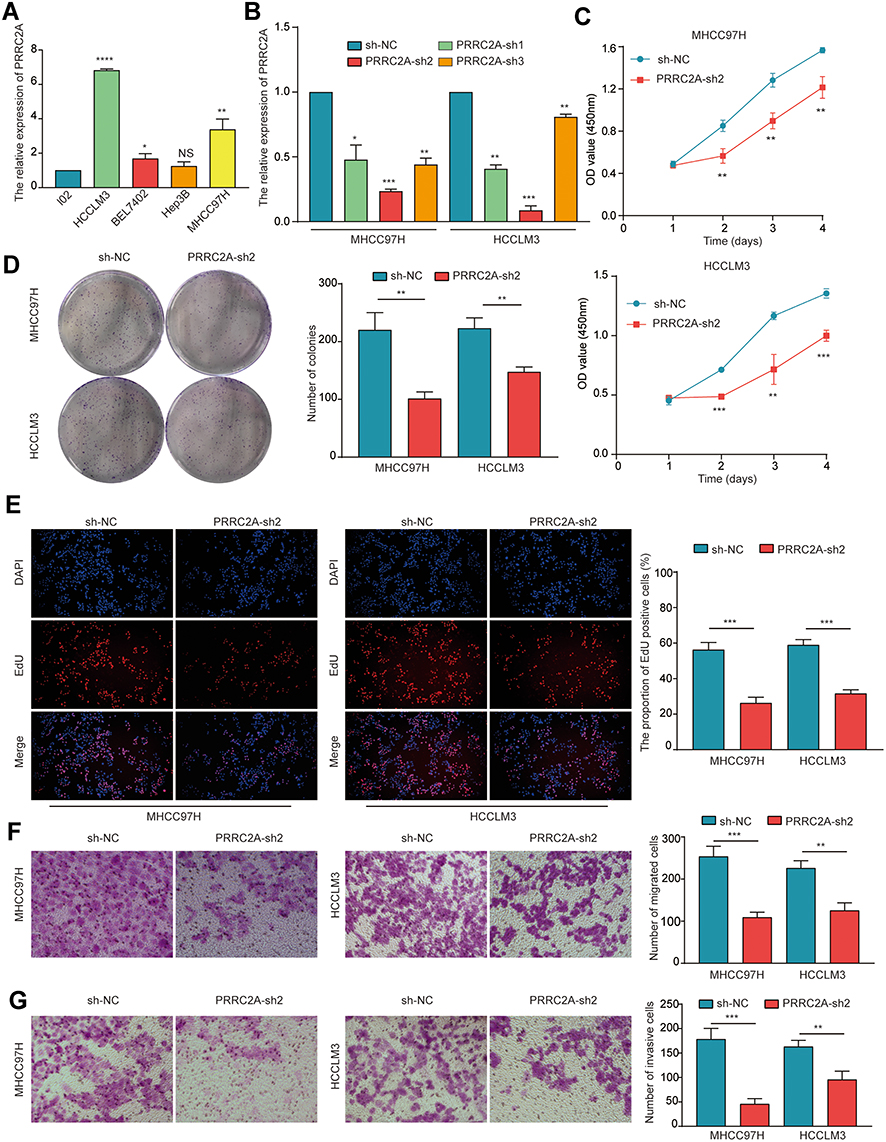 |
Figure 5 PRRC2A knockdown suppressed the proliferation and metastasis of HCC cells. (A) The expression level of PRRC2A in several HCC cell lines and L02 via qRT-PCR. (B) The stable knockdown of MHCC97H and HCCLM3 cells was constructed and determined by qRT-PCR. (C–E) The proliferation of HCC cells was evaluated by CCK-8 assay (C) and colony formation assay (D) as well as EdU assay (E). (F and G) The migration (F) and invasion (G) of HCC cells was identified via transwell assay. *P < 0.05, **P < 0.01, ***P < 0.001, ****P < 0.0001. |
PRRC2A Was Correlated with Immune Infiltration and Immune Escape in HCC
Previous studies have reported PRRC2A to be associated with immune response,5 therefore, the effect of PRRC2A expression on HCC immune cell infiltration was explored. The results from the ESTIMATE analysis revealed a negative correlation, and the PRRC2Ahigh group had a low immune score, stromal score, and ESTIMATE score compared with the PRRC2Alow group (Figure 6A and B). As plotted in Figure 6C, the results of ssGSEA further confirmed that high PRRC2A expression was obviously related with low infiltration of mostly immune cell types, such as CD56 bright natural killer cells (R = −0.33, P < 0.001), neutrophils (R = −0.31, P < 0.001) and activated CD8 T cells (R = −0.24, P < 0.001), etc. Few types of immune cells had positive correlations with PRRC2A expression, such as activated CD4 T cells (R = 0.29, P < 0.001), type 2 T helper cells (R = 0.27, P < 0.001) and central memory CD4 T cells (R = 0.21, P < 0.001). PRRC2Ahigh group had lower anti-cancer immune cell infiltration than PRRC2Alow group (Figure 6D). Subsequently, the relationship between PRRC2A and T cell exhaustion markers was investigated. As expected, the levels of the majority were positively correlated with PRRC2A expression, indicating that PRRC2A could induce the functional T cell into an exhaustive state (Figure 6E and Table 5). Moreover, the univariate Cox regression analyses revealed that anti-tumor lymphocyte cell subpopulations, such as activated CD8 T cells (ActCD8 T), effector memory CD8 T cells, type 1 T helper cells, and intermediate-tumor immunocyte, like activated B cells, eosinophil were favorable factors (all P < 0.05, Figure 6F). Similar results were obtained by KM analysis and we also found that HCC patients with high PRRC2A expression and low ActCD8 T cell infiltration have the worst OS (Figure 6G and H). Taken together, the high PRRC2A expression might be instrumental in establishing immunosuppressive environment in HCC.
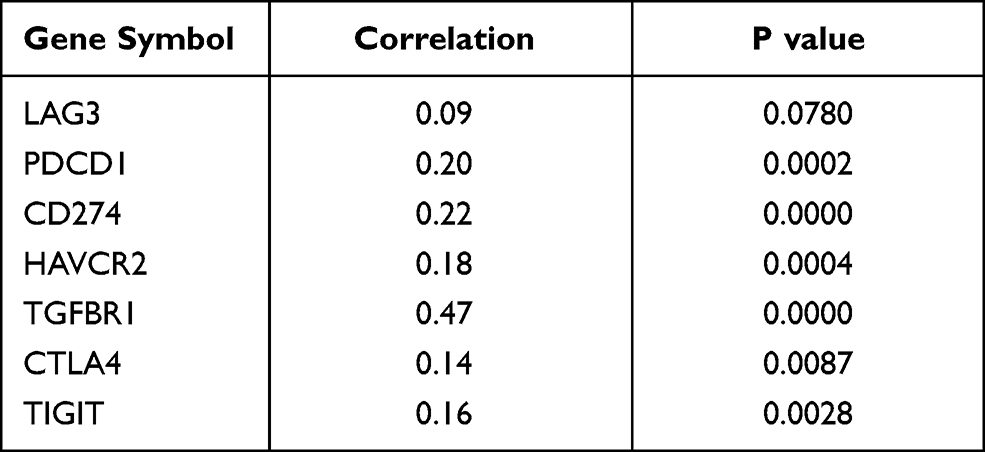 |
Table 5 The Correlation Analysis of PRRC2A and T Cell Exhaustion Related Markers in TCGA-LIHC Dataset |
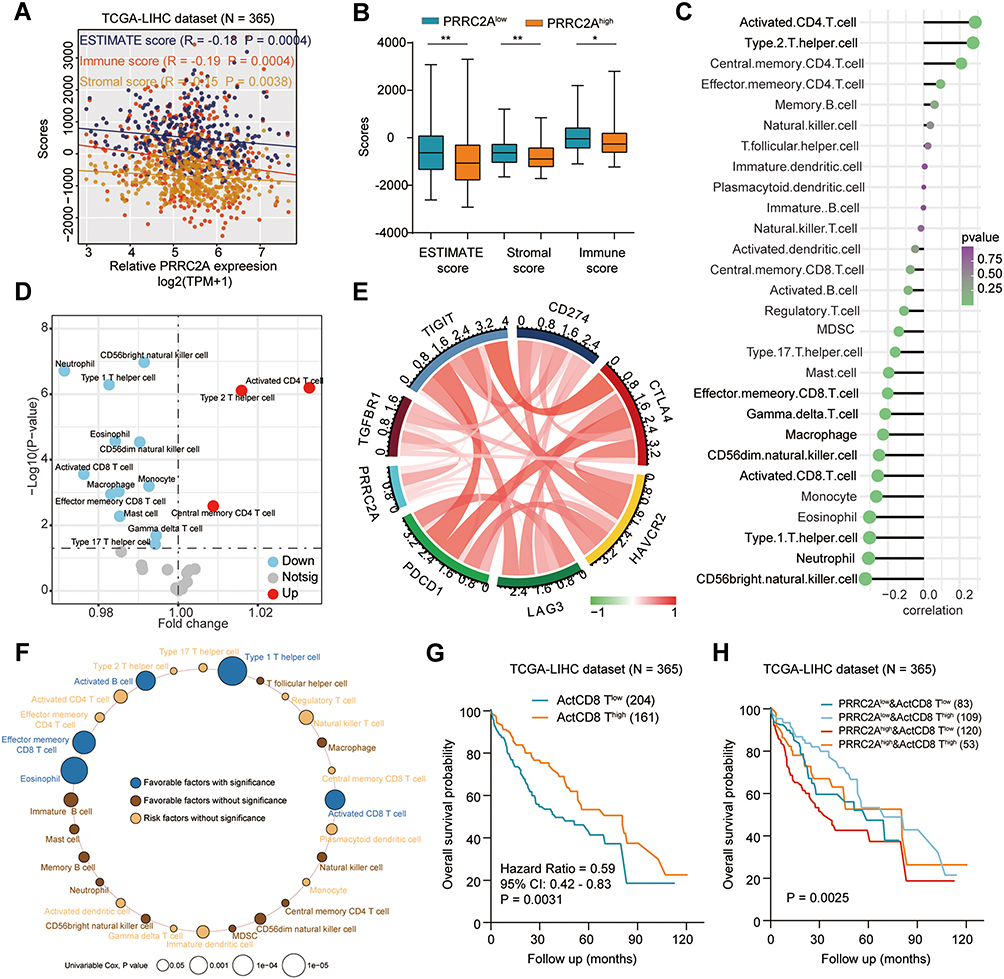 |
Figure 6 PRRC2A was correlated with immune infiltration in HCC. (A) The associations of PRRC2A expression with ESTIMATE score, immune score and stromal score. (B) The ESTIMATE score, immune score and stromal score between PRRC2Alow and PRRC2Ahigh group. (C) The correlation between PRRC2A expression and 28 kinds of immune cells. (D) The 28 kinds of immune cells in PRRC2Alow and PRRC2Ahigh group. (E) The association between PRRC2A expression and various T cell exhaustion markers. (F) Univariate Cox regression analyses of PRRC2A expression and 28 kinds of immune cells for OS. (G) The Kaplan–Meier curves about the correlation between Activated CD8 T cells infiltration and OS. (H) The Kaplan–Meier curves using combinations of PRRC2A expression and Activated CD8 T cells infiltration for OS. *P < 0.05, **P < 0.01. |
PRRC2A Was Inversely Associated with Efficacy of Immunotherapy in HCC
The association of high PRR2CA expression with immunotherapy tolerance in HCC was further examined. An obvious positive correlation between PRRC2A expression and TIDE score (Figure 7A and B) was found. Further, we estimated the IPS, an indicator to determine the tumor immunogenicity and predict response to ICI therapy in various tumors, to explore the associations between PRRC2A and immune response. The results showed that the PRRC2Alow group had a significantly higher IPS than the PRRC2Ahigh group (Figure 7C). Additionally, patients with elevated PRRC2A levels were more likely to show no response to immunotherapy according to the results from the TIDE analysis (Figure 7D), which was consistent with mice that received the anti-PD-1 therapy from the GSE120714 dataset (Figure 7E). More importantly, we observed that the OS and PFS for those melanoma or glioblastoma patients with low PRRC2A expression who received the anti-PD-1 therapy would be better (Figure 7F and G). In line with the above results, HCC patients with low PRRC2A level may be more sensitive to ICI treatment.
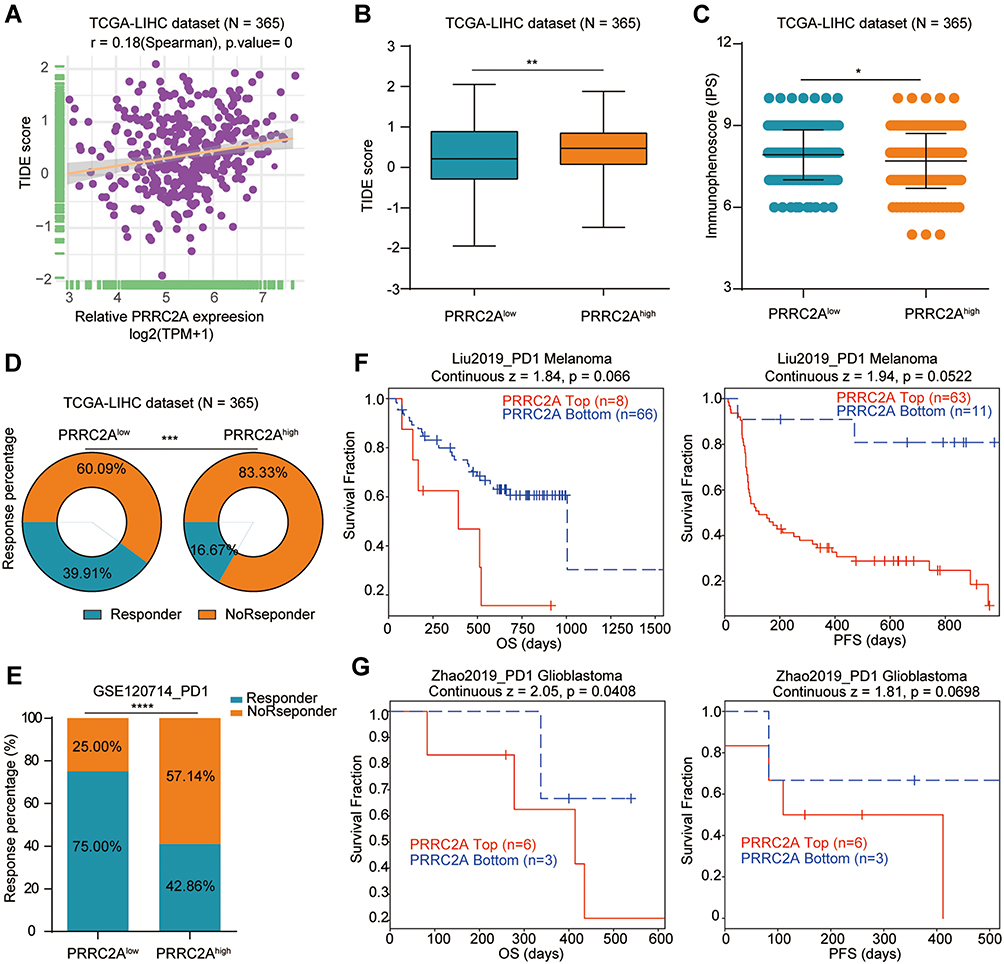 |
Figure 7 PRRC2A was associated with immunotherapy. (A) The associations between PRRC2A expression and TIDE score. (B) High PRRC2A was positively correlated with high TIDE score. (C) High PRRC2A was negatively associated with low immunophenoscore. (D) Patients with low PRRC2A expression showed higher response potential than those with high PRRC2A expression. (E) Mice with low PRRC2A expression showed higher response potential than those with high PRRC2A expression for anti-PD-1 therapy. (F) The Kaplan–Meier curves about the correlation between PRRC2A expression and OS/PFS in melanoma patients with anti-PD-1 therapy. (G) The Kaplan–Meier curves about the correlation between PRRC2A expression and OS/PFS in glioblastoma patients with anti-PD-1 therapy. *P < 0.05, **P < 0.01, ***P < 0.001, ****P < 0.0001. |
Discussion
HCC has complex pathogenesis, insidious onset, quick progression and early metastasis, coupled with a high mortality rate, which is a tremendous challenge to overcome.23 Thus, finding effective biomarkers for early diagnosis and improving the curative effect of treatments are highly regarded as the key to prevent HCC. PRRC2A has been reported to be a lurking pivotal gene in HCC progression.24 However, despite these observations, detailed expression and clinical significance of PRRC2A in HCC have not been researched yet. To our knowledge, this study is the first time to shed a light on the role of PRRC2A in HCC. Of note, the expression level of PRRC2A in HCC was upregulated across TCGA and was validated via GEO, Oncomine, HCCDB at mRNA level, and CPTAC, TMA cohort at the protein level. Besides, the underlying mechanism of high PRRC2A expression level might be the amplification in gene copy number and its promoter hypomethylation. High PRRC2A expression was remarkably associated with advanced TNM stage, poor differentiation grade, high AFP level, and poor clinical outcomes. More importantly, the univariate and multivariate Cox regression analyses revealed that high PRRC2A could be an independent biomarker for OS and DFS in HCC. Additionally, the ROC curve analysis showed that PRRC2A expression could clearly distinguish between normal and cancerous tissues with high sensitivity and specificity. These outcomes suggest that PRRC2A could be a potential biomarker in diagnosis and prognosis of HCC patients.
Furthermore, bioinformatics analysis was carried out to uncover the crucial enriched pathways that PRRC2A involved in HCC progression. The results showed that PRRC2A mainly participated in several well-known oncogenic pathways such as cell proliferation-related pathways and TGF-β signaling pathway, which have been elaborated in multiple types of cancers, HCC included.25–28 Furthermore, positive correlations were obtained between the mRNA expression of vital genes involved in cell proliferation (CCNA2, CCNB1, CCNE1, CDK2, and CDK4, MKi67, etc.) and PRRC2A. Besides, knockdown of PRRC2A could significantly inhibit the proliferation, migratory and invasive capabilities of HCC cells in vitro experiments. Collectively, these results demonstrated that PRRC2A might play an important role in promoting HCC development.
In the past decades, the molecular-targeted therapy have achieved great improvement due to the advances in high throughout sequencing of HCC.29 Meanwhile, increasing novel effective molecule-based targeted drugs, such as multikinase inhibitors have been approved as the first-line drug for HCC due to their efficacy in providing a survival benefit, but unfortunately, only a few are suitable and it is easy to generate drug resistance during treatment.30,31 Previous studies have established that the tumor immune microenvironment (TME) has a vital role in the occurrence, progression, and metastasis of cancers and the effect of immunotherapy on patients, including HCC.32–36 Moreover, cancer immunotherapy has shown potent efficacy in treating multiple late-stage neoplasm tumors,37,38 for instance, the anti-PD1/PD-L1 treatments (immune checkpoint inhibitors) have displayed promising therapeutic benefits for patients with advanced melanoma and non-small cell lung cancer, etc.39,40 However, to our disappointment, most patients might be still likely to progress eventually even with these treatment strategies.
Recently, the combinations of various therapeutics, like molecular targeted therapy and immunotherapy, have achieved much more pleasing clinical outcomes in HCC, which could overcome disadvantages of poor efficacy of single targeted drugs or immune checkpoint inhibitors.41 Nevertheless, studies have shown that a typical phenomenon of HCC microenvironment is the gradual dysfunction of various immune cells, including CD8 T cells and NK cells, or restricting their entry into tumors.42–44 Therefore, satisfying results were usually not obtained due to the primary immunosuppressive role of TME in HCC, which contained anti-tumor immunity and aggravated tumor development.45 Hence, great attention should be given to finding new and effective factors that participate in the modulation of immune cells in TME in order to improve the efficacy of immunotherapy. In this study, we have determined the oncogenic role of PRRC2A in HCC and could be a potential target for HCC treatment. Furthermore, ESTIMATE analysis revealed that high PRRC2A expression was inversely associated with immune scores. Besides, because the regulation of immunosuppressive or immunoactive effect of TME is executed by multiple cells having immunomodulatory activities,46 including infiltration of effector immune cells (CD8 T cells, CTLs, NK cells, etc.), proportion of immunosuppressive cells (regulatory T cells, type 2 T helper cells and MDSC, etc.) and factors (TGFB1, IDO1, CSF1, etc.), we next conducted ssGSEA analysis and found a significant negative correlation of PRRC2A with many anti-cancer immune cell infiltration degrees in HCC, including CD8 T cells, which could kill tumor cells through releasing perforin granules and granzymes A. Meanwhile, several documents have identified the protective role of CD8 T cells for HCC patients. For example, Liu et al reported that CD8 T cells could be recruitment through driving M1 polarisation of Kupffer cells by miR-206 and then suppressed HCC progression.47 Consistent with these results, we also found the protective function of CD8 T cells in TCGA-LIHC cohort by survival analysis and HCC patients with high PRRC2A expression had a much worse prognosis in the group with lower infiltration level of these immune cells. These results suggested that PRRC2A participated in the construction of HCC immunosuppressive microenvironment and prevented the entry of CD8 T cells into HCC, indicating that targeting PRRC2A therapy might be a promising therapeutic for HCC patients.
Moreover, another typical cause is that malignant cells express PD-L1 and other ligands matched to the PD-1 and T cells’ corresponding proteins, thereby losing the capacity to secrete cytokines but express manifold inhibitory receptors. This induces uncontrollable infection or tumor development and directly causes T cells exhaustion.48–50 A positive correlation between PRRC2A expression and diversified markers of T cell exhaustion, including PD-1, PD-L1, TIGIT, HAVCR2, and TGFBR1, was identified. These results indicate that PRRC2A has a close link with the formation of immunosuppressive TME in HCC. Additionally, TIDE and IPS results showed that patients with high PRRC2A had higher TIDE scores but lower IPS scores, suggesting a rapid generation of tolerance to immunotherapy. Furthermore, high PRRC2A expression was more insensitive to anti-PD1 therapy and more likely to induce poorer prognosis. All signs furnish robust evidence that PRRC2A may play a pivotal role in immunosuppression in HCC development and could be a potentially novel therapeutic target to enhance the curative effect of immunotherapy against HCC.
Conclusion
To summarize, PRRC2A might serve as an oncogene in HCC progression by regulating cell proliferation-related pathways, suppressing immune cell infiltration, and enhancing T cells exhaustion. This study explored the predictive value and biological roles of PRRC2A in HCC progression, and results suggested that it might be a significant biomarker for HCC patients, shedding new light on HCC immunotherapy.
Data Sharing Statement
The datasets presented in this study can be found in online repositories, and original contributions in the study are included in the article/supplementary material, further inquiries can be directed to the corresponding author/s.
Acknowledgments
The authors are truly grateful to the public databases for the data sharing policy.
Author Contributions
All authors made substantial contributions to data analysis, interpretation of the study and the article drafting and revisal, have agreed to submit to the journal, gave final approval of the version to be published, and agree to be accountable for all aspects of the work.
Funding
This study was supported by National Natural Science Foundation of China (82070643, and U1904164), the China Postdoctoral Science Foundation (2020T130609 and 2020T130109ZX), and Key Scientific Research Projects of Higher Education Institutions in Henan Province (20A320056).
Disclosure
The authors have declared that no competing interest exists.
References
1. Shetty S, Sharma N, Ghosh K. Epidemiology of hepatocellular carcinoma (HCC) in hemophilia. Crit Rev Oncol Hematol. 2016;99:129–133. doi:10.1016/j.critrevonc.2015.12.009
2. Sung H, Ferlay J, Siegel RL. Global cancer statistics 2020: GLOBOCAN estimates of incidence and mortality worldwide for 36 cancers in 185 countries. CA Cancer J Clin. 2021;71(3):209–249. doi:10.3322/caac.21660
3. Xie QL, Liu Y, Zhu Y. Chromosome region maintenance 1 expression and its association with clinical pathological features in primary carcinoma of the liver. Exp Ther Med. 2016;12:59–68. doi:10.3892/etm.2016.3283
4. Banerji J, Sands J, Strominger JL, Spies T. A gene pair from the human major histocompatibility complex encodes large proline-rich proteins with multiple repeated motifs and a single ubiquitin-like domain. Proc Natl Acad Sci U S A. 1990;87:2374–2378. doi:10.1073/pnas.87.6.2374
5. Singal DP, Li J, Zhu Y. Genetic basis for rheumatoid arthritis. Arch Immunol Ther Exp. 1999;47:307.
6. Pan Q, Ning Y, Chen LZ, et al. Association of MHC class-III gene polymorphisms with ER-positive breast cancer in Chinese Han population. Genet Mol Res. 2012;11:4299–4306. doi:10.4238/2012.September.17.1
7. Walsh KM, Gorlov IP, Hansen HM, et al. Fine-mapping of the 5p15.33, 6p22.1-p21.31, and 15q25.1 regions identifies functional and histology-specific lung cancer susceptibility loci in African-Americans. Cancer Epidemiol Biomarkers Prev. 2013;22:251–260. doi:10.1158/1055-9965.epi-12-1007-t
8. Nieters A, Conde L, Slager SL, et al. PRRC2A and BCL2L11 gene variants influence risk of non-Hodgkin lymphoma: results from the InterLymph consortium. Blood. 2012;120:4645–4648. doi:10.1182/blood-2012-05-427989
9. Cerami E, Gao J, Dogrusoz U, et al. The cBio cancer genomics portal: an open platform for exploring multidimensional cancer genomics data. Cancer Discov. 2012;2:401–404. doi:10.1158/2159-8290.cd-12-0095
10. Li T, Fu J, Zeng Z, et al. TIMER2.0 for analysis of tumor-infiltrating immune cells. Nucleic Acids Res. 2020;48:W509–w514. doi:10.1093/nar/gkaa407
11. Cui X, Liu X, Han Q, et al. DPEP1 is a direct target of miR-193a-5p and promotes hepatoblastoma progression by PI3K/Akt/mTOR pathway. Cell Death Dis. 2019;10:701. doi:10.1038/s41419-019-1943-0
12. Tang Z, Kang B, Li C, Chen T, Zhang Z. GEPIA2: an enhanced web server for large-scale expression profiling and interactive analysis. Nucleic Acids Res. 2019;47:W556–w560. doi:10.1093/nar/gkz430
13. Chen F, Chandrashekar DS, Varambally S, Creighton CJ. Pan-cancer molecular subtypes revealed by mass-spectrometry-based proteomic characterization of more than 500 human cancers. Nat Commun. 2019;10:5679. doi:10.1038/s41467-019-13528-0
14. Rhodes DR, Kalyana-Sundaram S, Mahavisno V, et al. Oncomine 3.0: genes, pathways, and networks in a collection of 18,000 cancer gene expression profiles. Neoplasia. 2007;9:166–180. doi:10.1593/neo.07112
15. Lian Q, Wang S, Zhang G, et al. HCCDB: a database of hepatocellular carcinoma expression atlas. Genomics Proteomics Bioinformatics. 2018;16:269–275. doi:10.1016/j.gpb.2018.07.003
16. Gao J, Aksoy BA, Dogrusoz U, et al. Integrative analysis of complex cancer genomics and clinical profiles using the cBioPortal. Sci Signal. 2013;6:pl1. doi:10.1126/scisignal.2004088
17. Chandrashekar DS, Bashel B, Balasubramanya SAH, et al. UALCAN: a portal for facilitating tumor subgroup gene expression and survival analyses. Neoplasia. 2017;19:649–658. doi:10.1016/j.neo.2017.05.002
18. Simon N, Friedman J, Hastie T, Tibshirani R. Regularization paths for cox’s proportional hazards model via coordinate descent. J Stat Softw. 2011;39:1–13. doi:10.18637/jss.v039.i05
19. Yu G, Wang LG, Han Y, He QY. clusterProfiler: an R package for comparing biological themes among gene clusters. Omics. 2012;16:284–287. doi:10.1089/omi.2011.0118
20. Hänzelmann S, Castelo R, Guinney J. GSVA: gene set variation analysis for microarray and RNA-seq data. BMC Bioinform. 2013;14:7. doi:10.1186/1471-2105-14-7
21. Yoshihara K, Shahmoradgoli M, Martínez E, et al. Inferring tumour purity and stromal and immune cell admixture from expression data. Nat Commun. 2013;4:2612. doi:10.1038/ncomms3612
22. Jiang P, Gu S, Pan D, et al. Signatures of T cell dysfunction and exclusion predict cancer immunotherapy response. Nat Med. 2018;24:1550–1558. doi:10.1038/s41591-018-0136-1
23. Fransvea E, Paradiso A, Antonaci S, Giannelli G. HCC heterogeneity: molecular pathogenesis and clinical implications. Cell Oncol. 2009;31:227–233. doi:10.3233/clo-2009-0473
24. Xiong DD, Feng ZB, Lai ZF, et al. High throughput circRNA sequencing analysis reveals novel insights into the mechanism of nitidine chloride against hepatocellular carcinoma. Cell Death Dis. 2019;10:658. doi:10.1038/s41419-019-1890-9
25. Kar S. Unraveling cell-cycle dynamics in cancer. Cell Syst. 2016;2:8–10. doi:10.1016/j.cels.2016.01.007
26. Colak S, Ten Dijke P. Targeting TGF-β signaling in cancer. Trends Cancer. 2017;3:56–71. doi:10.1016/j.trecan.2016.11.008
27. Yang T, Huang T, Zhang D, et al. TGF-β receptor inhibitor LY2109761 enhances the radiosensitivity of gastric cancer by inactivating the TGF-β/SMAD4 signaling pathway. Aging. 2019;11:8892–8910. doi:10.18632/aging.102329
28. Chen J, Gingold JA, Su X. Immunomodulatory TGF-β signaling in hepatocellular carcinoma. Trends Mol Med. 2019;25:1010–1023. doi:10.1016/j.molmed.2019.06.007
29. Dhanasekaran R, Nault JC, Roberts LR, Zucman-Rossi J. Genomic medicine and implications for hepatocellular carcinoma prevention and therapy. Gastroenterology. 2019;156:492–509. doi:10.1053/j.gastro.2018.11.001
30. Llovet JM, Montal R, Sia D, Finn RS. Molecular therapies and precision medicine for hepatocellular carcinoma. Nat Rev Clin Oncol. 2018;15:599–616. doi:10.1038/s41571-018-0073-4
31. Forner A, Reig M, Bruix J. Hepatocellular carcinoma. Lancet. 2018;391:1301–1314. doi:10.1016/s0140-6736(18)30010-2
32. Hinshaw DC, Shevde LA. The tumor microenvironment innately modulates cancer progression. Cancer Res. 2019;79:4557–4566. doi:10.1158/0008-5472.can-18-3962
33. Soysal SD, Tzankov A, Muenst SE. Role of the tumor microenvironment in breast cancer. Pathobiology. 2015;82:142–152. doi:10.1159/000430499
34. Tahmasebi Birgani M, Carloni V. Tumor microenvironment, a paradigm in hepatocellular carcinoma progression and therapy. Int J Mol Sci. 2017;18:405. doi:10.3390/ijms18020405
35. Casey SC, Amedei A, Aquilano K, et al. Cancer prevention and therapy through the modulation of the tumor microenvironment. Semin Cancer Biol. 2015;35(Suppl):S199–s223. doi:10.1016/j.semcancer.2015.02.007
36. Belli C, Trapani D, Viale G, et al. Targeting the microenvironment in solid tumors. Cancer Treat Rev. 2018;65:22–32. doi:10.1016/j.ctrv.2018.02.004
37. Lei X, Lei Y, Li JK, et al. Immune cells within the tumor microenvironment: biological functions and roles in cancer immunotherapy. Cancer Lett. 2020;470:126–133. doi:10.1016/j.canlet.2019.11.009
38. Yang Y. Cancer immunotherapy: harnessing the immune system to battle cancer. J Clin Invest. 2015;125:3335–3337. doi:10.1172/jci83871
39. Cooper ZA, Juneja VR, Sage PT, et al. Response to BRAF inhibition in melanoma is enhanced when combined with immune checkpoint blockade. Cancer Immunol Res. 2014;2:643–654. doi:10.1158/2326-6066.cir-13-0215
40. Nadal E, Massuti B, Dómine M, et al. Immunotherapy with checkpoint inhibitors in non-small cell lung cancer: insights from long-term survivors. Cancer Immunol Immunother. 2019;68:341–352. doi:10.1007/s00262-019-02310-2
41. Finn RS, Ikeda M, Zhu AX, et al. Phase Ib study of lenvatinib plus pembrolizumab in patients with unresectable hepatocellular carcinoma. J Clin Oncol. 2020;38:2960–2970. doi:10.1200/jco.20.00808
42. Zhang Q, He Y, Luo N, et al. Landscape and dynamics of single immune cells in hepatocellular carcinoma. Cell. 2019;179(4):e820. doi:10.1016/j.cell.2019.10.003
43. Wheeler DA, Roberts LR; Cancer Genome Atlas Research Network. Comprehensive and integrative genomic characterization of hepatocellular carcinoma. Cell. 2017;169(7):1327. doi:10.1016/j.cell.2017.05.046
44. Maimela NR, Liu S, Zhang Y. Fates of CD8+ T cells in tumor microenvironment. Comput Struct Biotechnol J. 2019;17:1–13. doi:10.1016/j.csbj.2018.11.004
45. Buoncervello M, Gabriele L, Toschi E. The Janus face of tumor microenvironment targeted by immunotherapy. Int J Mol Sci. 2019;20:4320. doi:10.3390/ijms20174320
46. Oliver AJ, Lau PKH, Unsworth AS, et al. Tissue-dependent tumor microenvironments and their impact on immunotherapy responses. Front Immunol. 2018;9:70. doi:10.3389/fimmu.2018.00070
47. Liu N, Wang X, Steer CJ, Song G. MicroRNA-206 promotes the recruitment of CD8+ T cells by driving M1 polarisation of Kupffer cells. Gut. 2021:
48. Blank CU, Haining WN, Held W, Hogan PG, Zehn D. Defining ‘T cell exhaustion’. Nat Rev Immunol. 2019;19:1–10. doi:10.1038/s41577-019-0221-9
49. Sekine T, Perez-Potti A, Nguyen S, Gorin JB, Buggert M. TOX is expressed by exhausted and polyfunctional human effector memory CD8 + T cells. Sci Immunol. 2020;5:eaba7918. doi:10.1126/sciimmunol.aba7918
50. Hudson WH, Gensheimer J, Hashimoto M, et al. Proliferating transitory T cells with an effector-like transcriptional signature emerge from PD-1+ stem-like CD8+ T cells during chronic infection - ScienceDirect. Immunity. 2019;51(6):1043–1058.e4. doi:10.1016/j.immuni.2019.11.002
 © 2021 The Author(s). This work is published and licensed by Dove Medical Press Limited. The full terms of this license are available at https://www.dovepress.com/terms.php and incorporate the Creative Commons Attribution - Non Commercial (unported, v3.0) License.
By accessing the work you hereby accept the Terms. Non-commercial uses of the work are permitted without any further permission from Dove Medical Press Limited, provided the work is properly attributed. For permission for commercial use of this work, please see paragraphs 4.2 and 5 of our Terms.
© 2021 The Author(s). This work is published and licensed by Dove Medical Press Limited. The full terms of this license are available at https://www.dovepress.com/terms.php and incorporate the Creative Commons Attribution - Non Commercial (unported, v3.0) License.
By accessing the work you hereby accept the Terms. Non-commercial uses of the work are permitted without any further permission from Dove Medical Press Limited, provided the work is properly attributed. For permission for commercial use of this work, please see paragraphs 4.2 and 5 of our Terms.