")
Back to Journals » International Journal of General Medicine » Volume 15
Protein Phosphatase 1 Regulatory Subunit 3: A Prognostic Biomarker in Stomach Adenocarcinoma
Authors Zhu YZ, Liao XW , Yin W, Wei HM
Received 17 November 2021
Accepted for publication 20 January 2022
Published 4 February 2022 Volume 2022:15 Pages 1131—1146
DOI https://doi.org/10.2147/IJGM.S345978
Checked for plagiarism Yes
Review by Single anonymous peer review
Peer reviewer comments 2
Editor who approved publication: Dr Scott Fraser
Ya-Zhen Zhu,1 Xi-Wen Liao,2 Wu Yin,1 Hai-Ming Wei1
1Department of Pathology, The People’s Hospital of Guangxi Zhuang Autonomous Region, Nanning, 530021, People’s Republic of China; 2Department of Hepatobiliary Surgery, The First Affiliated Hospital of Guangxi Medical University, Nanning, 530021, People’s Republic of China
Correspondence: Hai-Ming Wei
Department of Pathology, The People’s Hospital of Guangxi Zhuang Autonomous Region, Nanning, Guangxi Zhuang Autonomous Region, 530021, People’s Republic of China
, Email [email protected]
Purpose: This study aimed to determine the potential application of the protein phosphatase 1 regulatory subunit 3 (PPP1R3B) gene as a prognostic marker in stomach adenocarcinoma (STAD), as well as its potential mediating biological processes and pathways.
Materials and Methods: Differential expression analyses were performed using the TIMER2.0 and UALCAN databases. Complete RNA-seq data and other relevant clinical and survival data were acquired from The Cancer Genome Atlas (TCGA). Univariate survival analyses, Cox regression modelling, and Kaplan–Meier curves were implemented to investigate the associations between PPP1R3B gene expression and clinical pathologic features. A genome wide gene set enrichment analysis (GSEA) was conducted to define the underlying molecular mechanisms mediating the observed associations between the PPP1R3B gene and STAD development.
Results: We found that PPP1R3B was overexpressed in STAD tissues, and that higher PPP1R3B expression correlated with worse prognoses in patients with STAD. Comprehensive survival analyses suggested that PPP1R3B might be an independent predictive factor for survival time in patients with STAD. The prognostic relationship between PPP1R3B and STAD was also verified using Kaplan–Meier curves. Patients with higher PPP1R3B levels had a shorter clinical survival time on average. Additionally, a GSEA demonstrated that PPP1R3B might be involved in multiple biological processes and pathways.
Conclusion: Our findings demonstrate that the PPP1R3B gene has utility as a potential molecular marker for STAD prognoses.
Keywords: PPP1R3B, mRNA, stomach adenocarcinoma, prognosis, prognostic biomarkers
Introduction
Gastric cancer (GC) ranks fifth in terms of global cancer incidence and third in terms of cancer-associated mortality.1 Globally, more than one million new cases of GC are diagnosed each year, and more than 782,685 people die due to GC each year according to annual Global Cancer Statistics Reports.2 Stomach adenocarcinoma (STAD) is the most common GC subtype. In recent years, a number of interventions, including early diagnostic technologies, improvements in surgical treatment, and advances in radiotherapy, chemotherapy, targeted drugs, immunotherapy, and other comprehensive treatment methods in clinical practice have significantly improved the clinical management of STAD. However, the overall effects of these interventions remain unsatisfactory, as demonstrated by the high five-year mortality rate for advanced STAD (30–50%).3 Postoperative recurrence and metastases are the primary causes of poor prognoses in patients with STAD. Therefore, it is necessary to conduct detailed studies evaluating the pathogenesis of STAD as well as the factors influencing growth, invasion, and metastasis. This research is of great significance in identifying therapeutic targets as well as improving therapeutic effects and prognoses with regard to STAD.
Recent studies have found that almost all tumour cells synthesise and utilise glycogen. Glycogen metabolism is a common metabolic pathway in tumour cells and is an important marker of malignant tumour cell phenotypes.4–8
Protein phosphatase 1 regulatory subunit 3 (PPP1R3B) has been reported to play a role in activating glycogen synthetase (GYS) and in inactivating glycogen phosphorylase in prior studies, thereby resulting in abnormal glycogen metabolism, and PPP1R3B may be associated with tumour cell growth and development. Nevertheless, the potential relationship between the PPP1R3B gene and STAD prognoses remains unclear. Therefore, this investigation was conducted with the aim of exploring the potential prognostic application value and mechanisms of PPP1R3B in STAD.
Materials and Methods
Data Mining
TIMER2.0 (http://timer.cistrome.org/), a comprehensive and user-friendly web resource for analysing tumour-infiltrating immune cells,9–11 was implemented in the current study in order to explore differences in PPP1R3B mRNA expression levels between tumour and adjacent normal tissues in The Cancer Genome Atlas (TCGA) program cohorts. First, the “exploration component” was selected. Second, we entered the Gene_DE module. Finally, we input the PPP1R3B gene into the search box and obtained the expression distribution of PPP1R3B in multiple cancers. UALCAN (http://ualcan.path.uab.edu/index.html), a web server for comprehensive and interactive analyses of cancer data,12 was used to examine PPP1R3B expression across all cancer types in the TCGA cohort.
The complete RNA-seq data and relevant clinical and survival data were obtained from the TCGA database (https://portal.gdc.cancer.gov/). Raw data were normalised using the DESeq package. This study received ethics approval from the ethics review board of our institution.
Comprehensive Survival Analysis of the PPP1R3B Gene
STAD patients were divided into two groups based on the median values of their gene expression profiles. Unpaired t-tests were used to investigate the differential expression of PPP1R3B in STAD patients based on age, sex, tumour stage, cancer status, histologic grade, and Helicobacter pylori (HP) infection status. We obtained PPP1R3B protein immunohistochemical staining in STAD patients from the Human Protein Atlas database (https://www.proteinatlas.org/).
Univariate survival analysis was used to investigate the correlation between clinical pathological parameters and overall clinical survival time (OS). Multivariate Cox survival analysis was also performed to identify prognostic factors by adjusting for OS-associated clinical variables. Additionally, clinical pathological parameters were analysed in subgroup analyses in order to investigate the potential application of PPP1R3B in STAD patients with specific clinical characteristics. We analysed the combined effects of PPP1R3B and several clinical parameters, including histologic grade, radiation therapy, radical resection, targeted molecular therapy, and tumour stage.
We then plotted a survival risk map and conducted a time-dependent receiver operating characteristic (ROC) curve analysis with R statistical software (The R Project for Statistical Computing, Vienna, Austria) using survival receiver operating characteristic curve (ROC) evaluations (https://cran.rproject.org/web/packages/survivalROC/index.html)13 to test the prediction effectiveness of PPP1R3B. Finally, the prognostic relationships between the PPP1R3B gene and multiple clinical parameters in STAD patients were verified using the Kaplan-Meier plotter (KM plotter) (http://kmplot.com/private) database.
Genome-Wide Co-Expression of PPP1R3B
The corrplot software package in R was used for genome-wide co-expression analyses. P values of <0.05, and associated |r| values of >0.2 were deemed statistically significant. Gene Ontology (GO) and Kyoto Encyclopedia of Genes and Genomes (KEGG) pathway analyses were then carried out using the Metascape database (http://metascape.org/)14 to explore the biological and molecular mechanisms and pathways associated with the PPP1R3B gene.
GSEA Analyses
The GSEA (http://www.broadinstitute.org/gsea/index.jsp)15,16 applies the c2 (v6.2) and c5 (v6.2)17 categories in gene set analyses to uncover the potential molecular mechanisms and pathways in patients with different PPP1R3B expression levels. The enrichment results were considered statistically significant based on the following criteria: a normalised enrichment score |(NES)| of >1, a P-value of <0.05, and a false discovery rate (FDR) of <0.25.
Statistical Analyses
Hazard ratio (HR) analyses generating effect estimates with 95% confidence intervals (CI) were performed to describe relative risks between STAD groups with differential expression levels of PPP1R3B. All statistical analyses were performed using Statistical Package for the Social Sciences (SPSS) software (version 23.0; IBM Corp., Armonk, NY, USA) and R statistical software (version 3.5.1). Statistical significance was set at a P-value of <0.05.
Results
Data Mining and Differential Expression Analyses
Differences in PPP1R3B expression between tumour and normal tissues arising from patients with different cancer types were analysed using the TIMER2.0 database. As a result, we observed upregulation in GBM, KIRC, LUAD, PCPG, STAD, and THCA expression, with reduced expression in BLCA, BRCA, CESC, CHOL, COAD, HNSC, KICH, LIHC, PRAD, READ, and UCEC. However, no statistically significant differences were observed between tumour and normal tissues in patients with ESCA, KIRP, LUSC, and PAAD (Figure 1A). These common tumour types are summarised in Supplementary Material 1 (S1). In addition, UALCAN was used to analyse PPP1R3B expression in STAD and adjacent normal tissues (Figure 1B). We found that PPP1R3B expression levels were overexpressed in STAD.
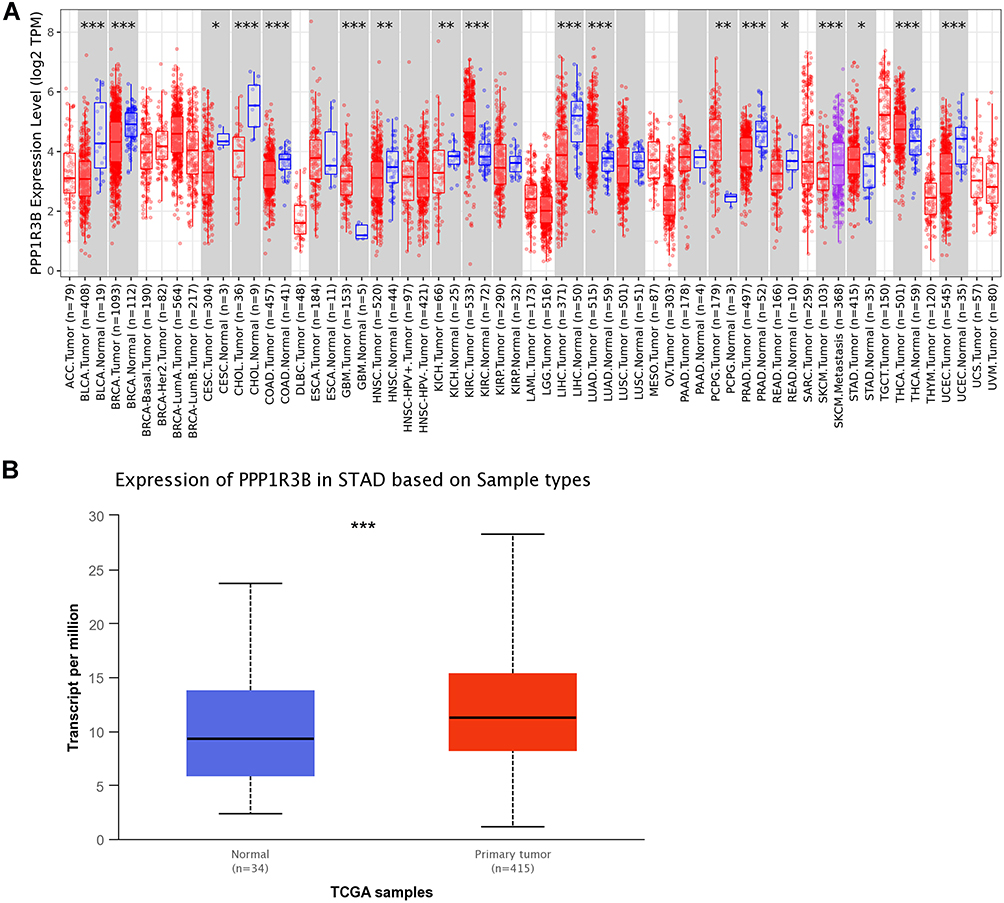 |
Figure 1 PPP1R3B was overexpressed in STAD tissues. Notes: PPP1R3B mRNA expression levels in different cancer samples were explored using the Oncomine (A) and UALCAN databases (B). *P<0.05, **P <0.01, ***P < 0.001. |
Following evaluations of PPP1R3B expression (mRNA) via the Log2 function, 351 cases of STAD and 32 cases providing normal adjacent tissues were included in this experiment for additional analyses. PPP1R3B expression was found to be upregulated in patients with STAD tumours (P<0.001; Figure 2D). However, the expression of PPP1R3B was not statistically significantly associated with the other evaluated clinical variables (Figure 2A-C, E and F). Images of immunohistochemical staining showing PPP1R3B protein expression in STAD are provided in Figure 2G-I.
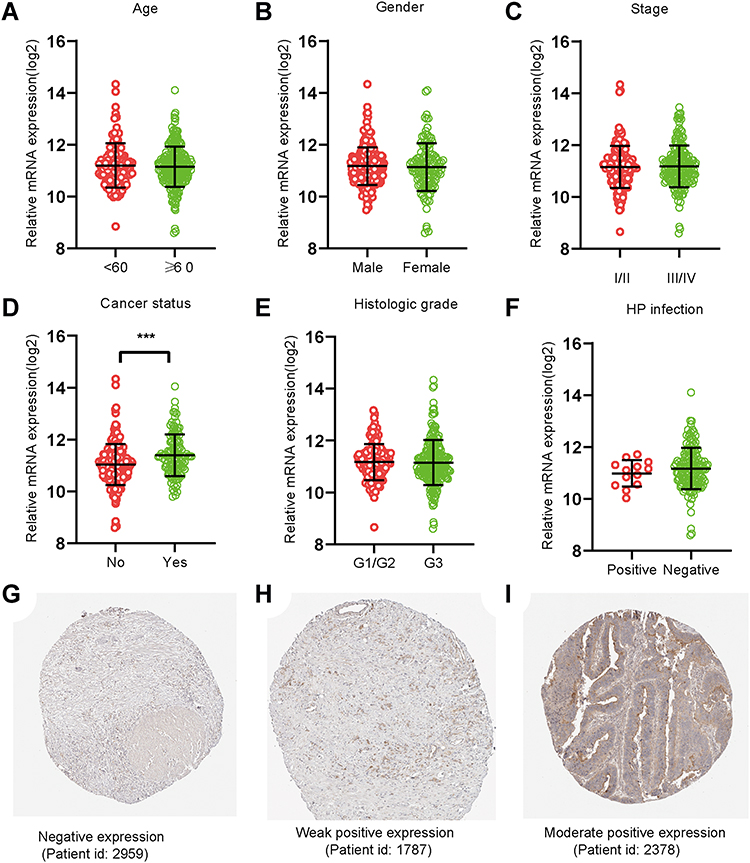 |
Figure 2 PPP1R3B expression in STAD tissues. (A–F) Expression of PPP1R3B in STAD in terms of clinical variables. (G-I) Images of immunohistochemical staining showing PPP1R3B protein expression in STAD from The Human Protein Atlas. ***P < 0.001. |
Survival Analyses
The clinical characteristics of the enrolled patients are outlined in Table 1. Clinicopathologic parameters such as age, TNM tumour stage, cancer status, and information on radiation and targeted therapies were statistically significantly associated with survival time in patients with STAD. After adjusting for these clinical characteristics, multivariate Cox regression demonstrated that the upregulation of the PPP1R3B gene was associated with poor prognoses in the 351 enrolled STAD patients (high PPP1R3B vs low PPP1R3B; 22 months vs 60 months), as well as with a higher mortality rate (Crude P<0.001, Crude HR [95% CI] = 2.012 [1.431–2.828], Table 1, Figure 3B; adjusted P=0.005, adjusted HR [95% CI] = 1.792 [1.193–2.692], Table 2). The results of survival risk mapping of PPP1R3B expression in low-and high-risk groups are shown in Figure 3A. The areas under the curve (AUC) for one-year, two-year, three-year, four-year, and five-year survival were 0.568, 0.620, 0.694, 0.680, and 0.649, Figure 3C, respectively.
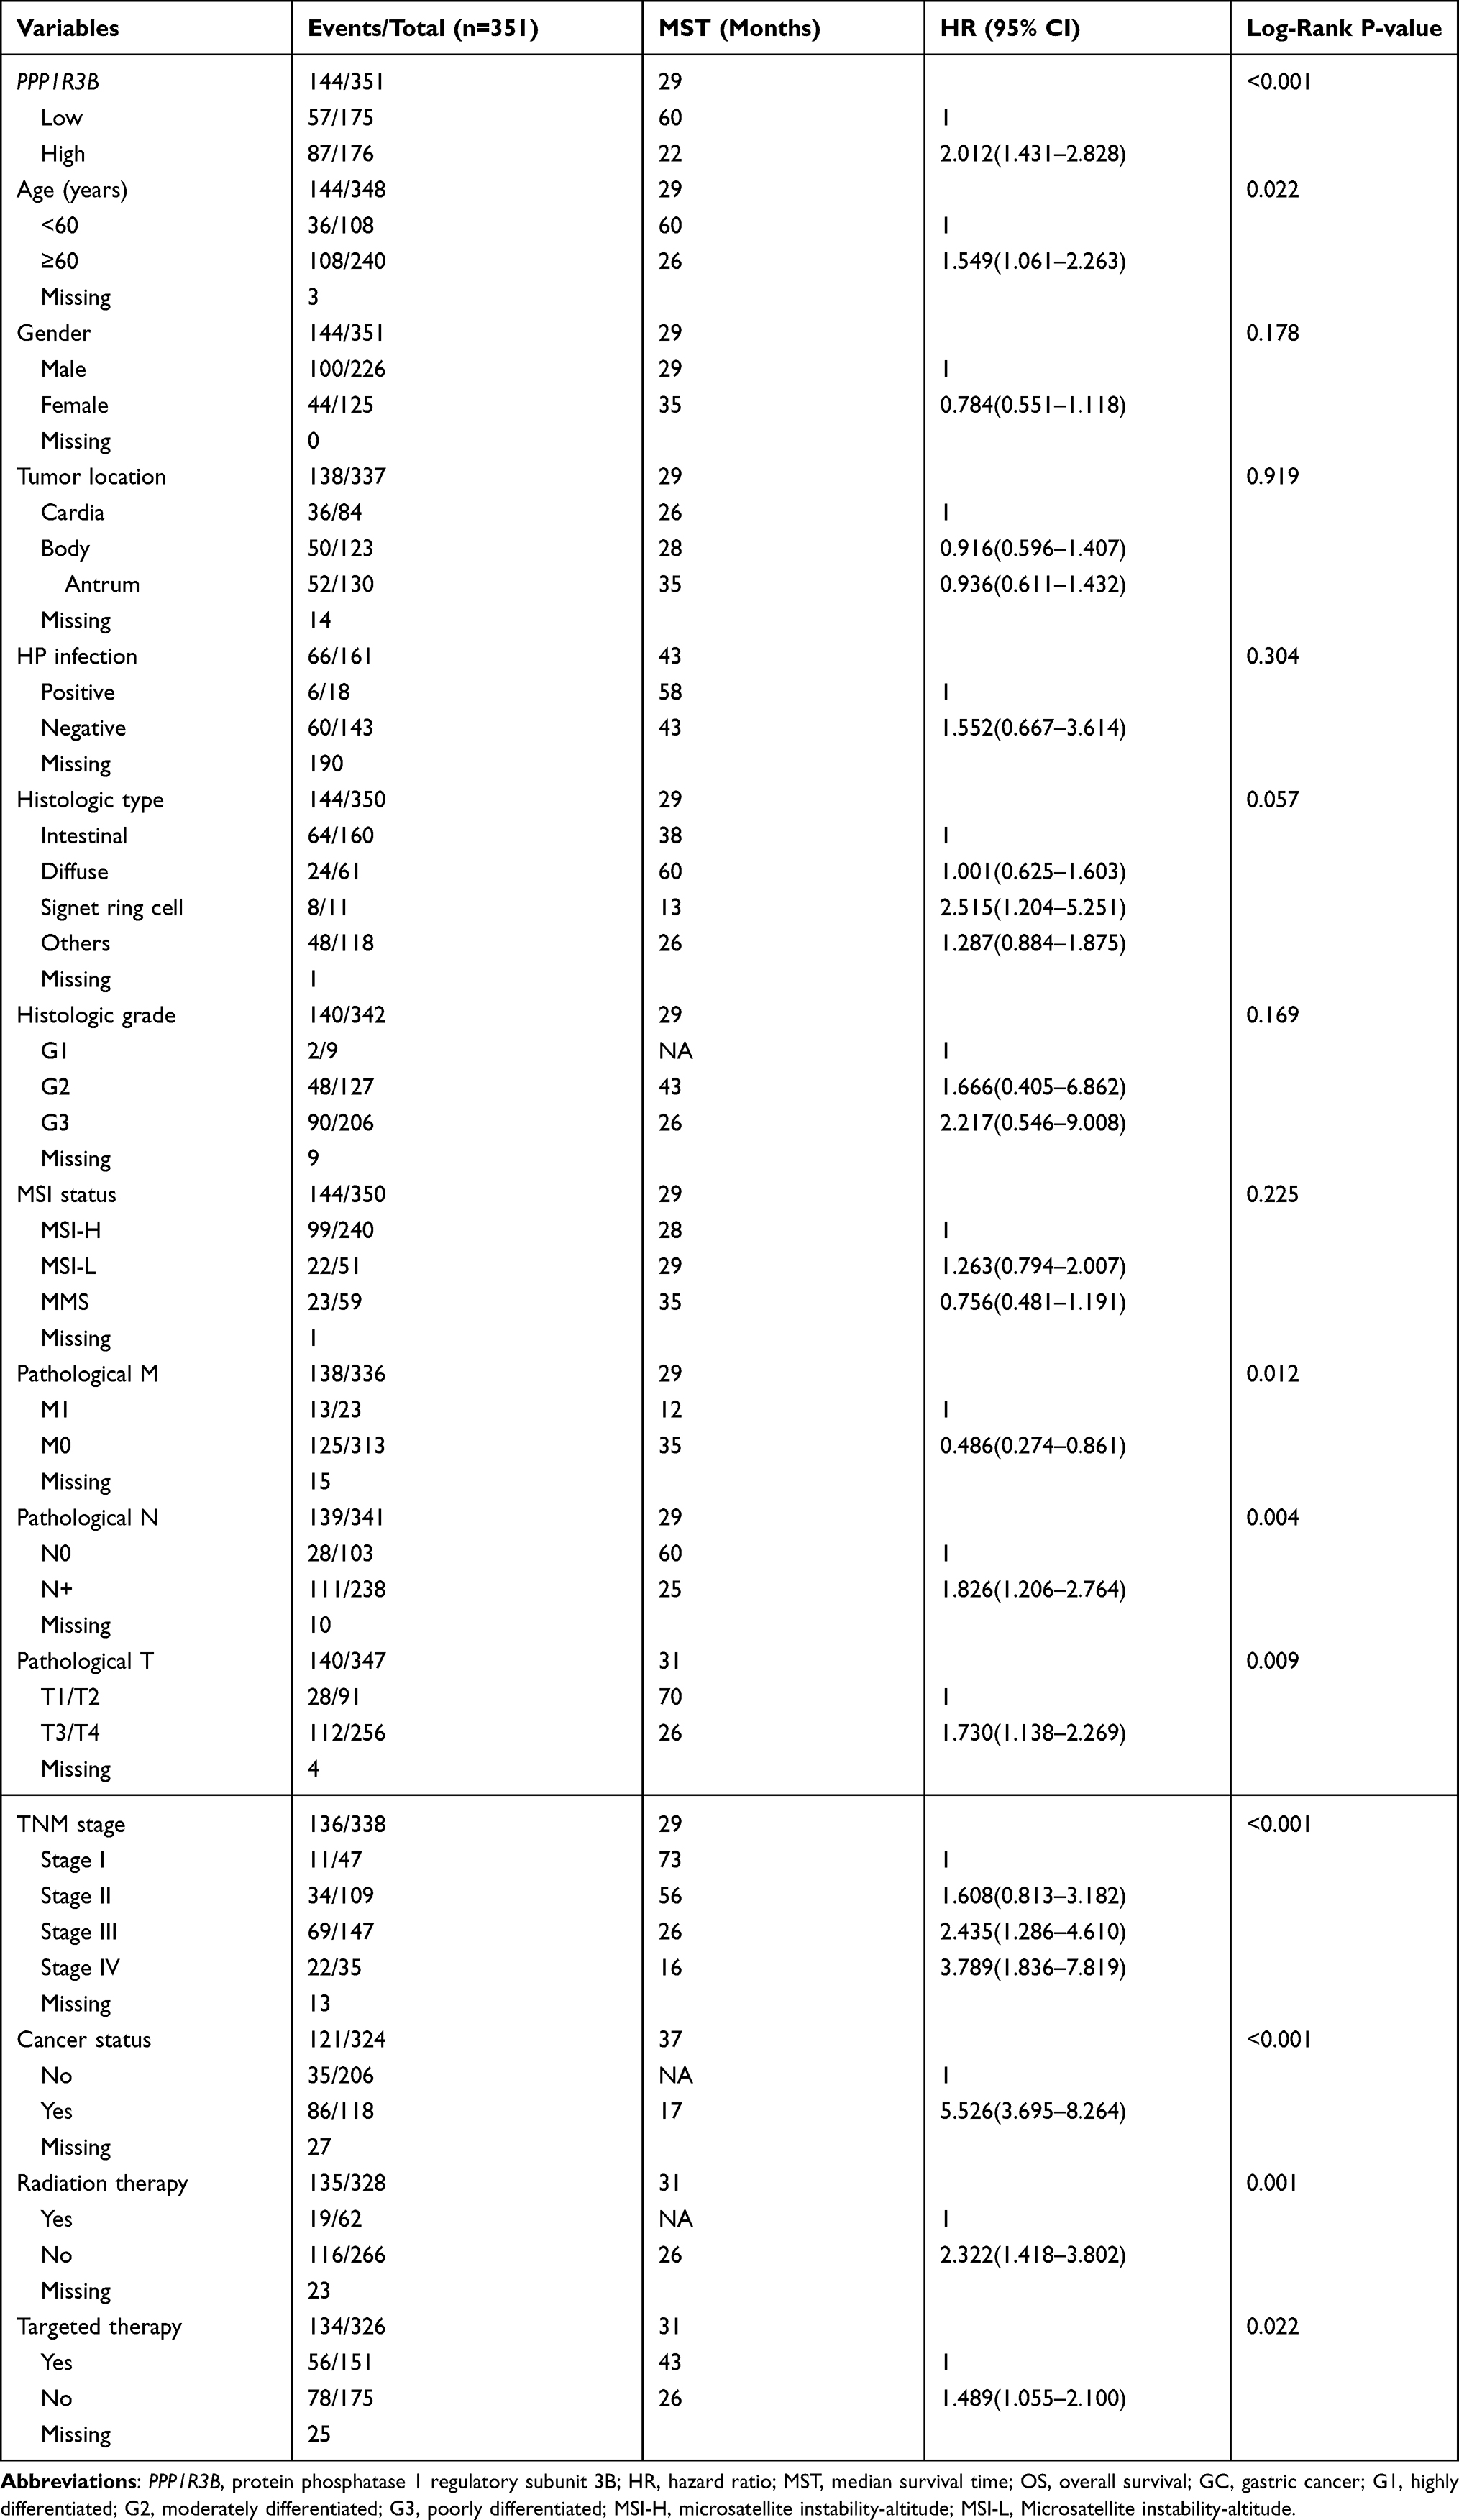 |
Table 1 Correlation Between OS and Clinicopathologic Features of GC Patients |
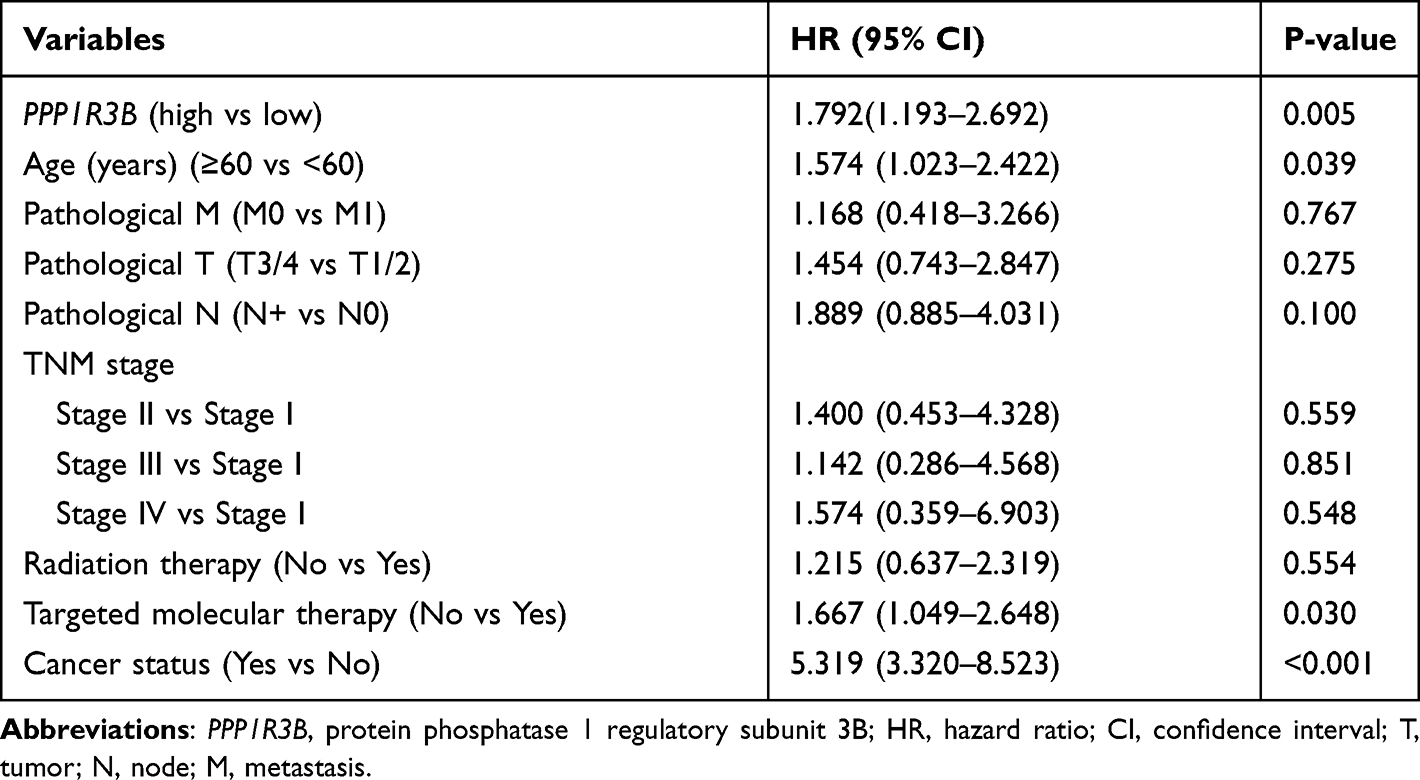 |
Table 2 Multivariate Analyses of the PPP1R3B in the Prediction of Gastric Cancer Overall Survival |
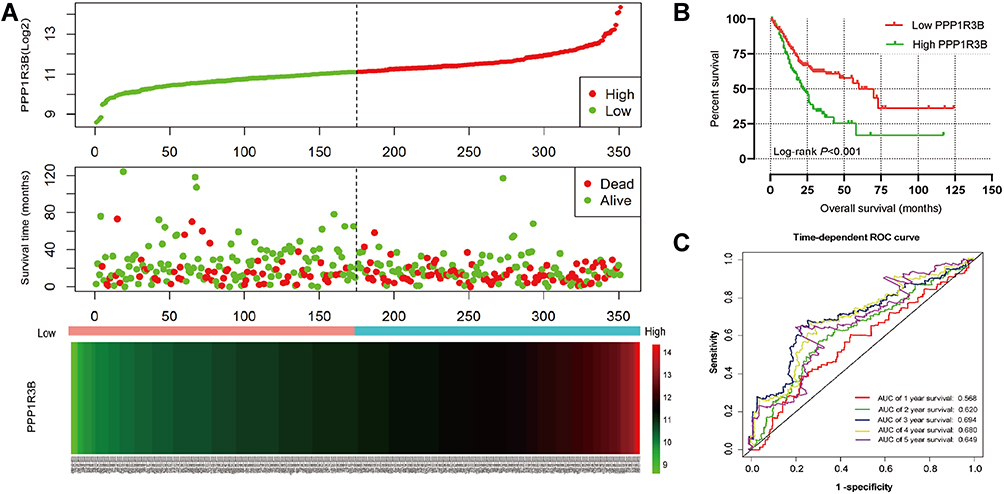 |
Figure 3 Prognostic model of PPP1R3B in patients with STAD. Notes: (A) From up to down are risk score plot, survival status scatter plot, and heat map of the expression of PPP1R3B for low‐and high‐risk groups. (B) Kaplan–Meier survival curves for PPP1R3B gene in STAD of TCGA cohort. (C) Receiver operating characteristic curve for predicting overall survival in STAD patients by the PPP1R3B. |
Additionally, stratified analyses indicated that overexpression of the PPP1R3B gene increased the mortality rate in STAD patients, with the exception of Stage I and cancer-free patients (Table 3). Co-expression analyses also showed that PPP1R3B expression combined with specific clinical variables performed better than any single clinical parameter in terms of predicting STAD survival time (Figure 4A–E and Table 4).
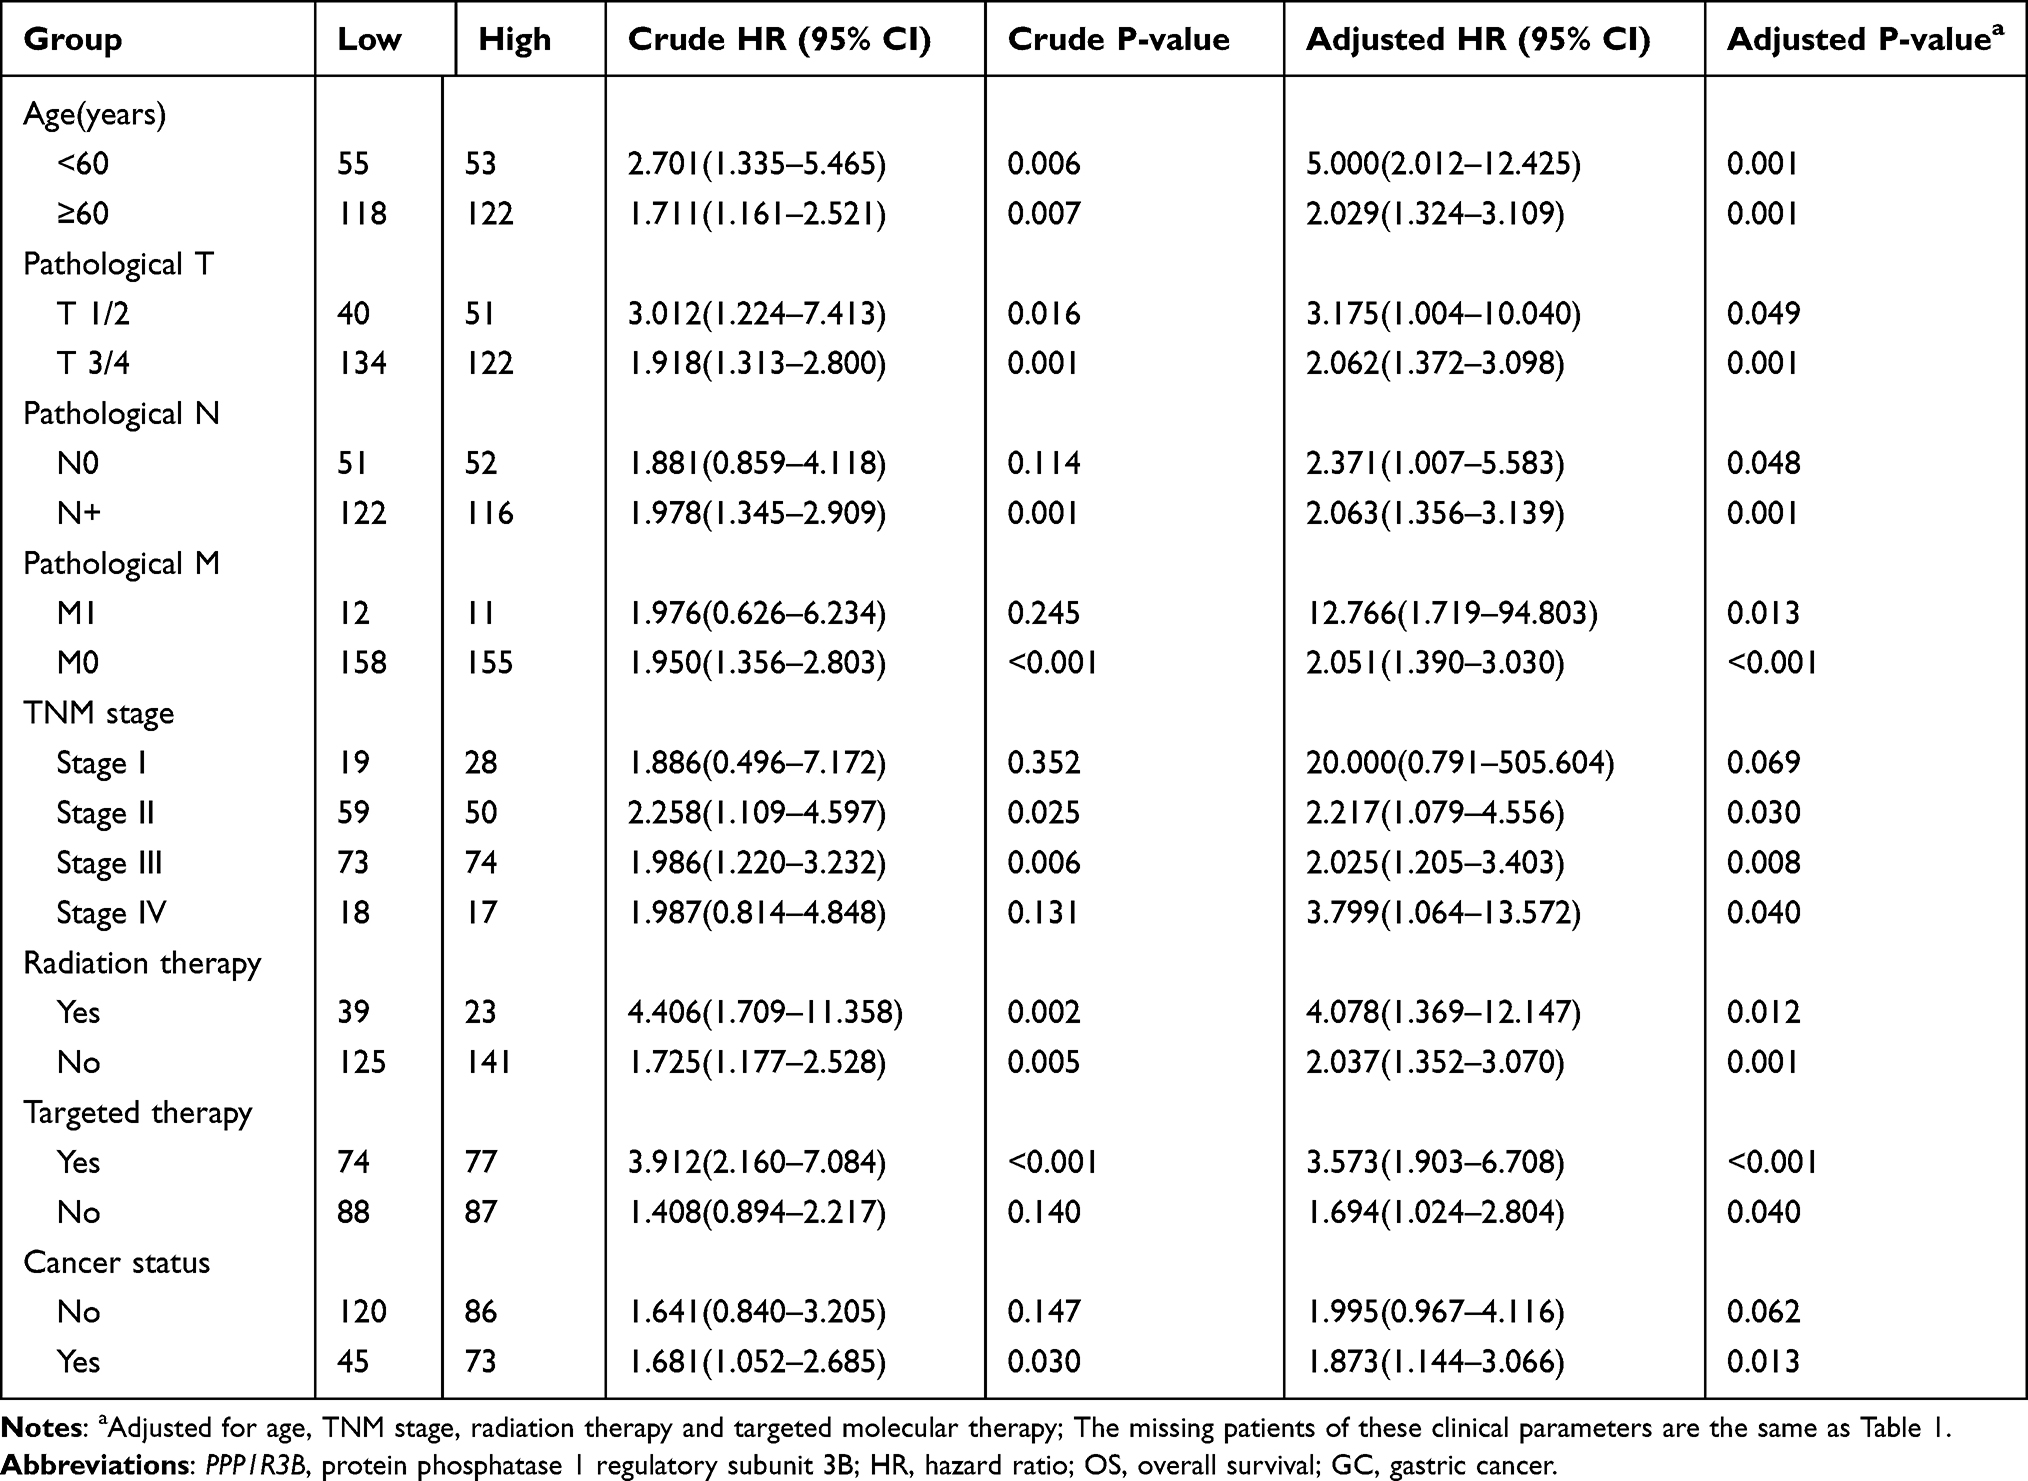 |
Table 3 Stratified Analysis of PPP1R3B Gene and OS in GC Patients |
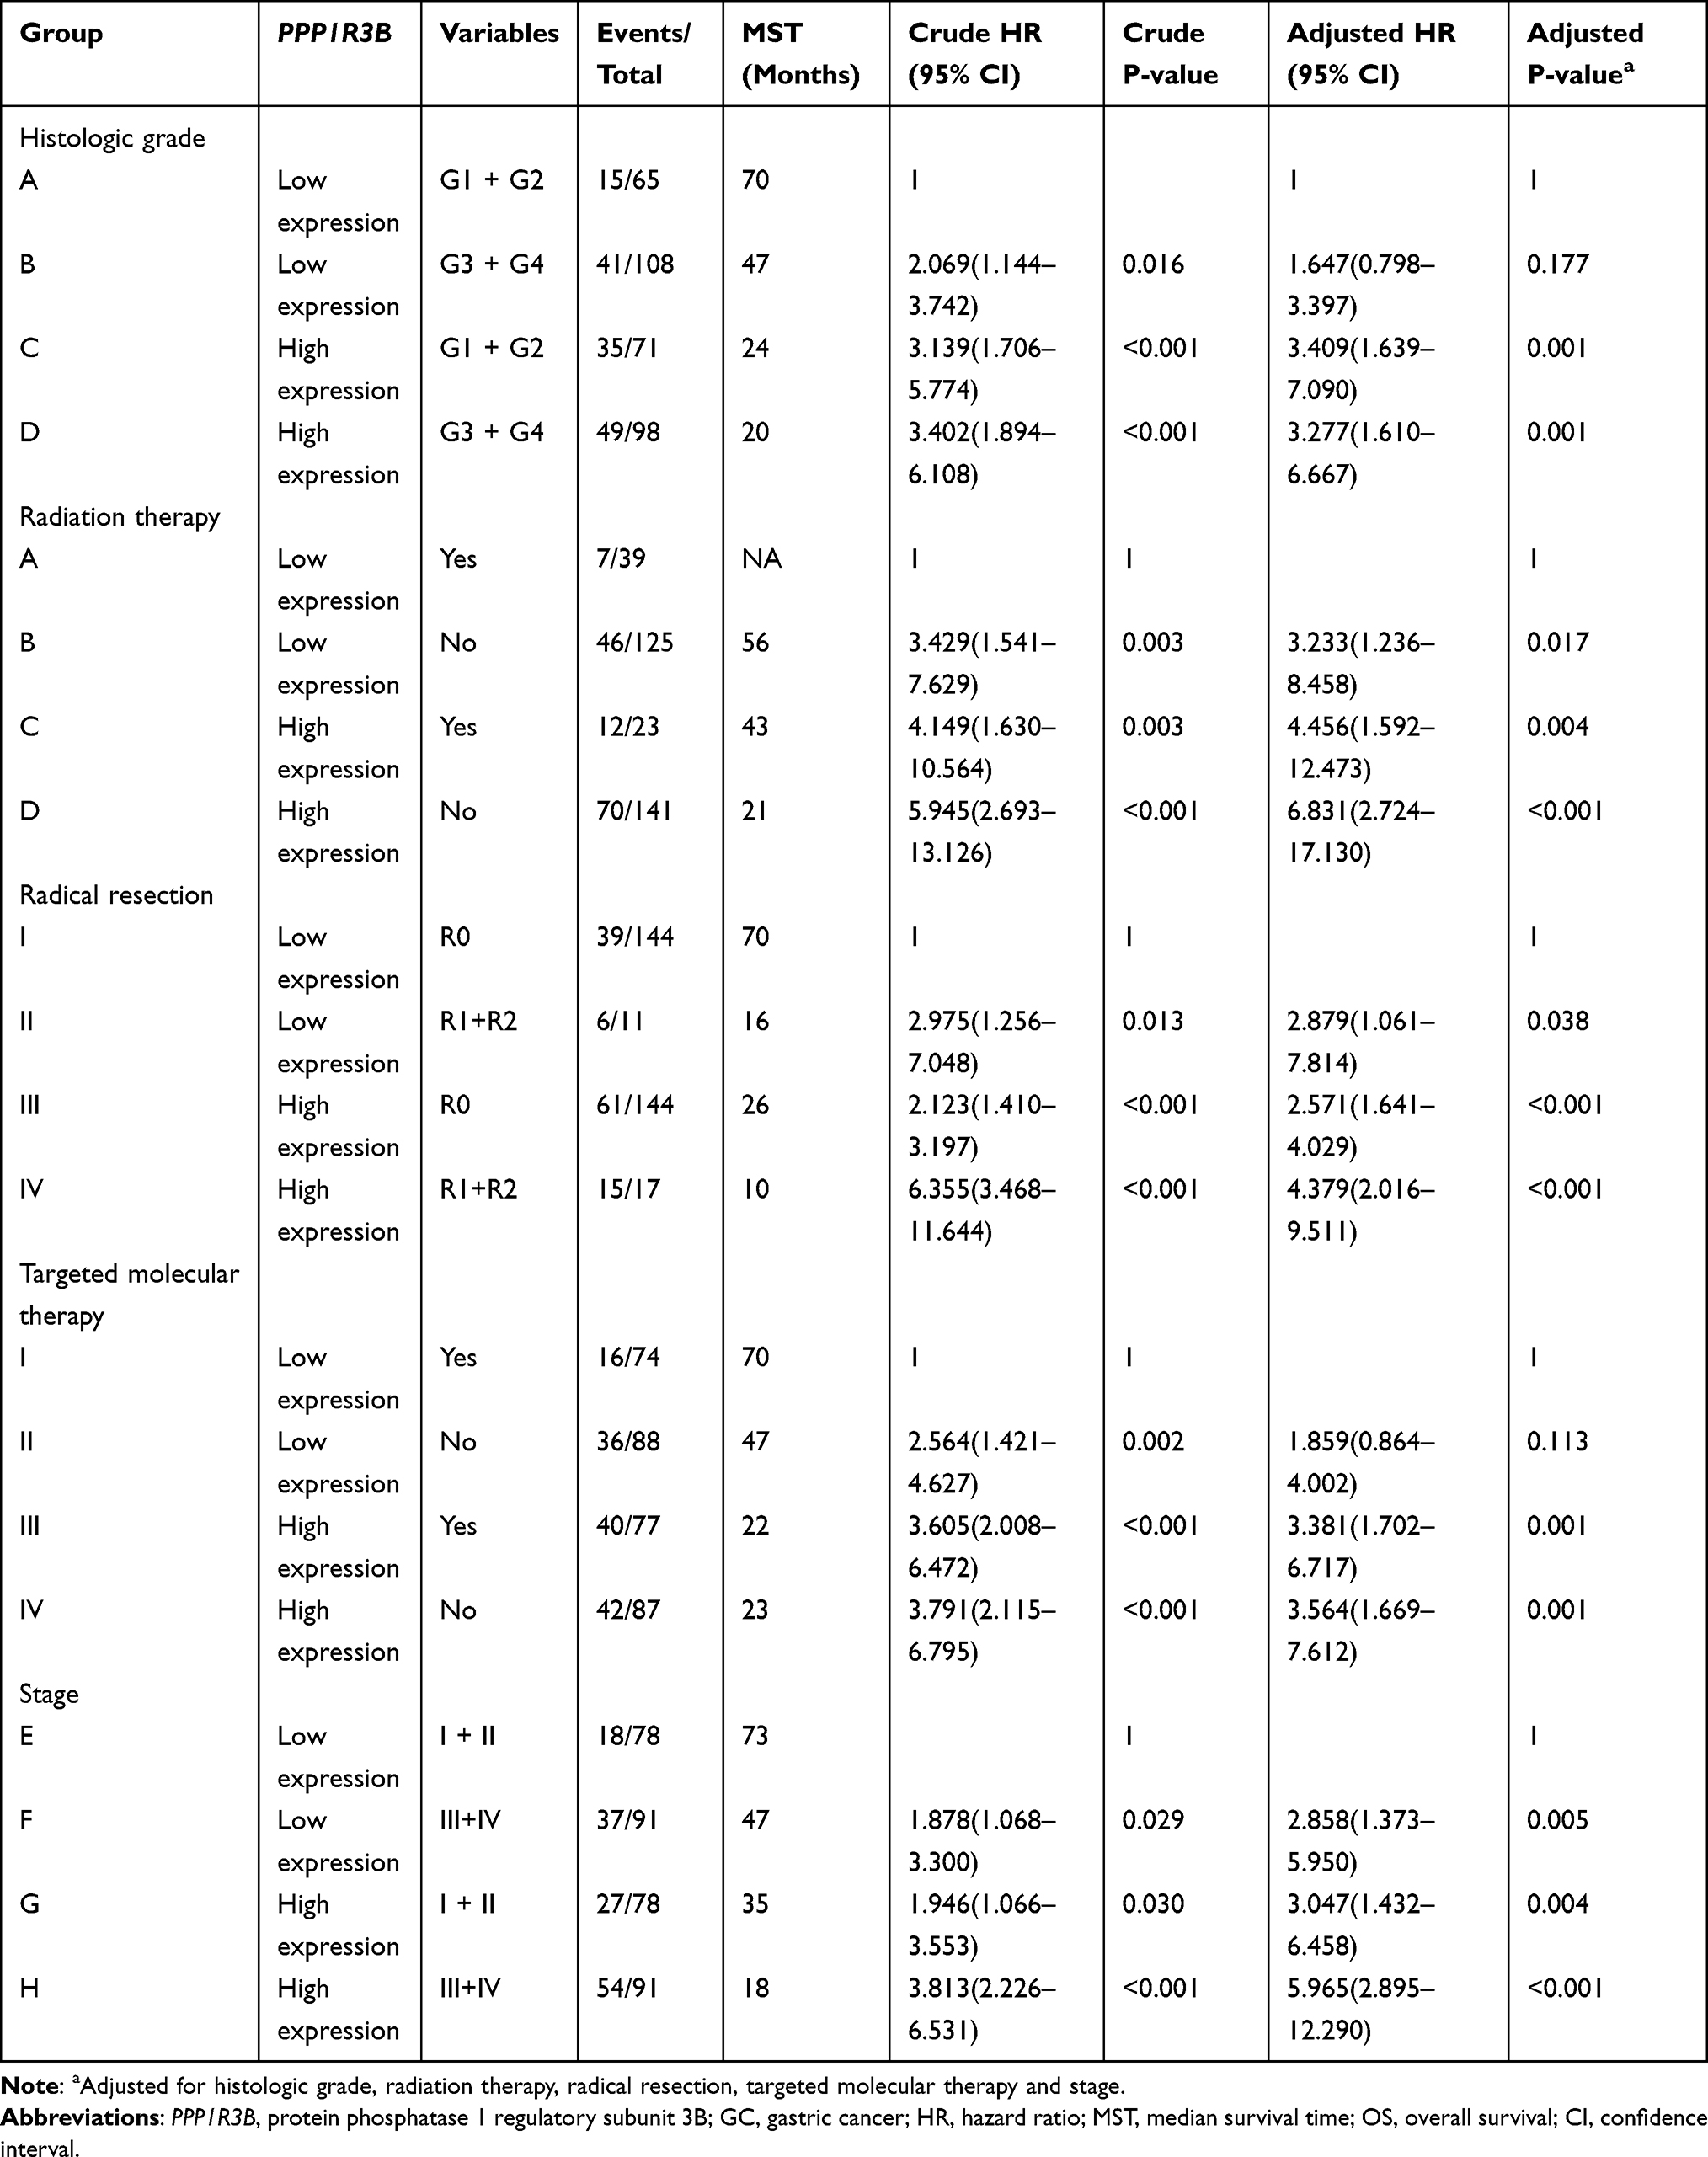 |
Table 4 Joint Effects Survival Analysis of Clinical Factors and the PPP1R3B Expression with OS |
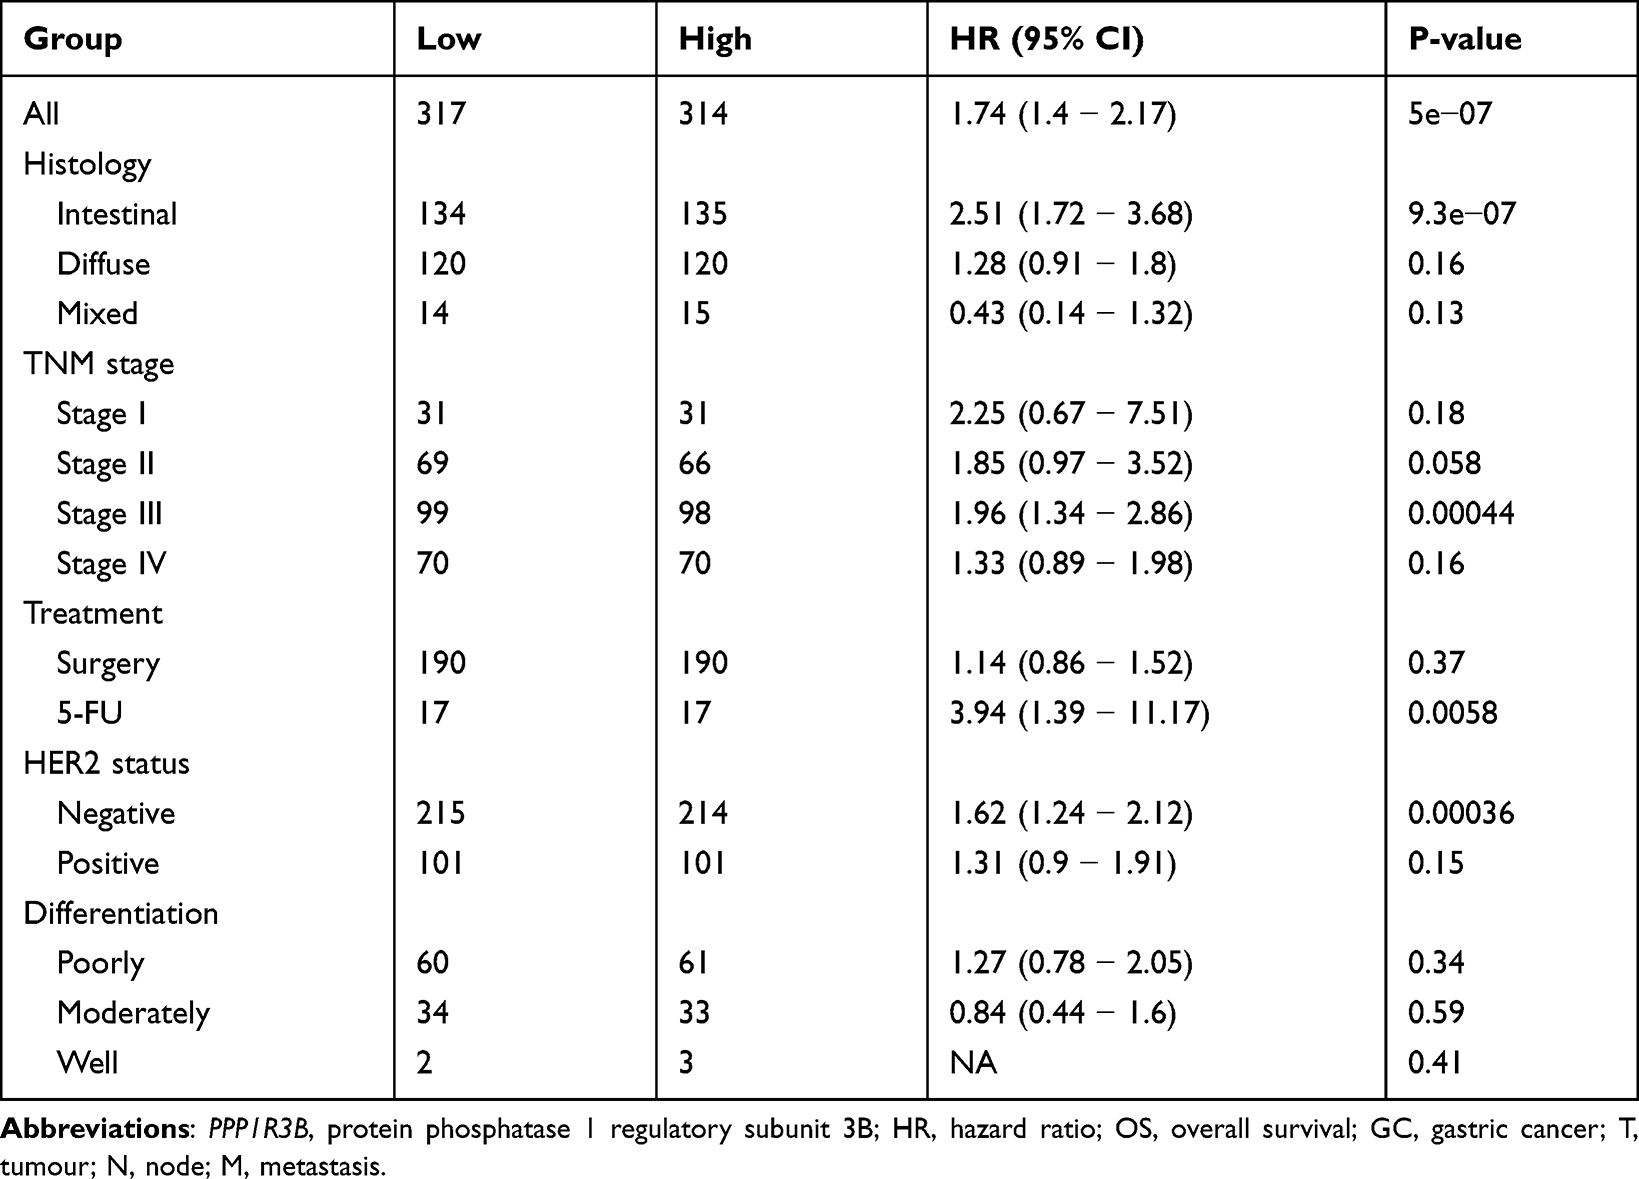 |
Table 5 The Prognostic Value of the mRNA Expression of PPP1R3B in Various Clinical Features from KM-Plotter |
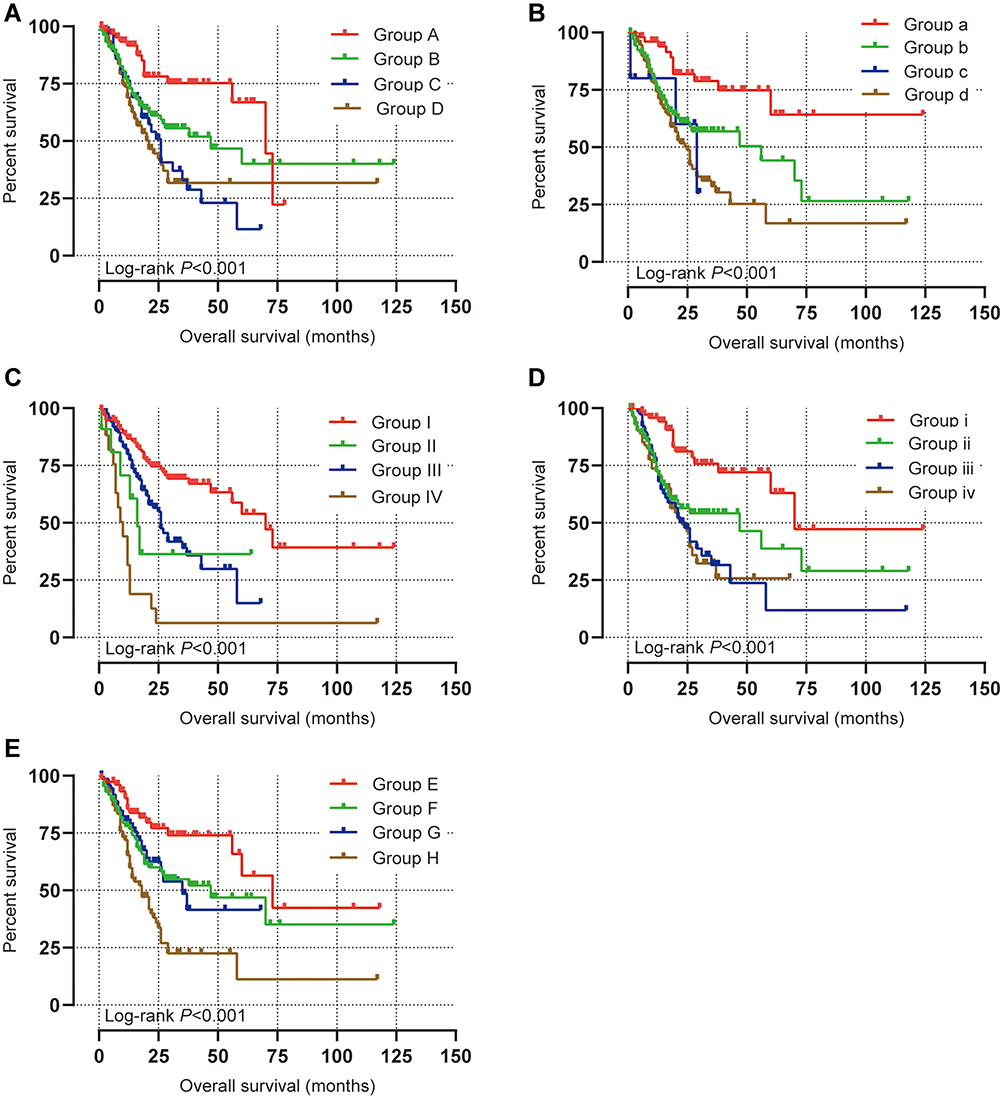 |
Figure 4 Joint effects analysis of overall survival stratified by PPP1R3B and STAD clinical parameters. Notes: Joint effects analysis stratified by PPP1R3B and following clinical parameters: histologic grade (A), radiation therapy (B), radical resection (C), targeted molecular therapy (D), stage (E). Group A, B, a, b, I, II, I, ii, E, F PPP1R3B Low expression. Group C, D, c, d, III, IV, iii, iv, G, H PPP1R3B High expression. |
KM-Plotter Survival Analyses
Finally, we used the KM-plotter database to verify the prognostic relationships between PPP1R3B and STAD outcomes. We witnessed worse OS rates with increasing PPP1R3B expression levels in all STAD patients, as outlined in Figure 5A and Table 5 (HR [95% CI] = 1.74 [1.4 − 2.17], P = 5e−07). We found that PPP1R3B expression could predict prognoses in subjects with Stage III (HR [95% CI] = 1.96 [1.34 − 2.86], P = 0.00044, Figure 5D), HER2 negative (HR [95% CI] = 1.62 [1.24 − 2.12], P = 0.00036, Figure 5G), 5-FU treatment (HR [95% CI] = 3.94 [1.39 − 11.17], P = 0.0058, Figure 5H), and intestinal (HR (95% CI) = 2.51 (1.72 − 3.68), P = 9.3e−07, Figure 5J) presentations. Nevertheless, no statistically significant differences were observed with respect to other clinical variables, including Stage I, II, and IV presentations (Figure 5B, C and E), HER2 positive status (Figure 5F), surgery (Figure 5I), diffuse type cancers (Figure 5K), mixed type cancers (Figure 5L), and differentiation (Figure 5M-O).
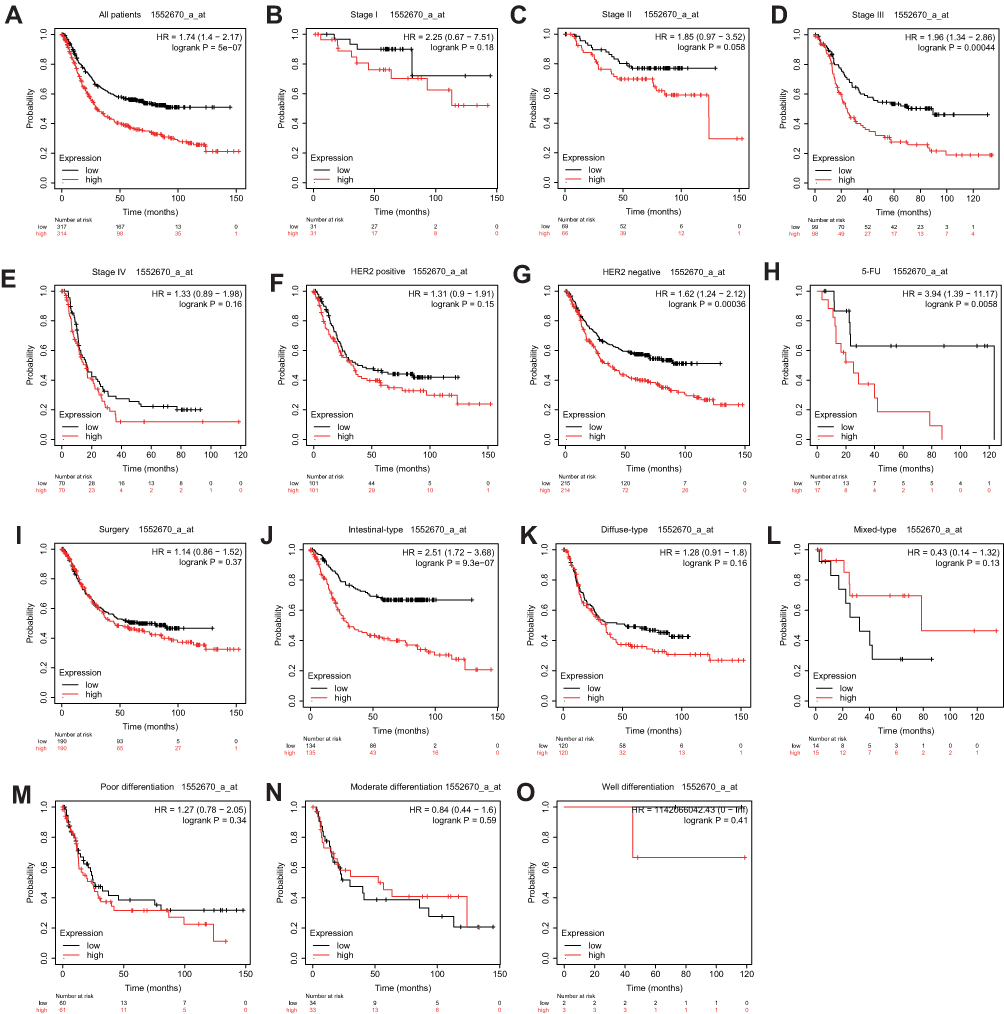 |
Figure 5 Prognostic value of PPP1R3B (1552670_a_at) expression determined by Kaplan–Meier plotter database. Notes: Overall survival curves for all patients (A), stage I (B), stage II (C), stage III (D), stage IV (E), HER2 positive (F), HER2 negative (G), 5-Fu treatment (H), surgery treatment(I), intestinal-type (J), diffuse-type (K), mixed-type (L), poor differentiation (M), moderate differentiation (N), well differentiation (O). |
Genome-Wide Co-Expression Analyses
The GO analysis demonstrated that the PPP1R3B gene was linked to transferase activity, mRNA 5’-UTR, folic acid and chromatin binding, extracellular matrix (ECM)-receptor interactions, organic acid transmembrane transporter activity, signalling pathways, regulatory pathways with respect to the pluripotency of stem cells, glycosaminoglycan biosynthesis, and amino and nucleotide sugar metabolism (Figure 6A). These results were consistent with the findings obtained in the KEGG analysis (Figure 6B).
 |
Figure 6 GO and KEGG analysis of genes co-expressed with PPP1R3B. Abbreviations: PPP1R3B, protein phosphatase 1 regulatory subunit 3. GO, Gene Ontology. KEGG, Kyoto Encyclopedia of Genes and Genomes. Notes: (A) GO enrichment analysis. (B) KEGG enrichment analysis. |
GSEA
The GSEA data indicated that in the c2 category, high PPP1R3B expression levels may be associated with hypoxia and with hypoxia-inducible factor-1 (HIF1A) and SRY-box transcription factor 4 (SOX4) expression (Figure 7A-C). In the c5 category, downregulation of PPP1R3B expression may be linked with cell-cell adhesion, T cell differentiation, homeostasis and receptor signalling pathways, antigen receptor-mediated signalling pathways, and lipopolysaccharide-mediated signalling pathways (Figure 7D-I).
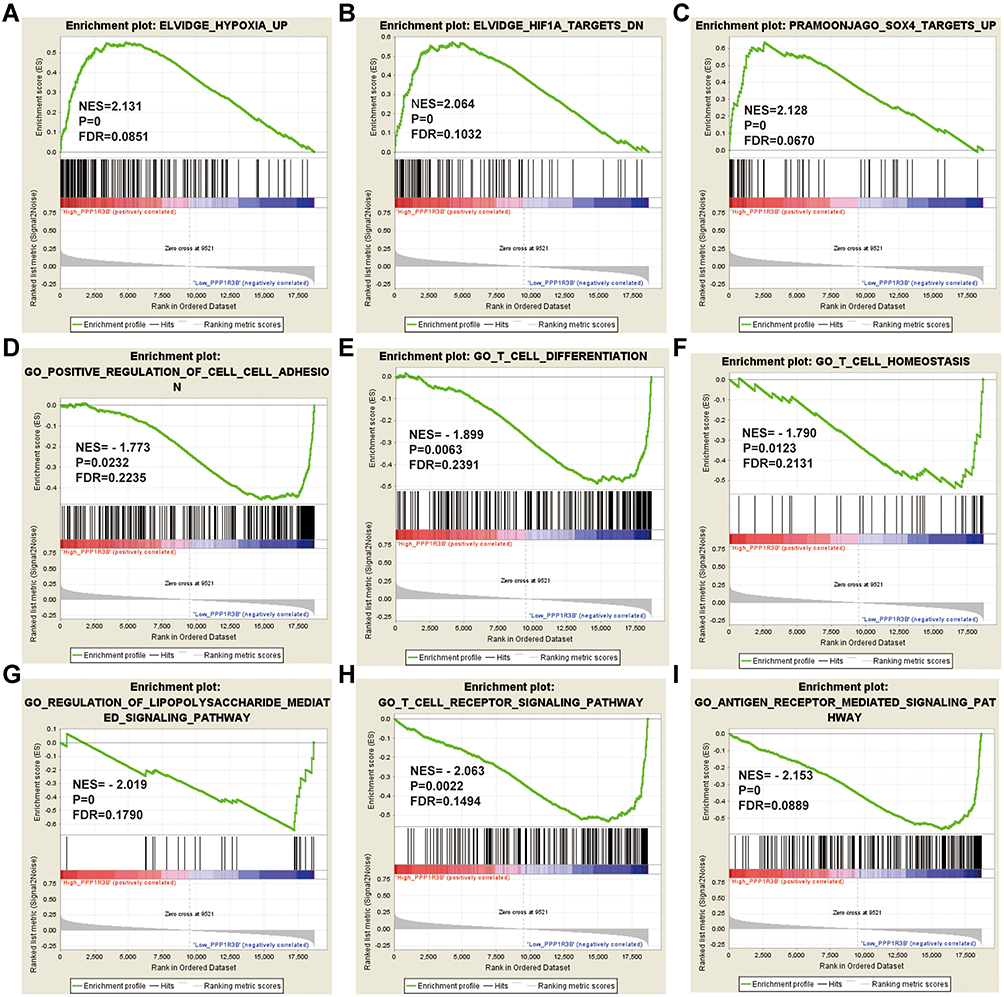 |
Figure 7 GSEA analysis of PPP1R3B in STAD patients using the TCGA database. Abbreviations: NES, normalized enrichment score; FDR, false discovery rate; GSEA, gene set enrichment analysis; PPP1R3B, protein phosphatase 1 regulatory subunit 3. Notes: (A–C) GSEA results of C2 reference gene sets for high PPP1R3B expression groups; (D–I) GSEA results of C5 reference gene sets for low PPP1R3B expression groups. |
Discussion
The loss of alleles in 8p11.2–12, 8p21-22, and 8p23.1 in human chromosome 8 are characteristic of oesophageal,18 colorectal,19 and prostate cancers, suggesting the presence of multiple tumour suppressor genes (TSG) on the short arm of chromosome 8. Previous studies have shown that 8p loss also occurs in STAD.20 The PPP1R3B gene is located on chromosome 8p23.1.21 However, to our knowledge, no study whatsoever has explored the importance of PPP1R3B in cancer processes and prognoses. Our investigation showed that the overexpression of PPP1R3B was associated with a shorter survival time and with higher mortality rates in STAD patients. Therefore, PPP1R3B may be considered an oncogene in STAD.
The evaluated PPP1R3B gene is a serine/threonine kinase that regulates glycogen synthesis in the liver and in skeletal muscles.22,23 This gene has previously been shown to be actively involved in the development of Alzheimer’s disease,24 hepatic steatosis,25 and lipid levels in patients of European origin.26 Cancer is a metabolic disease, and metabolic disorders tend to play an integral role in the occurrence and development of a variety of ailments.27 Hanahan et al highlighted metabolic changes as one of the ten characteristics of malignant tumours.28 A defect in lipid metabolism, for instance, may affect the proliferation and differentiation of tumour cells and may accelerate the occurrence and development of a range of cancer types.29 In fact, a decrease in choline and cholesterol levels in the serum and tissues of patients with STAD can be employed as a biomarker for the early diagnosis of STAD.30–32 These findings highlight the importance of defects in lipid metabolism and in cell membrane biosynthesis with respect to cancer progression.
In addition, PPP1R3B has been reported to play a role in activating glycogen synthetase (GYS) and in inactivating glycogen phosphorylase, thus resulting in abnormal glycogen metabolism. GYS is a key and rate-limiting enzyme in glycogen synthesis.33 Hypoxia inducible factor-1 (HIF-1) increases GYS levels in tumour cells, upregulates glycogen production, and causes cells to be more tolerant to hypoxia and nutritional deficiency. This suggests that glycogen synthesis triggered by the expression of GYS plays a crucial role in the stressful growth environment found within tumour cells.34,35 Glycogen metabolism is an important process for energy generation in tumor cells,6,36 and previous studies have shown glycogen accumulation to be a characteristic feature of many tumour cells and tissues.37,38 In addition, glycogen is involved in regulating the proliferation of tumour cells39 and may therefore be an important signalling molecule. For example, a high concentration of glycogen can activate AMP-activated protein kinase (AMPK), and the continuous activation of AMPK may cause cell aging and inhibit multiplication. Skwarski et al40 reported that the risk of STAD recurrence increased with prolonged operation time, which may be associated with glycogen storage during surgery. We note that it is possible to artificially reduce the amount of glycogen, thereby inhibiting the growth of cancer by maintaining the cell cycle at the G1 stop or G0 states.
GSEA analyses indicated that PPP1R3B may be associated with hypoxia, HIF1A and SOX4 expression, T cell receptor signalling pathways, cell differentiation, and T cell homeostasis, lipopolysaccharide-mediated signalling pathways, and antigen receptor-mediated signalling pathways. Genome-wide co-expression analyses in the current study indicated that the PPP1R3B gene may play an important role in metabolic processes and pathways.
Studies have likewise shown that SOX4 expression is higher in gastric tumour tissues than in adjacent normal tissues. The high expression of SOX4 in gastric tumour tissues is linked to tumour development and metastasis.41 T cell immunity is an important component of the human immune system, and an effective T cell response is necessary for the sufficient control of viral infections and tumour growth.42 Therefore, T cell immunity plays a significant role in many cancers, including, lung cancer,43 colorectal cancer,44 breast cancer45 and ovarian cancer.46 CD4+ T cells and CD8+ T cells, which influence the progression and prognosis of STAD, are important cell types in T-cell immunity as well.47,48 Some studies have shown that beta-catenin/T cytokine-mediated transcription (ie, classical Wnt signalling) may lead to chromosomal instability (CIN),49 leading to the development of STAD.50 Our study suggests that the inhibition of T cell differentiation, homeostasis, and associated signalling pathways may affect STAD prognoses.
Despite these important and novel findings and the overall substantial strengths of our investigation, our study has several limitations. First, the evaluated clinical information was acquired only from the TCGA database. Hence, future studies are needed to comprehensively validate and confirm our findings within study multiple databases. Second, in the TCGA database, expression data was only available for 32 adjacent tissues. Therefore, the insufficient sample size might lead to an underrepresentation of the outcomes of survival analyses. Third, the TCGA is an open database; hence, the underlying molecular mechanisms through which PPP1R3B affects the occurrence and prognosis of STAD should be further investigated.
Nevertheless, to the best of our knowledge, ours is the first study to explore the prognostic value of PPP1R3B in gastric adenocarcinoma. Comprehensive survival analyses suggest that PPP1R3B may be a potential independent prognostic determinant of OS in STAD patients. In the current study, GSEA was used to reveal cancer-associated biological processes and pathways. Once these findings are validated, we expect that PPP1R3B will be used in the diagnosis and treatment of STAD in clinical practice.
Conclusions
To the best of our knowledge, no study whatsoever has explored the importance of PPP1R3B in cancer progression and prognoses. Hence, ours is the first study to explore the prognostic value of PPP1R3B in any cancer. We focused on gastric adenocarcinoma specifically. Our results demonstrate that the PPP1R3B gene may be an independent predictive marker for STAD. However, additional highly-powered studies are needed to comprehensively validate these findings in the future. Our results guide future research directions and medical guidelines.
Data Sharing Statement
The datasets used and/or analysed during the current study are available from the corresponding author on reasonable request.
Ethics Approval and Consent to Participate
Our study has been approved by the Ethics Committee of the People’s Hospital of Guangxi Zhuang Autonomous Region.
Acknowledgments
The authors thank the contributors of TCGA (https://cancergenome.nih.gov/) and UCSC Xena (http://xena.ucsc.edu/) for sharing the gastric cancer data on open access.
Author Contributions
All authors made a significant contribution to the work reported, whether that is in the conception, study design, execution, acquisition of data, analysis and interpretation, or in all these areas; took part in drafting, revising or critically reviewing the article; gave final approval of the version to be published; have agreed on the journal to which the article has been submitted; and agree to be accountable for all aspects of the work.
Funding
There is no funding to report.
Disclosure
The authors report no conflicts of interest relevant to this work.
References
1. Wang H, Shen L, Li Y, et al. Integrated characterisation of cancer genes identifies key molecular biomarkers in stomach adenocarcinoma. J Clin Pathol. 2020;73(9):579–586.
2. Bray F, Ferlay J, Soerjomataram I, et al. Global cancer statistics 2018: GLOBOCAN estimates of incidence and mortality worldwide for 36 cancers in 185 countries. CA Cancer J Clin. 2018;68(6):394–424.
3. Hamashima C, Shabana M, Okada K, et al. Mortality reduction from gastric cancer by endoscopic and radiographic screening. Cancer Sci. 2015;106(12):1744–1749.
4. Brahimi-Horn MC, Bellot G, Pouyssegur J. Hypoxia and energetic tumour metabolism. Curr Opin Genet Dev. 2011;21(1):67–72.
5. Schulze A, Harris AL. How cancer metabolism is tuned for proliferation and vulnerable to disruption. Nature. 2012;491(7424):364–373.
6. Zois CE, Favaro E, Harris AL. Glycogen metabolism in cancer. Biochem Pharmacol. 2014;92(1):3–11.
7. Zois CE, Harris AL. Glycogen metabolism has a key role in the cancer microenvironment and provides new targets for cancer therapy. J Mol Med (Berl). 2016;94(2):137–154.
8. Ritterson Lew C, Guin S, Theodorescu D. Targeting glycogen metabolism in bladder cancer. Nat Rev Urol. 2015;12(7):383–391.
9. Li B, Severson E, Pignon JC, et al. Comprehensive analyses of tumor immunity: implications for cancer immunotherapy. Genome Biol. 2016;17(1):174.
10. Li T, Fan J, Wang B, et al. TIMER: a web server for comprehensive analysis of tumor-infiltrating immune cells. Cancer Res. 2017;77(21):e108–e110.
11. Li T, Fu J, Zeng Z, et al. TIMER2.0 for analysis of tumor-infiltrating immune cells. Nucleic Acids Res. 2020;48(W1):W509–W514.
12. Chandrashekar DS, Bashel B, Balasubramanya SAH, et al. UALCAN: a portal for facilitating tumor subgroup gene expression and survival analyses. Neoplasia. 2017;19(8):649–658.
13. Heagerty PJ, Zheng Y. Survival model predictive accuracy and ROC curves. Biometrics. 2005;61(1):92–105.
14. Zhou Y, Zhou B, Pache L, et al. Metascape provides a biologist-oriented resource for the analysis of systems-level datasets. Nat Commun. 2019;10(1):1523.
15. Subramanian A, Tamayo P, Mootha VK, et al. Gene set enrichment analysis: a knowledge-based approach for interpreting genome-wide expression profiles. Proc Natl Acad Sci U S A. 2005;102(43):15545–15550.
16. Mootha VK, Lindgren CM, Eriksson KF, et al. PGC-1alpha-responsive genes involved in oxidative phosphorylation are coordinately downregulated in human diabetes. Nat Genet. 2003;34(3):267–273.
17. Liberzon A, Birger C, Thorvaldsdóttir H, et al. The molecular signatures database hallmark gene set collection. Cell Systems. 2015;1(6):417–425.
18. Ishii H, Baffa R, Numata SI, et al. The FEZ1 gene at chromosome 8p22 encodes a leucine-zipper protein, and its expression is altered in multiple human tumors. Proc Natl Acad Sci U S A. 1999;96(7):3928–3933.
19. Farrington SM, Cunningham C, Boyle SM, et al. Detailed physical and deletion mapping of 8p with isolation of YAC clones from tumour suppressor loci involved in colorectal cancer. Oncogene. 1996;12(8):1803–1808.
20. Jenkins R, Takahashi S, Delacey K, et al. Prognostic significance of allelic imbalance of chromosome arms 7q, 8p, 16q, and 18q in stage T3N0M0 prostate cancer. Genes Chromosomes Cancer. 1998;21(2):131–143.
21. Yustein AS, Harper JC, Petroni GR, et al. Allelotype of gastric adenocarcinoma. Cancer Res. 1999;59(7):1437–1441.
22. Gasa R, Jensen PB, Berman HK, et al. Distinctive regulatory and metabolic properties of glycogen-targeting subunits of protein phosphatase-1 (PTG, GL, GM/RGl) expressed in hepatocytes. J Biol Chem. 2000;275(34):26396–26403.
23. Doherty MJ, Cadefau J, Stalmans W, et al. Loss of the hepatic glycogen-binding subunit (GL) of protein phosphatase 1 underlies deficient glycogen synthesis in insulin-dependent diabetic rats and in adrenalectomized starved rats. Biochem J. 1998;333(Pt 2):253–257.
24. Kamboh MI, Demirci FY, Wang X, et al. Genome-wide association study of Alzheimer’s disease. Transl Psychiatry. 2012;2:e117.
25. Speliotes EK, Yerges-Armstrong LM, Wu J, et al. Genome-wide association analysis identifies variants associated with nonalcoholic fatty liver disease that have distinct effects on metabolic traits. PLoS Genet. 2011;7(3):e1001324.
26. Teslovich TM, Musunuru K, Smith AV, et al. Biological, clinical and population relevance of 95 loci for blood lipids. Nature. 2010;466(7307):707–713.
27. Beger RD. A review of applications of metabolomics in cancer. Metabolites. 2013;3(3):552–574.
28. Hanahan D, Weinberg RA. Hallmarks of cancer: the next generation. Cell. 2011;144(5):646–674.
29. Nie S, Zhao Y, Qiu X, et al. Metabolomic study on nude mice models of gastric cancer treated with modified Si Jun Zi Tang via HILIC UHPLC-Q-TOF/MS analysis. Evid Based Complement Alternat Med. 2019;2019:3817879.
30. Song H, Peng JS, Dong-Sheng Y, et al. Serum metabolic profiling of human gastric cancer based on gas chromatography/mass spectrometry. Braz J Med Biol Res. 2012;45(1):78–85.
31. Wang H, Zhang H, Deng P, et al. Tissue metabolic profiling of human gastric cancer assessed by (1)H NMR. BMC Cancer. 2016;16:371.
32. Zhang H, Cui L, Liu W, et al. (1)H NMR metabolic profiling of gastric cancer patients with lymph node metastasis. Metabolomics. 2018;14(4):47.
33. Zeqiraj E, Sicheri F. Getting a handle on glycogen synthase - Its interaction with glycogenin. Mol Aspects Med. 2015;46:63–69.
34. Pelletier J, Bellot G, Gounon P, et al. Glycogen synthesis is induced in hypoxia by the hypoxia-inducible factor and promotes cancer cell survival. Front Oncol. 2012;2:18.
35. Iida Y, Aoki K, Asakura T, et al. Hypoxia promotes glycogen synthesis and accumulation in human ovarian clear cell carcinoma. Int J Oncol. 2012;40(6):2122–2130.
36. Lee WN, Guo P, Lim S, et al. Metabolic sensitivity of pancreatic tumour cell apoptosis to glycogen phosphorylase inhibitor treatment. Br J Cancer. 2004;91(12):2094–2100.
37. Govender D, Ramdial PK, Clarke B, et al. Clear cell (glycogen-rich) gastric adenocarcinoma. Ann Diagn Pathol. 2004;8(2):69–73.
38. Takahashi S, Satomi A, Yano K, et al. Estimation of glycogen levels in human colorectal cancer tissue: relationship with cell cycle and tumor outgrowth. J Gastroenterol. 1999;34(4):474–480.
39. Mcbride A, Ghilagaber S, Nikolaev A, et al. The glycogen-binding domain on the AMPK beta subunit allows the kinase to act as a glycogen sensor. Cell Metab. 2009;9(1):23–34.
40. Skwarski L, Namiot Z, Stasiewicz J, et al. Glycogen content in the gastric mucosa of partially resected stomach; a possible relationship with the development of cancer. Cancer Lett. 1998;127(1–2):123–128.
41. Fang CL, Hseu YC, Lin YF, et al. Clinical and prognostic association of transcription factor SOX4 in gastric cancer. PLoS One. 2012;7(12):e52804.
42. Kamphorst AO, Ahmed R. CD4 T-cell immunotherapy for chronic viral infections and cancer. Immunotherapy. 2013;5(9):975–987.
43. Dieu-Nosjean MC, Antoine M, Danel C, et al. Long-term survival for patients with non-small-cell lung cancer with intratumoral lymphoid structures. J Clin Oncol. 2008;26(27):4410–4417.
44. Simpson JA, Al-Attar A, Watson NF, et al. Intratumoral T cell infiltration, MHC class I and STAT1 as biomarkers of good prognosis in colorectal cancer. Gut. 2010;59(7):926–933.
45. Hu ZI, Ho AY, Mcarthur HL. Combined radiation therapy and immune checkpoint blockade therapy for breast cancer. Int J Radiat Oncol Biol Phys. 2017;99(1):153–164.
46. Zhang L, Conejo-Garcia JR, Katsaros D, et al. Intratumoral T cells, recurrence, and survival in epithelial ovarian cancer. N Engl J Med. 2003;348(3):203–213.
47. Ahearne MJ, Allchin RL, Fox CP, et al. Follicular helper T-cells: expanding roles in T-cell lymphoma and targets for treatment. Br J Haematol. 2014;166(3):326–335.
48. Lu X, Yang L, Yao D, et al. Tumor antigen-specific CD8(+) T cells are negatively regulated by PD-1 and Tim-3 in human gastric cancer. Cell Immunol. 2017;313:43–51.
49. Aoki K, Aoki M, Sugai M, et al. Chromosomal instability by beta-catenin/TCF transcription in APC or beta-catenin mutant cells. Oncogene. 2007;26(24):3511–3520.
50. Huang Q. Single disease entity for both chromosomal instable subtype gastric adenocarcinoma and esophageal adenocarcinoma. J Dig Dis. 2017;18(6):319–322.
 © 2022 The Author(s). This work is published and licensed by Dove Medical Press Limited. The full terms of this license are available at https://www.dovepress.com/terms.php and incorporate the Creative Commons Attribution - Non Commercial (unported, v3.0) License.
By accessing the work you hereby accept the Terms. Non-commercial uses of the work are permitted without any further permission from Dove Medical Press Limited, provided the work is properly attributed. For permission for commercial use of this work, please see paragraphs 4.2 and 5 of our Terms.
© 2022 The Author(s). This work is published and licensed by Dove Medical Press Limited. The full terms of this license are available at https://www.dovepress.com/terms.php and incorporate the Creative Commons Attribution - Non Commercial (unported, v3.0) License.
By accessing the work you hereby accept the Terms. Non-commercial uses of the work are permitted without any further permission from Dove Medical Press Limited, provided the work is properly attributed. For permission for commercial use of this work, please see paragraphs 4.2 and 5 of our Terms.