")
Back to Journals » International Journal of Chronic Obstructive Pulmonary Disease » Volume 10 » Issue 1
Protein networks in induced sputum from smokers and COPD patients
Authors Baraniuk J , Casado B, Pannell L, McGarvey P, Boschetto P, Luisetti M, Iadarola P
Received 17 October 2014
Accepted for publication 1 April 2015
Published 15 September 2015 Volume 2015:10(1) Pages 1957—1975
DOI https://doi.org/10.2147/COPD.S75978
Checked for plagiarism Yes
Review by Single anonymous peer review
Peer reviewer comments 3
Editor who approved publication: Dr Richard Russell
James N Baraniuk,1 Begona Casado,1 Lewis K Pannell,2 Peter B McGarvey,3 Piera Boschetto,4 Maurizio Luisetti,5,† Paolo Iadarola6
1Division of Rheumatology, Immunology and Allergy, Georgetown University, Washington, DC, 2Proteomics and Mass Spectrometry Laboratory, Mitchell Cancer Center, University of South Alabama, Mobile, AL, 3Innovation Center for Biomedical Informatics, Georgetown University, Washington, DC, USA; 4Department of Medical Sciences, University of Ferrara, Ferrara, 5SC Pneumologia, Dipartimento Medicina Molecolare, Fondazione IRCCS Policlinico San Matteo, 6Lazzaro Spallanzani Department of Biology and Biotechnology, University of Pavia, Pavia, Italy
†Maurizio Luisetti passed away on October 20, 2014
Rationale: Subtypes of cigarette smoke-induced disease affect different lung structures and may have distinct pathophysiological mechanisms.
Objective: To determine if proteomic classification of the cellular and vascular origins of sputum proteins can characterize these mechanisms and phenotypes.
Subjects and methods: Individual sputum specimens from lifelong nonsmokers (n=7) and smokers with normal lung function (n=13), mucous hypersecretion with normal lung function (n=11), obstructed airflow without emphysema (n=15), and obstruction plus emphysema (n=10) were assessed with mass spectrometry. Data reduction, logarithmic transformation of spectral counts, and Cytoscape network-interaction analysis were performed. The original 203 proteins were reduced to the most informative 50. Sources were secretory dimeric IgA, submucosal gland serous and mucous cells, goblet and other epithelial cells, and vascular permeability.
Results: Epithelial proteins discriminated nonsmokers from smokers. Mucin 5AC was elevated in healthy smokers and chronic bronchitis, suggesting a continuum with the severity of hypersecretion determined by mechanisms of goblet-cell hyperplasia. Obstructed airflow was correlated with glandular proteins and lower levels of Ig joining chain compared to other groups. Emphysema subjects’ sputum was unique, with high plasma proteins and components of neutrophil extracellular traps, such as histones and defensins. In contrast, defensins were correlated with epithelial proteins in all other groups. Protein-network interactions were unique to each group.
Conclusion: The proteomes were interpreted as complex “biosignatures” that suggest distinct pathophysiological mechanisms for mucin 5AC hypersecretion, airflow obstruction, and inflammatory emphysema phenotypes. Proteomic phenotyping may improve genotyping studies by selecting more homogeneous study groups. Each phenotype may require its own mechanistically based diagnostic, risk-assessment, drug- and other treatment algorithms.
Keywords: cigarette smokers, chronic bronchitis, emphysema, proteomics, mucous hypersecretion, mucin 5AC, neutrophil extracellular nets
Introduction
Cigarette smoking leads to several clinical phenotypes, including COPD. Approximately half of smokers develop chronic bronchitis with mucus hypersecretion,1 while approximately 15% develop obstruction to airflow defined by a forced expiratory volume in 1 second (FEV1) <80% of predicted and a ratio of FEV1 to forced vital capacity <0.70.2 A proportion of COPD subjects develop the alveolar destruction of emphysema evident on computed tomography (CT) scans.3 These criteria define a phenotypic framework of: 1) nonsmokers (Non), 2) healthy smokers without airflow obstruction (HS), 3) chronic bronchitis subjects with mucus hypersecretion but normal airflow (CB), 4) COPD subjects with airflow obstruction (COPD), and 5) emphysema subjects with airflow obstruction (E&C). The pathophysiological mechanisms responsible for each clinically relevant phenotype are poorly defined.
The proteins and other mediators in induced sputum4 may predict disease phenotype and illness severity. For example, outcomes such as FEV1/forced vital capacity, sputum eosinophilia, and metalloprotease 9 are more severely altered in the E&C subset of smokers than CB or HS subjects.5,6 Specific phenotype-related proteomic patterns may be the result of discrete combinations of airway secretory, exudative, and inflammatory dysfunction.7 Immunohistological and functional evidence suggests that discrete patterns of dysfunction may involve: 1) production of secretory IgA (sIgA), 2) submucosal gland serous cell protein exocytosis exemplified by BPIFB1,8 3) epithelial cell secretion, 4) goblet-cell MUC5AC release in small airways and after goblet-cell hyperplasia,9 5) exocytosis of glandular and ductal mucus products (eg, MUC5B) in larger bronchi, 6) extravasation of plasma proteins that originate from distant B lymphocytes (eg, IGHG1) and the liver (eg, ALB, TF, and HP), 7) neutrophil infiltration with phagocytosis or formation of neutrophil extracellular nets (NETs),10–12 8) synthesis of additional heavy, light, and variable Ig chains, and 9) saliva.
sIgA is an example of functional coherence within a group of proteins. Mucosal B cells produce IGHA1 at a 3:1 to 4:1 ratio compared to IGHA2. IgA heavy chains are linked by joining chains (IGJ) to form IgA dimers (IgA12–IgJ or IgA22–IgJ). Kappa light chains are rearranged before lambda chains, and so more kappa chains are incorporated into antibodies. The dimers bind to PIGR, located on the interstitial surface of submucosal gland serous cells.13 PIGR binds these dimers covalently. The pinocytosed complex is shepherded through serous cells for exocytosis with other secreted proteins. This is in contrast to monomeric IgA that lacks IGJ, and the IgG-subclass antibodies that are produced by distant plasma cells. These enter the airways predominantly by plasma exudation along with hepatic proteins.
Recognition of these shared glandular, vascular, and epithelial protein sources, mechanisms of secretion, and potentially mutual regulatory controls permit a systems-biology approach to identify individual biomarkers and sets of proteins (“biosignatures”) that may be predictive of cigarette smoking and COPD phenotypes.14
Subjects and methods
This paper represents a further elaboration of previously published data,7 where details of methodological issues are described. The main aspects are reported for clarity.
Subjects
Ethical approvals were obtained from the Institutional Review Boards of University of Pavia and Georgetown University. Informed consent was obtained to assess induced sputum,5,7 smoking history, and pulmonary function,15 and CT scans3 classified subjects into phenotypes of: lifelong never-smokers (Non; n=7), healthy smokers (HS; n=13), chronic bronchitic patients (CB; n=11), patients with COPD without significant emphysema (COPD; n=15), and patients with significant emphysema and the airflow obstruction of COPD (E&C; n=10). Demographics, clinical data, and sputum biochemical5 and proteomic7 outcomes have been described. The HS and CB groups were younger than COPD and E&C. This suggested that more time and exposure was required for HS subjects to transition to airflow obstruction and alveolar inflammation. Age-matched studies are required as follow-up studies.
Sputum
Lyophilized sputum was reconstituted, digested with trypsin, and peptides separated by capillary liquid chromatography–quadrupole–time-of-flight mass spectrometry (Waters Corporation, Milford, MA, USA). Mascot software (Matrix Science, London, UK) and the National Center for Biotechnology Information database matched peptides to proteins (Table 1).7 Unmatched peptide sequences with ion scores >20 were assessed using the Protein Information Resource’s “peptide match” feature.16,17 RefSeq (Reference Sequence) protein identifiers were converted to unique National Center for Biotechnology Information gene-symbol abbreviations. This avoided confusion from redundant coding numbers (albumin), alternative names (BPIFB1 = C20orf114 = LPLUNC1),9 and peptide sequences shared by different Ig isotypes,18 DEFA1&3, ORM1&2, and between other proteins. Proteins detected in fewer than three subjects (eg, S100A9) were excluded to reduce data complexity in this pilot study. Frequencies of protein detection were calculated for each clinical phenotype. Collating proteins by their cellular sources significantly constrained data complexity (see Introduction). Ig variable-chain results were excluded because of idiotype hypervariability and somatic mutation that generated many unique peptide sequences. Subjects with fewer than five remaining proteins were removed from analysis. Factor and multilogistic regression analyses were negative because of this stratified analytical strategy.
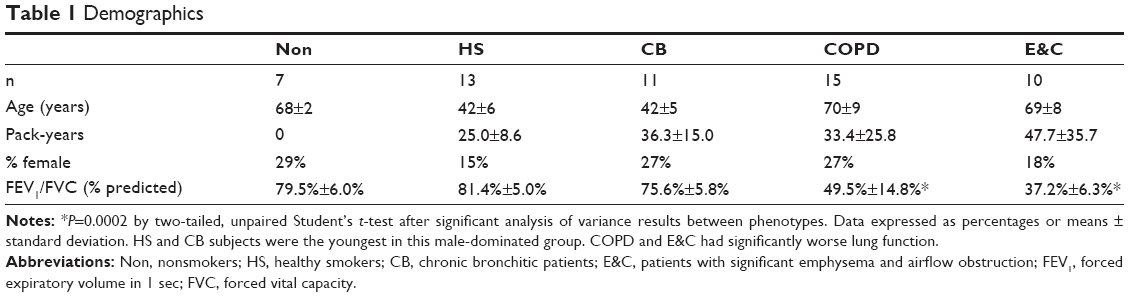 | Table 1 Demographics |
Relative protein abundance: spectral counts
Mass-spectrometry data were reanalyzed to determine the number of individual tryptic peptides in each specimen. The number of peptides per protein is the spectral count, and provides a means to quantify relative protein abundances.19 Spectral counts were normalized by dividing the number of tryptic peptides per protein20–22 by the total number of peptides per specimen, then multiplying by protein concentrations to correct for differing amounts of starting materials. Log10 transformation was effective at reducing the impacts of exceptionally high or absent outliers. Mean transformed spectral counts and 95% confidence intervals for each protein and phenotype were compared between groups by analysis of variance (ANOVA) with significance at P≤0.05, followed by two-tailed unpaired Student t-tests.23–25 These pilot data were not corrected for multiple comparisons. Our intent was to assess data reduction, parallel analysis, and obtain preliminary trends and differences for future power-analysis calculations.
Spectral counts for each identified protein from all sputum samples were ranked by conversion to percentiles. The percentiles for each protein provided relative levels for comparisons within phenotypes, across all subjects, and between the five phenotypes. The normalized protein percentiles facilitated comparisons of very high- and very low-abundance proteins.
Correlation
Normalized spectral counts for all pairs of proteins detected within each phenotype were correlated. Significant relationships (Pearson’s correlations with P≤0.05)23–25 were found for exocytosis from submucosal gland serous and mucous cells, goblet and other epithelial cells, vascular permeability, and neutrophilic inflammation.
Frequencies of detection
For each protein, the number of subjects who had detectable protein was divided by the number of subjects in that phenotypic group. This provided a measure of the presence of that protein in sputum that was independent of spectral counts. The relative presence or absence of a protein in a phenotypic group allowed inferences about variations between groups, the patterns of change for sputum proteins in Non and smoker phenotypes, and homeostatic and pathophysiological mechanisms involving each protein.
Scattergrams
Scattergrams were used to plot the presence of each protein (frequencies of detection) versus protein abundances (normalized spectral counts converted to percentiles). This allowed visualization of significant positive and negative Pearson’s correlations (P≤0.05) between high- and low-abundance proteins. In general, correlated sets conformed to the predicted cellular origins described in the Introduction. Changes in sources of sputum proteins were traced with the progression of disease from HS to E&C. These results suggested independent modular responses of exocytosis from bronchial glands, epithelial secretion, vascular permeability, and neutrophilic inflammation in different groups of smokers. Unexpected significant deviations like DEFA1&3 in E&C were identified.
Protein network-interaction analysis
Significantly correlated sets of proteins in single phenotypes were analyzed. Functional and regulatory networks were created for sets of epithelial, glandular, inflammatory, and other cell products. Tools and resources included Cytoscape 2.8,26,27 the ReactomeFI plug-in28–30 with the 2012 FI database supplemented with interactions from the STRING (Search Tool for the Retrieval of Interacting Genes/Proteins) database,31,32 and pathway databases from KEGG release 64.0 (October 1, 2012),33 BioCarta,34 the Pathway Interaction Database (PID),35 and Reactome.36 Significant interactions were defined by P≤0.05 and false-discovery rate ≤0.01. Gene networks were constructed using a spectral partition-based network clustering algorithm in the ReactomeFI plug-in.30
Results
Subjects
Subjects were predominantly male (Table 1).5 The HS and CB groups were younger than the others. By definition, lung function was significantly worse for COPD and E&C than the other smokers (P=0.0002 by two-tailed, unpaired Student t-test after significant ANOVA). This reflected the differences in age, pack-years, and severity of lung disease.
Proteins detected in induced sputum
The original set of 203 RefSeq proteins7 was reduced to 114 gene products using the National Center for Biotechnology Information gene database and improved annotation of Ig sequences.18 The 50 proteins detected in at least three specimens were analyzed. The 16 with the highest transformed spectral counts were detected in 64%–100% of samples (Table 2). Sputum proteins were organized by tissue of origin. Percentile spectral counts and frequencies of detection assessed relative trends in protein expression between groups (Figure 1).
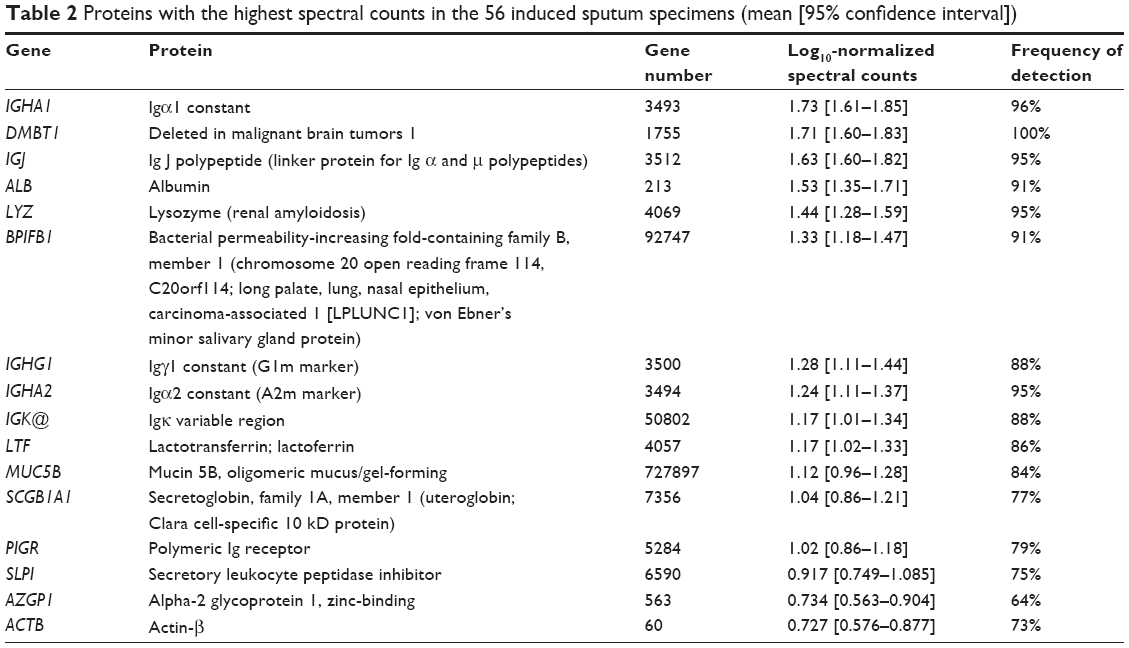 | Table 2 Proteins with the highest spectral counts in the 56 induced sputum specimens (mean [95% confidence interval]) |
 | Figure 1 Patterns for relationships between protein spectral count percentiles and frequencies of detection for each phenotype. |
Secretory IgA
Uniformly high spectral counts and frequencies of detection for IGHA1 and IGHA2 heavy chains created a “ceiling” effect in the five groups (Figure 2). IGJ was lower in COPD than the other groups (P=0.044 by t-test after significant ANOVA) (Figure 1D). This may indicate damage or dysregulation in the bronchial mucosa, with decreased plasma cell production of IgA dimers, reduced expression of PIGR or pinocytosis by serous submucosal gland cells, or a reduction in number of IgA-transporting serous cells in the glands in the COPD group.37
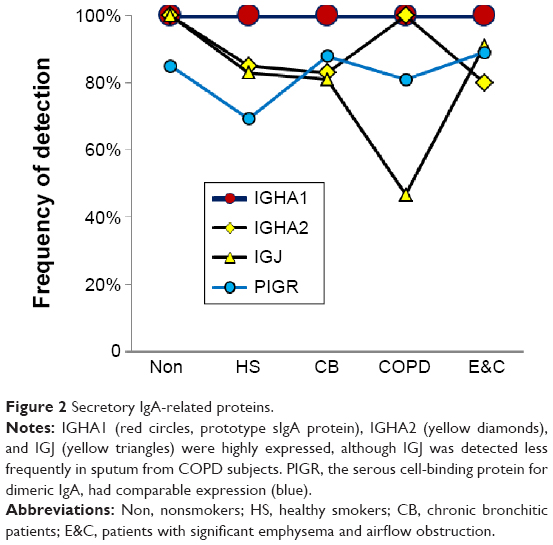 | Figure 2 Secretory IgA-related proteins. |
Submucosal gland serous cells
LYZ, LTF, SLPI, and BPIFB1 were the predominant serous cell products (Figure 3). BPIFB1 was detected in 80% or more of all specimens per group. However, counts were lowest in Non and HS (P=0.014), suggesting that BPIFB1 was a common protein whose secretion increased as lung function worsened. The BPIFA1 (PLUNC) protein was detected only in the COPD group (not significant). In contrast, BPIFB2 was essentially present only in the Non group (P=0.000003). These data were consistent with previous studies showing large increases in messenger RNA (mRNA) levels for BPIFB1 and BPIFA1 in airway cells of smokers,38 and BPIFA1 from bronchial epithelial scrapings.39 LCN1, the namesake for this lipid-sequestering β-barrel LCN protein family, was detected in the HS group (P=0.027).
 | Figure 3 Submucosal gland serous cell proteins. |
Epithelial proteins
Counts for SCGB1A1 (uteroglobin; Clara cell-specific 10 kD protein), PRR4, and AZGP1 were significantly higher in Non than the smoker groups. AZGP1 showed the largest magnitude drop from Non to HS of all proteins (P=0.009), suggesting it may be a marker of nonsmoker status (Figure 4). However, this finding was contrary to Vanni et al who found higher AZGP1 protein expression by Western blot and immunohistochemistry, and mRNA levels in large airway epithelia of healthy smokers compared to healthy nonsmokers.40 One potential explanation may be increased glycosylation in smokers, which may allow detection of higher concentrations of AZGP1 epitopes by immune methods, but reduce the efficiency of trypsin digestion and tryptic peptide formation prior to mass spectrometry.
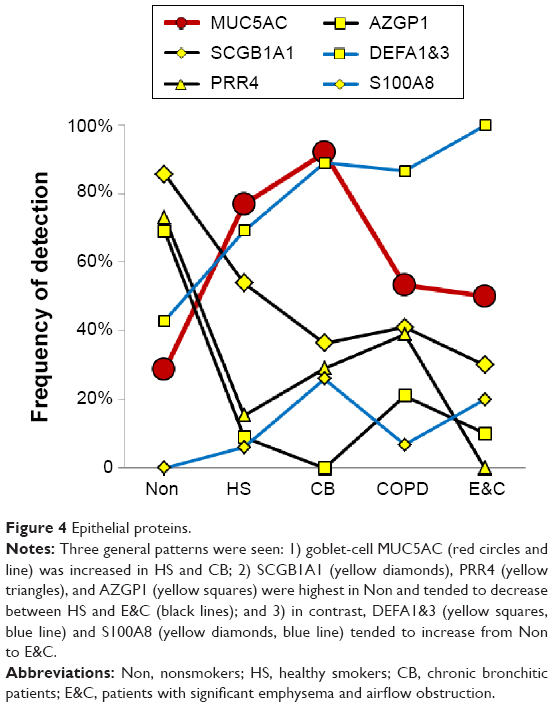 | Figure 4 Epithelial proteins. |
SCGB1A1, the most highly expressed gene in Clara cells (club cells), had its highest proteomic levels in Non, with intermediate levels in HS (P=0.064) and lowest levels in CB, COPD, and E&C. Smoking caused large decreases for SCGB1A1 mRNA in bronchial41 and nasal mucosa42 and small airway epithelial cells,38 which was consistent with our proteomic trend. DEFA1&3 levels were lowest in Non, then increased progressively to maximum values in E&C. DEFA1&3 was probably of epithelial cell origin in all groups except E&C, where DEFA1&3 correlated with neutrophil proteins. Future studies of defensin expression in sputum and lung parenchyma are warranted to confirm and extend this finding.
Goblet-cell mucin 5AC
MUC5AC was significantly higher in CB and HS than Non, COPD, and E&C (P=0.004), (Figure 1A, B and Figure 4). This was consistent with goblet-cell rather than submucosal gland mucous cell hypersecretion in CB.9,43
Submucosal gland and duct mucous cells
MUC5B and DMBT1 were highly expressed in all groups. MSMB and PIP were detected in fewer specimens (Figure 5). These changes were consistent with data from small airway secretory cells obtained from current smokers compared to nonsmokers38 and after smoking cessation.44
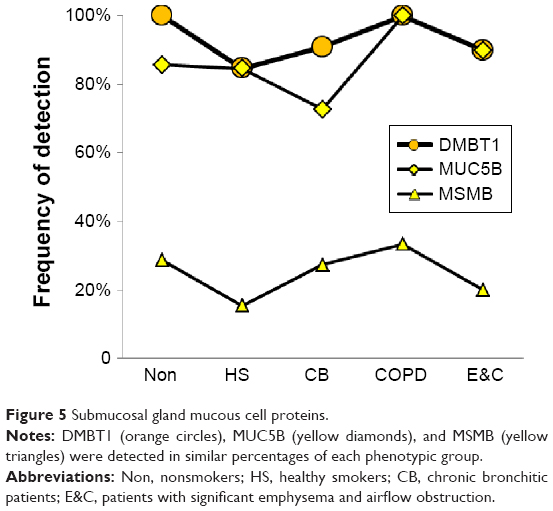 | Figure 5 Submucosal gland mucous cell proteins. |
Neutrophil and cellular proteins
Two patterns were found (Figure 6). CB had frequent CST1&4 (sequences shared by cystatin SN and cystatin S), GAPDH, and GSN. In contrast, E&C had significantly higher HIST2H2BE (P=0.035) and MPO (P=0.030) than the other groups (Figure 1C). DEF1&3, LCN2, ACTG1, and CTSG were also more frequent in E&C. Correlations were shown between histones, neutrophil granule proteins, and ACTB. These proteins were characteristic of neutrophil cell death with extrusion of NETs in E&C.10–12 Actins and histones have been previously detected by proteomic means without mRNA expression.39
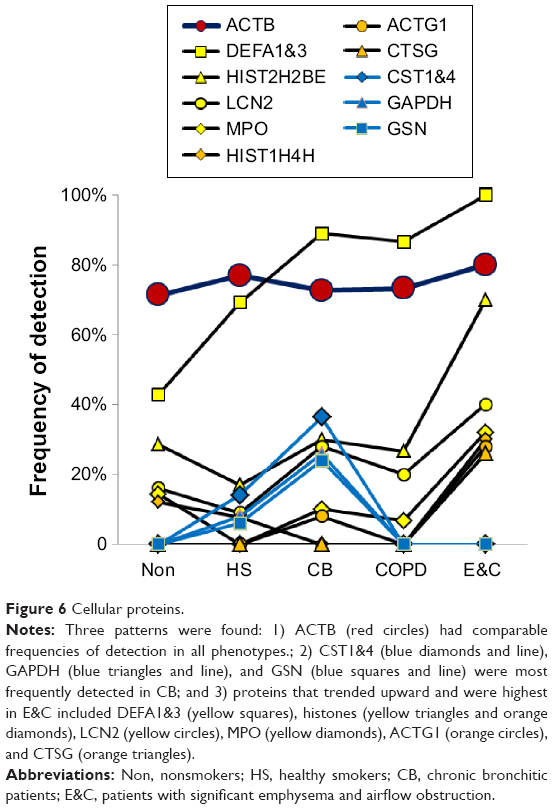 | Figure 6 Cellular proteins. |
Plasma proteins
ALB (P=0.0013) and IGHG1 (P<10−6) were significantly lower in HS and CB compared to the Non, COPD, and E&C groups (Figure 7). This may indicate relatively reduced plasma extravasation in HS and CB. The parallel trends for IGHG1, ALB, and HP in sputum suggested that the bulk of the IgG was synthesized distant from the lung and then delivered by plasma extravasation along with hepatic proteins. In contrast, TF was most frequently detected in HS and CB. This may reflect a need for the antimicrobial, iron-sequestering function of TF.45
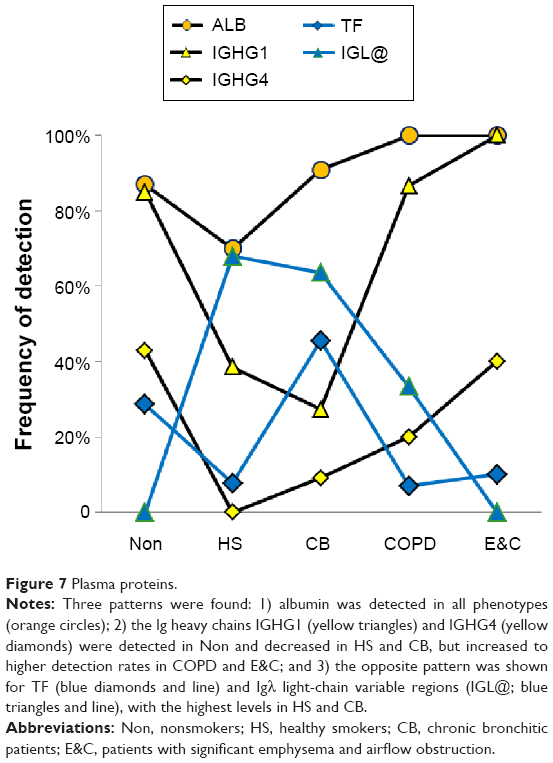 | Figure 7 Plasma proteins. |
Immunoglobulin polypeptides of plasma and mucosal B-cell origin
The precise plasma and mucosal Ig origins of IGHG2, IGHG3, IGHG4, IGHM, κ (IGK) and λ (IGL) light chains, and variable regions of heavy (IGH@) and light (IGK@, IGL@) chains could not be identified.18 Because κ- light chains are translated before λ-chains, the significant elevation of IGL@ in HS and CB suggested extensive B-lymphocyte differentiation in response to chronic microbial infection.
Amylase 1A
AMY1A was present with low counts in 30%–57% of samples. There were no differences between groups indicating equivalent sampling and processing of induced sputum and normalization of peptide and protein abundances. AMY1A mRNA may be expressed in small airway epithelia.38
Correlation analysis
The Non group had highly correlating serous (BPIFB1, LYZ, LTF, SLPI, PIGR) and epithelial (SCGB1A1) proteins (Figure 8), suggesting similar regulation of secretion in healthy airways. Their frequencies of detection were 0.86. Separate positive correlations were found for high-abundance plasma-cell IGJ and IGHA2, and lower-abundance epithelial AZGP1 and PRR4. IGJ was negatively correlated with IGHG1. This was consistent with their distinct origins from airway plasma cells, as opposed to vascular permeability, respectively.
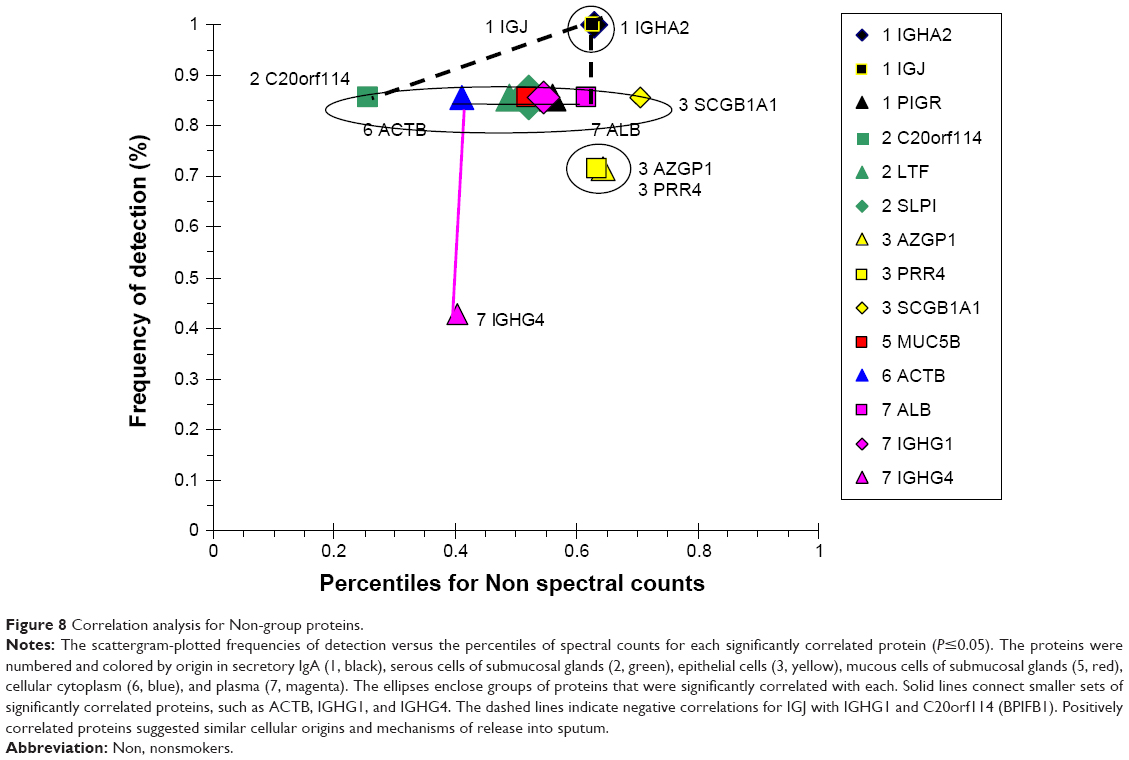 | Figure 8 Correlation analysis for Non-group proteins. |
The HS scattergram showed lower percentiles for sIgA and serous proteins (Figure 9) compared to Non. The sIgA proteins IGHA1, IGHA2, and PIGR were correlated with serous cell LTF, LYZ, and BPIFB1, goblet-cell MUC5AC, and plasma ALB. BPIFB1 was increased by smoking.38 The mucous cell products MUC5B and DMBT1 were positively correlated with epithelial DEFA1&3, but negatively correlated with SCGB1A1. The inverse relationship of MUC5B and SCGB1A1 with smoking was consistent with previous mRNA data.38 AZP1 and PRR4 were absent, suggesting a major change in epithelial protein production compared to Non. Mucous products were relatively increased, and plasma ALB and IGHG1 were decreased compared to Non in these cigarette smokers.
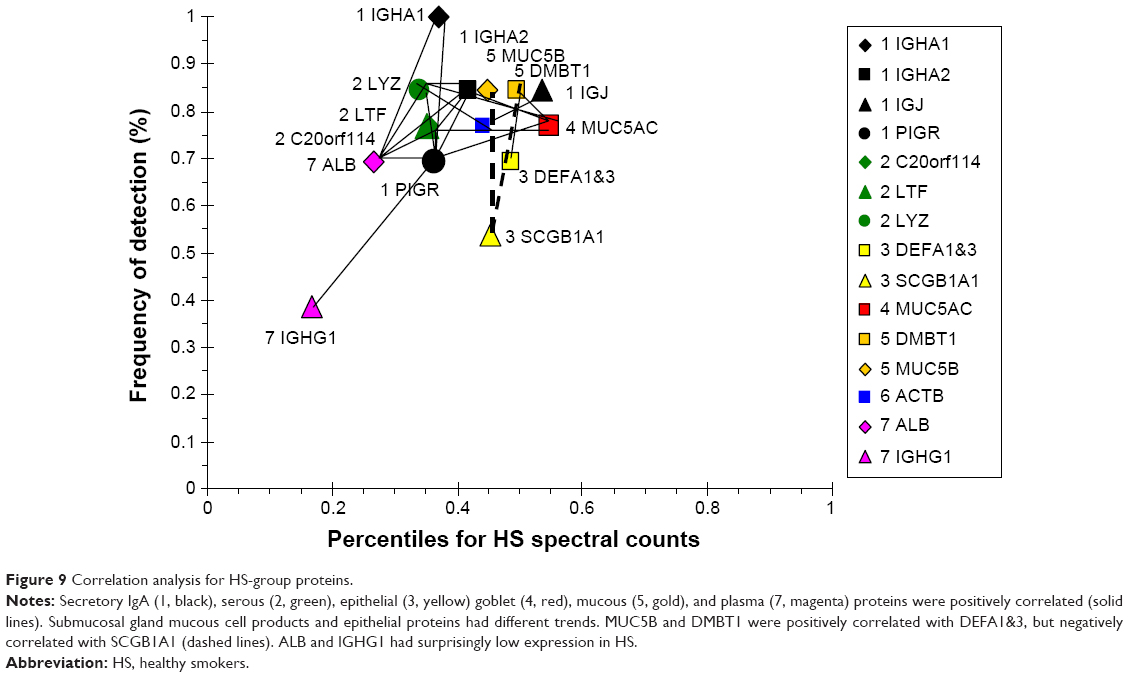 | Figure 9 Correlation analysis for HS-group proteins. |
CB had the highest level of MUC5AC of all of the groups. This was consistent with goblet-cell hyperplasia and mucus hypersecretion. MUC5AC was negatively correlated with LYZ and LTF suggesting inverse effects on goblet and submucosal gland serous cells (Figure 10). MUC5AC had no positive correlations, reinforcing its independent regulation. BPIFB1 was detected in all subjects, but did not correlate with any other major protein. This may indicate BPIFB1 also had independent expression in CB. LTF and LYZ were positively correlated with a network of sIgA, SLPI, mucous (MUC5B, DMBT1), and ALB proteins. In contrast, LTF and LYZ were negatively correlated with a set of relatively low-abundance but highly intercorrelated cellular proteins: GAPDH, GSN, HIST2H2BE, LCN2, and S100A8. Presumably, the low-abundance proteins were not derived from serous cells. The plasma proteins ALB, TF, and IGHG1 were correlated as a separate group, suggesting shared vascular extravasation.
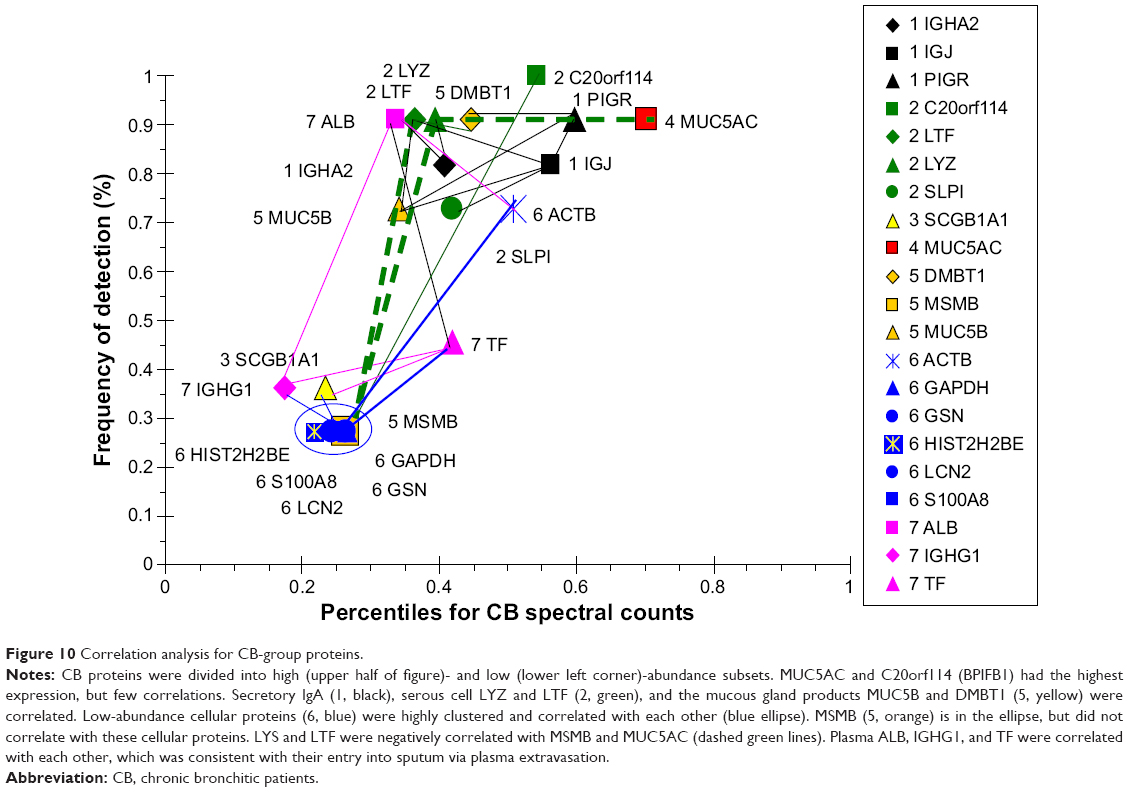 | Figure 10 Correlation analysis for CB-group proteins. |
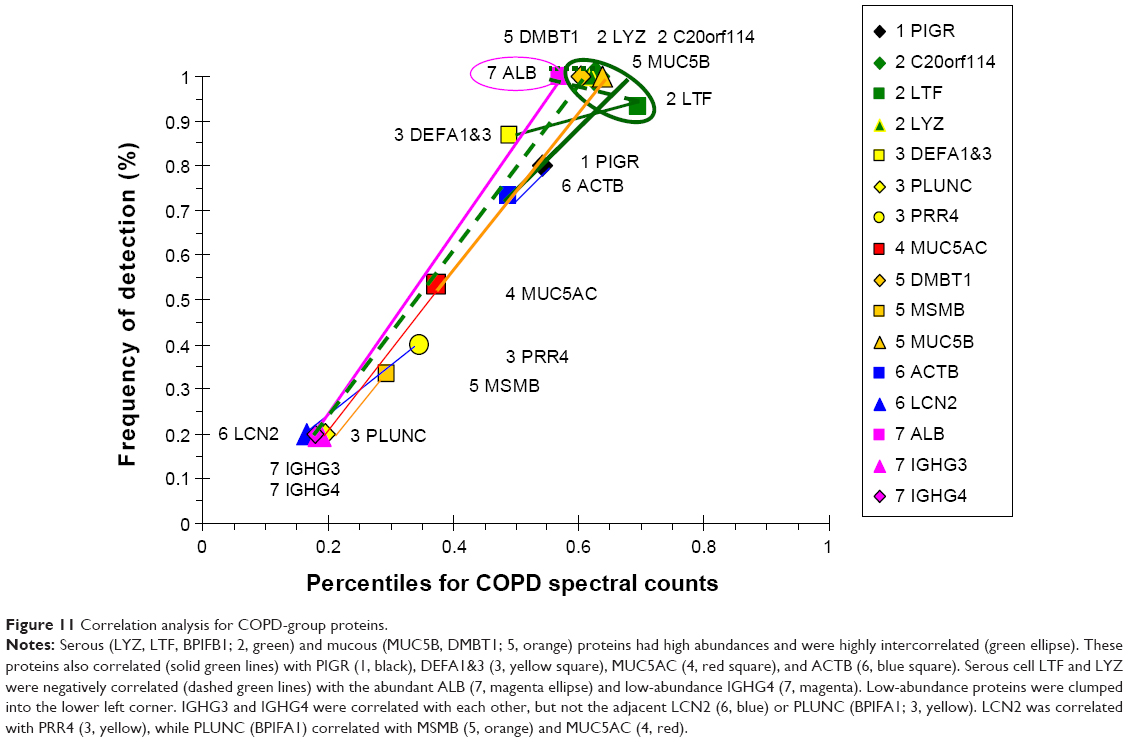
COPD proteins were clustered as high- and low-abundance proteins arranged along a single narrow axis of expression with no outliers (Figure 11). The intercorrelated high-abundance set consisted of serous cell LYZ, LTF, and BPIFB1, and mucous MUC5B and DMBT1. These correlated with lower-abundance PIGR, ACTB, and MUC5AC. LYZ and LTF were negatively correlated with the plasma proteins ALB and IGHG4, suggesting glandular secretion was relatively more important than vascular permeability as a source of sputum proteins at the time of onset and progression of airway obstruction and COPD. Correlations for the lower-abundance secretory proteins included LCN2 with PRR4, and BPIFA1 with MSMB and MUC5AC. mRNA for BPIFA1 and MSMB were significantly increased in bronchial brushings from smokers compared to nonsmokers.38 These relationships suggested that glandular exocytosis predominated in the COPD group and was differently regulated from vascular exudation and epithelial exocytosis.
 | Figure 11 Correlation analysis for COPD-group proteins. |
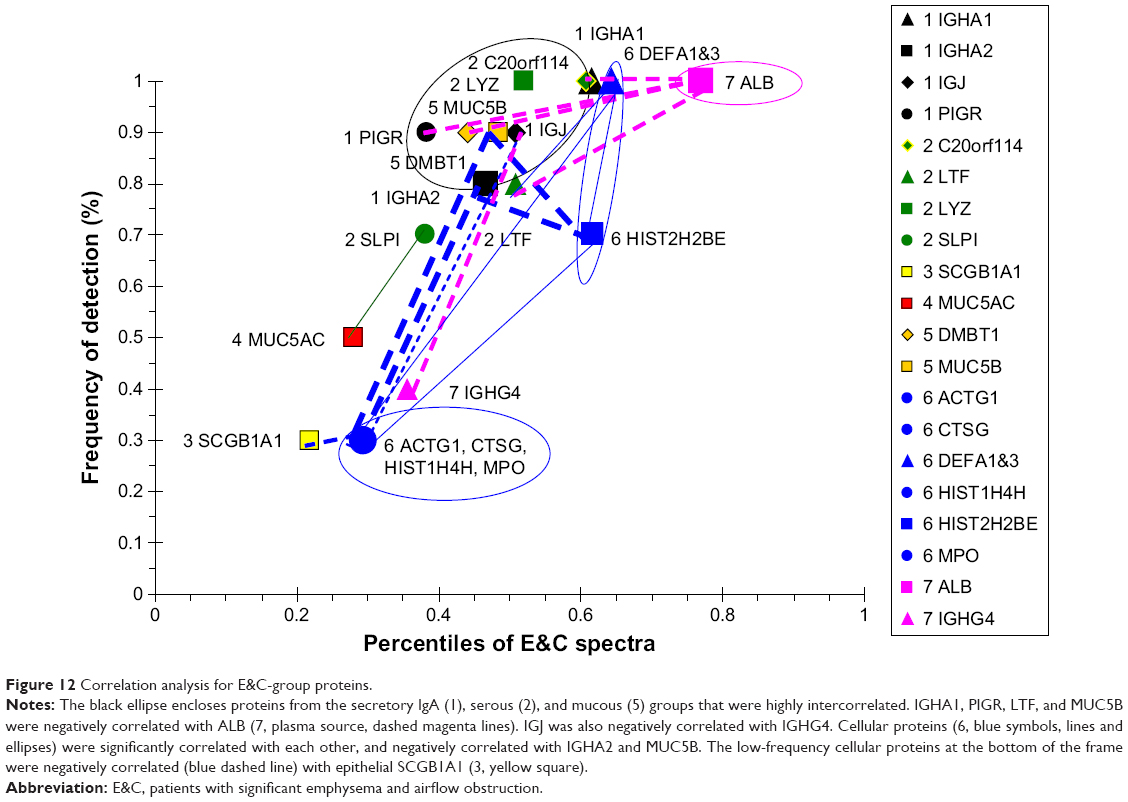
The E&C group had a unique set of correlated proteins that were distinct from the COPD group (Figure 12). IGHA1, PIGR, LTF, and MUC5B were negatively correlated with ALB. IGJ was negatively correlated with IGHG4. This suggested that sIgA formation and submucosal gland serous and mucous cell secretion were inversely related to vascular permeability in emphysema. ALB percentile count and frequency of detection were higher than tracheobronchial glandular proteins in E&C. The inverse correlation may indicate an inverse relationship between bronchoalveolar vascular permeability and tracheobronchial glandular secretion. Cellular proteins were highly correlated with one another. Unlike the other four phenotypic groups, DEFA1&3 were correlated with cellular MPO, CTSG, ACTG1, HIST2H2BE, and HIST1H4H, but not epithelial proteins, such as SCGB1A1. This raised the hypothesis that DEFA1&3 were predominantly neutrophil products in E&C. Although neutrophil counts were equivalent for E&C (21.2×10³ cells/mg; 13.2 and 23.8) and COPD (13.3×10³ cells/mg; 9.0 and 21.1; median [interquartile range]; Mann–Whitney U-test),5 their mechanisms of activation may have been distinct, with viable neutrophils in COPD but NET formation and neutrophil disintegration in E&C.10–12
 | Figure 12 Correlation analysis for E&C-group proteins. |
Cytoscape network analysis
Non had three separate protein networks. First was an extended grouping of serous cell LYZ, LTF, PIGR, and SLPI with epithelial SCGB1A1 (Figure 13). The linker genes ETS1 and NFKB1 were introduced by Cytoscape and STRING based on text-mined data. ETSB1 interacted with LYZ and LTF. NKFB1 has homeostatic functions for PIGR expression and B-lymphocyte antibody synthesis. LTF was networked to LRP1, then to either LRP2 and SCGB1A1, or via ELANE (ELA2) to SLPI. SLPI was inserted as a linker protein, since it is an inhibitor of ELANE. Because ELANE was not significantly detected in Non sputum, this portion of the network may not be relevant to airways of Non subjects. In the second network, AZGP1 was a central hub associated with USP53, PIP, ITGAV, and B2M. The third independent network consisted of the secreted antimicrobial proteins PRR4 and MUC7. These maps infer a central role for ETS1 in maintaining glandular serous and epithelial Clara-cell secretion as predominant pathways for innate immune defense in the airway.
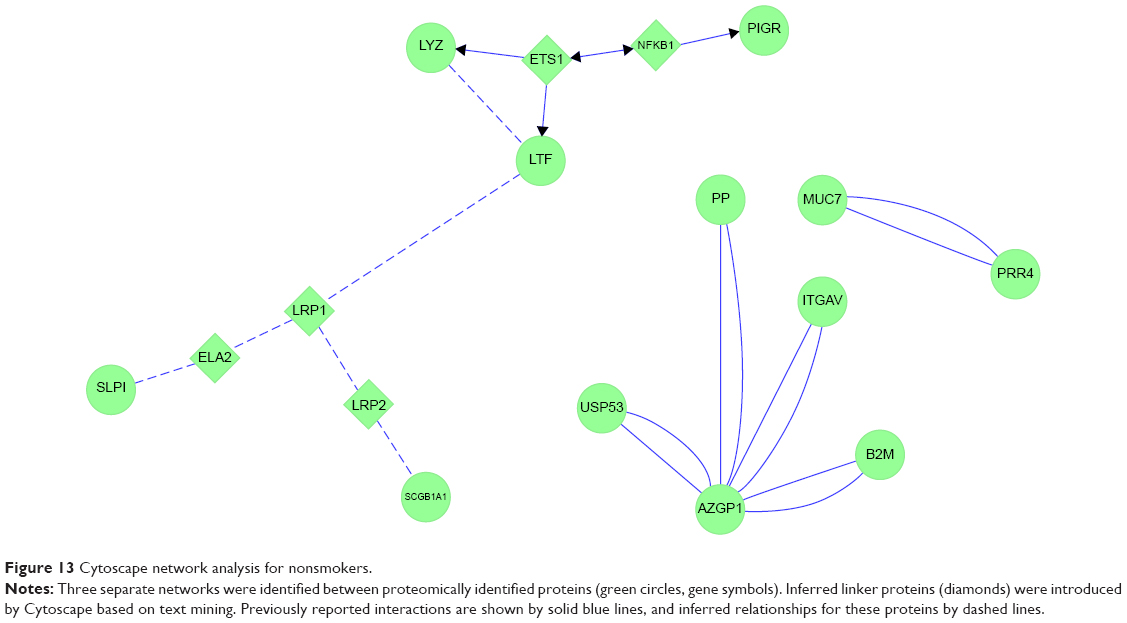 | Figure 13 Cytoscape network analysis for nonsmokers. |
HS showed the impact of cigarette smoking. The exocytosed goblet-cell protein MUC5AC and serous cell LTF, LYZ, SPLI, and PIGR were linked to SP1, SP3, and USF2 transcription factors (Figure 14). These were not among the top 30 transcription factors found using small airway brushings,38 suggesting that they were expressed by epithelial cells in large-diameter bronchi and submucosal gland serous cells, but not smaller-diameter bronchial Clara cells. USF2 regulates epithelial and glandular cell protein expression, and may be an early marker of bronchial dysplasia.46
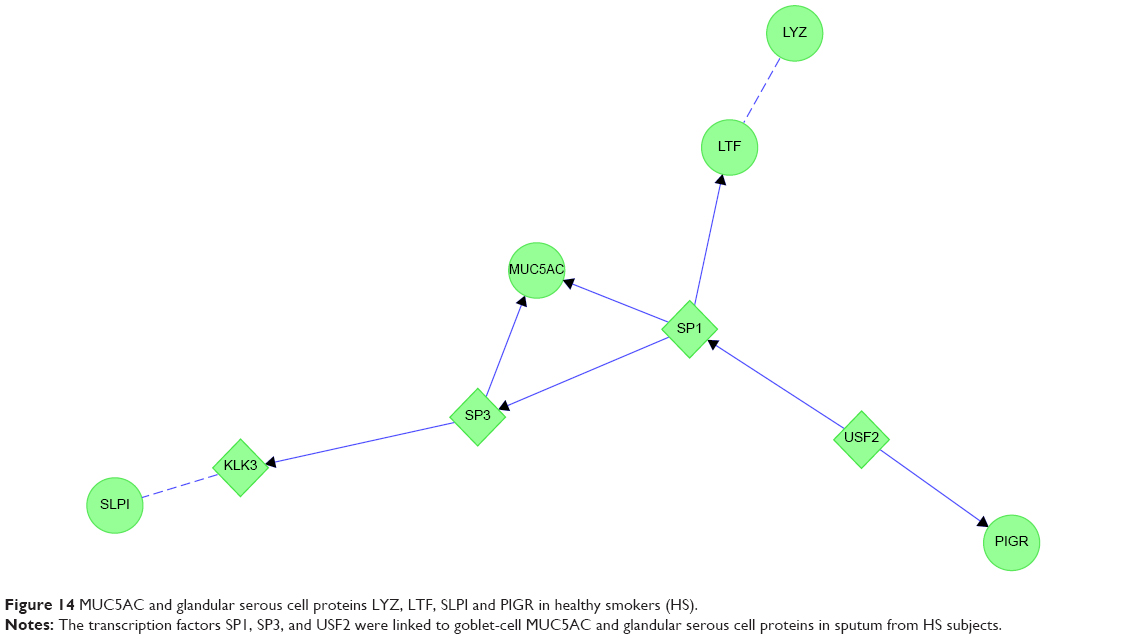 | Figure 14 MUC5AC and glandular serous cell proteins LYZ, LTF, SLPI and PIGR in healthy smokers (HS). |
CB generated two complex protein networks (Figure 15). The first was centered on hubs of GAPDH, GSN, and S100A8. GAPDH was clustered with other glycolysis proteins and MYC. GAPDH was linked to GSN through APP. GSN was associated with CASP3 and phosphatidylinositol metabolism. These interactions may have been related to GSN’s actin-capping role with ACTB. ACTB was also linked to GAPDH, and through MMP9 to LCN2. The distal tail of this map had tenuous links through BAX and TP53 to S100A8 and histones. MYC, TP53, and GSN provided a logical link between smoking, glandular hypersecretion, reactive oxidant species-mediated chromosomal damage, defective DNA repair, and carcinogenesis.
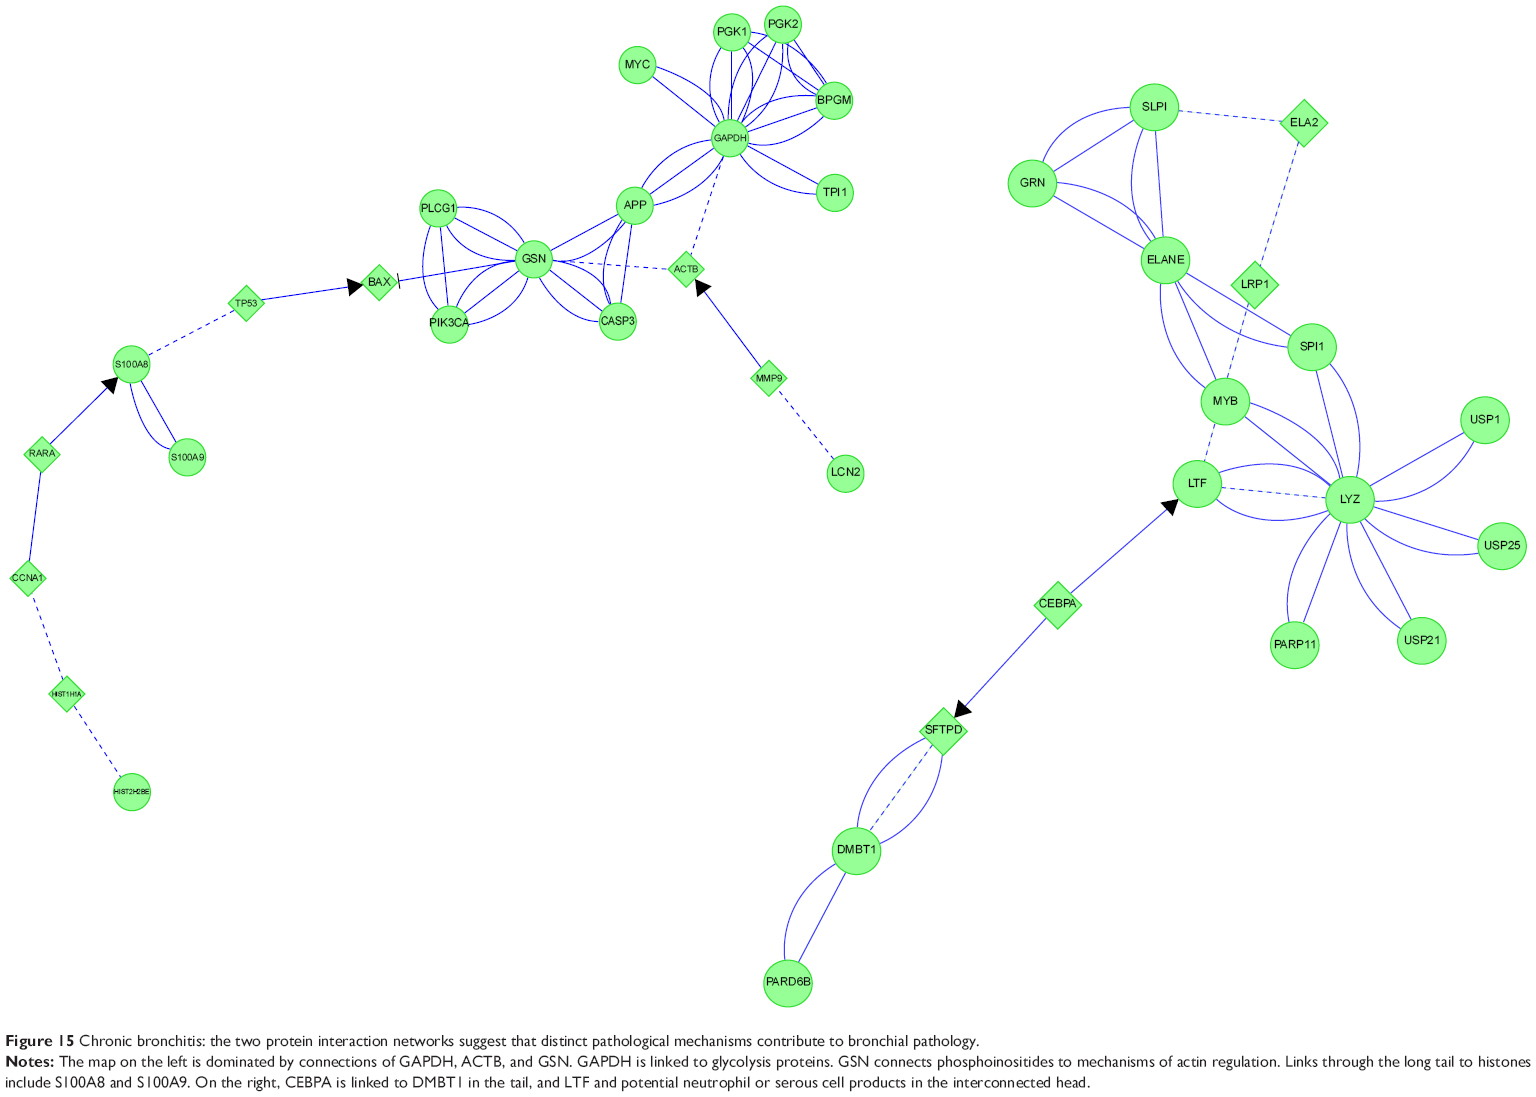 | Figure 15 Chronic bronchitis: the two protein interaction networks suggest that distinct pathological mechanisms contribute to bronchial pathology. |
CEBPA is integral to cell-cycle regulation,47,48 and was linked to two sets of proteins. CEBPA was linked through LTF to LYZ and SLPI, which initially suggested serous cell modulation. However, the interconnections included LTF, ELANE, SLPI, and LRP1, which may be neutrophil products in CB. In the opposite direction, CEBPA was linked through a tail to DMBT1. CEPBA mRNA was highly expressed in small airway epithelial brushings,38 Clara cells, type II alveolar cells, and alveolar macrophages. CEPBA is required for airway extracellular matrix repair and remodeling. One outcome of this network-interaction analysis is to hypothesize that small-molecule modulators of CEBPA may be beneficial for CB treatment. However, this will require further testing, since CEBPA may act as a lung-tumor suppressor.
MYB regulates enzymes of aerobic glycolysis, chaperone expression in unfolded protein responses, and serous and neutrophil granule innate immune proteins.49 Aerobic glycolysis is relevant to phagocytosis and reactive oxidant production by viable neutrophils in CB.
The COPD proteome formed a highly linked protein network (Figure 16). The transcription factors ETS1, CEBPA, SP1, and NFKB1 formed a central interactive core. CEBPA was again linked to mucous cell DMBT1 and MSMB. SP1 was linked to goblet-cell MUC5AC. SP1, CEBPA, and ETS1 were connected to serous cell LTF and LYZ, and played roles in modulation of extracellular matrix components for bronchial repair and metastasis.50 As suggested by its origin as a B-lymphocyte transcription factor, NFKB1 regulated serous cell PIGR and IGHA1 and IGHA2 expression.
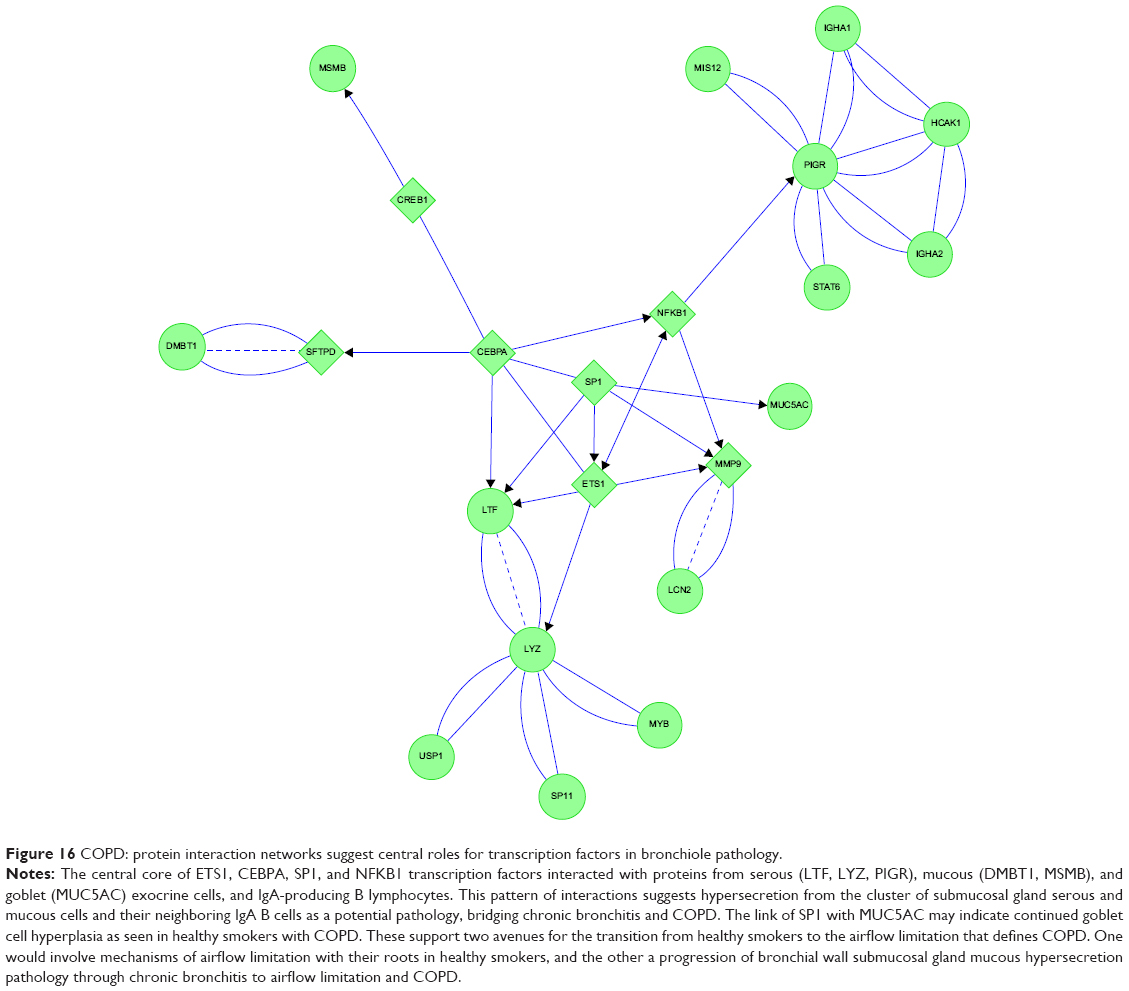 | Figure 16 COPD: protein interaction networks suggest central roles for transcription factors in bronchiole pathology. |
E&C had four connected features (Figure 17). ITGAM and MMP2 were central links. ITGAM is a component of the macrophage MAC-1/CR3 receptor. ITGAM was linked through PRTN3 to CTSG. CTSG was closely connected to F2R, IGFBP3, other coagulation proteins, and their protease inhibitor SERPINB13. ITGAM was also linked directly to MPO. ITGAM and MMP2 shared linkages to ACTG and its cluster of actin-sequestering proteins. The opposite limb from ITGAM projected through MMP2 to CEBPA, which was coupled separately to DEF1&3 and histones. These interactions implicated CEBPA, neutrophil cytokinesis, protease activation, and innate immune aspects of complement, coagulation, and NET pathways in emphysema.
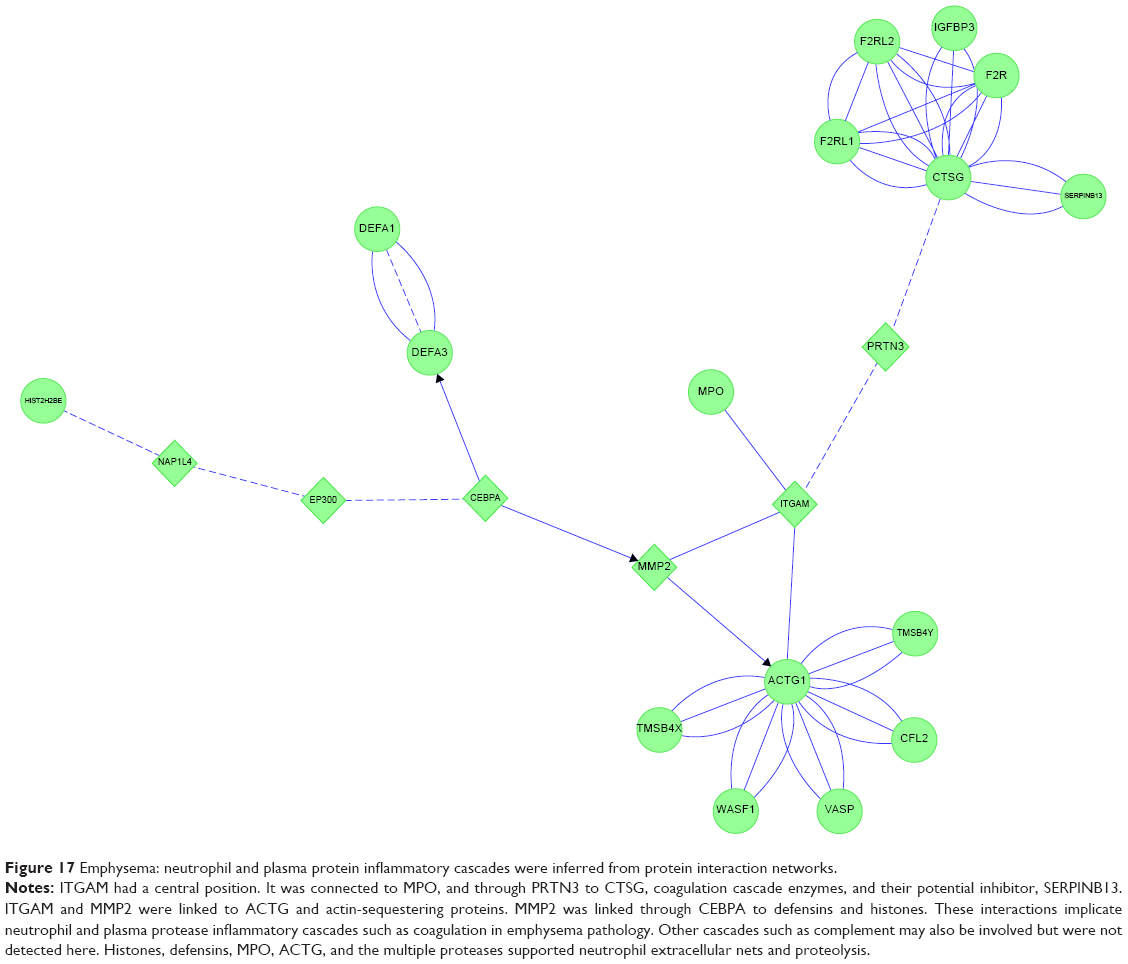 | Figure 17 Emphysema: neutrophil and plasma protein inflammatory cascades were inferred from protein interaction networks. |
Discussion
Each of the smoker and healthy subject phenotypes had unique patterns of proteins in their induced sputum specimens. This suggests that distinct pathophysiological processes were associated with smoking, mucus hypersecretion, airflow obstruction, and emphysema (Figure 18). For example, AZGP1 may be a marker for the healthy epithelium of nonsmokers that is inhibited by cigarette-smoke components. Serous cell BPIFB1 had comparable frequencies of detection in each group, but Non had the lowest spectral counts. The higher levels of this glandular protein in sputum from smokers suggest BPIFB1 may be a marker of cigarette smoking and progressive small airway damage, leading to damage of the lower tracheobronchial tree and alveoli. The detection of SCGB1A4 in Non and increased levels of BPIFB1, BPIFA1, MUC5B, MSMB, and GSN were consistent with high-throughput RNA-sequencing results from bronchial brushings of smokers compared to nonsmokers.38
 | Figure 18 Sputum proteome-derived approach to cigarette smoke-induced lung diseases. |
Goblet-cell MUC5AC hypersecretion was the predominant source of mucins in CB.9,43 Half of smokers may develop CB.1,2 Genetic risk-factor analysis for CB may be beneficial by selecting phenotypes of smokers with and without sputum MUC5AC hypersecretion. Goblet-cell hypersecretion may represent a separate pathophysiological pathway that is not related to the small airway destruction, increased vascular permeability, and decreased airflow (FEV1) found in COPD and E&C. Separation of emphysema from other COPD subjects may also help focus genotypic analyses of these phenotypes.51 Differences between Non and CB strongly suggest that smokers without airflow obstruction (HS, CB) should be recognized by international forums so that stage-specific diagnostic and treatment algorithms can be developed to reduce smoking and mechanisms of mucus hypersecretion.15 Involvement of MYC may provide insights into origins of lung cancer in CB without the airflow limitation required for classification as COPD. In addition, more focused evaluations of the pathophysiologically distinct E&C group are warranted.
Phenotypic changes in vascular permeability were inferred from IGHG1 and other plasma protein results. IGHG1 was detected in 85% of Non, but only approximately half as many HS and CB subjects. This suggested reduced vascular permeability in HS and CB. One consequence may be a relative lack of water in the tenacious sputum of CB. In contrast, IGHG1 was detected in all E&C subjects, suggesting increased plasma flux across damaged capillary–alveolar walls in emphysema.
Only half of COPD expressed IGJ compared to all Non subjects. This suggested a large reduction in endogenous plasma-cell dimeric IgA synthesis as part of the bronchial mucosal injury in COPD. IGJ was more abundant when emphysema was present (E&C).
COPD was the only group to express BPIFA1. This protein may act as a protease inhibitor and regulate epithelial lining fluid volume.52 BPIFA1 may be secreted from neutrophil granules,53 but was not correlated with other neutrophil proteins in COPD.
E&C demonstrated neutrophilic inflammation with NETS containing chromatin, HIST2H2BE, proteases, and other cellular components.10–12 DEFA1&3 were highly correlated with these neutrophilic proteins. This was in contrast to the predominantly epithelial correlates for defensins in the other phenotypes. Elevated BPIFB1, DEFA1&3, and IGHG1 distinguished E&C from Non, HS and CB. This distinct mechanism argues that new, inexpensive, robust tools are needed for widespread screening to identify emphysema, and to spur research into the differential treatment of the E&C group.
Proteomic studies of sputum and lung diseases have been limited by several factors. Comparisons to other proteomic studies are complicated by marked differences in sample sizes, phenotypic definitions,53 comparison groups,39 mucopurulent versus normal sputum,5,39,54,55 bronchoalveolar lavage fluid,56,57 brushings,38 laser dissection of tissue sections,40 and lung tissue.58,59 Studies that rely on pooling specimens from COPD subjects will not show more subtle, phenotype-related differences observed by examining each sample independently. Pooling does not allow for comparisons based on differences between individuals within two groups. The correct matching of peptides to proteins suffers from the redundant entries of the same amino acid sequences into reference-protein databases. Improved protein annotation based on genomic sequences has reduced the number of Ig proteins that may otherwise be designated as hypothetical or unknown proteins. Although specific protein isoforms were often selected in the Mascot peptide–protein matching process, it was not possible to confirm the presence of alternatively spliced or single amino acid replacements from this data set.60 Future analysis of posttranslational modifications will provide information about acetylation, glycosylation, and other regulatory alterations that may affect protein function. Glycosylation and other posttranslational modifications may mask (or expose) trypsin-cleavage motifs and lead to different patterns of tryptic peptides detected by mass spectrometry. Other digestive enzymes are likely to provide complementary peptides, and may identify additional relevant sputum proteins.
Data analysis was facilitated by several methodological adaptations. Gene-symbol abbreviations identified individual proteins and eliminated the redundancies of names, annotations, and multiple identification numbers found in protein databases. Spectral counting was used for nonisotopic evaluation of relative peptide and matching protein abundances.20–22 Correction for the wide range of original total-protein concentrations was required for these reconstituted, lyophilized sputum samples. Logarithmic transformation reduced the impact of outliers with very high values and specimens with absent counts. Conversion of transformed counts to percentiles made it possible to compare the trends for relative yields of high- and low-abundance proteins for all subjects and between the five phenotypic groups. Correlation analysis verified functional and mechanistic relationships between sets of proteins secreted from different types of cells or derived from plasma. Imposing these multiple constraints reduced data dimensionality and improved confidence in the outcomes predicted for nonsmoker, smoker, and chronic destructive airway illness phenotypes.
Several caveats are needed for network analysis by such software as Cytoscape. We did not extend our network analysis beyond one linker. As a result, more tenuous protein–protein and gene–gene interactions and associations were excluded. However, some of these may have been of direct relevance to cigarette-smoking diseases. Programs are updated on regular intervals, but may lag behind publication dates by several months. Despite the lag, we have found that their linkers were generally robust. In separate studies, Cytoscape identified links that were not found by text mining of the PubMed database. Selective manual annotation is critical, since some associations may not be relevant to lung biology. These two approaches are complementary for identifying the most reliable and up-to-date network-interaction patterns.
Current criteria and clinical practice focus on smokers with reduced FEV1 and decrements that may occur following exacerbations of lung disease.15 Elevated serous cell BPIFB1 secretion and vascular permeability (ALB, IGHG1) separated our COPD group from Non, and HS from CB groups, respectively. Verification of these potential biomarkers by measuring concentrations and mRNA expression in sputum, bronchoalveolar lavage fluid, and epithelial biopsies may better define the COPD subgroup of lung-disease patients. We predict that a different set of induced sputum-biomarker proteins including bronchial microbiome proteins and microRNAs will be found in exacerbations. The chronology and magnitude of these proteomic trends may provide insights into the pathophysiology of these acute events, and subsequent chronic declines in pulmonary status.
Results from the E&C phenotype strongly suggest a neutrophilic proteome and inflammatory cascade in CT scan-proven emphysema. The airflow-obstructed smoker groups were discriminated by higher PRR4 in COPD compared to higher IGJ and IGHG1 in E&C. Evidence of more severe inflammation in E&C5 should prompt the development of noninvasive methods to identify and more aggressively treat subjects with significant emphysema (E&C) rather than focus on airflow obstruction alone (COPD).
This proteomic and network analysis suggests a framework for cigarette smoke-induced change in lung proteins, transcription factors, and inflammatory mechanisms. HS showed increased goblet-cell MUC5AC expression that implicated USF2, SP1, and SP3, and a relative decrease in plasma protein extravasation. Approximately half of HS progress to CB. CB had MUC5AC and submucosal gland MUC5B hypersecretion, with a reduction in Clara-cell SCGB1A1. Network analysis implicated MYC, MYB, and CEBPA. Investigation of pathogenic mechanisms in this majority of smokers requires greater attention. In contrast, pathology of the age-dependent 5%–15% of smokers61 who develop recurrent severe exacerbations and progressive airflow obstruction (COPD) has been the focus of close scrutiny and guidelines.62
The COPD sputum proteome implicated submucosal gland hypersecretion, with involvement of CEBPA, SP1, ETS1, MYB, and NFKB. The emphasis on COPD may be related to the widespread use of spirometry for disease grading, while quantification of mucus hypersecretion in CB and the alveolar damage of E&C are still limited in scope and utility. The E&C proteome was remarkable for the increased plasma extravasation and proteins linked to NET formation.10–12 This form of neutrophil death and toxicity was distinct from CB and COPD based on their sputum proteomic profiles. Understanding the dynamic progression of these pathological mechanisms may lead to significantly improved diagnostic tools and treatments of epithelial, glandular, airway-wall, and alveolar inflammation.
Acknowledgments
This study was supported by US Public Health Service Award RO1 ES015382 from the National Institute of Environmental and Health Sciences (NIEHS) (JNB, BC, LP), Department of Defense (DoD) Congressionally Directed Medical Research Program W81XWH-07-1-0618 (JNB), and Strategic Program 2006, Italian Ministry of Health – BPCO (ML, PI). The project was also supported by Grant M01RR-023942-01 from the National Center for Research Resources (NCRR), a component of the National Institutes of Health (NIH). The contents are solely the responsibility of the authors, and do not necessarily represent the official views of the NCRR, NIH, or DoD.
Author contributions
All authors contributed toward data analysis, drafting and revising the paper, and agree to be accountable for all aspects of the work.
Disclosure
The authors report no conflicts of interest in this work.
References
Vestbo J. Chronic mucus hypersecretion, exacerbations and natural history of COPD. Exp Lung Res. 2005;31 Suppl 1:63–65. | ||
Joos GF. Mechanisms of COPD. Exp Lung Res. 2005;31 Suppl 1:66–71. | ||
Omori H, Nakashima R, Otsuka N, et al. Emphysema detected by lung cancer screening with low-dose spiral CT: prevalence, and correlation with smoking habits and pulmonary function in Japanese male subjects. Respirology. 2006;11:205–210. | ||
Nicholas B, Djukanović R. Induced sputum: a window to lung pathology. Biochem Soc Trans. 2009;37:868–872. | ||
Boschetto P, Quintavalle S, Zeni E, et al. Association between markers of emphysema and more severe chronic obstructive pulmonary disease. Thorax. 2006;61:1037–1042. | ||
Luisetti M, Ma S, Iadarola P, et al. Desmosine as a biomarker of elastin degradation in COPD: current status and future directions. Eur Respir J. 2008;32:1146–1157. | ||
Casado B, Iadarola P, Pannell LK, et al. Protein expression in sputum of smokers and chronic obstructive pulmonary disease patients: a pilot study by CapLC-ESI-Q-TOF. J Proteome Res. 2007;6:4615–4623. | ||
National Center for Biotechnology Information. BPIFB1: BPI fold containing family B, member 1 [Homo sapiens (human)]. 2015. Available from: http://www.ncbi.nlm.nih.gov/gene/92747. Accessed May 21, 2015. | ||
Fahy JV, Dickey BF. Airway mucus function and dysfunction. N Engl J Med. 2010;363:2233–2247. | ||
Wartha F, Beiter K, Normark S, Henriques-Normark B. Neutrophil extracellular traps: casting the NET over pathogenesis. Curr Opin Microbiol. 2007;10:52–56. | ||
von Köckritz-Blickwede M, Nizet V. Innate immunity turned inside-out: antimicrobial defense by phagocyte extracellular traps. J Mol Med (Berl). 2009;87:775–783. | ||
Fuchs TA, Abed U, Goosmann C, et al. Novel cell death program leads to neutrophil extracellular traps. J Cell Biol. 2007;176:231–241. | ||
Kaetzel CS. The polymeric immunoglobulin receptor: bridging innate and adaptive immune responses at mucosal surfaces. Immunol Rev. 2005;206:83–99. | ||
Richens JL, Urbanowicz RA, Lunt EA, et al. Systems biology coupled with label-free high-throughput detection as a novel approach for diagnosis of chronic obstructive pulmonary disease. Respir Res. 2009;10:29. | ||
Gold PM. The 2007 GOLD Guidelines: a comprehensive care framework. Respir Care. 2009;54:1040–1049. | ||
Protein Information Resource [homepage on the Internet]. Available from: http://pir.georgetown.edu/. Accessed May 21, 2015. | ||
Huang H, McGarvey PB, Suzek BE, et al. A comprehensive protein-centric ID mapping service for molecular data integration. Bioinformatics. 2011;27:1190–1191. | ||
ImMunoGeneTics [homepage on the Internet]. Available from: http://www.imgt.org. Accessed May 21, 2015. | ||
Li M, Gray W, Zhang H, et al. Comparative shotgun proteomics using spectral count data and quasi-likelihood modeling. J Proteome Res. 2010;9:4295–4305. | ||
Lui H, Sadygov RG, Yates JR 3rd. A model for random sampling and estimation of relative protein abundance in shotgun proteomics. Anal Chem. 2004;76:4193–4201. | ||
Ong SE, Mann M. Mass spectrometry-based proteomics turns quantitative. Nat Chem Biol. 2005;1:252–262. | ||
Washburn MP, Wolters D, Yates JR 3rd. Large-scale analysis of the yeast proteome by multidimensional protein identification technology. Nat Biotechnol. 2001;19:242–247. | ||
Swinscow TD. Statistics at Square One. Oxford, UK: BMJ Books; 1980. | ||
Campbell MJ. Statistics at Square Two: Understanding Modern Statistical Applications in Medicine. London: BMJ Books; 2001. | ||
Barnett V, Lewis T. Outliers in Statistical Data. New York: John Wiley & Sons; 1994. | ||
Smoot ME, Ono K, Ruscheinski J, Wang PL, Ideker T. Cytoscape 2.8: new features for data integration and network visualization. Bioinformatics. 2011;27:431–432. | ||
Shannon P, Markiel A, Ozier O, et al. Cytoscape: a software environment for integrated models of biomolecular interaction networks. Genome Res. 2003;13:2498–2504. | ||
Reactome Wiki. Reactome FI Cytoscape Plugin 4. Available from: http://wiki.reactome.org/index.php/Reactome_FI_Cytoscape_Plugin. Accessed May 21, 2015. | ||
Wu G, Feng X, Stein L. A human functional protein interaction network and its application to cancer data analysis. Genome Biol. 2010;11:R53. | ||
Newman ME. Modularity and community structure in networks. Proc Natl Acad Sci U S A. 2006;103:8577–8582. | ||
STRING [homepage on the Internet]. Available from: http://string-db.org. Accessed May 21, 2015. | ||
Franceschini A, Szklarczyk D, Frankild S, et al. STRING v9.1: protein-protein interaction networks, with increased coverage and integration. Nucleic Acids Res. 2013;41:D808–D815. | ||
KEGG: Kyoto Encyclopedia of Genes and Genomes [homepage on the Internet]. Available from: http://www.genome.jp/kegg. Accessed May 21, 2015. | ||
BioCarta [homepage on the Internet]. Available from: http://www.biocarta.com. Accessed May 21, 2015. | ||
Schaefer CF, Anthony K, Krupa S, et al. PID: the Pathway Interaction Database. Nucleic Acids Res. 2009;37:D674–D679. | ||
Croft D, O’Kelly G, Wu G, et al. Reactome: a database of reactions, pathways and biological processes. Nucleic Acids Res. 2011;39:D691–D697. | ||
Gohy ST, Detry BR, Lecocq M, et al. Polymeric immunoglobulin receptor down-regulation in chronic obstructive pulmonary disease. Persistence in the cultured epithelium and role of transforming growth factor-β. Am J Respir Crit Care Med. 2014;190:509–521. | ||
Hackett NR, Butler MW, Shaykhiev R, et al. RNA-Seq quantification of the human small airway epithelium transcriptome. BMC Genomics. 2012;13:82. | ||
Steiling K, Kadar AY, Bergerat A, et al. Comparison of proteomic and transcriptomic profiles in the bronchial airway epithelium of current and never smokers. PLoS One. 2009;4:e5043. | ||
Vanni H, Kazeros A, Wang R, et al. Cigarette smoking induces overexpression of a fat-depleting gene AZGP1 in the human. Chest. 2009;135:1197–1208. | ||
Boelens MC, van den Berg A, Fehrmann RS, et al. Current smoking-specific gene expression signature in normal bronchial epithelium is enhanced in squamous cell lung cancer. J Pathol. 2009;218:182–191. | ||
Sridhar S, Schembri F, Zeskind J, et al. Smoking-induced gene expression changes in the bronchial airway are reflected in nasal and buccal epithelium. BMC Genomics. 2008;9:259. | ||
Wang G, Xu Z, Wang R, et al. Genes associated with MUC5AC expression in small airway epithelium of human smokers and non-smokers. BMC Med Genomics. 2012;5:21. | ||
Zhang LI, Lee J, Tang H, et al. Impact of smoking cessation on global gene expression in the bronchial epithelium of chronic smokers. Cancer Prev Res. 2008;1:112–118. | ||
Barber MF, Elde NC. Nutritional immunity. Escape from bacterial iron piracy through rapid evolution of transferrin. Science. 2014;346:1362–1366. | ||
Ocejo-Garcia M, Baokbah TA, Ashurst HL, et al. Roles for USF-2 in lung cancer proliferation and bronchial carcinogenesis. J Pathol. 2005;206:151–159. | ||
Sato A, Xu Y, Whitsett JA, Ikegami M. CCAAT/enhancer binding protein-α regulates the protease/antiprotease balance required for bronchiolar epithelium regeneration. Am J Respir Cell Mol Biol. 2012;47:454–463. | ||
Sato A, Yamada N, Ogawa Y, Ikegami M. CCAAT/enhancer-binding protein-α suppresses lung tumor development in mice through the p38α MAP kinase pathway. PLoS One. 2013;8:e57013. | ||
Hibi K, Liu Q, Beaudry GA, et al. Serial analysis of gene expression in non-small cell lung cancer. Cancer Res. 1998;58:5690–5694. | ||
Hong JS, Kim SW, Koo JS. Sp1 up-regulates cAMP-response-element-binding protein expression during retinoic acid-induced mucous differentiation of normal human bronchial epithelial cells. Biochem J. 2008;410:49–61. | ||
Patel BD, Coxson HO, Pillai SG, et al. Airway wall thickening and emphysema show independent familial aggregation in chronic obstructive pulmonary disease. Am J Respir Crit Care Med. 2008;178:500–505. | ||
Garcia-Caballero A, Rasmussen JE, Gaillard E, et al. SPLUNC1 regulates airway surface liquid volume by protecting ENaC from proteolytic cleavage. Proc Natl Acad Sci U S A. 2009;106:11412–11417. | ||
Bartlett JA, Hicks BJ, Schlomann JM, Ramachandran S, Nauseef WM, McCray PB Jr. PLUNC is a secreted product of neutrophil granules. J Leukoc Biol. 2008;83:1201–1206. | ||
Gray RD, MacGregor G, Noble D, et al. Sputum proteomics in inflammatory and suppurative respiratory diseases. Am J Respir Crit Care Med. 2008;178:444–452. | ||
Braido F, Riccio AM, Guerra L, et al. Clara cell 16 protein in COPD sputum: a marker of small airways damage? Respir Med. 2007;101:2119–2124. | ||
Merkel D, Rist W, Seither P, Weith A, Lenter MC. Proteomic study of human bronchoalveolar lavage fluids from smokers with chronic obstructive pulmonary disease by combining surface-enhanced laser desorption/ionization-mass spectrometry profiling with mass spectrometric protein identification. Proteomics. 2005;5:2972–2980. | ||
Sepper R, Prikk K. Proteomics: is it an approach to understand the progression of chronic lung disorders? J Proteome Res. 2004;3:277–281. | ||
Lee EJ, In KH, Kim JH, et al. Proteomic analysis in lung tissue of smokers and COPD patients. Chest. 2009;135:344–352. | ||
Ohlmeier S, Vuolanto M, Toljamo T, et al. Proteomics of human lung tissue identifies surfactant protein A as a marker of chronic obstructive pulmonary disease. J Proteome Res. 2008;7:5125–5132. | ||
Roth MJ, Forbes AJ, Boyne MT 2nd, Kim YB, Robinson DE, Kelleher NL. Precise and parallel characterization of coding polymorphisms, alternative splicing, and modifications in human proteins by mass spectrometry. Mol Cell Proteomics. 2005;4:1002–1008. | ||
Choi SM, Lee J, Park YS, et al. Prevalence and Global Initiative for Chronic Obstructive Lung Disease group distribution of chronic obstructive pulmonary disease detected by preoperative pulmonary function test. PLoS One. 2015;10:e0115787. | ||
Vestbo J, Hurd SS, Agustí AG, et al. Global strategy for the diagnosis, management, and prevention of chronic obstructive pulmonary disease: GOLD executive summary. Am J Respir Crit Care Med. 2013;187:347–365. |
 © 2015 The Author(s). This work is published and licensed by Dove Medical Press Limited. The full terms of this license are available at https://www.dovepress.com/terms.php and incorporate the Creative Commons Attribution - Non Commercial (unported, v3.0) License.
By accessing the work you hereby accept the Terms. Non-commercial uses of the work are permitted without any further permission from Dove Medical Press Limited, provided the work is properly attributed. For permission for commercial use of this work, please see paragraphs 4.2 and 5 of our Terms.
© 2015 The Author(s). This work is published and licensed by Dove Medical Press Limited. The full terms of this license are available at https://www.dovepress.com/terms.php and incorporate the Creative Commons Attribution - Non Commercial (unported, v3.0) License.
By accessing the work you hereby accept the Terms. Non-commercial uses of the work are permitted without any further permission from Dove Medical Press Limited, provided the work is properly attributed. For permission for commercial use of this work, please see paragraphs 4.2 and 5 of our Terms.